

Abstract
Polycystic ovary syndrome (PCOS) is a disorder with endocrinal and metabolic problems in reproductive aged women. Evidence shows that PCOS is in a high prone trend to develop kidney diseases. In this study, we investigated the mediators responsible for PCOS-related kidney injury. We found that tumor necrosis factor (TNF-α) levels were significantly increased in serum and primary cultured granulosa cells (GCs) from PCOS patients. Serum TNF-α levels were positively correlated with serum testosterone and luteinizing hormone (LH)/follicle-stimulating hormone (FSH) ratio, suggesting its positive role in the severity of PCOS. Serum TNF-α levels were also positively correlated with the levels of urinary KapU, LamU, α1‐MU and β2‐MU, the markers for renal tubular cell-derived proteinuria. We established a PCOS mouse model by resection of the right kidney, followed by daily administration of dihydrotestosterone (DHT, 27.5 μg, i.p.) from D7 for 90 days. We found that TNF-α levels were significantly increased in the ovary and serum of the mice, accompanied by increased renal tubular cell apoptosis, inflammation and fibrosis in kidneys. Furthermore, the receptor of TNF-α, tumor necrosis factor receptor 1 (TNFR1), was significantly upregulated in renal tubular cells. We treated human ovarian granulosa-like tumor cells (KGN) with DHT (1 μg/ml) in vitro, the conditioned medium derived from the granulosa cell culture greatly accelerated apoptotic injury in human proximal tubular epithelial cells (HKC-8), which was blocked after knockdown of TNF-α in KGN cells. Furthermore, knockdown of TNFR1 in renal tubular epithelial cells greatly ameliorated cell injury induced by granulosa cell-derived conditioned medium. These results suggest that serum TNF-α plays a key role in mediating inflammation and apoptosis in renal tubular cells associated with PCOS-related kidney injury.
Keywords: polycystic ovary syndrome, kidney injury, TNF-α, TNFR1, apoptosis, inflammation
Introduction
Polycystic ovary syndrome (PCOS) is a disorder with endocrinal and metabolic problems, at a prevalence rate of 5%–10% in reproductive aged women [1, 2]. PCOS is manifested with chronic anovulation, biochemical and/or clinical hyperandrogenism, and polycystic ovarian morphology, according to the 2003 Rotterdam consensus criteria [3]. PCOS is highly related with environmental and genetic factors. Reports show PCOS is intimately related to obesity, dyslipidemia, insulin resistance, metabolic syndrome, and cardiovascular diseases [4–11]. However, the relationship between PCOS and kidney diseases has not been elucidated in detail.
Studies have shown that over 50% of PCOS patients show the increase in premicroalbuminuria [12, 13]. Other reports also show in PCOS animal models, interstitial fibrosis appears in kidney and urinary excretion of kidney injury molecule-1 (KIM-1) is elevated [14], suggesting the high risk for kidney diseases in PCOS. Consistently, our previous study showed that the urinary excretions of KapU, LamU, α1‐MU, and β2‐MU, which represent the proteinuria originated from renal tubular epithelial cell injury, increases in PCOS and has a significant positive correlation with the level of serum testosterone, a marker for PCOS [15]. All these data implicate PCOS is also highly involved in kidney injury. However, the underlying mechanisms of PCOS-related kidney injury are scarcely reported. Although the high level of testosterone is a hall mark of PCOS, but nearly 50% of PCOS patients is non-hyperandrogenic. They show the similar manifestations in metabolic syndrome, insulin resistance, and dyslipidemia [16–20]. Notably, a recent study reported that after 20 years of follow-up in PCOS patients, metabolic abnormalities persistently progressed whereas circulating androgens decreased [21]. This suggests besides androgen, there are other pathogenic factors, which consistently exist, to trigger the associated complications in PCOS. However, this has not been elucidated in detail. Especially, in PCOS-related kidney injury, the mediators have not been refined.
Tumor necrosis factor-alpha (TNF-α), a pleiotropic signaling molecule, is widely expressed in activated macrophages, lymphocytes, fibroblasts and epithelial cells as well as other cell types. Both transmembrane TNF-α (mTNF-α) and soluble TNF-α (sTNF-α) are involved in the inflammatory response by binding to Types 1 and 2 tumor necrosis factor receptors (TNFR1 and R2). Unlike TNFR2, which is restricted to thymic T lymphocytes and endothelial cells, TNFR1 is ubiquitously expressed in almost all cells, and can be activated by both mTNF-α and sTNF-α [22–24]. Of notes, binding of sTNF-α with TNFR1 could effectively trigger classic NF-κB signaling activity, which launches the transcriptions of many different genes including those associated with inflammatory cytokines, cell survival and cell proliferation [25–27].
PCOS is considered a pro-inflammatory state. Reports suggest that women with PCOS have the elevated secretion of certain inflammation-promoting cytokines such as TNF-α, interleukins (IL), and other inflammatory mediators in the serum [28–31]. Furthermore, studies reported that serum TNF-α level was positively correlated with testosterone and insulin resistance. Moreover, TNF-α was involved in apoptosis and anovulation in ovary of PCOS [32–35]. Hence, TNF-α might be one of the most potential risk factors in PCOS. Whether TNF-α is involved in PCOS-associated kidney injury has not been reported.
In our study, we report that serum TNF-α has a significant positive correlation with the disease severity of PCOS and associates renal tubular cell injury-derived proteinuria. In vivo, the expression levels of TNF-α in ovary and serum were higher in PCOS mice, while there was a highly increase in renal tubular cell apoptosis, inflammation and fibrosis. Interestingly, TNFR1 was significantly upregulated in renal tubular cells. In vitro, granulosa cell-derived conditioned medium greatly accelerated renal tubular epithelial cells injury, which was blocked by TNF-α knockdown in ovarian granulosa cells. Furthermore, downregulation of TNFR1 in tubular cells greatly ameliorated granulosa cell-derived renal injury. Hence, our study concludes that serum TNF-α plays a key role in mediating inflammation and apoptosis in renal tubular cells and associates PCOS-related kidney injury.
Materials and methods
Participants
Human serum, urine and GCs were obtained from the center for reproductive medicine in Dongguan Maternal and Child Health Care Hospital. The participants were excluded if they were diagnosed with kidney-related diseases or other diseases. The recruited subjects included 56 patients with PCOS, and 38 age-matched healthy women served as controls. The GCs were obtained from the extract of 56 PCOS patients and 37 control participants. Patients with PCOS were diagnosed according to the Rotterdam Criteria (2003), who met at least two of the following criteria: (1) oligo-ovulation and/or anovulation; (2) polycystic ovaries (PCO) measured by ultrasonography; (3) clinical and/or biochemical signs of hyperandrogenism. The exclusion criteria were congenital adrenal hyperplasia, Cushing syndrome and androgen-secreting tumors. The study was carried out in accordance with the World Medical Association Declaration of Helsinki. All of the studies involving human samples were performed with informed patient consent and were approved by the Ethics Committee of Dongguan Maternal and Child Health Care Hospital, Southern Medical University (LLP-2022-34).
TNF-α enzyme-linked immunosorbent assay
Serum TNF-α levels were measured using a TNF-α ELISA Assay Kit (WELLBIO Biotechnology, Shanghai, China, EH10497M). The expression levels of TNF-α in human serum and cell supernatant were measured according to the procedures outlined by the manufacturer.
Urine collection and analysis
The random urine was collected from 56 patients with PCOS and 38 control subjects before assistant reproductive treatment. The urine samples were centrifuged at 3000 × g for 10 min to collect the supernatants. The urinary creatinine (UCr), urinary albumin to creatinine (UACR), KapU, LamU, α1‐MU, and β2‐MU were determined by an automatic chemistry analyzer (AU480, Beckman Coulter, Pasadena, CA, USA). The value of UACR as well as KapU, LamU, α1‐MU, and β2‐MU were normalized to UCr.
Granulosa cell isolation
The GCs were collected as previously described [15]. The GCs were isolated from follicle fluid (FF) obtained during retrieving oocyte for IVF (In vitro fertilization) from subjects. Briefly, FF was centrifuged at 400 × g for 10 min to collect the cell pellets. The pellets were resuspended in PBS and layered onto a 50% Percoll Reagent (Cytiva, USA, Cat. 17089109), and then centrifuged at 400 × g for 20 min to separate GCs from blood cells. GCs at the middle white layer were collected and washed twice with PBS at 600 × g for 8 min. TRIzol lysis reagent (Life Technologies, Grand Island, NY, USA) was added to the GCs for RNA analysis.
Animal model
Female C57BL/6 mice were purchased from the Southern Medical University Animal Center (Guangzhou, China). At aged 3 weeks, mice were treated with resection of the right kidney. Then on the 7th day, the mice were injected intraperitoneally with dihydrotestosterone (DHT, daily dose, 27.5 μg with 0.2 ml PBS) for 90 days. Control mice were injected with 0.2 ml of PBS. The mice were sacrificed at day 97, and serum, ovary and kidney tissues were collected for various analyses. To determine the stage of the estrous cycle, daily vaginal smears were taken 10 days every morning at 10 a.m. before sacrificed and examined. The animal experiments were approved by the Animal Ethics Committee at the Nanfang Hospital, Southern Medical University, Guangzhou, China (NFYY-2022-1241).
Determination of the estrous cycle stage
Estrous cycle evaluation was performed as described previously [36]. Vaginal secretion was collected by gently inserting a pipette contained 20 μl of normal saline into the vaginal orifice at a depth of ~2 mm in mice. Then the saline flushed into the vagina and back out 3 times. Afterwards, the collected vaginal smears were placed on glass slides, air-dried, and stained with hematoxylin and eosin (H&E). The stages of the estrous cycle were determined based on the predominant cell type in vaginal smears, including neutrophils, cornified cells, and round and nucleated epithelial cells.
DHT enzyme-linked immunosorbent assay
Serum DHT levels were measured by a DHT ELISA Assay Kit (IBL-international, Germany, DB52021). The expression of DHT in mouse serum was measured according to the procedures outlined by the manufacturer.
Ovarian histology
For histological examination of ovarian morphology, one complete ovary was fixed in 4% formaldehyde for 48 h, dehydrated and embedded in paraffin. The ovaries were longitudinally and serially sectioned at 5 μm, and then every 8th section was mounted on a glass side for staining with H&E. The number of the cystic follicles per ovary was counted at ×40 magnification. The ratio of granulosa cell to theca cell layers in the largest follicle was measured in ImageJ (v1.8.0).
Immunohistochemistry
Paraffin kidney sections (4 μm) were stained with Masson Staining kit (Baso, Cat. BA4079B, USA) according to the instruction. Immunohistochemical staining was performed with 3 μm ovary or kidney sections using a routine protocol. All antibodies used were as follows: anti-Caspase-3 (Cell Signaling Technology, Cat. #9662S), anti-TNF-α (Abcam, Cat. Ab9739), anti-KIM-1 (Boster Biotechnology, Cat. BA3537), anti‐Fibronectin (Sigma, Cat. F3648), anti-TNFR1 (Proteintech, Cat. Ab5648), anti-p65 (Cell Signaling Technology, Cat. #4764S). Quantification of the images was carried out by ImageJ (v1.8.0).
Western blot analysis
Western blot analysis was performed as described previously [37]. In brief, tissues and cells were homogenized in lysis buffer containing protease inhibitors. Proteins were separated by SDS-PAGE electrophoresis and then transferred onto PVDF membranes (Millipore, CA, USA). The membranes were incubated with primary antibodies overnight at 4 °C and a secondary horseradish peroxidase-conjugated antibody for 1 h at room temperature. The antigen-antibody complexes were visualized with ECL kit (Applygen, Beijing, China). The following primary antibodies were used: anti-Bax (Santa Cruz, Cat. sc-7480), anti-Bcl-2 (Cell Signaling Technology, Cat. #15071S), anti-Caspase3 (Cell Signaling Technology, Cat. #9662S), anti-TNF-α (Abcam, Cat. Ab9739), anti-GAPDH (Beijing Ray Antibody Biotech, Cat. RM2002), anti-p-p65 (Cell Signaling Technology, Cat. #3033S), anti-p65 (Cell Signaling Technology, Cat. #4764S), anti-PARP (Cell Signaling Technology, Cat. #9542S), anti-Fibronectin (Sigma, Cat. F3648), anti-Vimentin (Cell Signaling Technology, Cat. #5741S), anti-α-SMA (Abcam, Cat. Ab5648), anti-α-Tubulin (Beijing Ray Antibody Biotech, Cat. RM2007), anti-TNFR1 (Proteintech, Cat. Ab5648), anti-FasL (Santa Cruz, Cat. sc-19681), anti-KIM-1 (Boster Biotechnology, Cat. BA3537), anti-E-cadherin (Cell Signaling Technology, Cat. #3195S), anti-Collagen I (Boster Biotechnology, Cat. BA0325), anti-β-actin (Beijing Ray Antibody Biotech, Cat. RM2001).
Real-time PCR
Total RNA from tissues and cells were isolated by using TRIzol RNA isolation system (Invitrogen, Carlsbad, CA, USA) according to the manufacturer’s instructions. The cDNA was synthesized by using HiScript III RT SuperMix for qPCR (+gDNA wiper) (Vazyme, Nanjing, China), and qRT-PCR was carried out with the ABI PRISM 7000 Sequence Detection System (Applied Biosystems, Foster City, CA, USA) and using ChamQ SYBR qPCR Master Mix (High ROX Premixed) (Vazyme, Nanjing, China). After initial denaturing at 95 °C for 30 s, the amplification protocol consisted of 40 cycles of denaturing at 95 °C for 10 s, annealing and extension at 60 °C for 30 s. The sequences of the primer pairs used in qRT-PCR were shown in Supplementary Table S1.
TUNEL assays
Frozen kidney sections (3 μm) or the cover slides of cells were detected by terminal deoxynucleotidyl transferase-mediated dUTP nick-end labeling (TUNEL) staining (Promega, Cat. G3250) for apoptotic cells according to the manufacturer’s instructions.
Transcriptomic analysis
For Gene Set Enrichment Analysis (GSEA), all involved gene from RNA-seq were performed using the Molecular Signatures Database of GSEA web interface. Transcriptomic data produced are available at NCBI with accession number GSE229106.
Cell culture and treatment
Human ovarian granulosa-like tumor cells (KGN) were obtained from EK Bioscience (Shanghai, China). KGN cells were cultured in DMEM/F12 medium (Biological Industries) supplemented with 5% calf serum (Biological Industries). Serum-starved KGN cells were stimulated by DHT at varying dosages. KGN cells were treated with 1 μg/ml of DHT for 6 h, followed by incubation in serum-free medium. In some experiments, KGN cells were transfected with TNF-α siRNA using Lipofectamine 2000 reagent (Invitrogen, Grand Island, NY, USA), and then treated with DHT for 6 h. Human proximal tubular epithelial cells (HKC‐8) were provided by Dr. Lorraine C. Racusen (Johns Hopkins University, Baltimore, MD, USA), and were cultured as described previously [38]. HKC‐8 cells were treated with conditioned medium from KGN cells with or without transfection of TNF-α siRNA. For some experiments, HKC-8 cells were transfected with TNFR1-siRNA, prior to the treatment with conditioned medium from KGN cells with DHT. Human TNF-α siRNA sequence was 5′-CCUGGUAUGAGCCCAUCUATT-3′. Human TNFR1-siRNA sequence was 5′-GCCUGGAGUGCACGAAGUUTT-3′.
Immunofluorescence staining
Immunofluorescence staining was performed as described previously [37]. HKC-8 cells cultured on coverslips were fixed with 4% paraformaldehyde for 15 min at room temperature, followed by blocking with 10% donkey serum for 1 h. All primary antibodies used were as follows: anti-TNFR1 (Proteintech, Cat. Ab5648), anti‐Fibronectin (Sigma, Cat. F3648), anti-Cleaved caspase-3 (Cell Signaling Technology, Cat. #9664S). Then the slides were incubated with Cy3-conjugated donkey anti-rabbit IgG (Jackson Immuno-Research Laboratories, West Grove, PA, USA) and Cy2-conjugated donkey anti-mouse IgG for 1 h. Nuclei were stained with DAPI (Beyotime, Cat. C1006) for 15 min. Images were viewed with confocal microscopy (Leica TCS SP2 AOBS, Leica Microsystems, Buffalo Grove, IL, USA).
Statistical analysis
All data were calculated as mean ± standard error of the mean (SEM). Statistical analyses were performed by SPSS 22.0 (SPSS Inc, Chicago, IL, USA). Comparisons were analyzed by Unpaired t‐test comparing two groups, or one‐way analysis of variance followed by the Least Significant Difference or Dunnett’s T3 procedure comparing more than two groups. Spearman rank correlation analysis was used to perform the bivariate correlation analysis. The value of P < 0.05 was considered statistically significant.
Results
Participant characteristics
The primary analysis included 94 individuals aged 22–39 years, including 56 cases of PCOS and 38 controls. Among 56 cases of PCOS, 17 were diagnosed with hyperandrogenemia (serum testosterone >0.481 ng/ml). The demographic and clinical data of the patients are presented in Supplementary Table S2. Comparison of clinical characteristics between PCOS and control groups is shown in Table 1. In PCOS group, the length of menstrual cycle, number of total antral follicles (No. of AFC-Total), basal levels of luteinizing hormone (LH), LH/FSH (Follicle-stimulating hormone), estradiol (E2), and testosterone (T) were significantly higher compared to controls. Whereas, the basal levels of FSH and PRL (Prolactin) did not reach statistical significance between two groups.
Table 1.
Clinical characteristics of participants.
| Characteristic | PCOS (n = 38) | Control (n = 56) | P value |
|---|---|---|---|
| Age (year) | 29.59 ± 0.47 | 30.61 ± 0.68 | 0.204 |
| Menstrual cycle (day) | 83.73 ± 7.95 | 30.29 ± 0.40 | 0.000*** |
| No. of AFC-Total | 26.29 ± 0.73 | 14.29 ± 0.55 | 0.000*** |
| Basal FSH (mIU/ml) | 6.58 ± 0.23 | 6.69 ± 0.23 | 0.747 |
| Basal LH (mIU/ml) | 11.58 ± 0.89 | 5.09 ± 0.31 | 0.000*** |
| LH/FSH | 1.84 ± 0.16 | 0.78 ± 0.05 | 0.000*** |
| Basal E2 (pg/ml) | 46.76 ± 3.92 | 35.33 ± 2.80 | 0.034* |
| Basal T (ng/ml) | 0.42 ± 0.02 | 0.23 ± 0.01 | 0.000*** |
| Basal PRL (ng/ml) | 20.50 ± 2.68 | 18.28 ± 1.12 | 0.446 |
Continuous variables are expressed as the mean ± SEM.
PCOS polycystic ovary syndrome, No. of AFC-Total number of total antral follicles with a diameter from 2 to 9 mm both in the left and right ovary, FSH follicle-stimulating hormone, LH luteinizing hormone, E2 estradiol, T testosterone, PRL prolactin.
*P < 0.05; ***P < 0.001.
Serum TNF-α is correlated with the severity of PCOS and associated with tubular injury in PCOS
Human serum and urine samples were obtained from 56 PCOS patients and 38 controls (Fig. 1a). PCOS patients show more hyperandrogenemia symptoms and the increase in LH/FSH ratio. As shown in Fig. 1b, c, the levels of T and LH/FSH ratio were greatly elevated in the serum of patients with PCOS, but not in control subjects. As TNF-α is a secreted protein, we further assessed its expression in the serum from PCOS patients using a specific ELISA kit. Notably, serum TNF-α levels were significantly elevated in patients with PCOS compared to control subjects (Fig. 1d). Moreover, there was no significant difference between PCOS patients with or without hyperandrogenemia (Supplementary Fig. S1a). To identify the role of serum TNF-α in PCOS, we performed Spearman’s correlation analysis in two groups. As shown in Fig. 1e, f, serum TNF-α levels were positively correlated with serum T and LH/FSH ratio in patients with PCOS, but not in control subjects. These results confirmed serum TNF-α plays a critical role in PCOS progression.
Fig. 1. Serum TNF-α is correlated with the severity of PCOS and associated with tubular injury in PCOS.

a Diagram by Figdraw shows the experimental design. n = 56 in PCOS group, n = 38 in control group. b Serum T levels in PCOS and controls. c LH/FSH ratio in PCOS and controls. d Serum TNF-α levels in PCOS and controls. e Correlation between Serum TNF-α and T in PCOS and controls. f Correlation between Serum TNF-α and LH/FSH ratio in PCOS and controls. g SCr levels in PCOS and controls. h BUN levels in PCOS and controls. i UACR levels in PCOS and controls. j Correlation between Serum TNF-α and urinary KapU in PCOS and controls. k Correlation between Serum TNF-α and urinary LamU in PCOS and controls. l Correlation between Serum TNF-α and urinary α1‐MU in PCOS and controls. m Correlation between Serum TNF-α and urinary β2-MU in PCOS and controls. *P < 0.05, **P < 0.01 and ***P < 0.001 versus control subjects (n = 56 in PCOS group, n = 38 in control group).
Previous studies have shown that PCOS links to kidney injury. To assess the correlation between PCOS and kidney injury, we examined the levels of serum creatinine (SCr), urea nitrogen (BUN), and proteinuria in all subjects. The detailed data are presented in Supplementary Table S3. As shown in Supplementary Table S3 and Fig. 1g–i, the levels of SCr, BUN and UACR in PCOS group were all significantly increased compared to control subjects. However, we found that serum TNF-α levels had no correlation with SCr and BUN (Supplementary Fig. S1b, c). Although a rising trend for urinary KapU, LamU, α1‐MU, and β2-MU were shown in PCOS group, there was no statistical significance between the two groups (Supplementary Table S3). To further test the significant role of serum TNF-α in PCOS-related kidney injury, we performed Spearman’s correlation analysis in two groups. Notably, serum TNF-α level was positively correlated with urinary KapU, LamU, α1‐MU, and β2-MU in patients with PCOS (Fig. 1j–m). All these results suggest serum TNF-α is highly involved in kidney injury, especially renal tubular injury associated with PCOS.
TNF-α is correlated with the severity of PCOS in primary cultured GCs
To further determine the role of TNF-α in PCOS, we next cultured primary GCs obtained from the extract of 56 PCOS and 37 controls. The experimental design is presented in Fig. 2a. The demographic and clinical data of these subjects are presented in Supplementary Table S4. As shown in Supplementary Table S5 and Fig. 2b, c, the length of menstrual cycle, No. of AFC-Total, basal levels of LH, LH/FSH ratio, and T were significant higher in PCOS compared to controls. Whereas, the basal levels of FSH, E2, and P (Progesterone) did not reach statistical significance between two groups. We next tested the mRNA levels of TNF-α in GCs of PCOS and controls. Notably, TNF-α mRNA level is upregulated in GCs of PCOS (Fig. 2d). Furthermore, TNF-α mRNA levels of GCs were positively correlated with serum T and LH/FSH ratio in patients with PCOS, but not in control subjects (Fig. 2e, f). These results further suggest TNF-α derived from GCs plays a critical role in PCOS progression.
Fig. 2. TNF-α is correlated with the severity of PCOS in primary cultured GCs.

a Diagram by Figdraw shows the experimental design. b Serum T levels in PCOS and controls. c LH/FSH ratio in PCOS and controls. d TNF-α mRNA levels in GCs of PCOS and controls. e Correlation between TNF-α mRNA level and T in GCs of PCOS and controls. f Correlation between TNF-α mRNA level and LH/FSH ratio in GCs of PCOS and controls. *P < 0.05, **P < 0.01 and ***P < 0.001 versus control subjects (n = 56 in PCOS group, n = 37 in control group).
TNF-α is upregulated in the mouse model of PCOS
To clarify the role of TNF-α in PCOS-related kidney injury, we constructed PCOS mice by intraperitoneal injection of DHT. The experimental design is presented in Fig. 3a. As shown in Fig. 3b, c, cytological examination of smears from individual mice was used to stage the estrous cycle during 10 days. Mice in control group had a regular estrous cycle of 4 day, whereas DHT-treated mice were in anoestrum, suggesting that they were acyclic. Serum DHT levels in DHT-treated mice were significantly increased compared to controls (Fig. 3d). As shown in Fig. 3e–g, the H&E staining of ovaries in DHT-treated mice revealed more large cystic follicles, and decreased granulosa cell layers. We next assessed the injury in mice ovaries by Western blotting and immunohistochemical staining. As shown in Fig. 3h–j, Bax/Bcl-2 ratio and Cleaved caspase-3 were elevated in the ovary of DHT-treated mice. Similarly, immunohistochemical staining of caspase-3 also demonstrated its upregulation in the ovary, especially granulosa cells (Fig. 3m). All these results indicate that chronic exposure to DHT in prepubertal female mice induces the reproductive phenotype resembling features in PCOS women. Furthermore, as shown in Fig. 3h, k, l, TNF-α protein level and serum TNF-α were highly increased in DHT-treated mice. Similarly, immunohistochemical staining of TNF-α also revealed its upregulation in the ovary, especially granulosa cells (Fig. 3m). In addition, to test the impact of nephrectomy, we determined the levels of serum TNF-α in single nephrectomy mice and PCOS mice for 3 months of experimental period. As shown in Supplementary Fig. S2a, serum TNF-α in PCOS mice was significantly higher than that in single nephrectomy mice. These results suggest TNF-α is highly involved in PCOS.
Fig. 3. TNF-α is upregulated in PCOS mice.

a Experimental design. Red arrows indicate the injection of DHT (27.5 μg/day). Blue arrows indicate the time points undergoing unilateral nephrectomy (UNx). Triangle indicates sacrifice. b Vaginal cytology with H&E staining representing each stage of estrous cycles, Bar = 100 μm. c Quantitative graph showing 10 days estrous cycles in mice. Stages of estrous include proestrus (P), estrus (E), metestrus (M), diestrus (D). d Serum DHT levels in DHT and Ctrl group. **P < 0.01 versus Ctrl group, n = 5. e Representative micrographs showing the ovary structure with H&E staining. Arrows indicate cystic follicles, Bar = 200 μm. f Quantitative graph showing the number of cystic follicles in two groups. ***P < 0.001 versus Ctrl group, n = 5. g Quantitative graph showing the ratio of granulosa cell to theca cell layers in the largest follicle. ***P < 0.001 versus Ctrl group, n = 5. h–k Western blot and quantitative data show the ratio of Bax/Bcl-2, and protein expressions of Cleaved caspase-3 and TNF-α in two groups. *P < 0.05, and **P < 0.01 versus Ctrl group, n = 5. l Serum TNF-α levels in two groups. ***P < 0.001 versus Ctrl group, n = 5. m Ovary tissues were subjected to immunohistochemical staining of Caspase-3 and TNF-α. Arrows indicate positive staining, Bar = 50 μm.
PCOS mediates apoptosis and inflammation in kidney and promotes renal fibrosis
We next examined the injuries in kidney of PCOS. We first tested kidney function through testing SCr and BUN, and the excretion of urinary albumin (Ualb). As shown in Supplementary Fig. S3a, b, the levels of SCr and BUN did not increase in PCOS mice. However, there was a slight increase in the excretion of Ualb (Supplementary Fig. S3c). Then as shown in Fig. 4a–c, Cleaved PARP and Cleaved caspase-3 were induced in the kidney of DHT-treated mice. Similarly, TUNEL staining and quantitative data also demonstrated the increase of apoptotic tubular cells in DHT-treated mice (Fig. 4d, e). Furthermore, the mRNA levels of IL-1β, IL-6, CCL2 and CCL5 assessed by qRT‐PCR were highly increased in DHT group (Fig. 4f). These results reveal that PCOS mediates apoptosis and inflammation in kidney. We next assessed the expression of fibrosis-related proteins by Western blotting. As shown in Fig. 4g–j, the expression levels of Fibronectin, Vimentin, and α-SMA were greatly upregulated in DHT group. Moreover, kidney sections in PCOS mice showed more deposition of collagen as assessed by Masson staining and immunohistochemical staining also showed more deposition of Fibronectin (Fig. 4k, l). In addition, KIM-1, a biological marker of renal tubular injury, was upregulated in DHT group as assessed by immunohistochemical staining (Fig. 4k, m). These results suggest that PCOS promotes renal fibrosis. Finally, we performed transcriptomic analysis to test the different expression of genes between DHT group and Ctrl group. As shown in Fig. 4n, o, apoptosis and inflammation were upregulated in DHT mice when compared to Ctrl mice by using GSEA. Furthermore, TNF-α signaling pathway, an effective trigger of NF-κB signaling to activate cell inflammation and apoptosis, was highly enriched in DHT mice (Fig. 4p). All these data suggest that PCOS could induce renal cell apoptosis and inflammation, and activate TNF-α signaling pathway in kidney. TNF-α may play a central role in mediating the pathological processes in PCOS-related kidney injury.
Fig. 4. PCOS mediates apoptosis and inflammation in kidney, and promotes renal fibrosis.

a–c Western blot and quantitative data show the induction of renal Cleaved PARP, and Cleaved caspase-3 in two groups. *P < 0.05, and **P < 0.01 versus Ctrl group, n = 5. d, e Graphic presentations and the representative micrographs show TUNEL-positive cells in two groups. **P < 0.01 versus Ctrl group, n = 5. Arrows indicates positive staining, Bar = 50 μm. f Graphic presentations show the relative mRNA levels of IL-1β, IL-6, CCL2 and CCL5. *P < 0.05, and **P < 0.01 versus Ctrl group, n = 5. g–j Western blot and quantitative data show the protein expressions of renal Fibronectin, Vimentin, and α-SMA. *P < 0.05 versus Ctrl group, n = 5. k Kidney tissues were subjected to Masson staining and immunohistochemical staining of KIM-1 and Fibronectin. Arrows indicate positive staining, Bar = 50 μm. l Graphic presentation show the quantitative determination of kidney fibrotic lesions in two groups. ***P < 0.001 versus Ctrl group, n = 5. m Graphic presentation shows the quantitative analysis of immunohistochemical staining for KIM-1. **P < 0.01 versus Ctrl group, n = 5. n–p GSEA show the activation of apoptosis, inflammation, and TNF-α signaling were upregulated in DHT-treated group. Q value meaning adjusted P value. NES normalized enrichment score.
Renal TNFR1 is upregulated in PCOS-affected kidney and promotes NF-κB signaling activation
To further clarify the correlation between TNF-α and PCOS-related kidney injury, we assessed the expression of TNFR1 by Western blotting. As shown in Fig. 5a, b, TNFR1 was greatly increased in kidney in PCOS mice. Furthermore, p-p65, a transcription factor of activated NF-κB signaling, was highly upregulated in PCOS kidney, and the ratio of p-p65/p65 was also remarkably enhanced (Fig. 5a, c). To determine the expressional location of TNFR1, immunohistochemical staining was performed. As shown in Fig. 5d, e, TNFR1 was predominantly localized in tubules in PCOS-affected kidney, but less expressed in the interstitium and glomeruli. Similarly, immunohistochemical staining showed p65 increased in renal tubular cells, and largely expressed in the nuclei (Fig. 5e). These results suggest that TNFR1 was activated, and then triggered NF-κB signaling pathway. Then we used immunofluorescence staining to perform the correlation between TNFR1 and renal injury. Notably, TNFR1 was upregulated in PCOS-affected kidney, accompanied by Cleaved caspase-3 activation and Fibronectin upregulation (Fig. 5f, g). This further suggests that TNF-α may play a central role in mediating the pathological processes in PCOS-related kidney injury via NF-κB signaling.
Fig. 5. Renal TNFR1 is upregulated in PCOS promoting NF-κB signaling activation.

a–c Western blot and quantitative data show the protein expression of renal TNFR1, and the ratio of p-p65/p65 in two groups. **P < 0.01, and ***P < 0.001 versus Ctrl group, n = 5. d Graphic presentation shows the quantitative analysis of immunohistochemical staining for TNFR1. ***P < 0.001 versus Ctrl group, n = 5. e Representative immunohistochemical staining micrographs show TNFR1 and p65 expression. Arrows indicates positive staining, Bar = 50 μm. f Representative immunofluorescence staining of micrographs show TNFR1 and Cleaved caspase-3 in DHT group. Bar = 50 μm. g Representative immunofluorescence staining of micrographs show TNFR1 and Fibronectin in DHT group. Bar = 50 μm.
Granulosa cell-derived conditioned medium contributes to kidney injury in vitro
To further assess the correlation between PCOS and kidney injury, we first cultured KGN cells for experiments. As shown in Fig. 6a, we cultured KGN cells which were stimulated with indicated dosage of DHT for 24 h. Then we examined the apoptosis-related proteins of KGN cells. As shown in Fig. 6b–e, FasL, the ratio of Bax/Bcl-2 and Cleaved caspase-3 were highly induced in 1 μg/ml dose of DHT group. Hence, as shown in Fig. 6f, we further collected the conditioned medium of KGN cells stimulated with 1 μg/ml dose of DHT, and then treated HKC-8 cells. Notably, conditioned medium from KGN cells could induce cell apoptosis, inflammation and fibrosis in HKC-8 cells, as manifested by increased expression of p-p65, KIM-1, Cleaved PARP, Cleaved caspase-3, Fibronectin and decreased E-cadherin (Fig. 6g–m). Consistently, fibronectin and TUNEL staining showed that they were induced by DHT-CM (Fig. 6n, o). Furthermore, as shown in Fig. 6p, the mRNA levels of IL-1β, IL-6 and CCL5 in HKC-8 cells assessed by qRT‐PCR were highly increased in DHT-CM group. In addition, to test the effect of DHT on HKC-8 cells, we cultured HKC-8 cells which were stimulated with the same dose of DHT for 24 h. As shown in Supplementary Fig. S4, DHT could not induce injury directly in HKC-8 cells. All these results suggest granulosa cell-derived conditioned medium contributes to tubular cell injury.
Fig. 6. Granulosa cell-derived conditioned medium contributes to renal tubular cell injury in vitro.

a Experimental design. KGN cells were stimulated with various dosage of DHT for 24 h. b–e Western blot and quantitative data show the protein expressions of FasL, the ratio of Bax/Bcl-2, and Cleaved caspase-3 in different groups. Medium alone serves as control group. **P < 0.01, and ***P < 0.001 versus controls, n = 3. f Experimental design. KGN cells were stimulated with DHT (1 μg/ml) for 6 h and then continued to be incubated for an additional 24 h in serum-free medium (DHT conditioned medium). Conditioned medium from KGN cells were collected and used to stimulate HKC-8 cells. g–m Western blot and quantitative data show the protein expressions of p-p65, KIM-1, Cleaved PARP, Cleaved caspase-3, fibronectin and E-cadherin in two groups. *P < 0.05, and **P < 0.01 versus Ctrl-CM group, n = 3. n Representative micrographs show immunofluorescence staining of Fibronectin and TUNEL staining in HKC-8 cells after incubation with conditioned medium from KGN cells. Arrows indicate positive staining, Bar = 50 μm. o Graphic presentation shows the percentage of apoptotic cells in two groups. *P < 0.05 versus Ctrl-CM group, n = 3. p Graphic presentations show the relative mRNA levels of IL-1β, IL-6 and CCL5. *P < 0.05 versus Ctrl-CM group, n = 3.
Knockdown of TNF-α in granulosa cell decreases renal tubular cell injury in vitro
To further explore the potential mechanisms in granulosa cell-tubular cell communication, we tested the relative protein expression of KGN cells after DHT stimulation. As shown in Fig. 7a, b, TNF-α was upregulated in DHT group, which was accompanied with apoptosis-related proteins. In addition, the content of TNF-α in supernatants of cultured KGN cells stimulated with 1 μg/ml of DHT was detected by ELISA, and then was also increased (Fig. 7c). To further clarify the role of TNF-α in controlling granulosa cell-tubular cell communication, we then transfected KGN cells with TNF-α siRNA. As shown in Fig. 7d, the mRNA level of TNF-α was significantly decreased. Consistently, protein expression of TNF-α was downregulated in KGN cells after transfection of TNF-α siRNA prior to DHT stimulation (Fig. 7e, f). To further study the role of TNF-α in mediating granulosa cell-tubular cell communication, we first transfected KGN cells with TNF-α siRNA or Ctrl-siRNA. After transfection, KGN cells were incubated with DHT for 6 h, and then collected the conditioned medium to stimulate HKC-8 cells for 24 h (Fig. 7g). As shown in Fig. 7h, the content of TNF-α in supernatant of cultured KGN cells was decreased by using ELISA, indicating the reduced secretion of TNF-α. Notably, TNF-α interference could significantly inhibit DHT-CM-induced tubular cell apoptosis, inflammation and fibrosis, as manifested by downregulated expressions of TNFR1, p-p65, KIM-1, Cleaved PARP, Cleaved caspase-3, Fibronectin, Collagen I and upregulated E-cadherin (Fig. 7i–q). Furthermore, the mRNA levels of IL-1β and IL-6 in HKC-8 cells were also highly decreased (Fig. 7r). Consistently, immunofluorescence staining showed that fibronectin was reduced in HKC-8 cells by knockdown of TNF-α from KGN cells (Fig. 7s). All these indicate knockdown of TNF-α in granulosa cell could decrease renal tubular cell injury, suggesting TNF-α is highly involved in granulosa cell-tubular cell communication.
Fig. 7. Knockdown of TNF-α in granulosa cell decreases renal tubular cell injury in vitro.

a, b Western blot and quantitative data show the protein expression of TNF-α in KGN cells with different dosage of DHT. Medium alone serves as control group. **P < 0.01, and ***P < 0.001 versus controls, n = 3. c Graphic presentations show TNF-α expression in supernatant of cultured KGN cells. *P < 0.05 versus Ctrl-CM group, n = 4. d Graphic presentations show the relative mRNA level of TNF-α in KGN cells transfected with TNF-α siRNA. **P < 0.01 versus NC group, n = 3. e, f Western blot and quantitative data show the protein expression of TNF-α in KGN cells transfected with TNF-α siRNA prior to the stimulation of DHT. *P < 0.05 versus NC + DHT group, n = 3. g Experimental design. TNF-α was knocked down in KGN cells prior to the treatment of DHT, and then the conditioned medium (TNF-α siRNA + DHT-CM) was collected to stimulate HKC-8 cells for 24 h. h Graphic presentations show content of TNF-α in supernatant of cultured KGN cells. **P < 0.01 versus NC + DHT-CM group, n = 3. i–q Western blot and quantitative data show the protein expressions of TNFR1, p-p65, KIM-1, Cleaved PARP, Cleaved caspase-3, E-cadherin, Collagen I and Fibronectin in two groups. *P < 0.05, **P < 0.01 and ***P < 0.001 versus NC + DHT-CM group, n = 3. r Graphic presentations show the relative mRNA levels of IL-1β and IL-6. *P < 0.05, and **P < 0.01 versus NC + DHT-CM group, n = 3. s Representative micrographs show immunofluorescence staining of Fibronectin in HKC-8 cells in two groups. Arrows indicate positive staining, Bar = 50 μm.
Knockdown of TNFR1 attenuates tubular cell injury induced by granulosa cell-derived conditioned medium
To discern the role of TNF-α in granulosa cell-related renal injury, we first transfected HKC-8 cells with TNFR1-siRNA. As shown in Fig. 8a, we transfected HKC-8 cells with TNFR1-siRNA or Ctrl-siRNA, followed by incubation with Ctrl-CM or DHT-CM from KGN cells. The efficacy of TNFR1 knockdown was confirmed by qRT‐PCR (Fig. 8b). Notably, TNFR1 interference could significantly inhibit DHT-CM-induced tubular cell apoptosis, inflammation and fibrosis, as manifested by downregulated expression of TNFR, p-p65, KIM-1, Cleaved PARP, Cleaved caspase-3, and Fibronectin and upregulated E-cadherin (Fig. 8c–j). Consistently, the mRNA levels of IL-1β and IL-6 in HKC-8 cells were also highly decreased (Fig. 8k). All these results reveal that TNF-α/TNFR1 signal axis plays a master controlling role in granulosa cell-tubular cell communication.
Fig. 8. Knockdown of TNFR1 in HKC-8 cells attenuates granulosa cell-derived tubular cell injury in vitro.

a Experimental design. HKC-8 cells were transfected with siRNA to TNFR1 for 6 h, and then incubated with conditioned medium (DHT-CM) from KGN cells for 24 h. b Graphic presentations show the relative mRNA levels of TNFR1 in HKC-8 cells. ***P < 0.001 versus NC group, n = 3. c–j Western blot and quantitative data show the protein expressions of TNFR, p-p65, KIM-1, Cleaved PARP, Cleaved caspase-3, E-cadherin, and Fibronectin in two groups. *P < 0.05, **P < 0.01, and ***P < 0.001 versus NC group, n = 3. k Graphic presentations show the relative mRNA levels of IL-1β and IL-6. *P < 0.05, and **P < 0.01 versus NC group, n = 3.
Discussion
With an increased morbidity, PCOS is becoming a public problem in reproductive aged women [1]. PCOS is intimately associated to obesity, insulin resistance, and metabolic syndrome, which are the major causes of kidney disease, indicating increased risks for chronic kidney injury in PCOS women [5–7]. This suggests that there is the intimate association between PCOS and kidney injury. Our previous study showed that serum testosterone in PCOS women plays an important role in the pathogenesis of PCOS-related kidney injury, especially tubular cell injury [15]. However, nearly 50% of PCOS women are non-hyperandrogenic, and there were no changes in metabolic abnormalities after 20 years of follow-up in young women with PCOS, although the circulating androgens decreased [21]. Hence, not androgen, there may remain other pathogenic factors to induce PCOS-related kidney injury.
To explore the potential mechanism on mediating PCOS-related kidney injury, we first examined the clinical characteristics of PCOS and healthy subjects. Similar to our previous reports, PCOS women had significant increases in No. of AFC, LH/FSH ratio and serum T (Table 1 and Supplementary Table S5). As other studies reported, PCOS is mainly characterized by elevated levels of serum LH, the condition of hyperandrogenism and a consequent increased ratio between LH and FSH, and these manifestations cooperatively lead to anovulation aggravating PCOS disease. All of these were confirmed to reflect the severity of PCOS [39–42]. However, nearly 70% of PCOS women were defined as non-hyperandrogenism in our study. It suggested that testosterone is not exactly indicated in PCOS. PCOS is considered a pro-inflammatory state with the elevated levels of TNF-α, interleukins, and other inflammatory mediators in the serum [28, 30]. Studies reported that TNF-α was significantly increased in PCOS women with obese when compared with body mass index (BMI) [43, 44]. Consistently, TNF-α in the serum and GCs was higher in PCOS than that in controls. Interestingly, our results showed that TNF-α levels were positively correlated with serum T and LH/FSH ratio in PCOS (Figs. 1 and 2). Moreover, the levels of serum TNF-α had no significant difference in PCOS patients with or without hyperandrogenemia (Supplementary Fig. S1a). A previous study showed that there was a positive correlation of TNF-α and free-testosterone. Furthermore, anti-TNF-α therapy significantly decreased the elevated level of androgen in PCOS rats, and overexpression of TNF-α promoted the secretion of androgen [45]. These further confirmed that TNF-α plays an important role in the progression of PCOS through the secretion into blood.
To test the role of TNF-α in the correlation between PCOS and kidney injury, we evaluated kidney function in PCOS and control subjects. Notably, in PCOS patients, there were increases in SCr and BUN, and UACR, which refers to the ratio of urinary microalbuminuria to creatinine, indicating the glomerular injury. Consistently, previous studies showed the association between PCOS and albuminuria [12–14]. Although no significant increase in urinary excretion levels of KapU, LamU, α1‐MU, and β2-MU in PCOS patients, there were significantly positive correlation between serum TNF-α and these tubular proteinuria markers compared with controls (Supplementary Table S3 and Fig. 1). This further demonstrated that serum TNF-α is highly involved in tubular injury in PCOS.
After administration of mice with DHT, which is used to represent the normo-androgenic phenotype of PCOS women [46–48], we found a higher level of TNF-α in PCOS ovaries especially in apoptotic granulosa cells, while the overexpression of TNFR1 in renal tubular cells (Figs. 3 and 5). TNFR1 is a cell surface receptor that regulates cell inflammatory, survival and cell proliferation through triggering NF-κB pathway [22, 26, 27]. These results suggested the binding of TNF-α and TNFR1 may be highly involved in PCOS-related kidney injury.
A novel discovery of this study is that TNF-α was enriched in conditioned medium from apoptotic granulosa cells (Figs. 6 and 7). Interestingly, granulosa cell-derived conditioned medium greatly induced tubular cells injury, which was abolished by TNF-α knockdown in ovarian granulosa cells. All these indicate TNF-α plays a central role in the communication between granulosa cells and tubular cells.
Another interesting finding of this study is that downregulation of TNFR1 in tubular cells greatly ameliorated granulosa cell-derived kidney injury (Fig. 8). This further suggest that TNF-α/TNFR1 axis mediates the communication between granulosa cells and tubular cells.
Collectively (Fig. 9), our results suggest that TNF-α is a master controller for ovarian granulosa cells and renal tubular cells communication in PCOS-related kidney injury. Granulosa cell-derived TNF-α is secreted into blood, and then transferred to kidney and triggers NF-κB signaling in tubular cells through binding to receptor TNFR1, and finally induces cell inflammation and apoptosis, promoting renal fibrogenesis. Activation of TNF-α/TNFR1 axis leads to the development and progression of PCOS-related kidney injury. Thus, TNF-α is an important causative factor for the process. Serum TNF-α is suggested to be an important indicator for the clinical auxiliary diagnosis of PCOS-related kidney diseases.
Fig. 9. Working model.
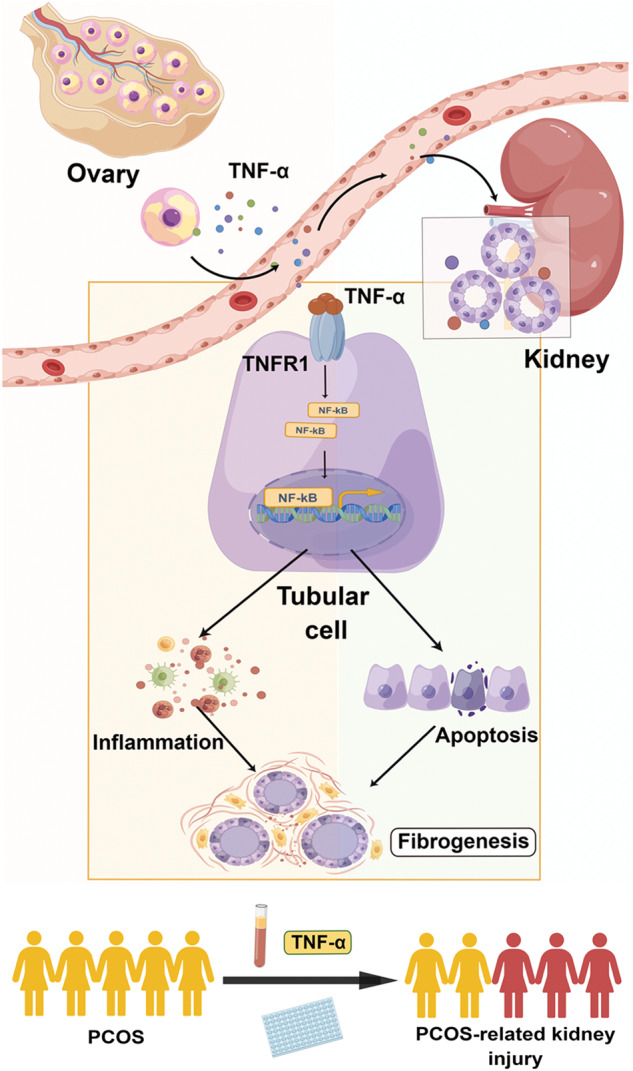
The schematic presentation by Figdraw depicts the potential mechanism by which TNF-α/TNFR1 axis mediates renal fibrosis. TNF-α is induced in ovary, and then secrets into blood. Serum TNF-α is transferred to kidney and then binds to its receptor TNFR1 in tubular cells. TNF-α/TNFR1 axis triggers NF-κB signaling, and then activates cell inflammation and apoptosis, promoting renal fibrogenesis. Monitoring of serum TNF-α levels in PCOS women could be used to associate PCOS-induced kidney injury.
Supplementary information
Acknowledgements
This work was supported by National Natural Science Foundation of China (Grant 82225010, 82070707); Outstanding Youths Development Scheme of Nanfang Hospital, Southern Medical University (2019J013, 2021J001); the Presidential Foundation of Nanfang Hospital (Grant No. 2019Z006), and Guangdong Provincial Clinical Research Center for Kidney Disease (No. 2020B1111170013).
Author contributions
LLZ conceived this study. LLZ and YLS participated in its design and coordination. HYY, WTY, CXX, JML, JHM, WWS and XLL conducted the experiments and contributed to data analysis and interpretation. HYY drafted the manuscript. LLZ helped to revise the manuscript. All authors have read and approved the final manuscript.
Competing interests
The authors declare no competing interests.
Footnotes
These authors contributed equally: Hui-yun Ye, Ya-li Song, Wen-ting Ye.
Contributor Information
Ya-li Song, Email: syl@smu.edu.cn.
Li-li Zhou, Email: jinli730@smu.edu.cn.
Supplementary information
The online version contains supplementary material available at 10.1038/s41401-023-01128-0.
References
- 1.Jones GL, Hall JM, Balen AH, Ledger WL. Health-related quality of life measurement in women with polycystic ovary syndrome: a systematic review. Hum Reprod Update. 2008;14:15–25. doi: 10.1093/humupd/dmm030. [DOI] [PubMed] [Google Scholar]
- 2.Li R, Zhang Q, Yang D, Li S, Lu S, Wu X, et al. Prevalence of polycystic ovary syndrome in women in China: a large community-based study. Hum Reprod. 2013;28:2562–9. doi: 10.1093/humrep/det262. [DOI] [PubMed] [Google Scholar]
- 3.Azziz R, Carmina E, Chen Z, Dunaif A, Laven JS, Legro RS, et al. Polycystic ovary syndrome. Nat Rev Dis Prim. 2016;2:16057. doi: 10.1038/nrdp.2016.57. [DOI] [PubMed] [Google Scholar]
- 4.Fauser BC, Tarlatzis BC, Rebar RW, Legro RS, Balen AH, Lobo R, et al. Consensus on women’s health aspects of polycystic ovary syndrome (PCOS): the Amsterdam ESHRE/ASRM-sponsored 3rd PCOS consensus workshop group. Fertil Steril. 2012;97:28–38.e25. doi: 10.1016/j.fertnstert.2011.09.024. [DOI] [PubMed] [Google Scholar]
- 5.Stepto NK, Cassar S, Joham AE, Hutchison SK, Harrison CL, Goldstein RF, et al. Women with polycystic ovary syndrome have intrinsic insulin resistance on euglycaemic-hyperinsulaemic clamp. Hum Reprod. 2013;28:777–84. doi: 10.1093/humrep/des463. [DOI] [PubMed] [Google Scholar]
- 6.Gambineri A, Patton L, Altieri P, Pagotto U, Pizzi C, Manzoli L, et al. Polycystic ovary syndrome is a risk factor for type 2 diabetes: results from a long-term prospective study. Diabetes. 2012;61:2369–74. doi: 10.2337/db11-1360. [DOI] [PMC free article] [PubMed] [Google Scholar]
- 7.Lim SS, Davies MJ, Norman RJ, Moran LJ. Overweight, obesity and central obesity in women with polycystic ovary syndrome: a systematic review and meta-analysis. Hum Reprod Update. 2012;18:618–37. doi: 10.1093/humupd/dms030. [DOI] [PubMed] [Google Scholar]
- 8.Santoro N, Eisenberg E, Trussell JC, Craig LB, Gracia C, Huang H, et al. Fertility-related quality of life from two RCT cohorts with infertility: unexplained infertility and polycystic ovary syndrome. Hum Reprod. 2016;31:2268–79. doi: 10.1093/humrep/dew175. [DOI] [PMC free article] [PubMed] [Google Scholar]
- 9.Moran LJ, Deeks AA, Gibson-Helm ME, Teede HJ. Psychological parameters in the reproductive phenotypes of polycystic ovary syndrome. Hum Reprod. 2012;27:2082–8. doi: 10.1093/humrep/des114. [DOI] [PubMed] [Google Scholar]
- 10.Anderson SA, Barry JA, Hardiman PJ. Risk of coronary heart disease and risk of stroke in women with polycystic ovary syndrome: a systematic review and meta-analysis. Int J Cardiol. 2014;176:486–7. doi: 10.1016/j.ijcard.2014.06.079. [DOI] [PubMed] [Google Scholar]
- 11.Dumesic DA, Lobo RA. Cancer risk and PCOS. Steroids. 2013;78:782–5. doi: 10.1016/j.steroids.2013.04.004. [DOI] [PubMed] [Google Scholar]
- 12.Ziaee A, Oveisi S, Ghorbani A, Hashemipour S, Mirenayat M. Association between metabolic syndrome and premicroalbuminuria among Iranian women with polycystic ovary syndrome: a case control study. Glob J Health Sci. 2012;5:187–92. doi: 10.5539/gjhs.v5n1p187. [DOI] [PMC free article] [PubMed] [Google Scholar]
- 13.Gozukara IO, Gozukara KH, Kucur SK, Karakılıc EU, Keskin H, Akdeniz D, et al. Association of glomerular filtration rate with inflammation in polycystic ovary syndrome. Int J Fertil Steril. 2015;9:176–82. doi: 10.22074/ijfs.2015.4238. [DOI] [PMC free article] [PubMed] [Google Scholar]
- 14.Patil CN, Racusen LC, Reckelhoff JF. Consequences of advanced aging on renal function in chronic hyperandrogenemic female rat model: implications for aging women with polycystic ovary syndrome. Physiol Rep. 2017;5:e13461. doi: 10.14814/phy2.13461. [DOI] [PMC free article] [PubMed] [Google Scholar]
- 15.Song Y, Ye W, Ye H, Xie T, Shen W, Zhou L. Serum testosterone acts as a prognostic indicator in polycystic ovary syndrome-associated kidney injury. Physiol Rep. 2019;7:e14219. doi: 10.14814/phy2.14219. [DOI] [PMC free article] [PubMed] [Google Scholar]
- 16.Panidis D, Tziomalos K, Misichronis G, Papadakis E, Betsas G, Katsikis I, et al. Insulin resistance and endocrine characteristics of the different phenotypes of polycystic ovary syndrome: a prospective study. Hum Reprod. 2012;27:541–9. doi: 10.1093/humrep/der418. [DOI] [PubMed] [Google Scholar]
- 17.Nautiyal H, Imam SS, Alshehri S, Ghoneim MM, Afzal M, Alzarea SI, et al. Polycystic ovarian syndrome: a complex disease with a genetics approach. Biomedicines. 2022;10:540. doi: 10.3390/biomedicines10030540. [DOI] [PMC free article] [PubMed] [Google Scholar]
- 18.Daan NM, Louwers YV, Koster MP, Eijkemans MJ, de Rijke YB, Lentjes EW, et al. Cardiovascular and metabolic profiles amongst different polycystic ovary syndrome phenotypes: who is really at risk? Fertil Steril. 2014;102:1444–51.e3. doi: 10.1016/j.fertnstert.2014.08.001. [DOI] [PubMed] [Google Scholar]
- 19.Zhang HY, Guo CX, Zhu FF, Qu PP, Lin WJ, Xiong J. Clinical characteristics, metabolic features, and phenotype of Chinese women with polycystic ovary syndrome: a large-scale case-control study. Arch Gynecol Obstet. 2013;287:525–31. doi: 10.1007/s00404-012-2568-z. [DOI] [PubMed] [Google Scholar]
- 20.Kauffman RP, Baker TE, Baker VM, DiMarino P, Castracane VD. Endocrine and metabolic differences among phenotypic expressions of polycystic ovary syndrome according to the 2003 Rotterdam consensus criteria. Am J Obstet Gynecol. 2008;198:670.e1–10. doi: 10.1016/j.ajog.2008.01.037. [DOI] [PubMed] [Google Scholar]
- 21.Carmina E, Campagna AM, Lobo RA. A 20-year follow-up of young women with polycystic ovary syndrome. Obstet Gynecol. 2012;119:263–9. doi: 10.1097/AOG.0b013e31823f7135. [DOI] [PubMed] [Google Scholar]
- 22.Hayden MS, Ghosh S. Regulation of NF-kappaB by TNF family cytokines. Semin Immunol. 2014;26:253–66. doi: 10.1016/j.smim.2014.05.004. [DOI] [PMC free article] [PubMed] [Google Scholar]
- 23.Horiuchi T, Mitoma H, Harashima S, Tsukamoto H, Shimoda T. Transmembrane TNF-alpha: structure, function and interaction with anti-TNF agents. Rheumatology. 2010;49:1215–28. doi: 10.1093/rheumatology/keq031. [DOI] [PMC free article] [PubMed] [Google Scholar]
- 24.Yang S, Wang J, Brand DD, Zheng SG. Role of TNF-TNF receptor 2 signal in regulatory T Cells and its therapeutic implications. Front Immunol. 2018;9:784. doi: 10.3389/fimmu.2018.00784. [DOI] [PMC free article] [PubMed] [Google Scholar]
- 25.Borghi A, Verstrepen L, Beyaert R. TRAF2 multitasking in TNF receptor-induced signaling to NF-kappaB, MAP kinases and cell death. Biochem Pharmacol. 2016;116:1–10. doi: 10.1016/j.bcp.2016.03.009. [DOI] [PubMed] [Google Scholar]
- 26.Barnabei L, Laplantine E, Mbongo W, Rieux-Laucat F, Weil R. NF-kappaB: at the borders of autoimmunity and inflammation. Front Immunol. 2021;12:716469. doi: 10.3389/fimmu.2021.716469. [DOI] [PMC free article] [PubMed] [Google Scholar]
- 27.Lawrence T. The nuclear factor NF-kappaB pathway in inflammation. Cold Spring Harb Perspect Biol. 2009;1:a001651. doi: 10.1101/cshperspect.a001651. [DOI] [PMC free article] [PubMed] [Google Scholar]
- 28.Gnanadass SA, Prabhu YD, Gopalakrishnan AV. Association of metabolic and inflammatory markers with polycystic ovarian syndrome (PCOS): an update. Arch Gynecol Obstet. 2021;303:631–43. doi: 10.1007/s00404-020-05951-2. [DOI] [PubMed] [Google Scholar]
- 29.Dabravolski SA, Nikiforov NG, Eid AH, Nedosugova LV, Starodubova AV, Popkova TV, et al. Mitochondrial dysfunction and chronic inflammation in polycystic ovary syndrome. Int J Mol Sci. 2021;22:3923. doi: 10.3390/ijms22083923. [DOI] [PMC free article] [PubMed] [Google Scholar]
- 30.Zhai Y, Pang Y. Systemic and ovarian inflammation in women with polycystic ovary syndrome. J Reprod Immunol. 2022;151:103628. doi: 10.1016/j.jri.2022.103628. [DOI] [PubMed] [Google Scholar]
- 31.Xiong YL, Liang XY, Yang X, Li Y, Wei LN. Low-grade chronic inflammation in the peripheral blood and ovaries of women with polycystic ovarian syndrome. Eur J Obstet Gynecol Reprod Biol. 2011;159:148–50. doi: 10.1016/j.ejogrb.2011.07.012. [DOI] [PubMed] [Google Scholar]
- 32.Escobar-Morreale HF, Calvo RM, Sancho J, San Millán JL. TNF-alpha and hyperandrogenism: a clinical, biochemical, and molecular genetic study. J Clin Endocrinol Metab. 2001;86:3761–7. doi: 10.1210/jcem.86.8.7770. [DOI] [PubMed] [Google Scholar]
- 33.Alissa EM, Algarni SA, Khaffji AJ, Al Mansouri NM. Role of inflammatory markers in polycystic ovaries syndrome: in relation to insulin resistance. J Obstet Gynaecol Res. 2021;47:1409–15. doi: 10.1111/jog.14684. [DOI] [PubMed] [Google Scholar]
- 34.Thathapudi S, Kodati V, Erukkambattu J, Katragadda A, Addepally U, Hasan Q. Tumor necrosis factor-alpha and polycystic ovarian syndrome: a clinical, biochemical, and molecular genetic study. Genet Test Mol Biomark. 2014;18:605–9. doi: 10.1089/gtmb.2014.0151. [DOI] [PMC free article] [PubMed] [Google Scholar]
- 35.Kordestani F, Mazloomi S, Mortazavi Y, Mazloomzadeh S, Fathi M, Rahmanpour H, et al. Preliminary study showing no association between G238A (rs361525) tumor necrosis factor-alpha (TNF-alpha) gene polymorphism and its serum level, hormonal and biochemical aspects of polycystic ovary syndrome. BMC Med Genet. 2018;19:149. doi: 10.1186/s12881-018-0662-1. [DOI] [PMC free article] [PubMed] [Google Scholar]
- 36.van Houten ELAF, Kramer P, McLuskey A, Karels B, Themmen APN, Visser JA. Reproductive and metabolic phenotype of a mouse model of PCOS. Endocrinology. 2012;153:2861–9. doi: 10.1210/en.2011-1754. [DOI] [PubMed] [Google Scholar]
- 37.Zhou L, Zhou S, Yang P, Tian Y, Feng Z, Xie XQ, et al. Targeted inhibition of the type 2 cannabinoid receptor is a novel approach to reduce renal fibrosis. Kidney Int. 2018;94:756–72. doi: 10.1016/j.kint.2018.05.023. [DOI] [PMC free article] [PubMed] [Google Scholar]
- 38.Zhou L, Li Y, Hao S, Zhou D, Tan RJ, Nie J, et al. Multiple genes of the renin-angiotensin system are novel targets of Wnt/beta-catenin signaling. J Am Soc Nephrol. 2015;26:107–20. doi: 10.1681/ASN.2014010085. [DOI] [PMC free article] [PubMed] [Google Scholar]
- 39.Carmina E, Lobo RA. Comparing lean and obese PCOS in different PCOS phenotypes: evidence that the body weight is more important than the Rotterdam phenotype in influencing the metabolic status. Diagnostics. 2022;12:2313. doi: 10.3390/diagnostics12102313. [DOI] [PMC free article] [PubMed] [Google Scholar]
- 40.Johansson J, Stener-Victorin E. Polycystic ovary syndrome: effect and mechanisms of acupuncture for ovulation induction. Evid Based Complement Altern Med. 2013;2013:762615. doi: 10.1155/2013/762615. [DOI] [PMC free article] [PubMed] [Google Scholar]
- 41.Balen AH, Laven JS, Tan SL, Dewailly D. Ultrasound assessment of the polycystic ovary: international consensus definitions. Hum Reprod Update. 2003;9:505–14. doi: 10.1093/humupd/dmg044. [DOI] [PubMed] [Google Scholar]
- 42.Li Y, Chen C, Ma Y, Xiao J, Luo G, Li Y, et al. Multi-system reproductive metabolic disorder: significance for the pathogenesis and therapy of polycystic ovary syndrome (PCOS) Life Sci. 2019;228:167–75. doi: 10.1016/j.lfs.2019.04.046. [DOI] [PubMed] [Google Scholar]
- 43.Pawelczak M, Rosenthal J, Milla S, Liu YH, Shah B. Evaluation of the pro-inflammatory cytokine tumor necrosis factor-alpha in adolescents with polycystic ovary syndrome. J Pediatr Adolesc Gynecol. 2014;27:356–9. doi: 10.1016/j.jpag.2014.01.104. [DOI] [PMC free article] [PubMed] [Google Scholar]
- 44.Goswami S, Choudhuri S, Bhattacharya B, Bhattacharjee R, Roy A, Mukhopadhyay S, et al. Chronic inflammation in polycystic ovary syndrome: a case-control study using multiple markers. Int J Reprod Biomed. 2021;19:313–20. doi: 10.18502/ijrm.v19i4.9057. [DOI] [PMC free article] [PubMed] [Google Scholar]
- 45.Lang Q, Yidong X, Xueguang Z, Sixian W, Wenming X, Tao Z. ETA-mediated anti-TNF-alpha therapy ameliorates the phenotype of PCOS model induced by letrozole. PLoS One. 2019;14:e0217495. doi: 10.1371/journal.pone.0217495. [DOI] [PMC free article] [PubMed] [Google Scholar]
- 46.Stener-Victorin E, Padmanabhan V, Walters KA, Campbell RE, Benrick A, Giacobini P, et al. Animal models to understand the etiology and pathophysiology of polycystic ovary syndrome. Endocr Rev. 2020;41:bnaa010. doi: 10.1210/endrev/bnaa010. [DOI] [PMC free article] [PubMed] [Google Scholar]
- 47.Mannerås L, Cajander S, Holmäng A, Seleskovic Z, Lystig T, Lönn M, et al. A new rat model exhibiting both ovarian and metabolic characteristics of polycystic ovary syndrome. Endocrinology. 2007;148:3781–91. doi: 10.1210/en.2007-0168. [DOI] [PubMed] [Google Scholar]
- 48.Caldwell ASL, Edwards MC, Desai R, Jimenez M, Gilchrist RB, Handelsman DJ, et al. Neuroendocrine androgen action is a key extraovarian mediator in the development of polycystic ovary syndrome. Proc Natl Acad Sci USA. 2017;114:E3334–43. doi: 10.1073/pnas.1616467114. [DOI] [PMC free article] [PubMed] [Google Scholar]
Associated Data
This section collects any data citations, data availability statements, or supplementary materials included in this article.