

Abstract
Objective: A 1-hour plasma glucose level ≥ 8.6 mmol/L in a 75 g oral glucose tolerance test has been strongly associated with increased morbidity and mortality in outpatients without diabetes. Our primary aim was to evaluate the 1-hour plasma glucose level in a 75 g glucose tolerance test in survivors of critical illness with stress hyperglycaemia at 3 months after intensive care unit (ICU) discharge, with the secondary aims to evaluate the 2-hour plasma glucose level, glycated haemoglobin (HbA1c), and gastric emptying.
Design:Post hoc analysis of a single-centre, prospective cohort study.
Setting: Single-centre, tertiary referral, mixed medical-surgical ICU.
Participants: Consecutively admitted patients aged ≥ 18 years who developed stress hyperglycaemia and survived to hospital discharge were eligible.
Interventions: Participants returned at 3 months after ICU discharge and underwent a 75 g oral glucose tolerance test.
Main outcome measures: One- and 2-hour post load plasma glucose level, HbA1c, and assessment of gastric emptying via an isotope breath test.
Results: Thirty-five patients (12 females; mean age, 58.5 years [SD, 10.5]; mean HbA1c, 37.4 mmol/mol [SD, 7.0]) attended the followup. In 32/35 patients (91%) the 1-hour post load plasma glucose level was ≥ 8.6 mmol/L. There was a positive correlation between the plasma glucose level at 1 hour (r2 = 0.21; P = 0.006), but no correlation between the 2-hour glucose level (r2 = 0.006; P = 0.63) and gastric emptying.
Conclusion: Glucose intolerance, when defined as 1-hour glucose level ≥ 8.6 mmol/L following a 75 g oral glucose load, persists at 3 months in most survivors of stress hyperglycaemia and is dependent on the rate of gastric emptying. Longitudinal studies to characterise mechanisms underlying dysglycaemia and progression to diabetes in individuals with stress hyperglycaemia are indicated.
Stress hyperglycaemia describes impaired glucose tolerance in individuals without diabetes that resolves following resolution of their acute illness.1 Glucose tolerance is traditionally evaluated by a 75 g oral glucose tolerance test (OGTT); a 2-hour plasma glucose level ≥ 7.8 mmol/L is defined as impaired glucose tolerance and a 2-hour plasma glucose level ≥ 11.1 mmol/L as diabetes.2 More recently, a 1-hour plasma glucose level ≥ 8.6 mmol/L following a 75 g OGTT has been shown to be a robust predictor of incident type 2 diabetes in outpatients, and outperforms the 2-hour plasma glucose level and glycated haemoglobin (HbA1c).3, 4, 5 Furthermore, a 1-hour plasma glucose level ≥ 8.6 mmol/L is strongly associated with increased diabetes-related morbidity and mortality in outpatients.3,4
Gastric emptying is a major determinant of the glycaemic response to an OGTT in healthy individuals, in people with impaired glucose tolerance, and in those with type 2 diabetes.6 However, the timing and direction of these relationships are influenced by glucose tolerance status.6 In healthy people, the relationship of plasma glucose level with gastric emptying is direct at 30 minutes, not significant at 60 minutes and inverse at 120 minutes, whereas in individuals with impaired glucose tolerance or type 2 diabetes, there is a direct relationship at 60 minutes.6 The relationship of the 1-hour plasma glucose level with gastric emptying has not been evaluated in survivors of critical illness with stress hyperglycaemia. We hypothesised that the 1-hour plasma glucose level after glucose load would be greater in individuals with relatively faster gastric emptying.
The primary aim of this study was to assess the 1-hour plasma glucose level in survivors of critical illness who had stress hyperglycaemia detected during their intensive care unit (ICU) admission at 3 months after ICU discharge. The secondary aims were to measure the 2-hour plasma glucose level, HbA1c, and the relationship of the 1- and 2-hour plasma glucose level with gastric emptying.
Methods
This is a post hoc analysis of a single-centre, prospective cohort study.7 Forty patients without diabetes, who were admitted to the ICU and were identified as having stress hyperglycaemia as a complication during their admission, were recruited. Stress hyperglycaemia was defined as an admission HbA1c ≤ 47.5 mmol/mol (≤ 6.5%) and subsequent blood glucose concentrations > 11.1 mmol/L (200 mg/dL) on two or more occasions within a 24-hour period or the commencement of insulin for glucose level > 11.1 mmol/L (200 mg/dL). Thirty-five patients (87.5%) returned at 3 months for a 75 g OGTT where the drink was labelled with 100 mg of 13C-octanoic acid. Breath samples were acquired before ingestion of the glucose load, every 5 min for the first hour, and then every 15 min for the subsequent 2 hours. For the purposes of this analysis, a 1-hour plasma glucose level ≥ 8.6 mmol/L (measured using the hexokinase technique8) was considered indicative of glucose intolerance,4 and either a HbA1c ≥ 47.5 mmol/mol, fasting glucose level ≥ 7.0 mmol/L or 2-hour plasma glucose level ≥ 11.1 mmol/L was considered incident diabetes.7 Carbon dioxide (CO2) concentration and the percentage of 13CO2 were measured in each sample with an isotope ratio mass spectrometer (ABCA model 20\20; Europa Scientific, Crewe, UK).9 The gastric emptying half-time (T50) was derived from these data and adjusted with the Wagner-Nelson method.10 The gastric emptying rate in kcal/min was derived by calculating the ratio of half the total caloric content of the glucose drink to the T50. Differences in mean 1-hour plasma glucose level and gastric emptying between the subgroups with or without incident diabetes were evaluated with an unpaired t test, and the relationship between 1-hour plasma glucose level and T50 was evaluated via linear regression. A P < 0.05 was considered significant. Data are presented as means with standard deviation (SD).
Results
At the 3-month follow-up, the mean age of the participants was 58.5 years (SD, 10.5), the mean HbA1c was 37.4 mmol/ mol (SD, 7.0), the mean weight was 80 kg (SD, 20.9), and the mean body mass index was 27 kg/m2 (SD, 6.3). The mean 1-hour plasma glucose level was 11.3 mmol/L (SD, 2.6), and 32/35 participants (91.4%) had glucose intolerance (1-hour plasma glucose, ≥ 8.6 mmol/L). There was no significant difference in the 1-hour plasma glucose level in patients diagnosed with diabetes (13/35; HbA1c, ≥ 47.5 mmol/mol; fasting glucose, ≥ 7.0 mmol/L; 2-hour plasma glucose, ≥ 11.1 mmol/L) and in those without diabetes (22/35; mean, 12.0 mmol/L [SD, 3.2] v 10.9 mmol/L [SD, 2.2]; P = 0.26). The mean gastric emptying T50 was 128.2 min (SD, 52.5), corresponding to a gastric emptying rate of 1.2 kcal/min. In addition, there was an inverse relationship between plasma glucose level at 1-hour and gastric emptying T50 (r2 = 0.21; P = 0.006), indicating that individuals in whom gastric emptying was relatively faster had a greater 1-hour plasma glucose level (Figure 1). There was no relationship between plasma glucose level at 2 hours and gastric emptying T50 (r2 = 0.006; P = 0.63; Figure 1). The was no difference between gastric emptying T50 in patients with and without diabetes (mean, 128.5 min [SD, 40.3] v 127.5 min [SD, 58.8]; P = 0.96).
Figure 1.
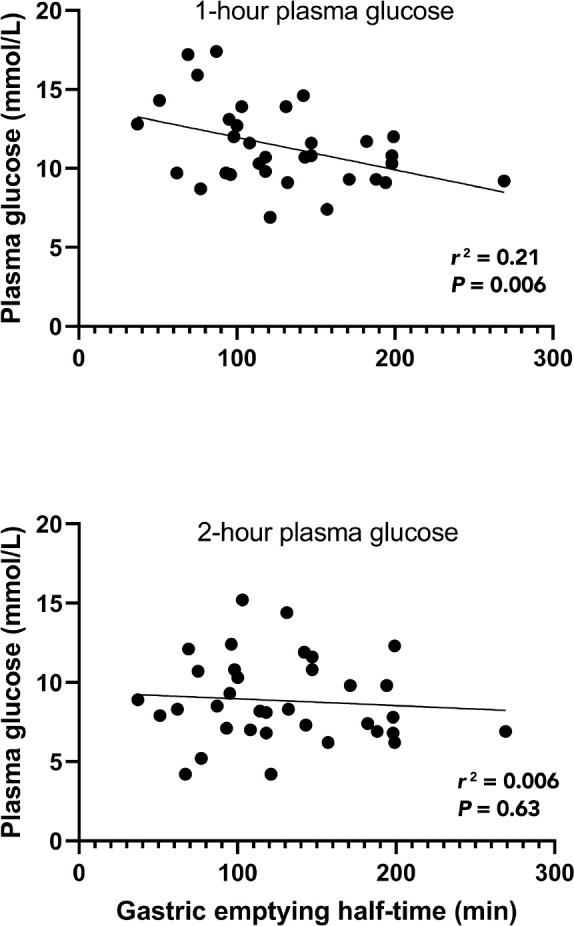
Relationship of 1-hour and 2-hour plasma glucose level following a 75 g oral glucose load and gastric emptying half-time in survivors of critical illness with stress hyperglycaemia (n = 35)
Discussion
The major observation is that most of this cohort (> 90%) of survivors of critical illness with stress hyperglycaemia, studied 3 months after ICU discharge, had glucose intolerance when defined as a 1-hour plasma glucose level ≥ 8.6 mmol/L. There is compelling evidence that a 1-hour plasma glucose level ≥ 8.6 mmol/L is associated with mortality and morbidity in general practice, and is a robust predictor of progression to type 2 diabetes.4 Early identification of individuals with glucose intolerance is important, as it provides the opportunity to intervene and thereby reduce the risk of progression to overt diabetes.11 Currently, there are no formal guidelines regarding follow-up of patients who have been diagnosed with stress hyperglycaemia during ICU admission. In comparison, gestational diabetes, a condition that is associated with transient dysglycaemia, is routinely followed up with an OGTT post partum.12 As individuals with stress hyperglycaemia, which may comprise up to 50% of all ICU admissions,13 are likely to be at high risk of future complications of diabetes and increased mortality, we believe that further evaluation is required to determine the effectiveness of screening programs and interventions.11
The pathogenesis of stress hyperglycaemia is multifactorial, and is driven by increased glucose production, relative insulin insufficiency, temporary insulin resistance, and iatrogenic therapies such as steroids and catecholamines.14 Our findings suggest that there is a hangover effect from acute illness resulting in persistent dysglycaemia despite recovery from the acute stressor. Further research is required to delineate whether this is due to a reduction in β-cell secretory capacity, insulin resistance or both.
In healthy patients and in those with type 2 diabetes, gastric emptying, which exhibits a substantial inter- but much lower intra-individual variation, is a primary determinant of the glycaemic response to oral glucose and carbohydrate- containing meals.6 We have shown, in survivors of stress hyperglycaemia, a similar relationship with faster gastric emptying associated with a greater glycaemic response after glucose load. Intuitively, this is due to increased glucose delivery to the small intestine and more rapid absorption. This cohort had gastric emptying rates similar to those seen in healthy individuals (1-4 kcal/min)6 and there was no difference in gastric emptying between the subgroups (incident diabetes v no diabetes). In healthy individuals, there is a direct relationship of glycaemia at 30 minutes, but not at 60 minutes, with gastric emptying during an OGTT, and the relation with the 120-minute glucose is inverse, rather than direct. In contrast, in impaired glucose tolerance, there is a "shift to the right" with a direct relationship of glycaemia and gastric emptying at 30 and 60 minutes but not at 120 minutes.6 In type 2 diabetes, there is a further shift, with a direct relationship at 30 and 60 minutes and a trend for a direct relationship at 120 minutes.6 This "shift to the right" is likely a result of glucose rises being more sustained in the setting of declining glucose counter-regulation. Accordingly, the demonstration of a relationship at 60 minutes in individuals with prior stress hyperglycaemia is indicative of a sustained glycaemic rise, presumably reflecting ineffective glucose counter-regulation.6
The limitations of this study include the relatively small sample size. We were also unable to analyse for differences in gastric emptying between the subgroup with and without an elevated 1-hour plasma glucose level, as only three patients had normal glucose tolerance. Gastric emptying was measured using the 13C-octanoic acid breath test, rather than the gold standard scintigraphy, but this limitation was mitigated by using the Wagner-Nelson method,10 known to make the data comparable to scintigraphy.15 The study was designed post hoc and, accordingly, the findings need to be confirmed by dedicated, prospective studies, ideally assessing the risk of incident diabetes and its complications in this cohort.
Conclusion
Most survivors of critical illness with stress hyperglycaemia have a 1-hour plasma glucose level consistent with glucose intolerance at 3 months after ICU discharge. Prospective studies are required to evaluate the long term risk of diabetes or its complications in this cohort and determine if early intervention may prevent progression to diabetes.
Competing interests
All authors declare that they do not have any potential conflict of interest in relation to this manuscript.
References
- 1.Dungan K.M., Braithwaite S.S., Preiser J.C. Stress hyperglycaemia. Lancet. 2009;373:1798–1807. doi: 10.1016/S0140-6736(09)60553-5. [DOI] [PMC free article] [PubMed] [Google Scholar]
- 2.World Health Organization . Report of a WHO/IDF consultation. WHO Press; Geneva: 2006. Definition and diagnosis of diabetes mellitus and intermediate hyperglycaemia.https://www.who.int/publications/i/item/definition-and-diagnosis-of-diabetes-mellitus-and-intermediate-hyperglycaemia (viewed July 2022) [Google Scholar]
- 3.Bergman M. The 1-hour plasma glucose: common link across the glycemic spectrum. Front Endocrinol. 2021;1(2):752329. doi: 10.3389/fendo.2021.752329. [DOI] [PMC free article] [PubMed] [Google Scholar]
- 4.Bergman M., Jagannathan R., Buysschaert M., et al. Lessons learned from the 1-hour post-load glucose level during OGTT: current screening recommendations for dysglycaemia should be revised. Diabetes Metab Res Rev. 2018;34:2992. doi: 10.1002/dmrr.2992. [DOI] [PubMed] [Google Scholar]
- 5.Peddinti G., Bergman M., Tuomi T., Groop L. 1-hour post-OGTT glucose improves the early prediction of type 2 diabetes by clinical and metabolic markers. J Clin Endocrinol Metab. 2019;104:1131–1140. doi: 10.1210/jc.2018-01828. [DOI] [PMC free article] [PubMed] [Google Scholar]
- 6.Marathe C.S., Horowitz M., Trahair L.G., et al. Relationships of early and late glycemic responses with gastric emptying during an oral glucose tolerance test. J Clin Endocrinol Metab. 2015;100:3565–3571. doi: 10.1210/JC.2015-2482. [DOI] [PubMed] [Google Scholar]
- 7.Kar P., Plummer M.P., Ali Abdelhamid Y., et al. Incident diabetes in survivors of critical illness and mechanisms underlying persistent glucose intolerance: a prospective cohort study. Crit Care Med. 2019;47:103–111. doi: 10.1097/CCM.0000000000003524. [DOI] [PubMed] [Google Scholar]
- 8.Neese J.W. Glucose, direct hexokinase method. Selected methods. Clin Chem. 1982;9:241–248. [Google Scholar]
- 9.Deane A.M., Chapman M.J., Fraser R.J., et al. Effects of exogenous glucagon-like peptide-1 on gastric emptying and glucose absorption in the critically ill: relationship to glycemia. Crit Care Med. 2010;38:1261–1269. doi: 10.1097/CCM.0b013e3181d9d87a. [DOI] [PubMed] [Google Scholar]
- 10.Wagner J.G., Nelson E. Kinetic analysis of blood levels and urinary excretion in the absorptive phase after single doses of drug. J Pharm Sci. 1964;53:1392–1403. doi: 10.1002/jps.2600531126. [DOI] [PubMed] [Google Scholar]
- 11.Paulweber B., Valensi P., Lindstrom J., et al. A European evidence-based guideline for the prevention of type 2 diabetes. Horm Metab Res. 2010;42(Suppl):S3–36. doi: 10.1055/s-0029-1240928. [DOI] [PubMed] [Google Scholar]
- 12.Thayer S.M., Lo J.O., Caughey A.B. Gestational diabetes: importance of follow-up screening for the benefit of long-term health. Obstet Gynecol Clin North Am. 2020;47:383–396. doi: 10.1016/j.ogc.2020.04.002. [DOI] [PMC free article] [PubMed] [Google Scholar]
- 13.Plummer M.P., Bellomo R., Cousins C.E., et al. Dysglycaemia in the critically ill and the interaction of chronic and acute glycaemia with mortality. Intensive Care Med. 2014;40:973–980. doi: 10.1007/s00134-014-3287-7. [DOI] [PubMed] [Google Scholar]
- 14.Bar-Or D., Rael L.T., Madayag R.M., et al. Stress hyperglycemia in critically ill patients: Insight into possible molecular pathways. Front Med (Lausanne) 2019;6:54. doi: 10.3389/fmed.2019.00054. [DOI] [PMC free article] [PubMed] [Google Scholar]
- 15.Trahair L.G., Nauck M.A., Wu T., et al. Measurement of gastric emptying using a 13C-octanoic acid breath test with Wagner-Nelson analysis and scintigraphy in type 2 diabetes. Exp Clin Endocrinol Diabetes. 2022 doi: 10.1055/a-1784-6185. [Epub ahead of print] [DOI] [PubMed] [Google Scholar]