

Abstract
In this paper, the collapse behavior of a single cavitation bubble at different distances near a solid particle of typical scales is numerically simulated and researched with the volume of fluid (VOF) method. Based on the key parameters analysis of the pressure field, velocity vector, collapse time the tendency of cavitation bubble collapse characteristics at different distances during the change of particle size is studied with the variable of the distance and relative size between the particle and the cavitation bubble. The dimensionless distance parameter ‘γ’ is specifically presented in the simulation process, the cavitation bubble collapse impact is largely directed to the particle when 3>γ > 2, while the wall hardly affects the interaction between the cavitation bubble and the solid particle as γ > 3. The results illustrate that as the solid particle and wall exist, the distance and particle size affect both the peak collapse pressure and the collapse jet velocity of the cavitation bubble, and the influence of solid wall on the cavitation bubble at the same distance is much greater than that of solid particles. When the particle size increases, the particle gradually affects the cavitation bubble in a way similar to the wall. While as the distance decreases or the particle size increases, the influence of particle and wall on the evolution process of the cavitation bubble expands, meanwhile, the collapse pressure and collapse jet velocity of the cavitation bubble are promoted with the optimized distance and particle size, which brings marvelous cavitation effect. The numerical methods and conclusions of this paper provide a valuable reference for cavitation applications of sand-containing fluids.
Keywords: Cavitation bubble, Solid particles, Bubble collapse, VOF, Numerical simulation
1. Introduction
The cavitation phenomenon was first proposed in 1894, from which the cavitation effect of erosion and damage on water conservancy devices is called cavitation phenomenon. In order to reduce or eliminate the damage of cavitation, scholars have studied the cavitation effect of sand laden fluid and the interaction of cavitation with solid particles and wall in recent years. Some scholars believed that the addition of particles could enhance the cavitation effect to a certain extent, thus increasing the damage to water conservancy devices [1], while some scholars found that the micro jet and shock wave generated by the collapse of cavitation bubble could be employed to break up small particles [2]. Moreover, the cavitation effect has further applications in the fields of pollution prevention and diamond preparation [3,4].
Currents studies show that the cavitation effect plays an important role in the field of heavy oil upgrading and viscosity reduction. At present, oil sands resources are a promising unconventional oil energy source, and most of the existing oil sands separation methods require high energy consumption which brings serious pollution [5,6]. Aiming at this, the cavitation separation method for oil sands method is particularly proposed by employing the cavitation effect in effective stripping the asphaltenes from the surface of oil sands particles, which is pollution-free and has low energy consumption [7,8]. Considering the application prospect, the role of solid particle as well as the wall surface on the collapse characteristics of single cavitation bubble is investigated providing a theoretical basis for subsequent research and device selection.
In order to enhance the separation efficiency of cavitation method and reduce the erosion of cavitation impact on the hydraulic device, it is necessary to study the mechanism of interaction between cavitation bubbles and oil sand particles as well as the wall surface. Gohil et al. [9] summarized the combined effects of cavitation and sediment erosion in hydraulic turbines. Lyu and Zhang et al. [10,11] investigated the interaction between single cavitation bubble and single spherical particle under various working conditions. The deformation characteristics of the bubble walls under different bubble diameter ratios and distance parameters were categorized and summarized. Zhai et al. [12] investigated the collapse jet characteristics of electric pulse-induced cavitation bubble near elastic wall and described the effect of wall surface with different elastic moduli on the collapse behavior of cavitation bubbles by comparing with the situation under rigid walls. Dular et al. [13] proposed that constructing composite materials with sound impedance similar to that of liquid media can effectively reduce cavitation erosion. Zevnik et al. [14] studied the interaction between cavitation bubbles and compliant structures at the micro scale through numerical methods, clarifying the role of micro jet mechanism in cavitation sterilization applications. Yang et al. [15] used the LBM model to simulate the process of cavitation bubble collapse near the wall indicated that wall wettability had a significant effect on the cavitation bubble collapse process. Shan et al. [16] studied the thermodynamic characteristics of cavitation bubble collapse near a curved wall by with numerical methods, in which he investigated the mechanism of high temperature and high pressure generated at the moment of cavitation bubble collapse that brings a wall temperature increase. Rasthofer et al. [17] proposed a high-performance computing framework for simulating large-scale compressible multi-component flows, in which the collapse process of cavitation clouds was simulated. Pang et al. [18] specifically studied the influence of wall effect on the bubble floating characteristics in shear thinning fluid, concluding that the bubble terminal velocity was the judgment basis for whether to eliminate the influence of wall effect. Han and Orthaber et al. [19,20] investigated the interaction between the oil-water interface and cavitation bubbles and indicated that the mechanism facilitates the mixing of two-phase liquids. YU et al. [21] studied the factors affecting the characteristics of cavitation nozzle as optimizing the structure of nozzle diffusion section to obtain better cavitation effect with numerical method. Yin et al. [22] studied the rebound behavior of cavitation near the solid wall through numerical simulation, and quantitatively analyzed the effect of dimensionless distance on the pressure of jet impinging on the wall. Vanhille [23] simulated the birth and movement of cavitation bubbles in three-dimensional finite amplitude phased array focused axisymmetric ultrasonic field, in which the generation process of primary Bjerknes force was found expounded.
Scholars have summarized the influence of particles on cavitation inception and cavitation damage, by revealing the behavior mode and mechanism of cavitation bubbles near particles. Technique of discharge experiments, laser and ultrasonic have been employed to cavitation research in previous experiment studies. Mainly, two methods are discussed in the cavitation erosion measurement processes. One is to directly measure damage, such as mass loss and the number of cavitation pits, and another is to measure the pressure load of bubble collapse to calculate cavitation damage, while the reliability of experimental instruments used to measure this impact load is unpredictable. Due to the transient of bubble collapse and the difficulty in measuring pressure, numerical simulation remains as the general and significant research approach, in which the boundary integral method (BEM) and volume of fluid method (VOF) are widely used.
Although experiments on cavitation bubbles and particles have been performed and analyzed at present, most of them mainly focused on eliminating the damage of cavitation to the device wall, and neglecting the study on the impact of cavitation bubble collapse on particles. More fundamental research is required for better apply cavitation to oil sand separation, e.g., the relationship between single bubble and single oil sand particle, the impact of cavitation bubble collapse on oil sand particles, the optimal equipment structure and operating conditions, and so on. In practical engineering applications, the size of sand particles varies, and existing research has shown that the size of spherical particles affects the dynamic characteristics of nearby bubbles. As particles gradually move away from cavitation bubbles, their influence on cavitation bubbles attenuates, thus the particle size plays an important factor that affecting this attenuation characteristic. How the relationship between bubbles and particles changes as the wall gradually moves away, and how this affects the loads exerted on the wall and spherical particles, are the focus of related research.
Based on the above research, the purpose of this paper is to study the interaction between solid particles and cavitation bubbles by numerical simulation based on VOF method. How the parameters of particles affect the collapse law of cavitation bubbles and how cavitation bubbles exert loads on the particles surface are the focus of this paper. The paper is organized in the following manner: Section 1 provides a detailed description of theoretical foundation and the numerical method used in the simulation. Section 2 describes the analysis of various characteristics of the collapse process of a single cavitation bubble near a single particle, including phase contour, pressure contour, velocity vector, and collapse time, this includes situations without wall and with wall. The paper ends with the conclusions Section 3.
2. Numerical method
2.1. Cavitation theory
During the compression of the cavitation bubble, the vapor pressure pv inside the bubble is lower than the pressure p∞ from infinity, and if the vapor pressure pv inside the bubble is neglected, the bubble wall motion could be expressed by the Rayleigh equation as Eq. (1):
| (1) |
where R is the radius of cavitation bubble, ρ is the fluid density, p∞ is the water pressure from infinity.
The compression velocity and acceleration of the bubble wall and the collapse time of the bubble in Eqs. (2), (3), (4) can be obtained by solving the Rayleigh equation:
| (2) |
| (3) |
| (4) |
where R0 is the initial radius of cavitation bubble.
In the bubble collapse process, the movement characteristics of bubbles and bubble walls change due to the influence of particles or wall surface, which could be explained by Bjerknes effect. As the bubble wall expands or contracts, the force acting on the bubble surface can be expressed by Bjerknes force [24,25]as Eq. (5):
| (5) |
where Vb is the volume of liquid discharged.
2.2. Numerical simulation
In the numerical simulation process on the behavior of the cavitation bubble near the particle, it is assumed that both the particle and the cavitation bubble are spherical, the gas inside the cavitation bubble is water vapor, an ideal gas, the water is not compressible. The Continuum Surface Force (CSF) model is employed to study the effect of surface tension, ignoring the effect of gravity and the mass transfer between the gas and the liquid. The volume of fluid (VOF) method could better maintain the fluid mass conservation and can handle the change of interface topology, and then the gas-liquid two-phase is accurately captured. Therefore, the volume of fluid (VOF) method is selected to capture the cavitation interface in this process.
2.2.1. Control equation
The continuity equation, momentum equation and energy equation in the cavitation flow field are as Eqs. (6), (7), (8):
| (6) |
| (7) |
| (8) |
where ρ is the fluid density, u is the fluid velocity, p is the flow field pressure, μ is the fluid kinematic viscosity, T is the temperature, Fσ is the surface tension, E is the total energy, k is the fluid heat transfer coefficient.
Considering the compressibility of the gas in the cavitation bubble, ideal gas equation of state could be solved as Eq. (9):
| (9) |
where R is the molar gas constant.
In this paper, the VOF method is used to capture the interface of cavitation bubble. The volume fraction of each fluid is used to judge the boundary line of gas-liquid phase. The volume fraction transport equation is as Eq. (10):
| (10) |
here, α is the phase volume fraction. Take the liquid phase as an example, when α = 0 indicates that the grid is inside the cavitation bubble. α = 1 indicates the grid is outside the cavitation bubble, while 0<α < 1 indicates that the grid is on the two intersecting interfaces.
Based on the volume fraction, the calculated density and dynamic viscosity of the whole area can be characterized as Eqs. (11), (12), (13):
| (11) |
| (12) |
| (13) |
where α1 and α2 is the volume fraction of liquid phase and gas phase respectively.
2.2.2. Calculation model
In this study, ANSYS ICEM and ANSYS Fluent software are synthetically used to investigate the evolution process of cavitation bubble. In order to exclude the influence of pressure boundary conditions on the basin calculation results as much as possible, the pressure outlet boundary was located at 25 mm from the center of the particle. The computational domain and boundary settings are shown in Fig. 1 (not drawn to actual scale). For the case without rigid wall, the lower boundary is the symmetry axis, and the rest of the boundary is set as the pressure outlet boundary, as shown in Fig. 1(a). For the case containing rigid wall, the right-side boundary is the no-slip wall, and the cavitation bubble is located between the particle and the wall, as shown in Fig. 1(b). The ambient pressure P∞ is set to 101325Pa, the pressure P0 inside the cavitation bubble at the initial moment is set to 2340Pa, the particle size Rp is 1 mm, the basin temperature is set to 300K, the initial velocity of the whole region is 0, and the surface tension effect is considered. The pressure and velocity coupling method is selected as SIMPLE, the volume discretization format is selected as Modified HRIC format, the convective term discretization format is selected as Second Order Upwind format, the pressure discretization format is selected as Body Force Weighted format, and the time step is varied between 10−7-10−8s.
Fig. 1.

Calculation Model (a) Computational domain without wall (b) Computational domain with wall.
2.2.3. Grid independence verification
In order to ensure the computational accuracy while reducing unnecessary computational effort, the grids near the particle and wall regions are densified. Fig. 2 shows the comparison of the peak velocity of the collapsed jet with three grid levels. It can be seen that the calculation results of the last two grids are relatively similar. In order to reduce the computational cost and ensure the quality of the results, the second grid level is chosen, and the minimum grid size is below 4E-10 m2 in the densified areas near the particle and wall.
Fig. 2.
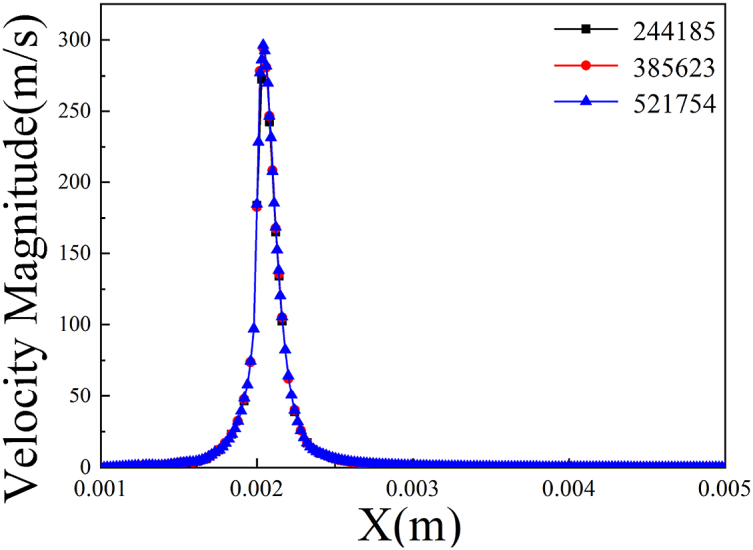
Grid Independence Verification.
2.2.4. Experimental verification
In order to verify the validity of the proposed calculation model, the simulation results of the numerical method are compared with the available experimental results. The following working conditions are selected for numerical simulation: Rp = 1.1 mm, d = 1.9 mm, R0 = 0.2 mm, P0 = 4.2Mpa.
The numerical simulation results are shown in Fig. 3, and the upper half of each set of figures is the simulation results and the lower half is the experimental results. In view of the size difference in the size of the cavitation bubble in the experiment and numerical simulation, it is normalized and the collapse time of the cavitation bubble is described by using dimensionless time. Initially, the cavitation bubble starts to expand (Fig. 3(a), (b)), and the expansion of the left side bubble wall of the cavitation bubble is constrained due to the obstruction effect of the left side particles on the flow field (Fig. 3(c), (d)). Around t* = 0.56, the cavitation bubble expands to the maximum size until contacting with the particles (Fig. 3(e), (f)). In the contraction phase of the cavitation bubble, the cavitation bubble starts to migrate toward the particle and attach to the particle surface, performing as a light bulb shape (Fig. 3(g), (h)). Then the cavitation bubble starts to shrink inward and finally transforms into a rod shape (Fig. 3(i), (j)). It can be observed that the basic characteristics of the cavitation bubble collapse process through the numerical simulation, which illustrates a high agreement with the experimental results, thus the numerical method is considered effective.
Fig. 3.

The cavitation bubble evolution simulated by the proposed model and that
measured by the experiment [6] (a) t* = 0.09 (b) t* = 0.18 (c) t* = 0.28 (d) t* = 0.36 (e) t* = 0.56 (f) t* = 0.62 (g) t* = 0.81 (h) t* = 0.85 (i) t* = 0.89 (j) t* = 0.94.
3. Result analysis
3.1. Collapse characteristics of a single cavitation bubble near a particle
In order to study the mechanism of the effect of particle on the collapse of cavitation bubble, the collapse characteristics of a single cavitation bubble near a single particle with different distance parameters and particle scale parameters working conditions are simulated. The dimensionless distance λ and the particle diameter ratio μ are defined as Eqs. (14), (15):
| (14) |
| (15) |
where d is the initial distance between the center of the bubble and the surface of the particle, Rp is the radius of the particle, and Rmax is the initial radius of the cavitation bubble.
3.1.1. Deformation process
Keep Rmax = 1 mm, μ = 1, take λ = 1.1, 1.2, 1.5, 2 respectively. The deformation process of cavitation bubble is shown in Fig. 4. As can be seen from the figure that the cavitation bubble deformation characteristics appear more obvious changes during the growing process of λ. When the cavitation bubble and the particle get close, the collapse process is heavenly influenced by the particle, and it is difficult to maintain a spherical shape, resulting an asymmetric pear-shaped collapse, as shown in Fig. 4(a), (b). When the cavitation bubble and the particle gradually get away from each other, the asymmetry of the bubble decreases, and the collapse process shows a regular spherical shape, and the influence of the particle on the collapse of the cavitation bubble also reduces, as shown in Fig. 4(c), (d).
Fig. 4.

Collapse process of cavitation bubble under dimensionless distance (a)λ = 1.1 (b)λ = 1.2 (c)λ = 1.5 (d)λ = 2 at Rmax = 1 mm, μ = 1.
Keep Rmax = 1 mm, λ = 1.2, take μ = 0.5, 1, 1.5, 2 respectively. The deformation process of cavitation bubble is simulated as in Fig. 5. It could be observed that the asymmetry of cavitation bubble was relatively reduced when μ = 0.5, while the shape of cavitation bubble collapse was biased toward pear shape when μ increases, as shown in Fig. 5(a), (b). The shape of cavitation bubble exhibited a considerable degree of asymmetry as μ > 1.5, as shown in Fig. 5(c), (d). It can be seen that, the effect of particles on cavitation bubble collapse decreases as μ decreases. Whereas μ grows, the variation tendency of cavitation bubble shape tends to be similar to the case when λ decreases.
Fig. 5.

Collapse process of cavitation bubble under particle diameter ratio (a)μ = 1.1 (b)μ = 1.2 (c)μ = 1.5 (d)μ = 2 at Rmax = 1 mm, λ = 1.
It can be seen that the type of cavitation bubble collapse deformation is influenced by both the distance parameter and the particle scale parameter. When μ increases or λ decreases, the particle illustrates more effect on the collapse process of cavitation bubble, and the asymmetry of deformation gets higher. When the cavitation bubble is closer to the surface of the solid particle, the position of the center of the cavitation bubble collapse is observed to be slightly shifted toward the particle than the initial moment.
3.1.2. Pressure distribution
The following typical working conditions are selected for pressure field analysis: Rmax = 1 mm, μ = 1, λ = 1.2. As shown in Fig. 6, the collapse process of cavitation can be roughly divided into five stages. Firstly, the cavitation bubble starts to shrink from the maximum radius. At this time, the internal pressure of the cavitation is the saturated vapor pressure. Due to the low pressure in the bubble, the surrounding flow field shrinks towards the center of the bubble, resulting in the continuous shrinking of the bubble wall, as shown in Fig. 6(a) and (b). In the second stage, the asymmetry of the left and right flow fields of the cavitation results in a crescent shaped high-pressure zone at the end far from the particles. The high pressure on the right-side renders rapid shrinkage of the bubble wall and makes the cavitation move towards the particles, which is also a reflection of the Bjerknes effect, as shown in Fig. 6(c) and (d). In the third stage, the cavitation bubble is tightly wrapped by a high-pressure region as the cavitation bubble gradually shrinks to the minimum size. The contraction rate of the bubble wall and the rise of the peak pressure at this stage are very rapid, as shown in Fig. 6(e) and (f). In the fourth stage, the cavitation bubble shrinks to completely disappear under the action of high pressure, and the high-pressure area wrapped around the cavitation bubble finally converges to a point, causing the pressure peak to climb to a new height again, as shown in Fig. 6(g), where the pressure peak at the center of the collapse reaches 1.39E+08 Pa. In the finally stage, the cavitation bubble completely collapses, and the pressure area wrapped around the cavitation bubble decays rapidly after converging to a point in the center and the pressure zone wrapped around the cavitation bubble rapidly decays and disappears after converging to the central point, and then a negative pressure zone appears in the collapse region, as shown in Fig. 6(h), which ends the first collapse process of the cavitation bubble. This result agrees with the research of Liu et al. [26].
Fig. 6.

Evolutionary process pressure field when a single cavitation bubble near a particle collapses at Rmax = 1 mm, λ = 1.2, μ=1 (a) t = 20μs (b) t = 60μs (c) t = 80μs (d) t = 87μs (e) t = 92μs (f) t = 93μs (g) t = 94μs (h) t = 95μs.
From the pressure cloud diagram, it could be figured out that in the early stage of bubble collapse, the pressure on the side of the bubble wall near the particle is less than the water pressure at infinity p∞ due to the obstructive effect from the particle, so it can be seen from Eqs. (2), (3) that the contraction rate of the bubble wall near the particle should be reduced during the bubble contraction process, which is consistent with the observed experimental and simulation results. The asymmetry of the flow field renders the Bjecknes effect, which is reflected in the crescent-shaped high-pressure area on the outer side of the cavitation bubble away from the particle, where the pressure on the right side of the cavitation bubble is always greater than the pressure on the left side during the subsequent time, so that the collapsing cavitation bubble will produce a movement toward the wall or the particle, which is also called the “wall effect”.
Keep Rmax = 1 mm, μ = 1, take λ = 1.1, 1.2, 1.5, 2 respectively, the variation trend of pressure with coordinates is shown in Fig. 7. For the case of μ = 1, when λ increases gradually, the cavitation bubble gradually moves away from the particle, the pressure peak point shifts to the right, and the collapse pressure peak value increases in the first stage and then decreases. In addition, the “wall effect” of cavitation is also reflected in the line diagram. It could be clearly seen from the figure that when λ is 1.1, 1.2 and 1.5, the final collapse pressure peak point has a significant change compared with the initial time, which indicates that the cavitation bubble has migrated towards the particle direction. The migration distance of cavitation is longer with smaller μ. Keep Rmax = 1 mm, λ = 1, take μ=0.5, 1, 1.5, 2 respectively, as shown in Fig. 8. When μ increases gradually, the collapse pressure also increases at the first stage and then decreases, where the “wall effect” shows up. When μ is larger, the migration distance of cavitation bubble is longer.
Fig. 7.

Pressure distribution under different λ values.
Fig. 8.

Pressure distribution under different μ values.
The peak collapse pressures under different operating conditions are compared, as shown in Fig. 9. When μ > 1, the collapse pressure increases as λ increases. When μ < 1, the collapse pressure decreases as λ increases. When μ = 1, the collapse pressure increases for a while and then decreases with the increase of λ. Therefore, the trend of the peak collapse pressure Pmax is affected by both λ and μ. When μ and λ varies, it is to be found that an extreme value of the peak collapse pressure Pmax generated at the center of the cavitation bubble. As shown in Fig. 10, comparing the pressure loads acting on the surface of the particle under different cases of cavitation bubble collapse, it is observed that the increasing λ renders a drastic decrease in the pressure on the surface of the particle when μ is constant. As μ increases from 0.5 to 2, the pressure load on the particle surface shows an overall increasing trend.
Fig. 9.

Peak value of bubble collapse pressure near a single particle under different conditions.
Fig. 10.

Surface pressure peak value of single particle impacted by single bubble collapse.
3.1.3. Cavitation jet
To further investigate the effect of particles on the jet phenomenon, the velocity vector of cavitation bubble collapse under different operating conditions is captured in this paper.
Keep Rmax = 1 mm, μ = 1, take λ = 1.1, 1.2, 1.5, 2 respectively, as shown in Fig. 11. When the cavitation bubble is close to the particle, the jet direction is more concentrated, as shown in Fig. 11(a), (b). With various λ, the trend of the collapse jet velocity is consistent with the collapse pressure. When the particle is closer to the cavitation bubble, the jet direction is more concentrated to the center of particle; as the particle gradually move away from the cavitation bubble, the direction of the collapse jet becomes more dispersed, as shown in Fig. 11(c), (d). This is possibly because, the influence from the particle is greatly reduced when the distance between the cavitation bubble and the particle increases, and the asymmetry of the flow field decreases. Therefore, the collapse jet is no longer directed specifically toward the particle.
Fig. 11.

Velocity vector diagram under dimensionless distance (a)μ = 1.1 (b)μ = 1.2 (c)μ = 1.5 (d)μ = 2 at Rmax = 1 mm, λ = 1.
Keep Rmax = 1 mm, λ = 1.2, take μ = 0.5, 1, 1.5, 2 respectively, as shown in Fig. 12. As μ increases from 0.5 to 1, the jet velocity also gradually increases, which is consistent with the change trend of the collapse pressure, as shown in Fig. 11(a), (b). When μ continues to grow, the particle becomes larger than the cavitation bubble, which performs as a rigid wall and inhibits the development of collapse pressure and jet, as shown in Fig. 11(c), (d). As the particle size increases, the role of the particle surface relative to the cavitation bubble goes closer to the wall, and the direction of the cavitation bubble collapse jet tends to concentrate inward.
Fig. 12.

Velocity vector diagram under particle diameter ratio (a)μ = 1.1 (b)μ = 1.2 (c)μ = 1.5 (d)μ = 2 at Rmax = 1 mm, λ = 1.
3.1.4. Collapse time
In order to study the effect of particle on bubble collapse time, adjust λ and μ while keeping Rmax = 1 mm. As shown in Fig. 13, when Rmax remains unchanged, Shortening the distance between the bubble and the particle will make the cavitation bubble collapse time longer, and increasing the particle scale can have the same effect. When λ decreases, the distance between the cavitation bubble wall and the particle surface shrinks, and the curvature of the particle surface decreases and the effect tends to be close to the surface, both of which make the effect of the particle on the collapsing cavitation bubble amplify as μ increases. On account of the barrier effect of the particle, the pressure in the region between the bubble and the particle is lower than the pressure in the water from infinity, and the contraction rate of the bubble wall here decreases, which is the main reason for the prolonged cavitation bubble collapse time.
Fig. 13.

Cavitation bubble collapse time under different λ and μ values (without wall).
3.2. Collapse characteristics of a single cavitation bubble between a particle and wall
In the practical application of oil sand separation with cavitation device, the cavitation region is always present near the device walls and the influence of the walls is not negligible. Therefore, a rigid wall is significant to study the collapse characteristics of a single cavitation bubble near the particle. To facilitate the description, a dimensionless location parameter γ is defined for the relationship between the position of the wall and the particle Eq. (16).
| (16) |
where d is the initial distance between the center of the bubble and the particle surface, h is the initial distance between the center of the cavitation bubble and the wall surface.
3.2.1. Deformation process
Keep Rmax = 1 mm, λ = 1.2, μ = 1, take γ = 1, 1.5, 2, 3 respectively. The deformation process of the cavitation bubble is shown in Fig. 14, where the right side is wall. It can be seen from Fig. 14(a), the distance from bubble wall to particle surface and to wall is both 0.2 mm, and the contraction rate of the horizontal direction of the bubble wall is much smaller than that of the vertical direction in this case, and the overall collapse shape of the cavitation bubble is oval. From the deformation of 106μs, it can be seen that the collapse shape of the cavitation bubble deforms very obviously in the direction close to the wall, and finally forms a microjet toward the wall. Simultaneously, the collapse of the cavitation bubble produces a distinct “wall effect” during the collapse process. The above phenomena shows that the “wall effect” produced by the wall is stronger than by the particle.
Fig. 14.

Collapse process of cavitation bubble under different γ values(a)γ = 1 (b)γ = 1.5 (c)γ = 2 (d)γ = 3 at Rmax = 1 mm, λ = 1.2, μ = 1.
As γ increase, the distance between bubble and particle increases, and the effect of wall on bubble gradually fades as well as the asymmetry, as shown in Fig. 14(b), (c) and (d). When γ = 2, the influence brought by the wall has been significantly reduced, whereas it is still greater than the effect of the particles, and the direction of the microjet in this case is toward the wall. When γ = 3, the jet direction has changed from pointing to the wall to pointing to the particle, which indicates that the influence of the particle on the cavitation bubble dominates at this time, thus it could be concluded that when the wall is far enough from the cavitation bubble, its effect on the collapsing cavitation bubble will be less than that of the particle. Furthermore, it can be seen in Fig. 14(a) and (d), when γ = 1 and 3, the collapse time of the cavitation bubble is set as 109μs and 97μs respectively, it is longer than the case without a rigid wall under the same working conditions. The collapse time increases to different degrees after the introduction of the wall. The effect of prolonging the collapse time is more obvious when the cavitation bubble goes closer to the wall.
3.2.2. Pressure distribution
The following working conditions for pressure field analysis is selected: Rmax = 1 mm, μ = 1, λ = 1.2, γ = 1. As shown in Fig. 15, the collapse process of cavitation bubble near the wall is roughly divided into five stages. Firstly, the cavitation bubble gradually becomes flattened and elliptical in shape during contraction because the pressure change in the horizontal direction is much smaller than that in the vertical direction, as shown in Fig. 15(a), (b). In the second stage, a high-pressure area is generated in the region between the particle and the cavitation bubble, as shown in Fig. 15(c), (d). In the third stage, the high-pressure zone on the left side of the bubble wall causes the contraction of the left end of the bubble wall to accelerate and makes the whole bubble move to the right obviously, as shown in Fig. 15(e), (f). In the fourth stage, the high-pressure zone, as shown in Fig. 15(g) converges inward to the limit and generates higher pressure peaks at the upper and lower points. In the final stage, a negative pressure is generated in the region and the collapse process ends, as shown in Fig. 15(h).
Fig. 15.

Evolutionary process pressure field when a single cavitation bubble between a particle and wall collapses at Rmax = 1 mm, λ = 1.2, μ = 1, γ = 1 (a) t = 25μs (b) t = 75μs (c) t = 90μs (d) t = 98μs (e) t = 107μs (f) t = 108μs (g) t = 109μs (h) t = 110μs.
It is worth noting that at 108μs, the cavitation bubble in the two-dimensional interface has been penetrated by the jet and split into two parts, where the center of the cavitation bubble in the three-dimensional space is penetrated by the jet and becomes annular. The peak point generated by the convergence of the high-pressure region at 109μs does not appear on the center line, while two high-pressure peak points located on the upper and lower sides of the center line. This situation occurs as the influence of the wall on the cavitation bubble collapse process is very drastic and much greater than that of the particle, then the asymmetry of the flow field is greatly enhanced, thus great deformation appears in the process of cavitation bubble collapse. Under the action of the wall and particle at the same distance from the center of the cavitation bubble, the high-pressure area of the cavitation bubble collapse appears between the cavitation bubble and the particle, rather than the wall adjacent, which indicates the wall contributes a greater effect on the cavitation bubble. At this point, the wall could be regarded as a solid particle with μ tending to infinity, so it can be explained that when λ remains unchanged and μ increases, the influence of particle on bubble will be strengthened.
Keep Rmax = 1 mm, Rp = 1 mm, λ = 1.2, take γ = 1, 1.5, 2, 3 respectively, the pressure distribution diagram under different γ values is shown in Fig. 16. When γ = 1, the cavitation bubble goes close to the wall, it is seriously affected by wall obstruction. Then, the wall plays a leading role in the effect of cavitation. Compared with the case without wall under the same working condition, the peak value of collapse pressure is only half of the original. When γ increases, the influence of the wall on the cavitation bubble decreases gradually, and the peak value of collapse pressure rises rapidly, reaching the peak value when γ = 2. When γ continues to rise, the collapse pressure tends to decrease slightly. Compared with the same working condition without wall, the appropriate wall distance promotes the collapse pressure. When the wall goes gradually away from the distance to infinity, the collapse pressure decreases to the value under the working condition without wall. When the distance between the wall and the cavitation bubble is too close, the collapse pressure will decrease dramatically. Furthermore, it can be seen from the overall process that with the change of the distance between the bubble and the wall surface, the bubble migrates in varying degrees during the collapse process. When γ changes between 1 and 2, the bubble migrates towards the wall amongst the collapse process. The closer is the bubble to the wall, the more obvious the migration effect. When γ = 3, the bubble migrates to the particle instead of the wall, where the “wall effect” of particle on cavitation bubble has exceeded the wall.
Fig. 16.

Pressure distribution under different γ values.
Keep Rmax = 1 mm, change λ and μ, and take the peak collapse pressure under different γ values, as shown in Fig. 17. When γ = 1, that is, when the distance from the bubble to the wall and the particle surface is equal, the collapse pressure increases as λ decreases or μ increases. With the gradual increase of γ, the collapse pressure of the cavitation bubble under the four working conditions shows a trend of first increasing and then decreasing, and the maximum value was higher than that under the same working conditions without wall.
Fig. 17.

Peak value of bubble collapse pressure between a single particle and wall under different conditions.
Comparing the peak pressure load on the particle and with the wall surface under the corresponding working conditions, as shown in Fig. 18, Fig. 19, it could be observed that the pressure on the wall surface decreases rapidly as γ increases, while the pressure on the particle surface illustrates an upward trend. This indicates that when the wall surface exists near the particle, the wall surface prefers to replace the particle as the target of cavitation bubble collapse impact. When the wall moves away from the bubble, the particle gradually becomes the main target of cavitation bubble impact. When γ reaches 3, the situation gets similar with the case without wall.
Fig. 18.

Surface pressure peak value of single particle impacted by single bubble collapse.
Fig. 19.

Surface pressure peak value of wall impacted by single bubble collapse.
3.2.3. Cavitation jet
The velocity vector diagram under the above working conditions is analyzed by taking the moment of collapse of the cavitation bubble, as shown in Fig. 20. When γ = 1, the peak velocity is merely 157 m/s and the overall direction of the jet points to the wall. As γ increases, the peak velocity of the jet increases gradually and the velocity direction starts to disperse. When γ reaches 2, the cavitation bubble generates jet of comparable velocity to the particle and the wall at the same time, and the peak velocity of the jet decreases. As γ continues to increase, the peak velocity of the jet starts to rise again, and when γ = 3, the peak velocity of the jet is 312 m/s, which is higher than 299 m/s under the same working conditions without wall. This is consistent with the conclusion reached above when analyzing the collapse pressure.
Fig. 20.

Velocity vector diagram under different γ values(a)γ = 1 (b)γ = 1.5 (c)γ = 2 (d)γ = 3 at Rmax = 1 mm, λ = 1.2, μ = 1.
When γ = 1, i.e., the distance from particle surface and wall surface to cavitation bubble is equal, the jet generated by the bubble collapse always converge towards the wall, as shown in Fig. 20(a). When γ increases, the main direction of the jet gradually changes from pointing to the wall to pointing to the particle (Fig. 20 (b), (c)). As shown in Fig. 20(d), the main direction of the jet has changed near γ = 2, and the position close to the point where the collapse pressure reaches peak in Fig. 17. Under other working conditions, the same phenomenon is observed as well, i.e., as γ gradually increases, the point where the collapse pressure reaches the peak just appears near the point where the main direction of the jet changes. In this position, it could be approximately considered that the wall and particle contribute similar effects on bubble collapse.
3.2.4. Collapse time
The cavitation bubble collapse time under different working conditions is shown in Fig. 21. When μ increases, λ decreases or γ decreases, the collapse time of the bubble is prolonged, which is consistent with the conclusion obtained under the condition without wall.
Fig. 21.

Cavitation bubble collapse time under different λ, μ and γ values (with wall).
In working conditions with wall, the collapse period of the cavitation bubble is significantly prolonged compared with the case without wall. Due to the obstruction of particle and wall on both sides of the cavitation bubble to the flow field, the contraction speed of the bubble wall in the horizontal direction slows down significantly, which is the main reason for the extension of the bubble collapse time. When both the particle and the wall exist near the cavitation bubble, the collapse time of the cavitation bubble under different working conditions still follows the rule in Fig. 13 when γ is constant, and the presence of walls makes the collapse time of the cavitation bubble significantly longer overall. As γ gradually increases, the collapse time will decrease up to the corresponding value in Fig. 13.
4. Conclusion
In this paper, the collapse characteristics of single cavitation bubble at different distances from single particle of different scales are studied by numerical simulations. The effect of the wall on the interaction between the particle and cavitation bubble is detailly investigated. Qualitative and quantitative analyses of the flow, pressure and velocity fields as well as the deformation law of the cavitation bubble for each calculated working conditions are carried out, thus the conclusions are as follows.
-
1.
The influence of the solid particle on the collapse characteristics of cavitation bubble is related to the distance parameter and the particle scale parameter. When λ decreases or μ increases, the influence of particle on the bubble collapse process increases, the asymmetry of the bubble is enhanced, and the pressure on the surface of the particle subjected to the collapse impact of the cavitation bubble contributes an increasing trend, while the overall strength of cavitation fades with inappropriate λ and μ values. The peak cavitation bubble collapse pressure could be obtained with the appropriate distance and particle scale and jet velocity reach the extreme value simultaneously. In the conditions calculated in this paper, the cavitation bubble collapse intensity reaches the maximum when λ = 1.2 and μ = 1.
-
2.
The addition of solid particles enhances the asymmetry of the flow field near the cavitation bubble, and the consequent "wall effect" makes the nearby cavitation bubble migrate toward the particle, thus the probability of the cavitation bubble destroying the particle surface medium increases. When the wall appears near the particle and the cavitation bubble, the "wall effect" from the particle is sharply weakened. In practice, if the cavitation location is not far enough from the wall, the cavitation bubble will migrate toward the wall, thus reducing the efficiency. Additionally, the wall will lead to a dramatic reduction in the cavitation impact on the particle, and the wall surface is eroded under the cavitation impact, thus the separation efficiency and the service life of the equipment is reduced. When γ gradually increases from 1 to 3, the pressure from the cavitation bubble impact on the particle surface gradually increases, while the pressure on the wall surface gradually decreases. When γ increases to 2and above, the cavitation bubble collapse impact is largely points to the particle. When γ > 3, the wall basically does not affect the interaction between the cavitation bubble and the solid particle.
-
3.
When the wall and particle are at the same distance from the cavitation bubble, the influence of the wall on the cavitation bubble is much heavier than that of the particle, and the jet point to the wall direction. As the distance between the cavitation bubble and the wall gradually increases, the direction of the jet gradually alters pointing to the particle. Amongst the process, the influence of the wall reduces, and the collapse pressure and jet velocity increases at first stage and then decreases. When the effect of the particle and the wall on the cavitation bubble is goes similar, the collapse pressure and jet velocity reach the maximum value, and the cavitation intensity reaches the highest.
Funding statement
This work was supported by National Natural Science Foundation of China.
Data availability statement
Data will be made available on request.
Additional information
No additional information is available for this paper.
CRediT authorship contribution statement
Fengxia Lyu: Writing – review & editing, Visualization, Validation, Supervision, Software, Resources, Project administration, Methodology, Investigation, Formal analysis, Data curation, Conceptualization. Xintong Zhang: Writing – review & editing, Writing – original draft, Validation, Software, Resources, Methodology, Investigation, Formal analysis, Data curation, Conceptualization. Huixin Yuan: Supervision, Software, Resources, Funding acquisition. Saiyue Han: Methodology, Investigation, Formal analysis, Data curation, Conceptualization. Ming Tang: Methodology, Investigation, Formal analysis, Data curation, Conceptualization.
Declaration of competing interest
The authors declare the following financial interests/personal relationships which may be considered as potential competing interests:
Yuan Huixin reports financial support was provided by National Natural Science Foundation of China.
Contributor Information
Fengxia Lyu, Email: lvfengxia@cczu.edu.cn.
Xintong Zhang, Email: S21050858081@smail.cczu.edu.cn.
Huixin Yuan, Email: yhx@cczu.edu.cn.
Saiyue Han, Email: 1915654374@qq.com.
Ming Tang, Email: 494733765@qq.com.
Nomenclature
Roman letters
- R
Radius of cavitation bubble
- R0
Initial radius of cavitation bubble
- Rmax
Max radius of cavitation bubble
- Rp
Radius of particle
- d
Initial distance from cavitation bubble center to particle surface
- h
Initial distance from cavitation bubble center to wall surface
- t
Collapse time of the cavitation bubble
- p
pressure
- p∞
Water pressure at infinity
- p0
Initial pressure inside the cavitation bubble
- u
Fluid velocity
- Vb
Volume of liquid discharged
- μ
Fluid kinematic viscosity
- T
temperature
- E
Total energy
- Fσ
Surface tension
- k
Fluid heat transfer coefficient
Greek letters
- ρ
density
- α
Phase volume fraction
References
- 1.A review of microscopic interactions between cavitation bubbles and particles in silt-laden flow. Renewable Sustainable Energy Rev. 2016;56:303–318. [Google Scholar]
- 2.Sun Y., Xiang J., Liang M., et al. Research on the influence factors of ultrasonic cavitation on particle breakage. Journal of Zhejiang University of Technology. 2019;47(2):146–150+157. [Google Scholar]
- 3.Gutiérrez-Mosquera L.F., Arias-Giraldo S., Zuluaga-Meza A. Landfill leachate treatment using hydrodynamic cavitation: exploratory evaluation. Heliyon. 2022;8(3) doi: 10.1016/j.heliyon.2022.e09019. [DOI] [PMC free article] [PubMed] [Google Scholar]
- 4.Al-Tamimi B.H., Jabbar I.I., Al-Tamimi H.M. Synthesis and characterization of nanocrystalline diamond from graphite flakes via a cavitation-promoted process. Heliyon. 2019;5(5) doi: 10.1016/j.heliyon.2019.e01682. [DOI] [PMC free article] [PubMed] [Google Scholar]
- 5.Dong Bo, Ai-xian Liu, Zhang Jia-hui, Hu Zhen, Li Youli, Guo Xuqiang. Research progress on application of cavitation technology in upgradation and viscosity reduction of heavy oil. Mod. Chem. Ind. 2021;41(1):53–56+61. [Google Scholar]
- 6.Zhang Y., Cao Z., Yang F., et al. World development STATUS OF oil-sand separation TECHNOLOGIES. Nat. Gas. Ind. 2008;28(12):110–113+149. [Google Scholar]
- 7.Zhu H.W. Experimental study on removing oil-stain from gravel. Oil Field Equipment. 2004;(5):43–46. [Google Scholar]
- 8.Bukharin N., Vinogradov O. Investigation of cavitating jet effect on Bitumen separation from oil sands. Petrol. Sci. Technol. 2012;30(13):1317–1723. [Google Scholar]
- 9.Gohil P.P., Saini R.P. Coalesced effect of cavitation and silt erosion in hydro turbines—a review. Renewable Sustainable Energy Rev. 2014;33:280–289. [Google Scholar]
- 10.Liang Lyu. China University of Petroleum; Beijing: 2019. Experimental Investigations of the Mechanisms of the Interaction between a Cavitation Bubble and Spherical Particles [D] [Google Scholar]
- 11.Zhang Y., et al. Experimental investigations of interactions between a laser-induced cavitation bubble and a spherical particle. Exp. Therm. Fluid Sci. 2018;98:645–661. [Google Scholar]
- 12.Zhai Y., Xu W., Luo J., et al. Experimental study on the characteristics of microjet and shock waves of cavitation bubbles near elastic boundaries[J] Ocean engineering. 2022;(Aug.1 Pt.2):257. [Google Scholar]
- 13.Dular M., Ohl C.D. Bulk material influence on the aggressiveness of cavitation–Questioning the microjet impact influence and suggesting a possible way to erosion mitigation[J] Wear. 2023 [Google Scholar]
- 14.Zevnik J., Dular M. Cavitation bubble interaction with compliant structures on a microscale: a contribution to the understanding of bacterial cell lysis by cavitation treatment[J] Ultrason. Sonochem. 2022;87 doi: 10.1016/j.ultsonch.2022.106053. [DOI] [PMC free article] [PubMed] [Google Scholar]
- 15.Qian Yang, He Xiaolong, Peng Haonan, Zhang Jianmin. Wall wettability effect on process of collapse of single cavitation bubbles in near-wall region using pseudo-potential lattice Boltzmann method[J] Heliyon. 2022;8(12) doi: 10.1016/j.heliyon.2022.e12636. [DOI] [PMC free article] [PubMed] [Google Scholar]
- 16.Shan M., Yang Y., Qiu S., Shu F., Han Q. Numerical study of cavitation bubble collapse dynamics near a curved wall by the volume of fluid method. Appl. Acoust. 2022;41(4):548–557. [Google Scholar]
- 17.Rasthofer U., Wermelinger F., Hadijdoukas P., et al. Large scale simulation of cloud cavitation collapse[J] Procedia Computer Science. 2017;108:1763–1772. [Google Scholar]
- 18.Pang Mingjun, Niu Ruipeng, Lu Minjie. Wall effects on floating characteristics of bubbles in shear-thinning fluids[J] Applied Aathematics and Machanics. 2020;41(2):143–155. [Google Scholar]
- 19.Han R., Zhang A.M., Tan S., et al. Interaction of cavitation bubbles with the interface of two immiscible fluids on multiple time scales. J. Fluid Mech. 2022;932:A8. [Google Scholar]
- 20.Orthaber U., Zevnik J., Petkovek R., et al. Cavitation bubble collapse in a vicinity of a liquid-liquid interface - basic research into emulsification process. Ultrason. Sonochem. 2020;68 doi: 10.1016/j.ultsonch.2020.105224. [DOI] [PubMed] [Google Scholar]
- 21.Hai-tao Y.U., Yan X.V., Wang Jia-xiang, Hai-shui L.I.U., Zhang Jing-long, Wang Zun-ce. Numerical simulation of cavitation jet characteristics of organ Pipe nozzle[J. Contemp. Chem. Ind. 2022;51(8):1991–1995. [Google Scholar]
- 22.Yin J., Zhang Y., Zhu J., et al. An experimental and numerical study on the dynamical behaviors of the rebound cavitation bubble near the solid wall. Int. J. Heat Mass Tran. 2021;177(10) [Google Scholar]
- 23.Vanhille C. Numerical simulations of stable cavitation bubble generation and primary Bjerknes forces in a three-dimensional nonlinear phased array focused ultrasound field[J] Ultrason. Sonochem. 2020;63 doi: 10.1016/j.ultsonch.2020.104972. [DOI] [PubMed] [Google Scholar]
- 24.Kornfeld M. On the Destructive action of cavitation[M] United Nations. 1944;15(6):495–506. [Google Scholar]
- 25.Waghmare Y.G., Knopf F.C., Rice R.G. The Bjerknes effect: Explaining pulsed-flow behavior in bubble columns. AIChE J. 2007;53:1678–1686. [Google Scholar]
- 26.Liu H.J., An Y. Pressure distribution outside a single cavitation bubble. Acta Phys. Sin. 2004;53(5):1406–1412. [Google Scholar]
Associated Data
This section collects any data citations, data availability statements, or supplementary materials included in this article.
Data Availability Statement
Data will be made available on request.