

Abstract
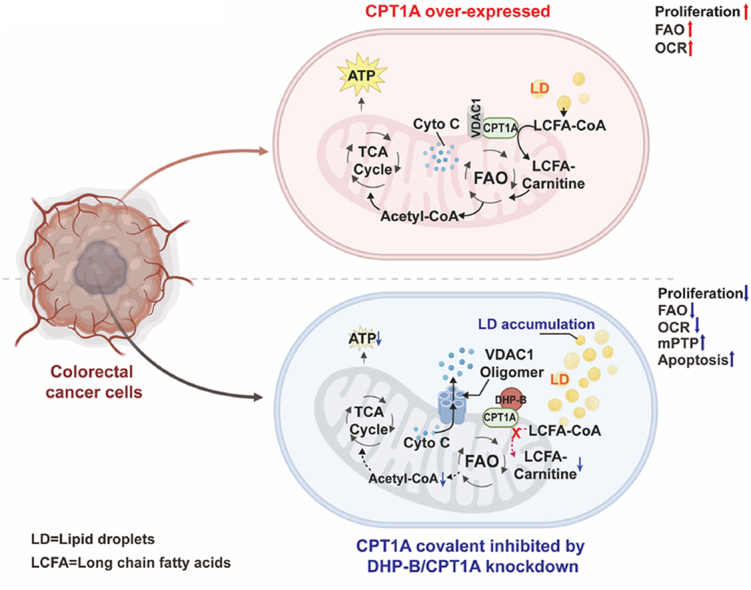
Colorectal cancer (CRC) is a common and deadly disease of the digestive system, but its targeted therapy is hampered by the lack of reliable and specific biomarkers. Hence, discovering new therapeutic targets and agents for CRC is an urgent and challenging task. Here we report that carnitine palmitoyltransferase 1A (CPT1A), a mitochondrial enzyme that catalyzes fatty acid oxidation (FAO), is a potential target for CRC treatment. We show that CPT1A is overexpressed in CRC cells and that its inhibition by a secolignan-type compound, 2,6-dihydroxypeperomin B (DHP-B), isolated from the plant Peperomia dindygulensis, suppresses tumor cell growth and induces apoptosis. We demonstrate that DHP-B covalently binds to Cys96 of CPT1A, blocks FAO, and disrupts the mitochondrial CPT1A-VDAC1 interaction, leading to increased mitochondrial permeability and reduced oxygen consumption and energy metabolism in CRC cells. We also reveal that CPT1A expression correlates with the survival of tumor-bearing animals and that DHP-B exhibits anti-CRC activity in vitro and in vivo. Our study uncovers the molecular mechanism of DHP-B as a novel CPT1A inhibitor and provides a rationale for its preclinical development as well as a new strategy for CRC targeted therapy.
Keywords: Colorectal cancer; 2,6-Dihydroxypeperomin B; CPT1A; Covalent inhibitor; VDAC1
Graphical abstract
Highlights
-
•
Natural product-derived DHP-B inhibits CRC growth by targeting CPT1A.
-
•
DHP-B covalently modifies CPT1A Cys96 and suppresses FAO, impairing CRC energy metabolism and proliferation.
-
•
DHP-B disrupts CPT1A-VDAC1 interaction and increases mitochondrial permeability, triggering CRC apoptosis.
-
•
CPT1A is overexpressed in CRC and associated with poor prognosis, suggesting a potential therapeutic target.
Abbreviations
- CPT1A
Carnitine palmitoyltransferase 1A
- CRC
Colorectal cancer
- CETSA
Cellular thermal shift assay
- DHP-B
2,6-Dihydroxypeperomin B
- EGS
Ethylene glycol bis(succinimidyl succinate)
- ETO
Etomoxir
- FAO
Fatty acid oxidation
- GO
Gene ontology
- GSEA
Gene set enrichment analysis
- MST
Microscale thermophoresis
- NSG mice
NOD-PrkdcscidIl2rgem1/Smoc mice
- OCR
Oxygen consumption rate
- OXA
Oxaliplatin
- QTRP
Quantitative thiol reactivity profiling
- VDAC1
Voltage-dependent anion-selective channel 1
1. Introduction
Colorectal cancer (CRC) is a common and deadly disease of the digestive system, which has few effective treatments due to the lack of early diagnosis and specific biomarkers [1,2]. The current methods for CRC diagnosis and treatment, such as colonoscopy, surgery, chemotherapy, radiotherapy and targeted therapy, have various drawbacks and limitations, such as toxicity, resistance, low efficacy and narrow applicability [[2], [3], [4]]. Therefore, finding new therapeutic targets and agents is an urgent and difficult goal in CRC research.
Carnitine palmitoyltransferase 1A (CPT1A) is a mitochondrial enzyme that regulates fatty acid oxidation (FAO), a metabolic pathway that is often upregulated in various cancers and linked to prognosis [[5], [6], [7], [8]]. CPT1A expression is significantly higher in metastatic and advanced CRC than in normal tissues, suggesting its critical role in CRC progression and dissemination [[9], [10], [11], [12]]. However, the molecular mechanism and prognostic value of CPT1A in CRC are still unclear. Moreover, the available CPT1A inhibitor Etomoxir (ETO) has limited clinical use due to its high dosage and adverse effects on the heart, liver and insulin sensitivity [[13], [14], [15]]. Therefore, it is imperative to discover novel CPT1A inhibitors and evaluate their anti-CRC efficacy.
Natural compounds from medicinal plants have emerged as promising candidates for cancer treatment, owing to their diverse structures and biological activities. These compounds can enhance or complement the conventional cancer therapies, thereby improving survival, alleviating symptoms and increasing quality of life [16]. Previously, we isolated three secolignans with α-methylene-γ-butyrolactone (Michael acceptor) moieties from the Peperomia dindygulensis plant of the Peperomia family, and showed that they all had potent anti-proliferative effects on CRC cells in vitro (Table S1), with 2,6-dihydroxypeperomin B (DHP-B, Fig. 1A) being the most active and selective compound against CRC cells over normal colon epithelial cells. Therefore, DHP-B has the potential to serve as a novel lead compound for anti-CRC drug development. However, its in vivo anti-CRC activity and mode of action and target remain unknown, which hinders its further preclinical evaluation. In this study, we provide evidence of the anti-CRC activity and mechanism of action of DHP-B in vitro and in vivo. We demonstrate that DHP-B effectively inhibits tumor growth in CRC cell lines and animal models with minimal toxicity. Using quantitative thiol reactivity profiling (QTRP) [17], transcriptomics, molecular biology and other techniques, we reveal that DHP-B acts as a covalent inhibitor of CPT1A, its primary target, and inhibits FAO by modifying Cys96 of CPT1A, leading to fatty acid accumulation, impaired energy metabolism and reduced cell proliferation. Furthermore, this compound induces apoptosis by disrupting the interaction of CPT1A with VDAC1 on the mitochondrial outer membrane and increasing mitochondrial permeability. Additionally, we show that CPT1A is overexpressed in CRC tissues compared to adjacent tissues, and correlates with poor prognosis. These findings establish DHP-B as a novel covalent inhibitor of CPT1A, and suggest that CPT1A is a viable therapeutic target for CRC.
Fig. 1.

DHP-B suppresses colorectal cancer cell growth and induces apoptosis in vitro. (A) Chemical structure of DHP-B, highlighting its α-methylene-γ-butyrolactone moiety in red; (B) Dose-response curves of DHP-B against five colorectal cancer cell lines; (C) Comparison of IC50 values of DHP-B and positive drug oxaliplatin (OXA) against colorectal cancer cells; (D) Comparison of DHP-B and peperomin B (PB) in inhibiting colorectal cancer cell proliferation; (E) Representative images of 3D spheroids of normal colon epithelial cells NCM460 and colorectal cancer cells treated with DHP-B (scale bar: 100 μm) and statistical graphs of the changes in 3D spheroid area at different concentrations on 0, 3, 6, 9, and 12 days (lines represent mean area, different colored bands represent SD values, n = 5); (F) Immunofluorescence staining and quantification of Ki-67 (green) in SW620 and LS180 tumor spheroids treated with 5 μM DHP-B or DMSO (Ctrl) for 6 days (scale bar: 20 μm). The number of Ki-67 positive cells were quantified using Image J 1.5.3 software; (G) Flow cytometry analysis and quantification of apoptosis in colorectal cancer cells treated with 5 μM DHP-B for 24 h; (H) Flow cytometry analysis and quantification of apoptosis in SW620 cells treated with different concentrations of DHP-B for 24 h. All of the studies above were examined using at least five biological replicates, and the results were expressed as mean ± SD; NS, not significant, *P < 0.05, **P < 0.01, ***P < 0.001, and ****P < 0.0001, upaired t-test. (For interpretation of the references to color in this figure legend, the reader is referred to the Web version of this article.)
This study provides a theoretical rationale and experimental support for the potential application and preclinical development of DHP-B as an anti-CRC agent, as well as new insights and strategies for targeted therapy of CRC. The detailed experimental methods, results and discussion are described below.
2. Material and methods
2.1. Chemicals
DHP-B (>99 % purity) and Peperomin B (PB, Fig. S1, >99 % purity) were previously isolated and purified from the whole plants of Peperomia dindygulensis, which were collected from Yunnan, China, its 1H NMR and 13C NMR spectra was provided in Fig. S2. Oxaliplatin (OXA, >99 % purity), Etomoxir (ETO, >99 % purity), Palmitic acid-13C16 (>99 % purity) were all purchased from Shanghai Yuanye Biotech Co., Ltd. (Shanghai, China). Palmitoylcarnitine and myristoyl-l-carnitine were obtained from Sigma-Aldrich Co. LLC (St. Louis, MO, USA).
2.2. Cell culture
LS513 cells (Cobioer, Nanjing, China) were cultured in RPMI 1640 medium (Biological Industries, Kibbutz Beit Haemek, Israel) supplemented with 10 % fetal bovine serum (FBS, Procell, Wuhan, China) and 1 % penicillin/streptomycin (Hyclone, Logan, UT, USA). SW620, HCT116 and NCM460 cells (Cobioer) were grown in DMEM media (Hyclone) with the same supplements. RKO cells (ATCC, Manassas, VA, USA) and LS180 cells (Cobioer) were cultured in MEM media (Gibco, Thermo Fisher Scientific Inc., Waltham, MA, USA) with the same supplements. 293T cells (ATCC) were grown in DMEM (Hyclone) with the same supplements. All cell lines were grown at 37 °C in a humidified chamber with 5 % CO2.
2.3. Cell viability assays
Cells (1 × 10⁴) were seeded in 100 μL of medium per well in a 96-well plate. After 24 h, cells were treated with corresponding drugs at the given doses and incubated at 37 °C in 5 % CO2 for another 48 h. Cell viability was assessed using a CCK-8 assay kit (Beyotime, Shanghai, China) according to the manufacturer's instructions. The absorbance at 450 nm was measured using a Spectra Max i3x plate reader (Molecular Devices, San Jose, CA, USA). Five replicates were utilized for each treatment condition.
2.4. Apoptosis assays
Cells (2.5 × 10⁵) were seeded in 6-well plates and treated with the corresponding drugs for 48 h. For the apoptosis analysis, cells were washed twice with ice-cold phosphate-buffered saline (PBS) and stained with the Annexin V Alexa Fluor 647 Apoptosis Detection Kit (FCMACS Biotech Co., Ltd., Nanjing, China) according to the manufacturer's instructions. The stained cells were analyzed by a Gallios Flow Cytometer (Beckman Coulter Inc., Brea, CA, USA). The data were processed using FlowJo software (v. 10.4, FlowJo LLC, Ashland, OR, USA). Live cells were annexin V−/PI−, while apoptotic cells were annexin V+/PI+ or annexin V+/PI−.
2.5. 3D tumor spheroids assays
Cells in logarithmic growth phase were harvested by centrifugation and resuspended in the appropriate medium. The cells were diluted to 2 × 10⁵ cells/mL and 100 μL of cell suspension was seeded into each well of a Nunclon Sphera 96-well plate (PerkinElmer Inc., Waltham, MA, USA). The plate was incubated at 37 °C in a humidified incubator with 5 % CO2 for 48 h until the cells formed 3D spherical structures. A pre-cooled 48-well plate was prepared by adding 50 μL of Matrigel Matrix (Corning, NY, USA) to each well. The 3D tumor spheroids were transferred with a 200 μL wide-bore pipette tip and visually inspected for visible spheroids in the tip. The spheroids were gently planted on top of the Matrigel Matrix. The plate was then incubated at 37 °C in a CO2 incubator for 15 min to allow the Matrigel to solidify and the spheroids to adhere to the gel. Then, 200 μL of the corresponding cell culture medium was added to each well. The next day, the cells were treated with different concentrations of drugs and incubated at 37 °C in a CO2 incubator. The drug-containing medium was replaced every three days. The area of the 3D tumor spheroids was recorded by taking photographs with an inverted microscope (Olympus Corporation, Tokyo, Japan) every three days for a total of 12 days. Image J software (V2.90/1.53t, National Institutes of Health, Bethesda, MD, USA) was used to measure the area of each 3D spheroid and calculate the change in proliferation area of each 3D tumor spheroid.
2.6. In vivo study
All animal studies in this study have been reviewed and approved by the Animal Ethics Committee of Nanjing University of Chinese Medicine (approval number: #202109A020).
Immuno-compromised NSG mice were purchased from GemPharmtech Co., Ltd. (Suzhou, China). Mice were housed in sterile conditions using HEPA-filtered micro-isolators and fed with irradiated food and sterile water. We then followed the protocol of Kasashima et al. [18] to generate orthotopic rectal tumor models in mice. Colorectal cancer cells were resuspended in Advanced DMEM/F12 medium (Gibco) containing 50 % Matrigel Matrix (Corning) at a concentration of 1 × 10⁸ cells/mL and kept on ice until injection. NSG mice (8–12 weeks old, animal license: SCXK (Shanghai) 2017–0010) were anesthetized with isoflurane (Piramal Critical Care Inc., Bethlehem, PA, USA) and placed in a supine position on a heating pad. Subcutaneous injection of Meloxicam (Labiana Health S.A., Terrassa, Spain) was administered for analgesia and eye ointment was applied before surgery. The hind limbs of the mice were lifted and fixed with tape at an angle to the bottom, exposing the anus. A blunt hemostat was inserted into the anus and gently opened, grasping the ventral side of the rectum. The hemostat was flipped to the cranial side, exposing the rectal mucosa. A 0.3 mL insulin syringe with a 31-gauge needle was used to draw 10 μL of cell suspension and gently inserted 1–2 mm into the submucosal layer of the rectum. The cell suspension was slowly injected and any leakage or bleeding at the injection site was checked. The mice were placed on a heating pad and allowed to recover from anesthesia. Tumors developed in the rectum within 2 weeks. The tumor-bearing NSG mice were randomly assigned to three groups: control, DHP-B and OXA, with eight mice per group. The mice had free access to water and food. Intraperitoneal injection of drugs or saline (25 mg/kg) was performed every other day for 14 days. At the end of the treatment, the tumors were harvested, weighed, fixed in 4 % paraformaldehyde (Sigma-Aldrich), embedded in paraffin and sectioned for immunohistochemistry. To further evaluate the efficacy, we also performed a survival experiment. The tumor-bearing NSG mice were randomly assigned to three groups: control, DHP-B and OXA, with eight mice per group. Intraperitoneal injection of drugs or saline (25 mg/kg) was performed every other day for 14 days as above. After the treatment, the survival time of the mice was recorded. The mice were euthanized when they showed signs of distress or lost 20 % of their body weight. Kaplan-Meier survival curves were used to compare the survival outcomes among different groups.
2.7. Fluorescent immunohistochemistry
Paraffin-embedded tumor tissue sections were dewaxed with xylene (Sigma-Aldrich) and rehydrated with graded ethanol. Antigen retrieval was performed with citrate buffer (pH 6.0) or EDTA buffer (pH 8.0) (Beyotime), followed by washing with PBS. Endogenous peroxidase activity was quenched by incubating the sections with 3 % hydrogen peroxide solution (Beyotime) for 60 min at room temperature, and then washing with PBS. The sections were blocked with BSA blocking buffer (Beyotime) for 30 min, and then incubated with primary antibodies (Table S4) diluted in antibody dilution buffer (Beyotime) for 1 h at 37 °C. After washing with PBS, the sections were incubated with HRP-conjugated secondary antibodies of corresponding species (Table S4) for 1 h at room temperature, and then washed with PBS. Fluorescent staining was performed according to the instructions of the TSAPLus Fluorescent Triple Staining Kit (Servicebio) as follows: 75 μL of fluorescent staining working solution was added to each section and incubated in the dark for 20 min at room temperature, followed by washing with PBS. The sections were then incubated with DAPI solution (Servicebio) for 10 min at room temperature, and then washed with PBS. The sections were mounted with anti-fade mounting medium (Absin Bioscience Inc., Shanghai, China) and scanned and analyzed with THUNDER Imaging Systems (Leica Microsystems GmbH, Wetzlar, Germany). Image J software was used to quantify the fluorescence intensity of the target proteins in the sections.
2.8. RNA-seq and data analysis
SW620 cells were treated in triplicate with 5 μM DHP-B or 0.1 % DMSO for 48 h. Total RNA was extracted using an RNeasy kit (Qiagen GmbH, Hilden, Germany). RNA libraries were prepared from 1 μg total RNA using an mRNA-Seq Library Prep Kit (Lexogen GmbH, Vienna, Austria). Total RNA and library quality were assessed by Qubit 3.0 Fluorometers (Invitrogen, Thermo Fisher Scientific Inc., Waltham, MA, USA). Samples were sequenced by HiSeq/Novaseq (Illumina Inc., San Diego, CA, USA) according to Illumina's guidelines. RNA-seq data were aligned to the human genome by Hisat2 (v2.0.1) and gene expression was quantified by HTSeq (v0.6.1). Differential expression was assessed using DESeq2 (https://bioconductor.org/packages/release/bioc/html/DESeq2.html) with default settings. Gene ontology (GO) analysis was performed using the online tool DAVID (https://david.ncifcrf.gov/) for enrichment analysis. Gene set enrichment analysis (GSEA) was run using the Java GSEA Desktop Application with default parameters using the C5 ontology gene sets from MSigDB V6.2 (https://www.gsea-msigdb.org/gsea/msigdb/index.jsp) as screening gene sets.
2.9. Nile red staining assays
Lipid droplets or fatty acid accumulation in cells can be visualized by Nile red staining [19]. Tumor cells (5 × 10⁵) were seeded in confocal dishes (NEST Biotechnology Co., Ltd., Wuxi, China) and treated with different drugs. Then, 2 mL of complete medium was added to each dish and incubated for 24 h. To induce lipid loading, Palmitic acid (final concentration 200 μM) (Shanghai Yuanye Biotech Co., Ltd.) was added to the medium and incubated for another 24 h. To induce lipid unloading, the medium was replaced with 2 mL of low-glucose DMEM (Procell) and incubated for 48 h to allow fatty acid metabolism. The cells under loading or unloading conditions were washed twice with PBS and fixed with 1 mL of 4 % paraformaldehyde (Sigma-Aldrich) for 20 min at room temperature. The cells were then washed twice with PBS and incubated with Nile red working solution (MedChemExpress, Monmouth Junction, NJ, USA) (2.5 μg/mL, 1 mL/well) in the dark for 20 min. After washing three times with PBS, the cells were stained with DAPI solution (Servicebio) and washed twice with PBS. Anti-fade mounting medium (Absin Bioscience Inc.) (300 μL) was added to each dish and the cells were imaged with a Leica TCS SP8 laser confocal microscope (Leica Microsystems GmbH, Wetzlar, Germany). Image J software was used to quantify the Nile red fluorescence intensity in the cells under loading or unloading conditions, and calculate the fluorescence change ratio, which reflects the ability of the cells to metabolize fatty acids.
2.10. Isotope tracing assays [20]
Long chain fatty acid ([U–13C]-palmitic acid or [U–13C]-myristic acid) (Shanghai Yuanye Biotech Co., Ltd.) was dissolved in ethanol at a concentration of 20 mM and then mixed with 10 % fatty acid-free bovine serum albumin (BSA) solution (Sigma-Aldrich) at a ratio of 1:5. The mixture was incubated at 37 °C for 1 h. Then, [U–13C]-palmitic acid (or [U–13C]-myristic acid) solution was diluted to a working concentration of 50 μM in serum-containing medium. Tumor cells (2 × 10⁶) were seeded and incubated for 24 h. The medium was replaced with 2 mL of medium containing BSA-bound [U–13C]-palmitic acid (or [U–13C]-myristic acid) and different drugs. After 24 h, the cells were quickly washed with PBS and fixed with 1 mL of pre-cooled methanol (Sinopharm) at −80 °C for 30 min. The cells were collected on ice, lysed by sonication, centrifuged at 12000 rpm for 10 min at 4 °C, and the supernatant was dried in a vacuum dryer (Labconco Corporation, Kansas City, MO, USA). The dried samples were reconstituted in 20 μL of methanol and injected for analysis. The isotopic palmitic acid metabolites in the cells were detected by a validated LC-MS/MS method. The LC-MS/MS system consisted of a Prominence HPLC System (Shimadzu Corporation, Kyoto, Japan) and a Waters Sunfire C18 column (5 cm × 2.1 mm, 3.5 m; Waters Corporation, Milford, MA, USA) for chromatographic separation. An AB Sciex QTrap 5500 mass spectrometer with an electrospray ionization source (AB Sciex LLC, Framingham, MA, USA) was used for detection in the positive-ion multiple reaction monitoring (MRM) modes. Palmitoylcarnitine or myristoyl-l-carnitine standards (Sigma-Aldrich) were used as references to quantify the isotopic fractions of palmitoylcarnitine or myristoyl-l-carnitine in the cell metabolite solution by Analyst 1.6.2 software (AB Sciex). The isotopic fractions were denoted as m+0, m+1, …, m + n, where n is the number of isotopically labeled carbon atoms in the long-chain acylcarnitine. The activity of CPT1A enzyme was assessed by the percentage and relative abundance of isotopically labeled long-chain acylcarnitine.
2.11. Oil red O staining
Frozen cancer tissue sections were thawed at room temperature for 30 min and fixed in 4 % paraformaldehyde for 10 min. After washing with tap water, the sections were immersed in 60 % isopropanol for 2 min and stained with 60 % Oil Red O solution (Biosharp Life Science Co., Ltd., Hefei, China) for 10 min. The sections were then destained with 75 % ethanol and washed with water. Hematoxylin solution (Biosharp) was used to counterstain the nuclei for 5 min, followed by differentiation solution (Biosharp) and bluing solution (Biosharp) to optimize the staining contrast. The sections were mounted with glycerin gelatin mounting medium (Biosharp) and examined by an inverted microscope (Olympus Corporation, Tokyo, Japan). The Oil-red O area in the sections was quantified using Image J software (V1.53).
2.12. The mitochondrial permeability transition pore (mPTP) assays
Cells were seeded in six-well plates at a density of 5 × 10⁵ cells/well and treated with drugs for 24 h after attachment. The cells were detached with trypsin (Gibco), centrifuged, counted and resuspended in assay buffer (Beyotime) at a concentration of 1 × 10⁶ cells/mL. The mitochondrial permeability transition pore (MPTP) opening was detected using a MPTP Assay Kit (Beyotime), following the manufacturer's instructions with minor modifications. The following solutions were added into the 1 mL cell suspensions separately according to the groups: (a) 5 μL of Calcein AM staining working solution (1 μM), (b) 5 μL of a mixture of 1 μM Calcein AM and 0.4 mM CoCl2 (Sinopharm), and 5 μL of a mixture of 1 μM Calcein AM, 0.4 mM CoCl2 and 100 μM ionomycin (MedChemExpress). The tubes were incubated in the dark at 37 °C for 30 min. After incubation, the cells were centrifuged at room temperature for 5 min and collected. The cells were washed twice with assay buffer and resuspended in 400 μL of assay buffer. The fluorescence signals of the different groups were measured by flow cytometry (BD Biosciences, San Jose, CA, USA) to indicate the MPTP opening.
2.13. Extracellular flux analysis
Extracellular flux was measured using a Seahorse XF-24 Analyzer (Agilent Technologies Inc., Santa Clara, CA, USA) with a XF Palmitate Oxidation Stress Test Kit (Agilent), following the manufacturer's instructions with minor modifications. Cells were seeded on XF-24 plates at a density of 5 × 10⁴ cells/well and cultured for 24 h. Six hours before the assay, the cells were switched to substrate-limited medium (600 μL/well). Before the measurement, the cells were incubated with FAO Assay Medium (400 μL/well) at 37 °C in a non-CO2 incubator for 45 min. During the assay, palmitate-BSA (PA), BSA, and inhibitors were injected sequentially at the following final concentrations: PA (180 μM) (Shanghai Yuanye Biotech Co., Ltd.), BSA (180 μM) (Sigma-Aldrich), etomoxir (100 μM) (Shanghai Yuanye Biotech Co., Ltd.), DHP-B (5 μM), antimycin A (0.2 μM) (MedChemExpress) and rotenone (0.2 μM) (MedChemExpress). Oxygen consumption rate (OCR) was automatically calculated by the Seahorse XF-24 analyzer software (Agilent).
2.14. QTRP assays
QTRP experiments were performed as previously described [17]. SW620 cells were treated with DMSO or DHP-B for 48 h. The cells were harvested and lysed in protein lysis buffer (Table S2) (Abcam, Cambridge, UK) and the protein concentrations were determined by a BCA protein assay kit (Thermo Fisher Scientific Inc., Waltham, MA, USA). The proteins (1.5 mg) were reduced with DTT (YIFEIXUE Biotechnology Co., Ltd., Beijing, China) and alkylated with iodoacetamide (Bomeibio Technology Co., Ltd., Shanghai, China), and then labeled with IPM (100 μmol/L, Kerafast Inc., Boston, MA, USA) at room temperature for 1 h. The proteins were precipitated by the methanol-chloroform method and digested with trypsin in trypsin digestion buffer (Table S2) containing 1 mol/L urea. The tryptic peptides were desalted by HLB SPE cartridges (Waters Corporation, Milford, MA, USA) and conjugated with isotopically labeled azido-biotin reagents with a photo-cleavable linker (Kerafast) by CuAAC. After CuAAC, the peptides were washed, mixed at a 1:1 ratio of vehicle vs. DHP-B, washed again, and incubated with streptavidin-agarose beads (Thermo Fisher Scientific) in streptavidin binding buffer (Table S2) at room temperature for 2 h with rotation. The beads were washed with washing buffer (Table S2) and exposed to 365 nm UV light for 2 h at room temperature. The beads were centrifuged at 2000×g for 5 min and the supernatant containing the photo-released peptides was concentrated and desalted by C18 stage tips (Thermo Fisher Scientific) and HLB SPE cartridges. The peptides were analyzed by a Q-Exactive Plus Qrbitrap mass spectrometer (Thermo Fisher Scientific). The MS data were processed by pFind 3 software (https://github.com/pFindStudio/pFind3) and an automated post-processing algorithm.
2.15. Microscale thermophoresis (MST) assay
A pcDNA3.1-GFP-CPT1AWT plasmid encoding full-length human CPT1A with a GFP tag was obtained from the Public Protein/Plasmid Library (PPL, Shanghai, China, Table S3). A CPT1AC96A mutant plasmid was generated by site-directed mutagenesis using the QuickMutation Plus Site-Directed Mutagenesis Kit (Beyotime) and the pcDNA3.1-GFP-CPT1AWT plasmid as a template. The primers were synthesized by Sangon Biotech Co., Ltd. (Shanghai, China), and their sequences are listed in Table S3 (Please see Fig. S3 for the sequencing results of plasmid mutation). The plasmids were transfected into 293T cells using Lipofectamine 6000 (Beyotime). The cells were washed with ice-cold PBS and lysed in protein lysis buffer (Beyotime) on ice. The protein concentrations in the cell lysates were determined by BCA assay (Thermo Fisher Scientific Inc., Waltham, MA, USA). The equilibrium dissociation constant (Kd) was measured by microscale thermophoresis using a Monolith NT.115 instrument (NanoTemper Technologies GmbH, Munich, Germany). DHP-B was diluted to different concentrations and incubated with GFP-tagged CPT1AWT or CPT1AC96A mutant proteins (1 mg/mL) in the cell lysates for 15 min. The samples were loaded into glass capillaries and analyzed by the instrument. The Kd values were calculated from triplicate measurements using the mass action equation with the NanoTemper software.
2.16. Cellular thermal shift assays [21]
CETSA was performed as follows: 293T cells were transiently transfected with pcDNA3.1-FLAG-CPT1AWT (PPL, Table S3) or pcDNA3.1-FLAG-CPT1AC96A plasmids using Lipofectamine 6000 (Beyotime) for 48 h according to the manufacturer's instructions. The cells were then treated with DHP-B (5 μM) or DMSO (Sinopharm) for 4 h. The cells were harvested, counted and resuspended in PBS (containing 1 mM PMSF) (Beyotime) at a concentration of 2 × 10⁷ cells/mL. The cell suspension was divided into ten PCR tubes and heated from 37 to 72 °C for 1 min with a temperature gradient. The tubes were snap-frozen in liquid nitrogen and thawed twice, and then centrifuged at 12,000×g for 25 min to collect the supernatant. A 20 μL sample of the supernatant was subjected to SDS-PAGE and Western blotting using anti-FLAG antibody (Sigma-Aldrich Co. LLC, St. Louis, MO, USA). The CETSA curves and the melting temperature at 50 % protein stability (Tm50) were analyzed by GraphPad Prism software (GraphPad Software Inc., San Diego, CA, USA).
2.17. Constructing overexpression and knockdown cell lines
SW620 cells were transduced with lentiviral vectors encoding short hairpin RNAs (shRNAs) targeting CPT1A or a non-targeting control (Table S3). The lentiviral vectors were produced by co-transfecting 293T cells with shRNA plasmids and packaging plasmids using Lipofectamine 6000 (Beyotime). The transduced cells were selected with puromycin (1 μg/mL, Beyotime) for three days. CPT1A expression was verified by western blotting. To re-express CPT1A or its C96A mutant in SW620 cells with CPT1A knockdown, we transduced the cells with lentiviral vectors encoding full-length human CPT1A or CPT1AC96A fused with a puromycin resistance gene (Table S3). The CPT1AC96A mutant plasmid was generated by site-directed mutagenesis using the QuickMutation Plus Site-Directed Mutagenesis Kit (Beyotime) and the wild-type CPT1A plasmid as a template. The primers used for mutagenesis are listed in Table S3. The lentiviral vectors were produced and transduced as described above. The re-expressed cells were selected with puromycin (1 μg/mL, Beyotime) for three days.
2.18. Co-IP pulldown assays
FLAG pulldown assays were performed as follows. SW620 cells stably expressing FLAG-GFP(Table S3), FLAG-CPT1AWT, or FLAG-CPT1AC96A were treated with DMSO (Sinopharm) or DHP-B (5 μM) for 48 h. The cells were washed with ice-cold PBS and lysed in Co-IP lysis buffer (Beyotime) on ice. The cell lysates were centrifuged at 12000×g for 10 min at 4 °C and the supernatant was incubated with BeyoMag™ Anti-Flag Magnetic Beads (Beyotime). The beads were washed twice with cold TBS (Beyotime) and eluted with acid elution buffer (Beyotime). The eluate was neutralized by adding neutralization buffer and mixed well. The eluted proteins were processed in two ways: first, for proteomic identification, the proteins were reduced with DTT (YIFEIXUE Biotechnology Co., Ltd.) and alkylated with iodoacetamide (Bomeibio Technology Co., Ltd., Shanghai, China), and then precipitated by the methanol-chloroform method. The proteins were digested with trypsin in trypsin digestion buffer (Table S2) containing 1 mol/L urea. The digestion was stopped with 0.75 % trifluoroacetic acid (Sinopharm), and the peptides were concentrated by a centrifugal vacuum concentrator (Labconco Corporation) and desalted by C18 stage tips (Thermo Fisher Scientific). The peptides were analyzed by label-free proteomics using a Q-Exactive Plus Qrbitrap mass spectrometer (Thermo Fisher Scientific). The MS data were processed by MaxQuant software (version 1.6.0.1) and statistically analyzed by Perseus software (version 1.6.17.0) as previously described. Second, for Western blot validation, the proteins were mixed with SDS-PAGE loading buffer (Beyotime) and heated at 95 °C for 5 min. The supernatants were subjected to SDS-PAGE and Western blotting using anti-FLAG antibody (Sigma-Aldrich).
2.19. Immunofluorescence (IF) staining
IF staining was performed as follows. Cells on coverslips were fixed with 4 % paraformaldehyde (Sigma-Aldrich) in PBS for 15 min, washed three times, and permeabilized with 0.2 % Triton X-100 (Beyotime) for 20 min. The cells were then blocked with 1 % BSA (Sigma-Aldrich) in PBST (Thermo Fisher Scientific) for 30 min and incubated with primary antibodies (Table S4, diluted 1:200) in the same buffer overnight at 4 °C. After washing three times with PBST, the cells were incubated with secondary antibodies (Table S4, diluted 1:500) for 1 h. The cells were then washed twice and stained with DAPI (Abcam plc, Cambridge, UK) for nuclear counterstaining. The coverslips were mounted and imaged by a Leica TCS SP8 confocal microscope (Leica Microsystems GmbH). Colocalization analysis was performed using Image J software (V2.90/1.53t).
2.20. Western blot
Western blotting was performed as follows. Proteins separated by SDS-PAGE were transferred onto PVDF membranes (Millipore Corporation, Billerica, MA, USA). The membranes were blocked with 5 % BSA (Sigma-Aldrich) in PBS-T (Thermo Fisher Scientific) for 2 h at room temperature, and then incubated with primary antibodies (Table S4, diluted as indicated) in the same buffer overnight at 4 °C. The membranes were washed three times with PBS-T and incubated with secondary antibodies (Table S4, diluted 1:5000) in 5 % BSA in PBS-T for 2 h at room temperature. The membranes were washed five times with PBS-T and the signals were detected by the Super ECL Detection Reagent Kit (Yeasen Biotechnologies Co., Ltd.). The images were captured by the Tanon 5200 Chemiluminescent Imaging System (Tanon Science & Technology Co., Ltd., Shanghai, China) and the signal intensity was quantified by ImageJ software.
2.21. Stastical analysis
All the statistical tests were performed with RStudio (RStudio, PBC, Boston, MA, USA) open-source software (V1.3.959) using the “ggpubr” package (V 0.4.0). Two-tailed Student's t-test or one-way analysis of variance (ANOVA) was applied to determine statistical significance. All data were presented as Mean ± SD or Median ± IQR, and significance was described as follows: ns, not significant, *P < 0.05, **P < 0.01, ***P < 0.001, ****P < 0.0001.
3. Results
3.1. DHP-B inhibits CRC cell growth and triggers apoptosis both in vitro and in vivo
To evaluate the anti-proliferative activity of DHP-B against CRC cells, we first determined the IC50 values of DHP-B for five CRC cell lines (SW620, LS513, HCT116, HT29 and SW480) and normal human colon epithelial cells (NCM460) by CCK-8 assay. The results showed that DHP-B significantly inhibited the proliferation of these five CRC cell lines at concentrations ranging from 1.8 to 6.8 μM, with SW620 cells being the most sensitive, with an IC50 of 1.8 μM. In contrast, DHP-B had a lower toxicity to normal colon epithelial cells (NCM 460), with an IC50 of 97.1 μM. The positive control drug oxaliplatin (OXA) had IC50 values of 2.5–9.3 μM and 29.2 μM for CRC cells and normal colon epithelial cells, respectively (Fig. 1B and C). We also found that the main active moiety of DHP-B was the α-methylene-γ-butyrolactone group, as the removal of this group resulted in a compound Peperomin B (PB) that had a significantly reduced anti-proliferative activity against SW620 cells (Fig. 1D).
To further validate the anti-proliferative activity of DHP-B, we used a three-dimensional tumor spheroid model [22] to observe the effects of DHP-B on CRC cells and normal colon epithelial cells. The results showed that at doses greater than or equal to 4 μM, DHP-B significantly inhibited the growth of SW620 and LS513 spheroids, and reduced their area to less than half of that of the blank control group after six days of treatment. The effects on the other three CRC cell lines and normal colon epithelial cell spheroids were weaker (Fig. 1E, S4). To further evaluate the effect of DHP-B on colorectal cancer cell proliferation, we performed Ki-67 fluorescence staining on 3D cultures of SW620 and HCT116 cell lines, which are sensitive and relatively insensitive to DHP-B, respectively. As shown in Fig. 1F, DHP-B (5 μM) significantly reduced Ki-67 expression in both cell lines, indicating its anti-proliferative activity. Furthermore, we observed that DHP-B was more potent against SW620 cells than HCT116 cells, consistent with the previous data.
In addition to inhibiting proliferation, we also tested the ability of DHP-B to induce apoptosis in CRC cells. By flow cytometry using Annexin V/PI double staining, we found that at a dose of 5 μM, DHP-B significantly induced apoptosis in all five CRC cell lines, with SW620 cells being the most effective, with an apoptosis rate of over 50 %, comparable to OXA. We also observed a dose-dependent induction of apoptosis by DHP-B in SW620 cells (Fig. 1G–H, S4).
To evaluate the anti-CRC effect of DHP-B in vivo, we established an orthotopic CRC model using NSG mice and randomly divided them into three groups, receiving intraperitoneal injections of blank solution, DHP-B (25 mg/kg) or OXA (25 mg/kg), four times a week for two weeks (Fig. 2A). The results showed that compared with the blank control group, both DHP-B and OXA significantly inhibited the growth of SW620 cells in the mouse rectum, as evidenced by a significant reduction in tumor weight. Notably, DHP-B had a better anti-tumor effect than OXA (Fig. 2B). By fluorescence immunohistochemistry analysis, we found that DHP-B significantly reduced the expression of proliferation-related factor Ki-67 in tumor tissues, while significantly increased the expression of pro-apoptotic factor C-CASP3 in tumor tissues. Compared with OXA, DHP-B had a more pronounced effect on upregulating C-CASP3 (Fig. 2C).
Fig. 2.

DHP-B suppresses colorectal cancer cell growth and induces apoptosis in vivo and improves survival of tumor-bearing mice. (A) Schematic illustration of the orthotopic colorectal cancer model and the treatment regimen; (B) Representative images and quantification of tumor weight from different treatment groups; (C) Immunofluorescence staining and quantification of Ki-67 (green) and cleaved caspase-3 (C-CASP3, red) in tumor tissues from different treatment groups (scale bar: 20 μm). The number of Ki-67 or C-CASP3 positive cells were counted using Image J 1.5.3 software. Data are median ± IQR from ten random fields per sample; (D) Kaplan-Meier survival curve of tumor-bearing mice treated with different agents. The blue box indicates the treatment period and the “+” sign denotes censored mice that were euthanized due to 20 % weight loss. The black dashed line represents the median survival time of each group. OXA was used as a positive control. Data are from eight mice per group. The above animal studies were evaluated using eight mice per group, with results reported as median ± IQR; NS, not significant. *P < 0.05, **P < 0.01, ***P < 0.001, unpaired t-test. (For interpretation of the references to color in this figure legend, the reader is referred to the Web version of this article.)
To further evaluate the effect of DHP-B on the survival of model mice, we also used an orthotopic CRC-NSG mouse model and randomly assigned them to three groups, receiving vehicle, DHP-B (25 mg/kg) or OXA (25 mg/kg), four times a week for two weeks. Then we monitored the median survival time of each group of mice (euthanasia was performed when mice exhibited signs of distress or weight loss of 20 %). According to Kaplan-Meier curves, we found that compared with the vehicle control group (median survival time 36 days), both DHP-B and OXA significantly extended the median survival time of mice. More importantly, DHP-B further increased the median survival time (>60 days) of mice, significantly better than OXA (51.5 days, Fig. 2D).
3.2. DHP-B inhibits the proliferation and induces apoptosis of CRC cells by inhibiting the FAO pathway and increasing mitochondrial membrane permeability
To investigate the molecular mechanism of DHP-B in suppressing the proliferation and triggering the apoptosis of CRC cells, we first used RNA-Seq to analyze the transcriptome of SW620 cells treated with DHP-B, and performed GSEA and GO enrichment analysis. GSEA results showed that compared with the vehicle control group, DHP-B significantly downregulated the gene sets related to fatty acid metabolism, such as Fatty acid beta-oxidation, Cellular lipid catabolic process and Fatty acid catabolic process, while significantly upregulated the gene sets related to mitochondrial permeability, such as Permeabilize mitochondria and Mitochondrial transmembrane transport (Fig. 3A). GO enrichment analysis results also corroborated the significant impact of DHP-B on the Fatty acid beta-oxidation pathway (Fig. 3B).
Fig. 3.

DHP-B affects fatty acid oxidation and mitochondrial permeability in colorectal cancer cells. (A) GSEA enrichment analysis of the RNA-seq data of SW620 cells treated with DHP-B, showing the significantly enriched pathways and NES values (P < 0.001); (B) GO enrichment analysis of the RNA-seq data of SW620 cells treated with DHP-B, showing the significantly enriched terms and -Log10P values; (C) Kaplan-Meier survival curves of the transcriptomic expression level of fatty acid oxidation pathway (GOBP_FATTY_ACID_BETA_OXIDATION) and the survival of clinical colorectal cancer patients (TCGA, Firehouse Legacy). The high-expression group (orange) and low-expression group (blue) were divided based on the median value of expressions. The difference between the survival curves was statistically analyzed by log-rank test. (D) Nile red staining and fluorescence confocal microscopy of intracellular fatty acids in SW620 cells in different treatment groups (CTR: DMSO, DHP-B: 5 μM, ETO: 100 μM). The loading phase is the stage of incubation with palmitic acid for 24 h, and the unloading phase is the nutrient restriction stage of culturing with low glucose DMEM medium for 48 h. The ratio of fluorescence intensity in the unloading phase to that in the loading phase is shown; (E) Schematic diagram of the isotope tracing experiment with [U–13C]-palmitic acid (or [U–13C]-myristic acid); (F) U-[13C]-isotopic labeling of long-chain acylcarnitines in SW620 cells. The ratio of labeled (m+1∼m + n) to unlabeled (m+0) long-chain acylcarnitines in SW620 cells treated with different drugs; and the relative abundance of unlabeled (12C) and labeled (13C) long-chain acylcarnitines are shown. Data are median ± IQR from ten random fields per sample. (G) Oxygen consumption rates (OCR) of SW620 cells treated with different drugs assayed with 180 μM BSA-conjugated palmitate (PA, left panel) under basal conditions (middle panel) and in response to FCCP (right panel). Results for maximal OCR are expressed as a percent increase in OCR relative to BSA-treated cells (BSA). Data are mean ± SEM from five independent experiments; (H) Oil red staining and quantification of positive area (quantified by Image J 1.5.3 software) in frozen tumor sections from different treatment groups, ten random fields per sample were counted and averaged; (I) Flow cytometry analysis and quantification of mitochondrial permeability transition pore opening in different drug treatment groups, Iono is an abbreviation for Ionomycin, Co2+ is an abbreviation for CoCl2, and the relative fluorescence intensity of Calcein AM detected (compared to CTR) percentage to evaluate the permeability of mitochondria after drug treatment. All of the studies above were examined using at least five biological replicates, and the results were expressed as mean ± SD(if different, it has been mentioned before); NS, not significant, *P < 0.05, **P < 0.01, ***P < 0.001, and ****P < 0.0001, upaired t-test. (For interpretation of the references to color in this figure legend, the reader is referred to the Web version of this article.)
Previous studies have shown that Fatty acid beta-oxidation pathway (FAO) pathway activation enhances CRC cell invasion and metastasis [23]. We performed bioinformatics analysis of transcriptome and clinical data from The Cancer Genome Atlas (TCGA) database (http://gdac.broadinstitute.org/runs/stddata__2016_01_28/data/COADREAD/20160128/) and stratified CRC patients into high and low FAO expression groups based on the median expression value of FAO pathway genes. We found that high FAO expression group had significantly lower overall survival than low FAO expression group (log-rank P value = 0.048, Fig. 3C). This result suggests that FAO pathway expression is a prognostic marker for CRC patients.
To validate the above transcriptome results, we used Nile red staining to detect the effect of DHP-B on lipid droplet accumulation in SW620 cells. The positive control drug Etomoxir (ETO) is a known CPT1A inhibitor that blocks the transport of long-chain fatty acids into mitochondria for FAO [24]. We incubated SW620 cells in culture medium containing palmitic acid (the loading phase), then cultured them in serum-free medium (the unloading phase), and stained lipid droplets with Nile red at different stages and imaged them by confocal microscopy. The results showed that in the unloading phase, the Nile red fluorescence intensity in the vehicle control group cells decreased significantly, indicating that the cells utilized the fatty acids in the lipid droplets for FAO. In contrast, in the DHP-B (5 μM) and ETO (100 μM) treatment groups, the Nile red fluorescence intensity increased significantly, indicating that the metabolism of fatty acids in the cells was inhibited (Fig. 3D). Using the ratio of Nile red fluorescence intensity in the unloading phase to that in the loading phase as an indicator of FAO activity, we found that the ratio in the DHP-B and ETO treatment groups was significantly higher than that in the control group (Fig. 3D), further confirming the inhibitory effect of DHP-B on the FAO pathway.
To investigate the impact of DHP-B on the FAO pathway in SW620 cells, we traced the fate of U-[13C]-palmitate or U-[13C]-myristitate using stable isotope labeling. As shown in Fig. 3E, we measured the 13C incorporation into long-chain acylcarnitines, which are intermediates of FAO. We observed that both DHP-B (5 μM) and ETO (100 μM) significantly decreased the fraction and relative abundance of 13C-labeled palmitoyl-carnitine or myristoyl-carnitine in the total long-chain acylcarnitine pool in treated cells (Fig. 3F), indicating that DHP-B impaired the mitochondrial transport and oxidation of long-chain fatty acids. Using Seahorse Analyzer to measure cell FAO-dependent oxygen consumption rate (OCR), we also found that DHP-B and ETO treatment groups both significantly reduced SW620 cell basal and maximal FAO levels (Fig. 3G), further indicating that DHP-B impaired CRC cell fatty acid oxidation metabolic capacity. To validate the effect of DHP-B on FAO pathway in vivo, we performed Oil Red O staining on tumor sections from orthotopic CRC mouse model. The results showed that compared with the vehicle control group, DHP-B (25 mg/kg) treatment group had a significantly increased Oil Red O staining level in tumor sections, indicating that DHP-B also inhibited fatty acid metabolism in vivo, leading to fatty acid accumulation (Fig. 3H). In addition to blocking FAO pathway, we also found that DHP-B increased mitochondrial membrane permeability in CRC cells, which may be one of the causes for DHP-B-induced apoptosis. We used flow cytometry to detect the effect of DHP-B on mitochondrial permeability in SW620 cells. The results showed that compared with the vehicle control group, DHP-B (5 μM) treatment group significantly reduced the fluorescence intensity of mitochondrial calcium fluorescent probe Calcein AM, indicating that DHP-B increased mitochondrial membrane permeability, resulting in calcium fluorescence leakage from mitochondria (Fig. 3I).
3.3. DHP-B covalently binds to C96 site of CPT1A, a key enzyme regulating FAO pathway, and regulates tumor cell proliferation and apoptosis
To identify the molecular target and binding site of DHP-B, we used a LC-MS/MS-based QTRP method to screen the target proteins and cysteine sites that covalently bind to DHP-B. This method can determine whether covalent binding occurs based on the relative abundance change of target protein peptides containing reactive cysteines in mass spectrometry before and after drug treatment [17]. The experimental procedure is shown in Fig. 4A. In SW620 cells, we detected and identified 1741 peptides containing reactive cysteines, among which only one peptide came from CPT1A protein, and its relative abundance change (RatioH/L value) reached 8.72, much higher than the threshold (5.0) for judging significant covalent binding, suggesting that this peptide covalently bound to DHP-B (Fig. 4B, Table S5). After identification by pFind3 software, this peptide contained the Cys96(C96) site of CPT1A protein, so we tentatively considered that C96 of CPT1A was the covalent binding site of DHP-B (Fig. 4B). CPT1A is a key fatty acid oxidation enzyme that converts long-chain fatty acyl-CoA to long-chain fatty acylcarnitine, which then enters mitochondria for β-oxidation. This is consistent with our previous transcriptome enrichment analysis results that DHP-B affects FAO pathway in CRC cells. To further verify whether the covalent binding of DHP-B to CPT1A C96 site has a concentration-dependent relationship, we measured the RatioH/L value of the peptide containing C96 of CPT1A protein in SW620 cells after treatment with different concentrations of DHP-B. The results showed that as the concentration of DHP-B increased, the RatioH/L value of the peptide containing C96 of CPT1A protein also increased significantly, reaching 36.32, indicating that the covalent binding of DHP-B to CPT1A C96 had a significant concentration dependence (Fig. 4C). To exclude whether DHP-B could also covalently bind to other cysteine sites of CPT1A protein, we detected two other peptides containing cysteines in CPT1A protein, namely peptides containing C304 and C742. The results showed that the RatioH/L values of these two peptides were both less than 5.0, indicating that DHP-B did not have significant covalent binding with them (n = 5, Fig. 4C and D). Therefore, we concluded that C96 of CPT1A was the only covalent binding site of DHP-B.
Fig. 4.

Screening and molecular biological validation of covalent targets of DHP-B against CRC. (A) The proteome from DHP-B or DMSO-treated SW620 cells was tagged with an alkynyl 3-indoleacetic acid (IPM) probe in vitro and digested by trypsin. The peptides were conjugated with Light (L) and Heavy (H) UV cleavable biotin-azide (Az-UV-biotin) reagents, combined and collected using streptavidin beads. Photo-releasing probe-modified peptides for LC-MS/MS analysis and pFind3 post-processing. (B) Distribution of competitive QTRP ratios (RatioH/L) from SW620 reactions with 5 μM or 50 μM of DHP-B (n = 5). A threshold of five-fold or more IPM probe labeling blockage (RatioH/L > 5) marks cysteines that are sensitive to DHP-B, and proteins with the most competitive DHP-B reactivity are named. (C) Representative MS1 profiles for DHP-B-sensitive C96 peptide in CPT1A showing concentration-dependent IPM labeling blockade (n = 5). (D) MS1 spectrum and RatioH/L for active cysteine-containing peptides from the CPT1A protein; among the three peptides only C96 demonstrates activity to 5 μM DHP-B competition (n = 5). The RatioH/L data mean ± SD is provided. (E) MST dose-response curves of GFP-labeled CPT1AWT or CPT1AC96A mutant bound to DHP-B. Dissociation constants (Kd) values were also exhibited (n = 5). (F) CETSA showed the thermal stability of CPT1AWT or CPT1AC96A mutant proteins following treatment with DHP-B (5 μM). Right panel: CETSA curve and the thermal stability to reach 50 % of temperature (Tm) value was performed using GraphPad Prism software, n = 5, presented as Mean ± SD.
To verify the binding of DHP-B to CPT1A protein and its binding site at the extracellular protein level, we constructed eukaryotic expression plasmids with GFP or FLAG tags for CPT1AWT and CPT1AC96A respectively, and transfected them into 293T cells. We used two methods to detect the binding of DHP-B to CPT1A protein. The first one was MST method [25], which used MST technique to measure the affinity between fluorescently labeled target CPT1A protein (GFP-tagged) and DHP-B in cell lysate. The results showed that by fitting the curve of MST signal changes of different concentrations of DHP-B interacting with GFP-CPT1AWT protein, we obtained the equilibrium dissociation constant Kd value of 1.62 μM for the affinity between DHP-B and CPT1AWT protein, indicating that DHP-B had good affinity with CPT1AWT protein. However, when the fluorescently labeled protein mutated at C96 (GFP-tagged-CPT1AC96A), its affinity with DHP-B decreased significantly and Kd value could not be calculated. These results confirmed that C96 was the key site for DHP-B's affinity with CPT1A protein (Fig. 4E). The second one was CETSA method, which used the change in thermal stability of target proteins in cells or cell lysates before and after drug treatment to evaluate the direct binding of drugs to target proteins [21]. The results showed that DHP-B could increase the thermal stability of FLAG-CPT1AWT protein expressed in intact cells, making its thermal melting curve significantly shift to the right compared with vehicle group, ΔTm value was 3.35 °C, suggesting that DHP-B could directly bind to CPT1AWT protein in cells. However, when the protein mutated at C96 (FLAG-CPT1AC96A), the thermal melting curve of the target protein before and after DHP-B treatment did not shift significantly, further suggesting that C96 was the key site for DHP-B binding to CPT1A protein (Fig. 4F).
To further verify the role of CPT1A in DHP-B's anti-CRC effect in cellular level, we constructed two SW620 cell lines with knockdown of CPT1A protein respectively (Fig. S5), and treated them with DHP-B (5 μM) or ETO (100 μM), then evaluated their cell proliferation and apoptosis effects. The results showed that compared with control group (Vector_1), both groups of CPT1A stable knockdown cells had significant enhancement in cell anti-proliferation and pro-apoptosis effects (Fig. 5A, C and E), indicating that CPT1A had the function of modulating cell proliferation and apoptosis in SW620 cells. When treated with DHP-B or ETO, these effects did not show significant improvement in CPT1A knockdown cells (Fig. 5A, C and E), further indicating that DHP-B and ETO both achieved anti-tumor effects by inhibiting CPT1A function.
Fig. 5.

CPT1A is the anti-colorectal cancer target of DHP-B at the cellular level. (A) Cell proliferation of SW620 cells with CPT1A knockdown (CPT1AKD−1, CPT1AKD−2) or control (Vector_1) treated with DMSO, DHP-B (5 μM), or ETO (100 μM); (B) Cell proliferation of SW620 CPT1AKD−1 cells stably expressing vector (Vector_2), wild-type CPT1A (CPT1AWT), or C96A mutant CPT1A (CPT1AC96A) treated with different drugs. (C) 3D spheroid growth of SW620 cells with CPT1A knockdown or control treated with different drugs. Representative images and quantification of spheroid area are shown (scale bar: 100 μm); (D) 3D spheroid growth of CPT1AKD−1 SW620 cells stably expressing Vector_2, CPT1AWT, or CPT1AC96A treated with different drugs. Representative images and quantification of spheroid area are shown (scale bar: 100 μm); (E) Cell apoptosis of SW620 cells with CPT1A knockdown or control (left panel) or SW620 CPT1AKD−1 cells stably expressing CPT1AWT, or CPT1AC96A (right panel) treated with different drugs. Representative flow cytometry plots and quantification of apoptotic cells are shown; (F) Cell proliferation (left), 3D spheroid growth (middle), and cell apoptosis (right) of SW620 cells treated with DMSO, DHP-B, ETO, or their combination, respectively. Representative images, flow cytometry plots, and quantification are shown. Scale bar, 100 μm. All of the studies above were examined using at least five biological replicates, and the results were expressed as mean ± SD; NS, not significant, *P < 0.05, **P < 0.01, ***P < 0.001, and ****P < 0.0001, upaired t-test.
To confirm that C96 of CPT1A was the binding site for DHP-B, we stably expressed either wild-type CPT1A (CPT1AWT) or CPT1A with a C96A mutation (CPT1AC96A) in aforementioned SW620 cells with CPT1A knockdown (CPT1AKD−1) (Fig. S5). We then assessed the effects of DHP-B (5 μM) or ETO (100 μM) on cell proliferation and apoptosis in these cells. As shown in Fig. 5B and D, re-expression of either CPT1AWT or CPT1AC96A significantly increased the proliferation of SW620 cells under both 2D and 3D culture conditions. Treatment with DHP-B or ETO markedly reduced the proliferation of cells expressing CPT1AWT under both culture conditions, whereas treatment with DHP-B had no significant effect on the proliferation of cells expressing CPT1AC96A, although ETO still inhibited their proliferation. Similarly, re-expression of either CPT1AWT or CPT1AC96A significantly decreased the apoptosis of SW620 CPT1A cells (Fig. 5E). Treatment with DHP-B (5 μM) or ETO (100 μM) markedly increased the apoptosis of cells expressing CPT1AWT, whereas treatment with DHP-B had no significant effect on the apoptosis of cells expressing CPT1AC96A, although ETO still induced their apoptosis. These results demonstrate that CPT1A is the target of DHP-B for suppressing colorectal cancer and that C96 of CPT1A is essential for the binding and activity of DHP-B at the cellular level.
Lastly, we combined DHP-B with ETO and found that the combination treatment group (D + E) had no significant difference in cell anti-proliferation, pro-apoptosis compared with single DHP-B treatment group (Fig. 5F). These results further indicated that DHP-B and ETO acted on the same target CPT1A.
3.4. CPT1A overexpression in CRC correlates with poor prognosis and is a key target for regulating CRC proliferation and apoptosis
We investigated the clinical significance of CPT1A, the target of DHP-B, in CRC using transcriptome data from TCGA_PAN_CANCER_ATLAS [26]. We found that CPT1A expression was significantly higher in CRC patients with lymph node metastasis (N1–N2) than in those without (N0) [27], and positively correlated with the degree of metastasis (Fig. 6A). Moreover, high CPT1A expression was associated with lower median survival (6.61 vs 8.89 months, P = 0.029, Fig. 6A), indicating poor prognosis for CRC patients.
Fig. 6.

Mechanistic study of CPT1A regulating the proliferation and apoptosis of CRC cells. (A) Gene expression of CPT1A and its association with patient lymph node metastasis (left panel) and Kaplan-Meier curve survival prognosis analysis (right patients) of colorectal cancer patients (based on TCGA PAN CANCER ATLAS data), N0 indicates no lymph node metastasis (n = 339), N1 indicates 1–3 lymph node metastases (n = 141), N2 indicates 4 or more lymph node metastases (n = 110); (B) Western blot showing CPT1A protein levels in different colorectal cancer cells; (C) Correlation analysis of CPT1A protein levels and 3D tumor spheroid area; and (D) sensitivity to DHP-B (left panel) or ETO (,right panel) in different cell lines. The confidence interval (blue scale) was calculated using Pearson's correlation with confidence interval under the “ggscatter” function in the “ggplot2” package of Rstudio. Data are mean from five independent experiments; (E) Isotope tracing experiment with [U–13C]-palmitic acid (or [U–13C]-myristic acid) in SW 620 cells with CPT1A knockdown, showing the ratio of labeled (m+1∼m + n) to unlabeled (m+0) long-chain acylcarnitines; and the relative abundance of unlabeled and U-[13C]-labeled long-chain acylcarnitines; (F) Nile red staining combined with fluorescence confocal microscopy to observe the accumulation of intracellular fatty acids in SW620 cells before and after CPT1A knockdown (left panel), statistical results are the ratio of fluorescence intensity in the unloading phase to that in the loading phase (right panel, n = 5). (G–H) Oxygen consumption rates (OCR) of SW620 CPT1A knockdown cells assayed with 180 μM BSA-conjugated palmitate (G) under basal conditions (H, left panel) and in response to FCCP (H, right panel). Results for maximal OCR are expressed as a percent increase in OCR relative to BSA-treated cells. Graphs show mean ± SEM, n = 5. (I) Flow cytometry detection of mitochondrial permeability transition pore detection results before and after SW620 CPT1A knockdown, using the percentage of relative fluorescence intensity of Calcein AM detected (compared to CoCl2 group or DMSO group) to evaluate the permeability of mitochondria after drug treatment. All of the studies above were examined using at least five biological replicates, and the results were expressed as mean ± SD or mentioned otherwise; NS, not significant, *P < 0.05, **P < 0.01, ***P < 0.001, and ****P < 0.0001, upaired t-test. (For interpretation of the references to color in this figure legend, the reader is referred to the Web version of this article.)
To determine the role of CPT1A in CRC growth, we compared the expression and activity of CPT1A in orthotopic tumors derived from two CRC cell lines with different responses to DHP-B: SW620 (sensitive) and HCT116 (relatively insensitive). We used immunohistochemistry and fluorescence imaging to measure CPT1A expression and Ki-67 staining in tumor sections from NCG mice. As shown in Fig. S6, SW620 tumors expressed higher levels of CPT1A and formed larger and heavier orthotopic tumors than HCT116 tumors. In addition, SW620 tumors showed higher fluorescence intensity of Ki-67 than HCT116 tumors, indicating higher proliferation rates. These results demonstrate that CPT1A expression and function are associated with CRC tumor growth in vivo. At the cellular level, CPT1A protein expression was also significantly higher in CRC cells than in normal human colon epithelial cells (Fig. 6B), especially in SW620 cells derived from lymph node metastasis of CRC patients. Using a 3D cell spheroid proliferation assay, we observed a strong positive correlation between CPT1A expression and tumor spheroid growth (R = 0.93, P = 0.007, Fig. 6C), as well as between CPT1A expression and DHP-B or ETO sensitivity in CRC cell lines (P = 0.004, R = 0.95 for DHP-B; P = 0.02, R = 0.88 for ETO, Fig. 6D). These results suggest that CPT1A is aberrantly overexpressed in CRC cells and promotes cell proliferation.
We further examined the molecular mechanism of CPT1A in regulating proliferation and apoptosis in CRC cells using shRNA-mediated knockdown of CPT1A in SW620 cells. We performed metabolic and functional analyses on these cells and found that CPT1A knockdown significantly reduced the metabolism of long-chain fatty acids U-[13C]-palmitate or U-[13C]-myristitate (Fig. 6E); increased the intracellular accumulation of fatty acids and lipid droplets (Fig. 6F); and decreased the basal and maximal palmitate-dependent oxygen consumption rate (OCR) (Fig. 6G and H), indicating that CPT1A modulated the FAO in CRC cells. Moreover, CPT1A knockdown increased the cell mitochondrial permeability, suggesting that CPT1A also influenced cell apoptosis by regulating cell mitochondrial permeability (Fig. 6I).
To validate the role of CPT1A in CRC cell proliferation and apoptosis in vivo, we established an orthotopic CRC mouse model using NSG mice. We observed that CPT1A knockdown (CPT1AKD−1) significantly inhibited tumor growth and reduced tumor weight compared to the control group (Vector, Fig. 7A). We also performed fluorescent immunohistochemistry on tumor tissues and detected a significant decrease in the expression of the proliferation marker Ki-67 and a significant increase in the expression of the pro-apoptotic factor C-CASP3 after CPT1A knockdown (Fig. 7B), confirming that CPT1A regulated tumor proliferation and apoptosis in CRC tissues. Furthermore, we performed oil red O staining on tumor sections and found that CPT1A knockdown increased the oil red staining level, indicating that CPT1A impaired fatty acid metabolism and caused fatty acid accumulation in CRC cells in vivo (Fig. 7C). Finally, we assessed the effect of CPT1A expression on mouse survival (euthanasia when animals showed pain/or weight loss by 20 %). We found that CPT1A knockdown significantly prolonged the painless median survival time of mice (>60 days) compared to the control group (39 days, P = 0.05), as shown by the Kaplan-Meier plot in Fig. 7D. These results demonstrate that CPT1A expression in CRC directly affects its proliferation and apoptosis in vivo, as well as the survival and prognosis of the mouse model.
Fig. 7.

CPT1A regulates CRC cell growth and survival in vivo. (A) Representative images and quantification of tumor weights of rectal tumors derived from SW620 cells with or without CPT1A knockdown (Vector and CPT1AKD−1, respectively). (B) Fluorescence immunohistochemistry of Ki-67 (green) and C-CASP3 (red) expression, markers of cell proliferation and apoptosis, respectively, in tumor tissues with or without CPT1A knockdown (scale bar, 20 μm). Quantification of Ki-67 and C-CASP3 expression levels in different tumor tissues are shown in the boxplots. The expression ratios of Ki-67 and C-CASP3 were measured using Image J 1.5.3 software, and 10 random microscopic fields were counted and averaged for each sample; (C) Oil red O staining of lipid droplets in frozen tumor sections with or without CPT1A knockdown. Quantification of oil red O positive area ratios in different tumor tissues are shown in the boxplots. The positive area of oil red O was measured using Image J 1.5.3 software, and 10 random microscopic fields were counted and averaged for each sample; (D) Kaplan-Meier survival curve of NCG mice bearing orthotopic tumors derived from SW620 cells with or without CPT1A knockdown. The blue box represents the period of drug administration and the “+” sign denotes animals that did not perish but had a 20 % weight loss and were humanely euthanized. The black dashed line represents the median survival time of model animals. The animal studies were evaluated using seven mice per group, with results reported as median ± IQR; NS, not significant. *P < 0.05, **P < 0.01, ***P < 0.001, unpaired t-test. (For interpretation of the references to color in this figure legend, the reader is referred to the Web version of this article.)
3.5. DHP-B disrupts the interaction of CPT1A with VDAC1, increases mitochondrial membrane permeability, and induces apoptosis in CRC cells
CPT1A is involved in FAO metabolism, providing energy and biosynthetic precursors for tumor growth, as well as modulating certain signaling pathways or transcription factors, such as AMPK, mTOR, HIF-a, that affect tumor cell proliferation, migration and epithelial-mesenchymal transition [27,28]. However, in this study, we also observed that CPT1A had a key role in regulating apoptosis of CRC cells. We hypothesized that CPT1A might interact with other proteins on the mitochondrial membrane and regulate mitochondrial membrane permeability, thereby influencing the mitochondrial-mediated apoptosis pathway.
To identify the potential mechanism of CPT1A in regulating mitochondrial membrane permeability, we performed a mass spectrometry-based co-immunoprecipitation (Co-IP) experiment to screen the proteins that interact with CPT1A. The experimental procedure is shown in Fig. 8A. By LC-MS/MS analysis of FLAG antibody-pulled down proteins bound to CPT1AWT, we detected many significantly enriched proteins (-Log10P > 1.5, Log2 enrichment>2) in SW620 cells (Fig. 8B, Table S6), including VDAC1, a key protein that controls mitochondrial membrane permeability. VDAC1 is a protein located on the outer mitochondrial membrane, which forms a voltage-dependent ion channel that regulates the material exchange and signal transduction between mitochondria and cytosol [29]. Under mitochondrial stress, VDAC1 can oligomerize and form a large pore (meta-pore) that releases mitochondrial substances into the cytosol, such as Cyto C, thereby triggering the downstream apoptotic program [[30], [31], [32], [33]].
Fig. 8.

Identification and validation of VDAC1 as a key binding partner of CPT1A that regulates CRC cell apoptosis. (A) Schematic diagram of the MS-based CO-IP pulldown screening protocol; (B) Volcano plots showing the differential protein enrichment between anti-FLAG Co-IP and isotype control Co-IP (n = 3). The cutoff criteria for enrichment factor were log2 = 2 (4-fold enrichment) and -log10 (t-test P-value) = 1.5. FLAG-CPT1AWT or FLAG-CPT1AC96A are highlighted in green, and mitochondrial proteins are marked in blue; (C) Western blot analysis of the interacting proteins of FLAG-GFP(GFP), FLAG-CPT1AWT, or FLAG-CPT1AC96A in SW620 cells treated with DMSO or DHP-B (5 μM) for 24 h. Representative blots are shown, indicating the specific interaction of VDAC1 with CPT1A, which was significantly reduced by DHP-B treatment. The CPT1AC96A mutant protein also interacted specifically with VDAC1, but this interaction was not affected by DHP-B treatment; (D) Fluorescence microscopy images of the co-localization of CPT1A (purple) and VDAC1 (green) on mitochondria (red) in SW620 cells before and after DHP-B treatment (5 μM) (left panel). The white arrow points to the statistical cross-sectional area of co-localization of CPT1A and VADC1 proteins. The Pearson's R value of the fluorescence signals of CPT1A and VDAC1 before and after DHP-B treatment was calculated and quantified using the Coloc 2 plugin in Image J to determine the level of co-localization between them (right panel). All above experiments were performed with at least five biological replicates, and the results were expressed as Median ± IQR or otherwise stated; NS, not significant, *P < 0.05, **P < 0.01, ***P < 0.001, and ****P < 0.0001, unpaired t-test. (For interpretation of the references to color in this figure legend, the reader is referred to the Web version of this article.)
To examine the effect of DHP-B on the interaction partners of CPT1A in SW620 cells, we performed the same immunoprecipitation experiment after 12 h of compound treatment. We observed that DHP-B treatment abolished the enrichment of VDAC1 protein in the Co-IP experiment in the control group. However, when we used CPT1AC96A mutant protein, which lacks the key amino acid residue for covalent binding of DHP-B to CPT1A, we did not detect a significant reduction in the interaction between VDAC1 and CPT1A by DHP-B treatment (Fig. 8B, Table S6), suggesting that DHP-B specifically inhibited the binding of CPT1A to VDAC1 via C96. We further validated the MS-based Co-IP results by Western blot. In the FLAG tag-based protein pulldown experiment, we detected a strong signal of VDAC1 protein in SW620 cells expressing FLAG-CPT1AWT, indicating that CPT1A formed a complex with VDAC1 at the cellular level, and that their interaction was significantly disrupted by 5 μM dose of DHP-B; but this inhibitory effect was not evident in SW620 cells expressing FLAG-CPT1AC96A mutant protein (Fig. 8C). Moreover, we used immunofluorescence co-localization to visually observe the co-localization of CPT1A (purple) and VDAC1 (green) on mitochondria (red) before and after DHP-B treatment. The results are shown in Fig. 8D. Using Image J's Coloc 2 plugin for protein co-localization analysis (using Pearson's R value as indicator), we found that DHP-B treatment significantly reduced the co-localization of CPT1A and VDAC1 on mitochondria. These results confirmed that DHP-B disrupted the interaction of CPT1A and VDAC1 on the outer mitochondrial membrane in CRC cells, preventing the formation of CPT1A-VDAC1 complex.
To investigate the effect of DHP-B-mediated disruption of CPT1A-VDAC1 complex on mitochondrial membrane permeability and cell apoptosis, we used cross-linker EGS (Sigma-Aldrich) to stabilize VDAC1 oligomers and analyzed VDAC1 molecular weight by gel electrophoresis and immunoblotting (Fig. 9A) [[32], [33], [34]]. We found that 5 μM DHP-B treatment increased the VDAC1 protein oligomers in SW620 cells (see long exposure image), indicating that VDAC1 underwent significant oligomerization after DHP-B treatment (Fig. 9B). This phenomenon also occurred in two stable transfection cell lines with CPT1A knockdown (Fig. 9C, long exposure image), further indicating that CPT1A regulated the oligomerization of this mitochondrial membrane protein by interacting with VDAC1. The oligomerization of VDAC1 induced by CPT1A knockdown did not show significant enhancement after DHP-B treatment (Fig. S7), further indicating that DHP-B induced VDAC1 oligomerization in a CPT1A-dependent manner.
Fig. 9.

DHP-B targets the CPT1A-VDAC1 axis, induces VDAC1 oligomerization, and triggers CRC cell apoptosis. (A) Schematic diagram of the mechanism by which DHP-B inhibits the binding of CPT1A and VDAC1, induces VDAC1 oligomerization, increases mitochondrial membrane permeability, promotes the release of cytochrome C from mitochondria, and leads to tumor cell apoptosis; (B) Immunoblot analysis of the oligomerization of purified VDAC1 after treatment with DHP-B and the cross-linking reagent EGS to stabilize the oligomers during electrophoresis (left panel). The positions of VDAC1 monomers (Mono), dimers (Di), tetramers (Tetra) and multimers (Multi) are indicated. Quantification of oligomers is shown in the right panel; (C) Immunoblot analysis of the oligomerization of VDAC1 in SW620 cells with or without CPT1A knockdown (Vector and CPT1AKD−1, respectively) after treatment with DHP-B. The positions of VDAC1 monomers (Mono), dimers (Di), tetramers (Tetra) and multimers (Multi) are indicated (left panel). Quantification of oligomers is shown in the right panel; (D&F) Western blot analysis of the expression levels of cytochrome C (Cyto C), CASP9, cleaved CASP9 (C-CASP9, 39&37 kDa), CASP3 and cleaved CASP3 (C-CASP3, 17 kDa) proteins in SW620 cells after treatment with DHP-B (5 μM); (E&G) Western blot analysis of the expression levels of Cyto C, CASP9, C-CASP9, CASP3 and C-CASP3 proteins in SW620 cells after CPT1A knockdown; (H) Schematic diagram summarizing the mechanism by which DHP-B inhibits CRC cell proliferation and induces apoptosis by targeting CPT1A. All experiments were performed with at least five biological replicates, and the results were expressed as mean ± SD or otherwise stated; NS, not significant, *P < 0.05, **P < 0.01, ***P < 0.001, and ****P < 0.0001, unpaired t-test.
VDAC1 oligomerization increased the mitochondrial membrane permeability, which was also observed in SW620 cells treated with DHP-B or CPT1A knockdown. This increased membrane permeability resulted in the release of Cyto C from the mitochondrial intermembrane space into the cytosol [[32], [33], [34]]. The release of Cyto C is a critical step of cell apoptosis, which triggers the formation of apoptosome by binding to caspase 9. The apoptosome activates caspase 9, which in turn activates other caspases, such as caspase 3, thereby inducing cell apoptosis [35]. To test this, we measured the expression of Cyto C in the cytosol of SW620 cells after DHP-B treatment. The results are shown in Fig. 9D&F. DHP-B (5 μM) treatment significantly increased the expression of Cyto C in the cytosol, as well as the activation of caspase 9 and caspase 3, as indicated by the increased expression of their cleaved forms, suggesting that cells underwent caspase-dependent apoptosis. Similarly, we assessed the expression and activation of Cyto C, caspase 9 and caspase 3 in two CRC cells with CPT1A knockdown. The results were consistent with the DHP-B treatment group (Fig. 9E&G), further confirming that CPT1A regulated VDAC1 oligomerization, Cyto C release, and cell apoptosis by interacting with VDAC1 (Fig. 9H).
4. Discussion
In this paper, we report a novel natural drug-like lead compound DHP-B with potent anti-CRC activity in vitro and in vivo. This molecule covalently modifies Cys96 of CPT1A on the mitochondrial outer membrane of CRC cells, blocks the FAO pathway, induces intracellular fatty acid accumulation, impairs energy metabolism for tumor cells, and inhibits cell proliferation. Moreover, DHP-B triggers tumor cell apoptosis by disrupting the interaction of CPT1A-VDAC1 and increasing mitochondrial permeability. Furthermore, we identify CPT1A as a novel anti-CRC target, which is aberrantly overexpressed in maglignant CRC cells, modulates tumor cell proliferation, apoptosis, and directly influences the survival of tumor-bearing animals.
Firstly, this study reports a mechanism by which DHP-B selectively and covalently binds to Cys96 of CPT1A, as revealed by QTRP proteomics screening and validated at cellular and molecular levels. We believe that DHP-B recognizes a unique pocket surrounding Cys96 of CPT1A and forms a covalent bond with this residue. This strategy is reminiscent of other small molecules that achieve selective covalent inhibition of their targets [36]. Conversely, cysteine residues in other proteins may be inaccessible or incompatible with DHP-B due to spatial or conformational factors, thus avoiding unwanted covalent interactions. Furthermore, the lipophilic nature of DHP-B enables its translocation across the mitochondrial membrane and its engagement with Cys96 of CPT1A, which is located on the membrane surface. This leads to the modulation of CPT1A activity and downstream effects. However, the molecular details of DHP-B and CPT1A binding require further elucidation by obtaining their co-crystal structure in future studies.
Secondly, this study extends the understanding of the role of CPT1A in CRC based on previous studies. CPT1A is a key enzyme involved in FAO, which is frequently overexpressed in various cancers, such as liver cancer, nasopharyngeal carcinoma, breast cancer, ovarian cancer, and so on [[37], [38], [39], [40], [41]]. The high expression of CPT1A may be associated with tumor cell growth, metastasis and resistance, as well as with tumor clinical stage and prognosis [[42], [43], [44]]. For CRC patients, recent studies have shown that the increased gene copy number and protein overexpression of CPT1A in tumor tissues correlate with clinical pathological parameters especially prognosis, suggesting that it may serve as a molecular marker and therapeutic target for CRC [27,45]. We demonstrated that CPT1A can significantly regulate CRC cell proliferation by facilitating FAO and providing energy and metabolic intermediates for cells in vitro and in vivo.
More importantly, this study first revealed that CPT1A can also regulate mitochondrial membrane permeability by binding and interacting with VDAC1 protein on the mitochondrial outer membrane of tumor cells. VDAC1 is a pore-forming channel protein located on the mitochondrial outer membrane, which mediates the transport of substances and ions between mitochondria and cytoplasm [30]. VDAC1 has also been reported to be involved in mitochondrial-mediated apoptosis, modulating mitochondrial membrane potential or cytochrome c release by oligomerization or interacting with Bcl-2 family proteins [31]. VDAC1 plays a vital role in various diseases, including neurodegenerative diseases and cancer [32,46]. We showed that when CPT1A was covalently inhibited or knocked down, the oligomerization degree of VDAC1 increased, leading to increased mitochondrial outer membrane permeability, cytochrome c release into the cytoplasm, and markedly elevated cell apoptosis level. Therefore, we propose that the binding between CPT1A and VDAC1 may be an important regulatory mechanism for CPT1A on CRC cell apoptosis.
This study also provides a theoretical rationale and experimental support for the potential application and preclinical development of DHP-B as an anti-CRC agent, as well as new insights for targeting CPT1A and its regulated FAO metabolism as a target and pathway for CRC treatment. Currently, there are few known inhibitors of CPT1A, among which the most prominent one is ETO, which has been used in clinical trials for treating heart failure and type 2 diabetes [12], and has exhibited anti-tumor effects in some in vitro and in vivo cancer models [47,48]. However, this compound requires a high dose for cancer treatment and has considerable hepatotoxicity, and has not yet entered clinical research. Therefore, developing a novel highly efficient and low toxic CPT1A inhibitor for cancer treatment is an urgent challenge. DHP-B is the first discovered covalent inhibitor of CPT1A, which has the advantages of high potency, reducing the effective concentration and dose compared to ETO; and prolonged action time, due to covalent binding resulting in low dissociation rate of drug-target complex or requiring protein turnover to restore activity. A preliminary toxicity evaluation study in normal mice has shown that, at the effective doses reported in this paper, DHP-B has no significant effect on body weight and no obvious toxicity to vital organs including liver and kidney, whereas the same dose of ETO significantly reduces animal weight (Fig. S8). This suggests that DHP-B has a better safety profile than ETO. However, the current research on DHP-B is still in the early stage, and there are still some limitations and challenges that need to be addressed, such as the selectivity, stability, water solubility, pharmacokinetics, oral bioavailability (Table S7), toxicity, and efficacy of DHP-B in different CRC subtypes and stages, as well as the possible resistance mechanisms and combination strategies of DHP-B with other anti-CRC agents. Therefore, further studies are needed to optimize the structure and properties of DHP-B, and to evaluate its therapeutic potential and safety in more comprehensive and rigorous preclinical models and clinical trials.
5. Conclusions
In conclusion, this study showed by experiments that CPT1A is a viable therapeutic target for CRC, and DHP-B is its novel covalent inhibitor with potent anti-CRC activity in vitro and in vivo. In the future, novel covalent inhibitors of CPT1A such as DHP-B may offer new treatment options for CRC patients, especially for those who are resistant or refractory to conventional chemotherapy and other targeted therapies. Moreover, DHP-B may also be used in combination with other drugs to achieve synergistic or additive effects. However, DHP-B still requires more preclinical and clinical studies to confirm its safety and efficacy, as well as to determine its optimal dosage and indications. Furthermore, it is still necessary to further elucidate the regulatory mechanism and signaling pathway of CPT1A in CRC, as well as its correlation and interaction with other molecular markers such as KRAS, BRAF, MSI and so on, in order to provide more evidence for personalized treatment.
Author contributions
XW, AH designed experiments and obtained funding. AH, HW, QX, YP, ZJ, SL, YQ and XW conducted experiments and analyzed the data. YH assisted in performing the flow cytometry experiments. XW and AH wrote the manuscript. HW reviewed and commented on the manuscript.
Declaration of competing interest
The authors declare that they have no known competing financial interests or personal relationships which have or could be perceived to have influenced the work reported in this article.
Acknowledgments
This work was supported by grants from the National Natural Science Foundation of China (82074067).
Footnotes
Supplementary data to this article can be found online at https://doi.org/10.1016/j.redox.2023.102959.
Appendix A. Supplementary data
The following are the Supplementary data to this article.
Data availability
Data will be made available on request.
References
- 1.Schreuders Eline H., Ruco Arlinda, Rabeneck Linda, Schoen Robert E., Sung Joseph J.Y., Graeme P Young, Kuipers Ernst J. Colorectal cancer screening: a global overview of existing programmes. Gut. 2015;64:1637. doi: 10.1136/gutjnl-2014-309086. [DOI] [PubMed] [Google Scholar]
- 2.Siegel R.L., Miller K.D., Goding Sauer A., Fedewa S.A., Butterly L.F., Anderson J.C., Cercek A., Smith R.A., Jemal A. Colorectal cancer statistics, 2020, CA. A Cancer Journal for Clinicians. 2020;70:145–164. doi: 10.3322/caac.21601. [DOI] [PubMed] [Google Scholar]
- 3.Biller L.H., Schrag D. Diagnosis and treatment of metastatic colorectal cancer: a review. JAMA. 2021;325:669–685. doi: 10.1001/jama.2021.0106. [DOI] [PubMed] [Google Scholar]
- 4.Punt C.J.A., Koopman M., Vermeulen L. From tumour heterogeneity to advances in precision treatment of colorectal cancer. Nat. Rev. Clin. Oncol. 2017;14:235–246. doi: 10.1038/nrclinonc.2016.171. [DOI] [PubMed] [Google Scholar]
- 5.Sainero-Alcolado L., Liaño-Pons J., Ruiz-Pérez M.V., Arsenian-Henriksson M. Targeting mitochondrial metabolism for precision medicine in cancer. Cell Death Differ. 2022;29:1304–1317. doi: 10.1038/s41418-022-01022-y. [DOI] [PMC free article] [PubMed] [Google Scholar]
- 6.Bergers G., Fendt S.-M. The metabolism of cancer cells during metastasis. Nat. Rev. Cancer. 2021;21:162–180. doi: 10.1038/s41568-020-00320-2. [DOI] [PMC free article] [PubMed] [Google Scholar]
- 7.Currie E., Schulze A., Zechner R., Walther T.C., Farese R.V. Cellular fatty acid metabolism and cancer. Cell Metabol. 2013;18:153–161. doi: 10.1016/j.cmet.2013.05.017. [DOI] [PMC free article] [PubMed] [Google Scholar]
- 8.Guertin D.A., Wellen K.E. Acetyl-CoA metabolism in cancer. Nat. Rev. Cancer. 2023;23:156–172. doi: 10.1038/s41568-022-00543-5. [DOI] [PMC free article] [PubMed] [Google Scholar]
- 9.Mana M.D., Hussey A.M., Tzouanas C.N., Imada S., Millan Y.B., Bahceci D., Saiz D.R., Webb A.T., Lewis C.A., Carmeliet P. High-fat diet-activated fatty acid oxidation mediates intestinal stemness and tumorigenicity. Cell Rep. 2021;35 doi: 10.1016/j.celrep.2021.109212. [DOI] [PMC free article] [PubMed] [Google Scholar]
- 10.Boese A.C., Kang S. Mitochondrial metabolism-mediated redox regulation in cancer progression. Redox Biol. 2021;42 doi: 10.1016/j.redox.2021.101870. [DOI] [PMC free article] [PubMed] [Google Scholar]
- 11.Chen Y., Li P. Fatty acid metabolism and cancer development. Sci. Bull. 2016;61:1473–1479. [Google Scholar]
- 12.Schlaepfer I.R., Joshi M. CPT1A-mediated fat oxidation, mechanisms, and therapeutic potential. Endocrinology. 2020;161:bqz046. doi: 10.1210/endocr/bqz046. [DOI] [PubMed] [Google Scholar]
- 13.Bacci M., Lorito N., Smiriglia A., Morandi A. Fat and furious: lipid metabolism in antitumoral therapy response and resistance. Trends in Cancer. 2021;7:198–213. doi: 10.1016/j.trecan.2020.10.004. [DOI] [PubMed] [Google Scholar]
- 14.Yoon H., Shaw J.L., Haigis M.C., Greka A. Lipid metabolism in sickness and in health: emerging regulators of lipotoxicity. Mol. Cell. 2021;81:3708–3730. doi: 10.1016/j.molcel.2021.08.027. [DOI] [PMC free article] [PubMed] [Google Scholar]
- 15.Fragasso G., Salerno A., Spoladore R., Cera M., Montanaro C., Margonato A. Effects of metabolic approach in diabetic patients with coronary artery disease. Curr. Pharmaceut. Des. 2009;15:857–862. doi: 10.2174/138161209787582093. [DOI] [PubMed] [Google Scholar]
- 16.Rejhová A., Opattová A., Čumová A., Slíva D., Vodička P. Natural compounds and combination therapy in colorectal cancer treatment. Eur. J. Med. Chem. 2018;144:582–594. doi: 10.1016/j.ejmech.2017.12.039. [DOI] [PubMed] [Google Scholar]
- 17.Fu L., Li Z., Liu K., Tian C., He J., He J., He F., Xu P., Yang J. A quantitative thiol reactivity profiling platform to analyze redox and electrophile reactive cysteine proteomes. Nat. Protoc. 2020;15:2891–2919. doi: 10.1038/s41596-020-0352-2. [DOI] [PubMed] [Google Scholar]
- 18.Kasashima H., Duran A., Cid-Diaz T., Muta Y., Kinoshita H., Batlle E., Diaz-Meco M.T., Moscat J. Mouse model of colorectal cancer: orthotopic co-implantation of tumor and stroma cells in cecum and rectum. STAR Protocols. 2021;2 doi: 10.1016/j.xpro.2021.100297. [DOI] [PMC free article] [PubMed] [Google Scholar]
- 19.Tatenaka Y., Kato H., Ishiyama M., Sasamoto K., Shiga M., Nishitoh H., Ueno Y. Monitoring lipid droplet dynamics in living cells by using fluorescent probes. Biochemistry. 2019;58:499–503. doi: 10.1021/acs.biochem.8b01071. [DOI] [PubMed] [Google Scholar]
- 20.Kamphorst J.J., Fan J., Lu W., White E., Rabinowitz J.D. Liquid chromatography–high resolution mass spectrometry analysis of fatty acid metabolism. Anal. Chem. 2011;83:9114–9122. doi: 10.1021/ac202220b. [DOI] [PMC free article] [PubMed] [Google Scholar]
- 21.Jafari R., Almqvist H., Axelsson H., Ignatushchenko M., Lundbäck T., Nordlund P., Molina D.M. The cellular thermal shift assay for evaluating drug target interactions in cells. Nat. Protoc. 2014;9:2100–2122. doi: 10.1038/nprot.2014.138. [DOI] [PubMed] [Google Scholar]
- 22.Costa E.C., Moreira A.F., de Melo-Diogo D., Gaspar V.M., Carvalho M.P., Correia I.J. 3D tumor spheroids: an overview on the tools and techniques used for their analysis. Biotechnol. Adv. 2016;34:1427–1441. doi: 10.1016/j.biotechadv.2016.11.002. [DOI] [PubMed] [Google Scholar]
- 23.Wang Y., Zeng Z., Lu J., Wang Y., Liu Z., He M., Zhao Q., Wang Z., Li T., Lu Y., Wu Q., Yu K., Wang F., Pu H.-Y., Li B., Jia W., shi M., Xie D., Kang T., Huang P., Ju H., Xu R. CPT1A-mediated fatty acid oxidation promotes colorectal cancer cell metastasis by inhibiting anoikis. Oncogene. 2018;37:6025–6040. doi: 10.1038/s41388-018-0384-z. [DOI] [PubMed] [Google Scholar]
- 24.O'Connor R.S., Guo L., Ghassemi S., Snyder N.W., Worth A.J., Weng L., Kam Y., Philipson B., Trefely S., Nunez-Cruz S., Blair I.A., June C.H., Milone M.C. The CPT1a inhibitor, etomoxir induces severe oxidative stress at commonly used concentrations. Sci. Rep. 2018;8:6289. doi: 10.1038/s41598-018-24676-6. [DOI] [PMC free article] [PubMed] [Google Scholar]
- 25.Jerabek-Willemsen M., André T., Wanner R., Roth H.M., Duhr S., Baaske P., Breitsprecher D. MicroScale thermophoresis: interaction analysis and beyond. J. Mol. Struct. 2014;1077:101–113. [Google Scholar]
- 26.Nawy T. A pan-cancer atlas. Nat. Methods. 2018;15:407. doi: 10.1038/s41592-018-0020-4. 407. [DOI] [PubMed] [Google Scholar]
- 27.Hou J., Guo C., Lyu G. Clinical significance of epithelial–mesenchymal transition typing of circulating tumour cells in colorectal cancer. Colorectal Dis. 2020;22:581–587. doi: 10.1111/codi.14927. [DOI] [PubMed] [Google Scholar]
- 28.Qu Q., Zeng F., Liu X., Wang Q.J., Deng F. Fatty acid oxidation and carnitine palmitoyltransferase I: emerging therapeutic targets in cancer. Cell Death Dis. 2016;7 doi: 10.1038/cddis.2016.132. e2226. [DOI] [PMC free article] [PubMed] [Google Scholar]
- 29.Shoshan-Barmatz V., De Pinto V., Zweckstetter M., Raviv Z., Keinan N., Arbel N. VDAC, a multi-functional mitochondrial protein regulating cell life and death. Mol. Aspect. Med. 2010;31:227–285. doi: 10.1016/j.mam.2010.03.002. [DOI] [PubMed] [Google Scholar]
- 30.Shoshan-Barmatz V., Mizrachi D., Keinan N. In: Progress in Molecular Biology and Translational Science. Giraldo J., Ciruela F., editors. Academic Press; 2013. Chapter eleven - oligomerization of the mitochondrial protein VDAC1: from structure to function and cancer therapy; pp. 303–334. [DOI] [PubMed] [Google Scholar]
- 31.Shimizu S., Narita M., Tsujimoto Y., Tsujimoto Y. Bcl-2 family proteins regulate the release of apoptogenic cytochrome c by the mitochondrial channel VDAC. Nature. 1999;399:483–487. doi: 10.1038/20959. [DOI] [PubMed] [Google Scholar]
- 32.Shoshan-Barmatz V., Ben-Hail D., Admoni L., Krelin Y., Tripathi S.S. The mitochondrial voltage-dependent anion channel 1 in tumor cells. Biochim. Biophys. Acta Biomembr. 2015;1848:2547–2575. doi: 10.1016/j.bbamem.2014.10.040. [DOI] [PubMed] [Google Scholar]
- 33.Ben-Hail D., Shoshan-Barmatz V. VDAC1-interacting anion transport inhibitors inhibit VDAC1 oligomerization and apoptosis. Biochim. Biophys. Acta Mol. Cell Res. 2016;1863:1612–1623. doi: 10.1016/j.bbamcr.2016.04.002. [DOI] [PubMed] [Google Scholar]
- 34.Shoshan-Barmatz V., Keinan N., Abu-Hamad S., Tyomkin D., Aram L. Apoptosis is regulated by the VDAC1 N-terminal region and by VDAC oligomerization: release of cytochrome c, AIF and Smac/Diablo. Biochim. Biophys. Acta Bioenerg. 2010;1797:1281–1291. doi: 10.1016/j.bbabio.2010.03.003. [DOI] [PubMed] [Google Scholar]
- 35.Zhu Y., Li M., Wang X., Jin H., Liu S., Xu J., Chen Q. Caspase cleavage of cytochrome c1 disrupts mitochondrial function and enhances cytochrome c release. Cell Res. 2012;22:127–141. doi: 10.1038/cr.2011.82. [DOI] [PMC free article] [PubMed] [Google Scholar]
- 36.Boike L., Henning N.J., Nomura D.K. Advances in covalent drug discovery. Nat. Rev. Drug Discov. 2022;21:881–898. doi: 10.1038/s41573-022-00542-z. [DOI] [PMC free article] [PubMed] [Google Scholar]
- 37.Ren M., Xu H., Xia H., Tang Q., Bi F. Simultaneously targeting SOAT1 and CPT1A ameliorates hepatocellular carcinoma by disrupting lipid homeostasis. Cell Death Discovery. 2021;7:125. doi: 10.1038/s41420-021-00504-1. [DOI] [PMC free article] [PubMed] [Google Scholar]
- 38.Du Q., Tan Z., Shi F., Tang M., Xie L., Zhao L., Li Y., Hu J., Zhou M., Bode A. PGC1α/CEBPB/CPT1A axis promotes radiation resistance of nasopharyngeal carcinoma through activating fatty acid oxidation. Cancer Sci. 2019;110:2050–2062. doi: 10.1111/cas.14011. [DOI] [PMC free article] [PubMed] [Google Scholar]
- 39.Han S., Wei R., Zhang X., Jiang N., Fan M., Huang J.H., Xie B., Zhang L., Miao W., Butler A.C.-P. CPT1A/2-mediated FAO enhancement—a metabolic target in radioresistant breast cancer. Front. Oncol. 2019;9:1201. doi: 10.3389/fonc.2019.01201. [DOI] [PMC free article] [PubMed] [Google Scholar]
- 40.Huang D., Chowdhury S., Wang H., Savage S.R., Ivey R.G., Kennedy J.J., Whiteaker J.R., Lin C., Hou X., Oberg A.L. Multiomic analysis identifies CPT1A as a potential therapeutic target in platinum-refractory, high-grade serous ovarian cancer. Cell Reports Medicine. 2021;2 doi: 10.1016/j.xcrm.2021.100471. [DOI] [PMC free article] [PubMed] [Google Scholar]
- 41.Han J., Qu H., Han M., Ding Y., Xie M., Hu J., Chen Y., Dong H. MSC-induced lncRNA AGAP2-AS1 promotes stemness and trastuzumab resistance through regulating CPT1 expression and fatty acid oxidation in breast cancer. Oncogene. 2021;40:833–847. doi: 10.1038/s41388-020-01574-8. [DOI] [PubMed] [Google Scholar]
- 42.Wang J., Xiang H., Lu Y., Wu T., Ji G. The role and therapeutic implication of CPTs in fatty acid oxidation and cancers progression. Am. J. Cancer Res. 2021;11:2477. [PMC free article] [PubMed] [Google Scholar]
- 43.Tan Z., Zou Y., Zhu M., Luo Z., Wu T., Zheng C., Xie A., Wang H., Fang S., Liu S. Carnitine palmitoyl transferase 1A is a novel diagnostic and predictive biomarker for breast cancer. BMC Cancer. 2021;21:1–16. doi: 10.1186/s12885-021-08134-7. [DOI] [PMC free article] [PubMed] [Google Scholar]
- 44.Tian T., Lu Y., Lin J., Chen M., Qiu H., Zhu W., Sun H., Huang J., Yang H., Deng W. CPT1A promotes anoikis resistance in esophageal squamous cell carcinoma via redox homeostasis. Redox Biol. 2022;58 doi: 10.1016/j.redox.2022.102544. [DOI] [PMC free article] [PubMed] [Google Scholar]
- 45.Lin D., Zhang H., Liu R., Deng T., Ning T., Bai M., Yang Y., Zhu K., Wang J., Duan J. iRGD‐modified exosomes effectively deliver CPT1A siRNA to colon cancer cells, reversing oxaliplatin resistance by regulating fatty acid oxidation. Mol. Oncol. 2021;15:3430–3446. doi: 10.1002/1878-0261.13052. [DOI] [PMC free article] [PubMed] [Google Scholar]
- 46.Shoshan-Barmatz V., Nahon-Crystal E., Shteinfer-Kuzmine A., Gupta R. VDAC1, mitochondrial dysfunction, and Alzheimer's disease. Pharmacol. Res. 2018;131:87–101. doi: 10.1016/j.phrs.2018.03.010. [DOI] [PubMed] [Google Scholar]
- 47.Pike L.S., Smift A.L., Croteau N.J., Ferrick D.A., Wu M. Inhibition of fatty acid oxidation by etomoxir impairs NADPH production and increases reactive oxygen species resulting in ATP depletion and cell death in human glioblastoma cells. Biochim. Biophys. Acta Bioenerg. 2011;1807:726–734. doi: 10.1016/j.bbabio.2010.10.022. [DOI] [PubMed] [Google Scholar]
- 48.Yao C.-H., Liu G.-Y., Wang R., Moon S.H., Gross R.W., Patti G.J. Identifying off-target effects of etomoxir reveals that carnitine palmitoyltransferase I is essential for cancer cell proliferation independent of β-oxidation. PLoS Biol. 2018;16 doi: 10.1371/journal.pbio.2003782. [DOI] [PMC free article] [PubMed] [Google Scholar]
Associated Data
This section collects any data citations, data availability statements, or supplementary materials included in this article.
Supplementary Materials
Data Availability Statement
Data will be made available on request.