
Figure 5. 1H-15N spectra of WT human γS-crystallin.
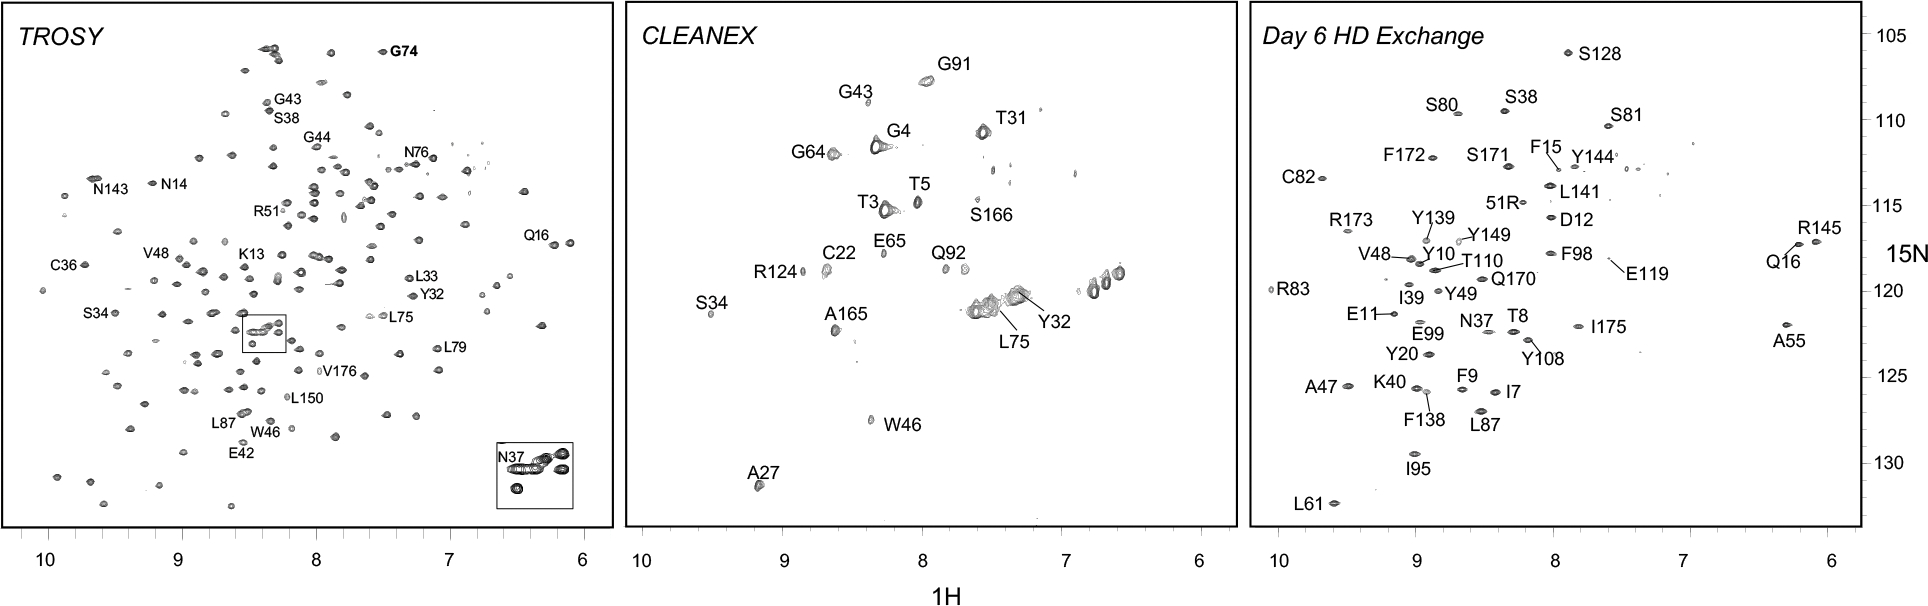
TROSY (left), CLEANEX (middle), and TROSY after 6 days H/D exchange (right). Peaks that shift significantly in N14D or N76D are labeled on WT TROSY and shifts are visualized in Fig. S4. Labeled peaks in CLEANEX and Day 6 H/D exchange spectra are colored pink or blue, respectively, in Fig. 6, and were plotted by normalized peak intensity in Fig. S5.