

Abstract
Background:
Gestational diabetes mellitus (GDM) is a common complication of pregnancy that carries lasting risks. For women who have a history of GDM, the risk of developing type 2 diabetes mellitus (T2DM) increases by 50 to 60%. To monitor and prevent the development of T2DM, guidelines suggest screening those with a history of GDM at 6-weeks and 3-years post-delivery. For patients with abnormal lab results at the 6-week mark, it is advised to complete lab work sooner, at the 1-year mark. Data suggests that these guidelines are not being followed globally, and most do not receive adequate screening for T2DM.
Methods:
A retroactive chart review of 203 women between 18 and 55 years old with a past medical history significant for GDM was conducted to determine if patients with GDM completed screening for T2DM at 6-week, 1-year, and 3-year timestamps post-delivery. Patient demographics (age, race, ethnicity, language), clinical characteristics (body mass index), provider gender, and whether prediabetes or T2DM developed were recorded. Patients who did not complete the required follow-up received educational materials via the online portal system, and hemoglobin A1c (HbA1c) screening tests were ordered.
Results:
Ninety days post-intervention, 38 patients (50%) completed the HbA1c screening test, which exceeded our goal of a 5% improvement. Age and BMI 1-year postpartum were found to be significant factors in whether a patient completed HbA1c screening, with 16/18 (89%) completing screening with a healthy BMI 1-year postpartum (18.5 ≤ BMI < 25.0) but only 11/41 (27%) completing screening for patients under 40 years with an unhealthy BMI 1-year postpartum. Of the 38 patients who completed HbA1c screening, 9 (23.7%) had abnormal screening results.
Conclusion:
Follow-up surveillance for T2DM among women with a history of GDM is poor. Electronic health records can be used to identify and rectify gaps in care. Dissemination of standardized educational materials and electronic order entry for patients improved screening between the handoff from obstetrics to primary care.
Keywords: gestational diabetes, diabetes mellitus, gynecology, health promotion, obstetrics, primary care, quality improvement
Introduction
Gestational diabetes mellitus (GDM) is a disease characterized by elevated blood glucose levels and insulin resistance originating during pregnancy and resolving after delivery. One in ten US pregnancies is affected by GDM. 1 Patients that experience GDM are at greater risk of developing type 2 diabetes mellitus (T2DM) within 5 years post-delivery. 2 T2DM—if not adequately treated in a timely manner—is associated with adverse health effects, including coronary artery disease, peripheral artery disease, chronic renal dysfunction, diabetic retinopathy, diabetic dermopathy, and premature death.2,3 Treatment of women with prediabetes and a history of GDM with metformin and intensive lifestyle therapy can prevent or delay the development of T2D by 35 to 40% at years, with a number that need to be treated between 5 and 6.4,5
Due to the heightened risk, American Diabetes Association (ADA) Standards of Care recommend that all women with a history of GDM be screened or T2D with an oral glucose tolerance test at 4 to 12 weeks postpartum, with continued screening (if the initial screening was negative) completed at a minimum every 3 years. 6 Patients found to have abnormal lab results at that initial screen should be rescreened sooner, at the 1-year postpartum mark. 2 An oral glucose tolerance test is recommended over the hemoglobin A1c (HbA1c) because the HbA1c may not reflect the current state of hyperglycemia or insulin resistance due to pregnancy-associated increases in red blood cell turnover or blood loss that may have occurred during delivery. Follow-up testing, however, can be performed using any of the accepted T2D screening modalities: the oral glucose tolerance test, HbA1c, or fasting plasma glucose.
However, the majority of women with GDM do not receive adequate postpartum care. 6 Moreover, there is a paucity of data on the 1-year and 3-year follow-up care for postpartum GDM. 2 Prior studies have also found marked variation in guideline-concordant GDM follow-up care. Women of Asian descent, those with higher educational attainment, those requiring medication along with diet and exercise to reduce glucose levels, and delivery in a larger hospital were more likely to complete recommended post-GDM screening compared to other populations. 6 Additionally, individuals who had established primary care prior to pregnancy were significantly more likely to complete T2DM screening and primary care at the 1 and 3-year mark. 6
Poor coordination and transition of care from obstetrics to primary care can hinder adherence to follow-up guidelines for patients with a history of GDM. We, therefore, conducted a quality improvement (QI) project to identify at what point postpartum GDM follow-up screening dropped off, identify opportunities to improve guideline adherence for postpartum GDM follow-up care, and implement interventions to facilitate convenient handoff between obstetrics and primary care. Specifically, we aimed to increase recommended diabetes screening among GDM patients by 5%.
Methods
Study Population
Using electronic health records, we retrospectively identified women diagnosed with GDM within Community Internal Medicine (CIM) practices in Olmsted County, Minnesota.
Study Design: Quasi-Experimental Study
Medical records were used to review the charts of 203 women (age 18-55 years old). Baseline characteristics such as patient age at diagnosis of GDM, current age, BMI prior to pregnancy and 1-year post-pregnancy, primary care provider name and gender, number of pregnancies (gravida), number of live births (para), and development of prediabetes or T2DM were collected. Adherence to laboratory testing follow-up at prescribed intervals of 6 weeks, 1 year, and 3 years was recorded along with test results (abnormal vs normal). A one-group pretest-posttest design was used to look at the outcome before and after the intervention. This study was deemed exempt from the Mayo Clinic Institutional Review Board review because it pertained to quality improvement. Results are reported in accordance with the Standards for Quality Improvement Reporting Excellence (SQUIRE) guidelines.
Quality Improvement Intervention
Patients lacking adequate postpartum GDM follow-up care were identified. Patients with online patient portal access were sent an individual message containing educational materials that were available indefinitely with a prompt to schedule a HbA1c test. The educational material defined what gestational diabetes is, causes of gestational diabetes, risks of gestational diabetes, how to take good care of oneself, healthy eating and exercise pearls, and when to get help. The study team placed orders for HbA1c testing for patients without such orders, with results routed to their primary care provider for further follow-up. Patients did not receive any subsequent reminders or follow-up contact.
Data Acquisition and Analysis
All data processing, analysis, and preliminary reporting occurred within R (v4.2.2), 7 with Microsoft Excel used for table formatting. Within R, multiple packages were instrumental in producing results, including dplyr (v1.1.2) 8 for data processing, partykit (v1.2.20)9 -11 for building conditional inference trees, ggparty (v1.0.0) 12 for producing the figures, and modelsummary (v1.4.1) 13 to produce the tables.
To examine factors associated with receipt of guideline-recommended follow-up care, we ascertained and recorded patient demographic, clinical, and treatment information from the electronic health record (Tables 1 and 2). A conditional inference tree was built to evaluate associations between these baseline covariates and the likelihood of completing a scheduled HbA1c test, and a second conditional inference tree was built to evaluate variables associated with the HbA1c test result outcome. The statistical significance of the resulting partitions was examined using a Chi-squared test or a Fisher’s exact test, dependent upon cell sample size. P value < .05 is considered statistically significant.
Table 1.
Patient Characteristics Used for Modeling, Discrete.
| All patients | N (a) | Labs ordered | Labs completed | Result abnormal | |||
|---|---|---|---|---|---|---|---|
| N (b) | % (=b/a) | N (c) | % (=c/b) | N (d) | % (=d/c) | ||
| 203 | 76 | 37.4 | 38 | 50.0 | 9 | 23.7 | |
| Race | |||||||
| Caucasian | 137 | 49 | 35.8 | 24 | 49.0 | 2 | 8.3 |
| Not Caucasian | 66 | 27 | 40.9 | 14 | 51.9 | 7 | 50.0 |
| Ethnicity | |||||||
| Hispanic | 7 | 3 | 42.9 | 0 | 0.0 | 0 | |
| Not Hispanic | 196 | 73 | 37.2 | 38 | 52.1 | 9 | 23.7 |
| Language | |||||||
| English | 197 | 70 | 35.5 | 33 | 47.1 | 6 | 18.2 |
| Non-English | 6 | 6 | 100.0 | 5 | 83.3 | 3 | 60.0 |
| Provider gender | |||||||
| Female | 163 | 60 | 36.8 | 29 | 48.3 | 8 | 27.6 |
| Male | 40 | 16 | 40.0 | 9 | 56.2 | 1 | 11.1 |
| Patient age | |||||||
| 20-24 | 1 | 1 | 100.0 | 0 | 0.0 | 0 | |
| 25-29 | 12 | 3 | 25.0 | 1 | 33.3 | 0 | 0.0 |
| 30-34 | 50 | 12 | 24.0 | 6 | 50.0 | 0 | 0.0 |
| 35-39 | 76 | 35 | 46.1 | 12 | 34.3 | 4 | 33.3 |
| 40-44 | 43 | 15 | 34.9 | 12 | 80.0 | 3 | 25.0 |
| 45-49 | 12 | 3 | 25.0 | 2 | 66.7 | 0 | 0.0 |
| 50+ | 9 | 7 | 77.8 | 5 | 71.4 | 2 | 40.0 |
| Patient age at diagnosis | |||||||
| 20-24 | 9 | 2 | 22.2 | 0 | 0.0 | 0 | |
| 25-29 | 49 | 17 | 34.7 | 8 | 47.1 | 1 | 12.5 |
| 30-34 | 88 | 34 | 38.6 | 18 | 52.9 | 6 | 33.3 |
| 35-39 | 45 | 20 | 44.4 | 9 | 45.0 | 1 | 11.1 |
| 40-44 | 6 | 1 | 16.7 | 1 | 100.0 | 0 | 0.0 |
| 45-49 | 3 | 1 | 33.3 | 1 | 100.0 | 1 | 100.0 |
| Unknown | 3 | 1 | 33.3 | 1 | 100.0 | 0 | 0.0 |
| Prior GDM labs | |||||||
| All normal | 166 | 61 | 36.7 | 30 | 49.2 | 6 | 20.0 |
| Prior abnormal result | 37 | 15 | 40.5 | 8 | 53.3 | 3 | 37.5 |
| Baseline BMI | |||||||
| (0, 18.5) Underweight | 2 | 0 | 0.0 | 0 | 0 | ||
| (18.5, 25) Healthy | 64 | 27 | 42.2 | 16 | 59.3 | 3 | 18.8 |
| (25, 30) Overweight | 44 | 16 | 36.4 | 8 | 50.0 | 2 | 25.0 |
| (30, inf) Obese | 73 | 24 | 32.9 | 7 | 29.2 | 3 | 42.9 |
| Not measured | 20 | 9 | 45.0 | 7 | 77.8 | 1 | 14.3 |
| BMI 1 year postpartum | |||||||
| (18.5, 25) Healthy | 51 | 18 | 35.3 | 16 | 88.9 | 2 | 12.5 |
| (25, 30) Overweight | 48 | 18 | 37.5 | 8 | 44.4 | 2 | 25.0 |
| (30, inf) Obese | 77 | 26 | 33.8 | 8 | 30.8 | 3 | 37.5 |
| Not measured | 27 | 14 | 51.9 | 6 | 42.9 | 2 | 33.3 |
| BMI change | |||||||
| (−9.93, −3.22) | 9 | 2 | 22.2 | 1 | 50.0 | 0 | 0.0 |
| (−3.22, 3.46) | 117 | 40 | 34.2 | 22 | 55.0 | 6 | 27.3 |
| (3.46, 10.1) | 29 | 11 | 37.9 | 3 | 27.3 | 1 | 33.3 |
| (10.1, 16.8) | 2 | 0 | 0.0 | 0 | 0 | ||
| (16.8, 23.5) | 1 | 1 | 100.0 | 0 | 0.0 | 0 | |
| Para | |||||||
| 1 | 50 | 22 | 44.0 | 8 | 36.4 | 2 | 25.0 |
| 2 | 70 | 26 | 37.1 | 18 | 69.2 | 3 | 16.7 |
| 3 | 44 | 17 | 38.6 | 9 | 52.9 | 3 | 33.3 |
| 4 | 15 | 5 | 33.3 | 2 | 40.0 | 0 | 0.0 |
| 5 | 12 | 3 | 25.0 | 1 | 33.3 | 1 | 100.0 |
| 6+ | 12 | 3 | 25.0 | 0 | 0.0 | 0 | |
| Gravida | |||||||
| 1 | 38 | 19 | 50.0 | 8 | 42.1 | 2 | 25.0 |
| 2 | 53 | 18 | 34.0 | 12 | 66.7 | 3 | 25.0 |
| 3 | 41 | 16 | 39.0 | 8 | 50.0 | 1 | 12.5 |
| 4 | 28 | 11 | 39.3 | 4 | 36.4 | 1 | 25.0 |
| 5 | 15 | 8 | 53.3 | 6 | 75.0 | 2 | 33.3 |
| 6+ | 28 | 4 | 14.3 | 0 | 0.0 | 0 | |
| Date of GDM diagnosis | |||||||
| (2002, 2005) | 5 | 5 | 100.0 | 4 | 80.0 | 1 | 25.0 |
| (2005, 2008) | 2 | 1 | 50.0 | 0 | 0.0 | 0 | |
| (2008, 2011) | 13 | 3 | 23.1 | 2 | 66.7 | 1 | 50.0 |
| (2011, 2014) | 14 | 6 | 42.9 | 4 | 66.7 | 0 | 0.0 |
| (2014, 2017) | 28 | 11 | 39.3 | 7 | 63.6 | 4 | 57.1 |
| (2017, 2020) | 70 | 26 | 37.1 | 14 | 53.8 | 2 | 14.3 |
| (2020, 2023) | 67 | 22 | 32.8 | 6 | 27.3 | 1 | 16.7 |
| Date of last postpartum | |||||||
| (2002, 2005) | 5 | 5 | 100.0 | 4 | 80.0 | 1 | 25.0 |
| (2005, 2008) | 2 | 1 | 50.0 | 1 | 100.0 | 0 | 0.0 |
| (2008, 2011) | 4 | 3 | 75.0 | 2 | 66.7 | 1 | 50.0 |
| (2011, 2014) | 7 | 1 | 14.3 | 1 | 100.0 | 0 | 0.0 |
| (2014, 2017) | 11 | 5 | 45.5 | 3 | 60.0 | 1 | 33.3 |
| (2017, 2020) | 62 | 22 | 35.5 | 12 | 54.5 | 2 | 16.7 |
| (2020, 2023) | 107 | 38 | 35.5 | 15 | 39.5 | 4 | 26.7 |
Table 2.
Patient Characteristics Used for Modeling, Continuous.
| All patients | N | All | Labs ordered | Labs completed | Lab result | |||
|---|---|---|---|---|---|---|---|---|
| No | Yes | No | Yes | Normal | Abnormal | |||
| 203 | 127 | 76 | 38 | 38 | 29 | 9 | ||
| Patient age | Mean | 37.57 | 36.97 | 38.57 | 36.95 | 40.18 | 39.59 | 42.11 |
| SD | 5.78 | 5.29 | 6.44 | 5.76 | 6.74 | 6.94 | 6.01 | |
| Min | 23.00 | 25.00 | 23.00 | 23.00 | 29.00 | 29.00 | 35.00 | |
| Q1 | 34.00 | 33.00 | 35.00 | 35.00 | 35.25 | 35.00 | 39.00 | |
| Median | 37.00 | 37.00 | 38.00 | 37.00 | 39.50 | 39.00 | 40.00 | |
| Q3 | 40.50 | 40.00 | 41.25 | 38.75 | 43.00 | 43.00 | 43.00 | |
| Max | 55.00 | 51.00 | 55.00 | 55.00 | 54.00 | 54.00 | 52.00 | |
| Patient age at diagnosis | Mean | 31.92 | 31.76 | 32.20 | 31.55 | 32.86 | 32.57 | 33.78 |
| SD | 4.57 | 4.85 | 4.05 | 4.07 | 3.98 | 3.43 | 5.52 | |
| Min | 20.00 | 20.00 | 22.00 | 22.00 | 26.00 | 26.00 | 28.00 | |
| Q1 | 29.00 | 28.00 | 29.50 | 29.00 | 30.00 | 29.75 | 31.00 | |
| Median | 32.00 | 31.00 | 32.00 | 32.00 | 33.00 | 32.50 | 33.00 | |
| Q3 | 35.00 | 35.00 | 35.00 | 35.00 | 35.00 | 35.00 | 34.00 | |
| Max | 47.00 | 47.00 | 47.00 | 38.00 | 47.00 | 40.00 | 47.00 | |
| Baseline BMI | Mean | 29.20 | 29.74 | 28.27 | 30.26 | 25.95 | 25.34 | 27.70 |
| SD | 7.45 | 7.88 | 6.58 | 7.21 | 4.92 | 4.53 | 5.88 | |
| Min | 17.50 | 17.50 | 19.20 | 19.20 | 19.90 | 19.90 | 20.50 | |
| Q1 | 23.25 | 23.47 | 22.80 | 24.67 | 21.90 | 21.90 | 22.85 | |
| Median | 27.80 | 28.20 | 26.10 | 28.30 | 24.90 | 24.11 | 27.40 | |
| Q3 | 33.50 | 34.95 | 32.60 | 36.60 | 28.85 | 28.00 | 31.77 | |
| Max | 56.80 | 56.80 | 46.00 | 46.00 | 37.20 | 37.20 | 37.20 | |
| BMI 1 year postpartum | Mean | 30.69 | 31.00 | 30.14 | 33.67 | 26.82 | 26.09 | 29.45 |
| SD | 8.08 | 8.47 | 7.35 | 7.48 | 5.52 | 4.89 | 7.17 | |
| Min | 18.50 | 18.50 | 19.10 | 23.40 | 19.10 | 19.10 | 20.80 | |
| Q1 | 24.48 | 24.30 | 24.52 | 27.58 | 22.98 | 22.90 | 25.25 | |
| Median | 28.90 | 29.05 | 28.60 | 32.00 | 24.90 | 24.40 | 27.70 | |
| Q3 | 35.88 | 36.72 | 34.15 | 37.95 | 29.64 | 28.20 | 32.19 | |
| Max | 60.00 | 60.00 | 51.80 | 51.80 | 42.80 | 36.80 | 42.80 | |
| BMI change | Mean | 1.44 | 1.28 | 1.73 | 2.30 | 1.12 | 0.81 | 1.97 |
| SD | 3.66 | 3.45 | 4.04 | 5.19 | 2.20 | 2.24 | 2.00 | |
| Min | -9.90 | -9.90 | -7.20 | -7.20 | -3.30 | -3.30 | 0.08 | |
| Q1 | -0.57 | -0.64 | -0.40 | -0.52 | -0.18 | -0.40 | 0.25 | |
| Median | 1.10 | 0.95 | 1.50 | 2.28 | 0.60 | 0.50 | 2.10 | |
| Q3 | 3.00 | 2.90 | 3.15 | 3.95 | 2.65 | 2.20 | 2.75 | |
| Max | 23.50 | 11.80 | 23.50 | 23.50 | 5.60 | 5.30 | 5.60 | |
| Para | Mean | 2.60 | 2.74 | 2.37 | 2.53 | 2.21 | 2.14 | 2.44 |
| SD | 1.64 | 1.76 | 1.38 | 1.72 | 0.93 | 0.83 | 1.24 | |
| Min | 1.00 | 1.00 | 1.00 | 1.00 | 1.00 | 1.00 | 1.00 | |
| Q1 | 2.00 | 2.00 | 1.00 | 1.00 | 2.00 | 2.00 | 2.00 | |
| Median | 2.00 | 2.00 | 2.00 | 2.00 | 2.00 | 2.00 | 2.00 | |
| Q3 | 3.00 | 3.00 | 3.00 | 3.00 | 3.00 | 3.00 | 3.00 | |
| Max | 12.00 | 12.00 | 8.00 | 8.00 | 5.00 | 4.00 | 5.00 | |
| Gravida | Mean | 3.32 | 3.58 | 2.87 | 3.05 | 2.68 | 2.66 | 2.78 |
| SD | 2.32 | 2.57 | 1.75 | 2.07 | 1.36 | 1.32 | 1.56 | |
| Min | 1.00 | 1.00 | 1.00 | 1.00 | 1.00 | 1.00 | 1.00 | |
| Q1 | 2.00 | 2.00 | 1.75 | 1.00 | 2.00 | 2.00 | 2.00 | |
| Median | 3.00 | 3.00 | 3.00 | 3.00 | 2.00 | 2.00 | 2.00 | |
| Q3 | 4.00 | 4.00 | 4.00 | 4.00 | 3.75 | 3.00 | 4.00 | |
| Max | 17.00 | 17.00 | 9.00 | 9.00 | 5.00 | 5.00 | 5.00 | |
| Date of GDM diagnosis | Mean | 2017.61 | 2018.10 | 2016.79 | 2017.74 | 2015.82 | 2016.17 | 2014.71 |
| SD | 4.51 | 3.87 | 5.34 | 5.20 | 5.37 | 5.38 | 5.50 | |
| Min | 2001.87 | 2006.00 | 2001.87 | 2001.87 | 2003.31 | 2003.31 | 2004.60 | |
| Q1 | 2016.12 | 2016.50 | 2014.61 | 2017.02 | 2013.96 | 2013.83 | 2014.01 | |
| Median | 2018.92 | 2019.19 | 2018.45 | 2018.96 | 2017.45 | 2018.18 | 2014.76 | |
| Q3 | 2020.92 | 2020.95 | 2020.48 | 2021.20 | 2019.58 | 2019.80 | 2018.45 | |
| Max | 2022.88 | 2022.88 | 2022.78 | 2022.78 | 2022.47 | 2022.47 | 2022.11 | |
| Date of last postpartum | Mean | 2019.32 | 2019.94 | 2018.27 | 2019.63 | 2016.94 | 2016.98 | 2016.82 |
| SD | 3.95 | 2.96 | 5.07 | 3.84 | 5.77 | 5.75 | 6.19 | |
| Min | 2003.23 | 2007.75 | 2003.23 | 2003.23 | 2003.47 | 2003.47 | 2004.79 | |
| Q1 | 2018.60 | 2018.93 | 2018.00 | 2018.66 | 2016.00 | 2016.71 | 2015.50 | |
| Median | 2020.38 | 2020.68 | 2020.02 | 2020.59 | 2018.81 | 2018.60 | 2019.85 | |
| Q3 | 2021.85 | 2021.97 | 2021.50 | 2021.85 | 2020.89 | 2020.93 | 2020.34 | |
| Max | 2023.07 | 2023.07 | 2022.91 | 2022.89 | 2022.91 | 2022.91 | 2022.32 | |
Results
We identified 203 women (age 18-55 years old) with GDM between 01/01/2002 to 01/01/2023. We summarize all studied variables in Table 1 below. Additionally, continuous attributes are summarized in Table 2.
Of our cohort, 112 women (55.2%) had received adequate laboratory screening for GDM follow-up at 6 weeks. Eighty-seven (77.7%) performed a 2-h oral glucose tolerance test (OGTT), 17 (15.2%) received a fasting glucose test, and 8 (7.1%) received an HbA1c test. Twenty women (17.9%) had an abnormal lab value at 6 weeks; thus, re-screening one-year postpartum was indicated.
Of 20 women with abnormal initial testing, 14 (70%) had repeat screening at 1 year (2 [10%] were <1 year from birth). Five women (25%) had normal results, and 9 women (45%) had abnormal lab results.
At the end of the study period, 13 (6.4%) had a current diagnosis of T2DM, and 26 (12.8%) have a current diagnosis of prediabetes. Ninety-six women (47.3%) were less than 3 years postpartum. Therefore 107 (52.7%) were analyzed for completion of 3-year screening. Ninety-two women were identified as overdue for screening, and 89 had access to the online portal; thus, messages to all 89 (100%) women and an HbA1c order were sent. 13 patients were excluded from the study due to failing to meet the study requirements due to concurrent pregnancy, relocation out of the study site and lack of opportunity to receive the intervention due to patient-portal non-use, leaving a final cohort of 76 patients. Ninety days post-intervention, 39 patients (51.3%) completed the HbA1c screening test. Nine (23.7%) women had abnormal results; 8 (88.9%) returned in the prediabetes range and 1 (11.1%) in the T2DM range.
Conditional inference modeling revealed that patients younger than 40 with a healthy BMI (18.5—BMI < 25) are most likely to be compliant at the 1-year postpartum follow-up care (P = .001, Bonferroni-corrected for multiple comparisons), Figure 1. They were over 2.3 times more likely (95% CI 1.7, 3.6) to complete labs than those whose BMI did not fall in the healthy range (88.9% for healthy BMI, 37.9% for unhealthy BMI), Figure 1. Of those with an unhealthy BMI one-year postpartum, those under age 40 were 60% less likely (RR = 0.4, 95% CI 0.2, 0.8) to complete labs than those over 40 years old (64.7% for unhealthy BMI and 40+ years, 26.8% for unhealthy BMI and under 40 years), Figure 1. Note that every patient with a test ordered through this intervention falls into either node 3, 4, or 5, with the resulting partition having a P-value of <.0001.
Figure 1.

Labs completed for those with ordered labs, bonferroni-adjusted P-values.
Partition P-value = .000025.
Table 3 shows counts, proportions, and variable statistical significance for each node in the tree. Unadjusted P-values were computed using a Monte Carlo method with all possible variables. Only those variables with P-values less than .10 in any node were included as variables in the final model, and others were excluded from the model. Table 3 shows that a Hispanic ethnicity showed statistical significance in Node 5 (P = .03), which could have been used for an additional split. However, such a split would have resulted in a node with a small sample size, so pre-pruning prevented this split. Also, the Bonferroni-corrected significance is lower than the unadjusted significance in this node for Hispanic ethnicity due to the small sample and Monte Carlo method used in calculating unadjusted significance levels.
Table 3.
Labs Completed Conditional Inference Tree Details.
| Node 1 | Node 2 | Node 3 | Node 4 | Node 5 | |
|---|---|---|---|---|---|
| Counts | |||||
| Labs Completed | 38 | 22 | 11 | 11 | 16 |
| Patient count | 76 | 58 | 17 | 41 | 18 |
| Percent with labs completed | 50.00 | 37.93 | 64.71 | 26.83 | 88.89 |
| Variable P-values: Unadjusted for all variables (Bonferroni-corrected for modeled variables) | |||||
| Healthy BMI 1 year postpartum | 0.0003 (0.0012) | Selected (selected) | Selected (selected) | Selected (selected) | Selected (selected) |
| Age under 40 | 0.0039 (0.0113) | 0.0094 (0.0430) | Selected (selected) | Selected (selected) | 0.4768 (0.7223) |
| Race Caucasian | 1.0000 (excluded) | 1.0000 (excluded) | 1.0000 (excluded) | 0.7254 (excluded) | 0.5304 (excluded) |
| Non-English Speaking | 0.1958 (0.4871) | 0.2858 (0.5243) | Selected (selected) | 0.0490 (0.1133) | 1.0000 (0.9963) |
| Hispanic Ethnicity | 0.2460 (0.4386) | 0.5219 (0.8419) | Selected (selected) | 0.5987 (0.9126) | 0.1083 (0.0277) |
| Provider gender | 0.7737 (excluded) | 0.5057 (excluded) | 0.5974 (excluded) | 0.3169 (excluded) | 0.4053 (excluded) |
| Baseline BMI | 0.0055 (0.0508) | 0.1462 (0.6109) | 0.0093 (0.0446) | 0.6769 (0.9961) | 0.6912 (0.9971) |
| BMI change | 0.3236 (excluded) | 0.5645 (excluded) | 0.8203 (excluded) | 0.5317 (excluded) | 0.7829 (excluded) |
| Date of GDM diagnosis | 0.1212 (excluded) | 0.1634 (excluded) | 0.7579 (excluded) | 0.9934 (excluded) | 0.9095 (excluded) |
| Age at diagnosis | 0.1644 (0.7074) | 0.4525 (0.9637) | 0.9549 (0.9999) | 0.7154 (0.9973) | 0.0789 (0.3588) |
| Date of last postpartum | 0.0201 (0.1418) | 0.0522 (0.3031) | 0.9187 (0.9995) | 0.9922 (1.0000) | 0.9403 (0.9999) |
| Gravida | 0.4014 (excluded) | 0.6839 (excluded) | 0.0733 (excluded) | 0.6309 (excluded) | 0.4164 (excluded) |
| Para | 0.3727 (excluded) | 0.5896 (excluded) | 0.1600 (excluded) | 0.8159 (excluded) | 0.2791 (excluded) |
| Prior labs abnormal | 1.0000 (excluded) | 1.0000 (excluded) | 1.0000 (excluded) | 0.6636 (excluded) | 1.0000 (excluded) |
Patient characteristics associated with abnormal HbA1c results revealed race to be the only predictive attribute (P = .02, Bonferroni-corrected for multiple comparisons), Figure 2. Table 4 depicts counts, proportions, and variable significance for each node in the tree. Patients who identify as Caucasian were 80% less likely (RR = 0.2, 95% CI 0.0, 0.6) to experience abnormal results; 8.3% for Caucasian, 50% for non-Caucasian, Figure 2.
Figure 2.
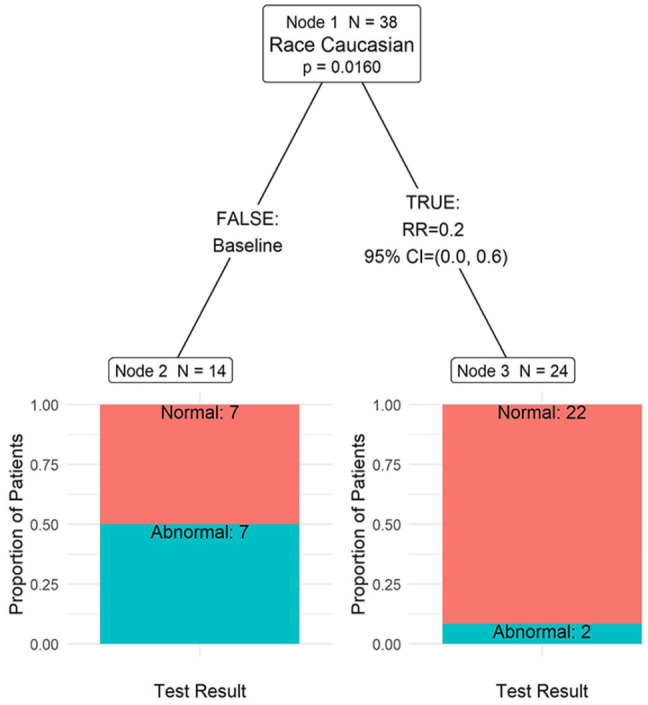
Test result for those with labs completed, bonferroni-adjusted P-values.
Partition P-value = .0063.
Table 4.
Test Result Conditional Inference Tree Details.
| Node 1 | Node 2 | Node 3 | |
|---|---|---|---|
| Counts | |||
| Abnormal test result | 9 | 7 | 2 |
| Patient count | 38 | 14 | 24 |
| Percent with abnormal result | 23.68 | 50.00 | 8.33 |
| Variable P-values: Unadjusted for all variables (Bonferroni-corrected for modeled variables) | |||
| Age | 0.3345 (excluded) | 0.6784 (excluded) | 0.2490 (excluded) |
| Race Caucasian | 0.0076 (0.0160) | Selected (selected) | Selected (selected) |
| Non-English speaking | 0.0749 (0.1617) | 0.5544 (0.5852) | 1.0000 (0.9867) |
| Provider gender | 0.4081 (excluded) | 1.0000 (excluded) | 0.5706 (excluded) |
| Baseline BMI | 0.2557 (excluded) | 0.1936 (excluded) | 0.4150 (excluded) |
| BMI 1-year postpartum | 0.1526 (excluded) | 0.3457 (excluded) | 0.3202 (excluded) |
| BMI change | 0.2441 (excluded) | 0.5512 (excluded) | 0.8197 (excluded) |
| Date of GDM diagnosis | 0.4850 (0.9254) | 0.9224 (0.9995) | 0.0879 (0.2684) |
| Age at diagnosis | 0.4543 (excluded) | 0.5688 (excluded) | 0.8334 (excluded) |
| Date of last postpartum | 0.9464 (1.0000) | 0.5406 (0.9351) | 0.0602 (0.3349) |
| Gravida | 0.8858 (excluded) | 0.8605 (excluded) | 0.4422 (excluded) |
| Para | 0.4252 (excluded) | 0.6416 (excluded) | 0.4190 (excluded) |
| Prior labs abnormal | 0.3582 (excluded) | 1.0000 (excluded) | 1.0000 (excluded) |
Discussion
Development of GDM is associated with similar risk factors to T2DM. 2 With the increasing prevalence of obesity in women of reproductive age, the incidence of GDM has also increased. At least 1 in 10 pregnancies are complicated by GDM, with higher rates among older women, elevated pre-pregnancy BMI, poor diet, lack of exercise, personal or family history of GDM or T2DM, and other metabolic risk factors.1,2
Prior studies suggest that only half of women with GDM will receive postpartum follow-up in the primary care setting, and of those, just 36% will receive blood glucose testing within 3 months of delivery.14,15 In our study, 55.2% (112 of 203) of patients received blood glucose testing within 3 months of delivery, which exceeds the national average of 36.0% at 3 months. 16 However, only 35.5% of women had completed appropriate screening at 3 years, where patients are now older and at increased risk.
Our intervention included manually ordering HbA1c for patients that were due. After ordering HbA1c labs for all 89 overdue patients, there were a total of 38 patients (50.0%) who completed the labs, which exceeded our 5% improvement goal.
Our study showed that older women, an elevated BMI, multiple children, and being non-Caucasian were the greatest drivers of inadequate follow-up and risk. All patients who had completed initial glucose testing identified English as their primary language. In contrast, of the patients who received the intervention of HbA1c orders and patient messages, 6 of these patients did not speak English as their primary language.
There was a linear relationship between age and prevalence of GDM diagnosis. 17 This study’s median age of GDM diagnosis was 32 years of age, which is associated with an increased risk of developing GDM. The median BMI of our cohort was 28.8 kg/m2, which falls within the overweight range. 18 An elevated BMI carries an increased risk of GDM diagnosis. 19 In addition, multiparous females are more likely to develop GDM. 20 The median women in this study had a gravida/para designation of G3P2, signifying that most of the women in this study fall within the multiparous category and, therefore, are also at an elevated risk of developing GDM.
These findings stress the need for intervention, especially for women at higher risk. Our non-English-speaking patients’ communication barriers may also limit adequate GDM education and follow-up. This underscores the importance of ensuring person-centered care, engaging medical interpreters, and frequently providing culturally sensitive and relevant information. To improve the feasibility of this intervention, discharge processes could include an order set built through the EMR to ensure appropriate follow-up is arranged with reminders given at both mother and baby follow-up appointments.
The strengths of this study include that we were able to identify a large number of women with a history of GDM to track screening outcomes and more easily identify possible barriers. The limitations include that our study only took place at 1 institution and that a majority of our patients were Caucasian and English speaking, which reduces the generalizability to more diverse patient populations. Future studies across multiple institutions and more diverse patient populations may reveal additional barriers and needed interventions.
Future areas for improvement could include an automated message within the EMR to alert patients and providers of overdue screening, discharge order sets, patient and primary care provider education, additional support for women at risk, and engaging pediatric practices to ensure not only the baby receives appropriate follow-up, but the mom does too, co-locating adult and pediatric care, and ensuring patient education can be given to diverse patient populations in their preferred language.
Conclusion
Through the implementation and analysis of the interventions, it was found that compliance with screening parameters improved when patients were educated about screening and when orders were placed. This project is the steppingstone in creating universal processes and procedures that will shape the future of care for those with a history of GDM and ultimately help decrease the risk of progression to T2DM.
Footnotes
The author(s) declared the following potential conflicts of interest with respect to the research, authorship, and/or publication of this article: In the last 36 months, Dr. McCoy has received support from the National Institute of Diabetes and Digestive and Kidney Diseases (NIDDK) of the National Institute of Health (NIH), National Institute on Aging (NIA) of the NIH, Patient Centered Outcomes Research Institute (PCORI), National Center for Advancing Translational Sciences (NCATS). She also serves as a consultant to Emmi® (Wolters Kluwer) on developing patient education materials related to diabetes.
Funding: The author(s) received no financial support for the research, authorship, and/or publication of this article.
ORCID iDs: Brittany Strelow  https://orcid.org/0000-0003-4858-3279
Justine Herndon
https://orcid.org/0000-0001-5665-0617
Danielle O’Laughlin
https://orcid.org/0000-0002-2579-2740
References
- 1. Vounzoulaki E, Khunti K, Abner SC, Tan BK, Davies MJ, Gillies CL. Progression to type 2 diabetes in women with a known history of gestational diabetes: systematic review and meta-analysis. BMJ. 2020;369:m1361. [DOI] [PMC free article] [PubMed] [Google Scholar]
- 2. American Diabetes Association. Standards of care in diabetes-2023 abridged for primary care providers. Clin Diabetes. 2022;41(1):4-31. [DOI] [PMC free article] [PubMed] [Google Scholar]
- 3. Alejandro EU, Mamerto TP, Chung G, et al. Gestational diabetes mellitus: a harbinger of the vicious cycle of diabetes. Int J Mol Sci. 2020;21(14):5003. [DOI] [PMC free article] [PubMed] [Google Scholar]
- 4. Aroda VR, Christophi CA, Edelstein SL, et al. The effect of lifestyle intervention and metformin on preventing or delaying diabetes among women with and without gestational diabetes: the Diabetes Prevention Program outcomes study 10-year follow-up. J Clin Endocrinol Metab. 2015;100(4):1646-1653. [DOI] [PMC free article] [PubMed] [Google Scholar]
- 5. Ratner RE, Christophi CA, Metzger BE, et al. Prevention of diabetes in women with a history of gestational diabetes: effects of metformin and lifestyle interventions. J Clin Endocrinol Metab. 2008;93(12):4774-4779. [DOI] [PMC free article] [PubMed] [Google Scholar]
- 6. McCloskey L, Quinn E, Ameli O, et al. Interrupting the pathway from gestational diabetes mellitus to Type 2 diabetes: the role of primary care. Womens Health Issues. 2019;29(6): 480-488. [DOI] [PubMed] [Google Scholar]
- 7. R: A language and environment for statistical computing . R Foundation for Statistical Computing; 2022. https://www.R-project.org/ [Google Scholar]
- 8. dplyr: A Grammar of Data Manipulation ; 2023. https://CRAN.R-project.org/package=dplyr
- 9. Hothorn T, Hornik K, Zeileis A. Unbiased recursive partitioning: a conditional inference framework. J Computat Graph Stat. 2006;15:651-674. [Google Scholar]
- 10. Hothorn T, Zeileis A. Partykit: a modular toolkit for recursive partytioning in R. J Mach Learn Res. 2015;16:3905-3909. [Google Scholar]
- 11. Zeileis A, Hothorn T, Hornik K. Model-based recursive partitioning. J Computat Graph Stat. 2008;17:492-514. [Google Scholar]
- 12. ggparty: ‘ggplot’ Visualizations for the ‘partykit’ Package ; 2019. https://CRAN.R-project.org/package=ggparty
- 13. Arel-Bundock V. Modelsummary: data and model summaries in R. J Statist Softw. 2022;103:1-23. [Google Scholar]
- 14. Bernstein JA, Quinn E, Ameli O, et al. Follow-up after gestational diabetes: a fixable gap in women’s preventive healthcare. BMJ Open Diabetes Res Care. 2017;5:e000445. [DOI] [PMC free article] [PubMed] [Google Scholar]
- 15. McCloskey L, Bernstein J, Winter M, Iverson R, Lee-Parritz A. Follow-up of gestational diabetes mellitus in an urban safety net hospital: missed opportunities to launch preventive care for women. J Womens Health. 2014;23:327-334. [DOI] [PMC free article] [PubMed] [Google Scholar]
- 16. D’Amico R, Dalmacy D, Akinduro JA, et al. Patterns of postpartum primary care follow-up and diabetes-related care after diagnosis of gestational diabetes. JAMA Netw Open. 2023;6: e2254765. [DOI] [PMC free article] [PubMed] [Google Scholar]
- 17. Li Y, Ren X, He L, Li J, Zhang S, Chen W. Maternal age and the risk of gestational diabetes mellitus: a systematic review and meta-analysis of over 120 million participants. Diabetes Res Clin Pract. 2020;162:108044. [DOI] [PubMed] [Google Scholar]
- 18. Nuttall FQ. Body mass index: obesity, bmi, and health: a critical review. Nutr Today. 2015;50:117-128. [DOI] [PMC free article] [PubMed] [Google Scholar]
- 19. Rahnemaei FA, Abdi F, Kazemian E, Shaterian N, Shaterian N, Behesht Aeen F. Association between body mass index in the first half of pregnancy and gestational diabetes: a systematic review. SAGE Open Med. 2022;10:2-3. [DOI] [PMC free article] [PubMed] [Google Scholar]
- 20. Wang R, Chen J, Yao F, et al. Number of parous events affects the association between physical exercise and glycemic control among women with gestational diabetes mellitus: a prospective cohort study. J Sport Health Sci. 2022;11:586-595. [DOI] [PMC free article] [PubMed] [Google Scholar]