

Summary
To address the needs of the life sciences community and the pharmaceutical industry in pre-clinical drug development to both maintain and continuously assess tissue metabolism and function with simple and rapid systems, we improved on the initial BaroFuse to develop it into a fully functional, pumpless, scalable multi-channel fluidics instrument that continuously measures changes in oxygen consumption and other endpoints in response to test compounds. We and several other laboratories assessed it with a wide range of tissue types including retina, pancreatic islets, liver, and hypothalamus with both aqueous and gaseous test compounds. The setup time was less than an hour for all collaborating groups, and there was close agreement between data obtained from the different laboratories. This easy-to-use system reliably generates real-time metabolic and functional data from tissue and cells in response to test compounds that will address a critical need in basic and applied research.
Keywords: BaroFuse, oxygen consumption, lactate production, perifusion, islets, retina, hypothalamus, endothelial cells, hypoxia, liver
Graphical abstract
Highlights
-
•
A pumpless fluidic system for characterization of ex vivo samples
-
•
System utilizes gas pressure to drive flow over tissue samples
-
•
Slow gas-pressure-driven perifusion requires small tissue samples
-
•
O2 sensors and fraction collection resolve secretion, signaling, and metabolic flux
Motivation
There is a critical need for developing in vitro methods that provide mechanistic insight at the tissue and intracellular levels as well as to reduce the need for in vivo studies. Flow culture is recognized as superior to static for both maintenance and assessment of tissue, as static systems are unable to maintain viability of most tissue preparations that are not cellular monolayers. However, technical challenges and a need for increased amounts of biological samples are impediments to their routine use in the majority of laboratories in the life sciences. We have addressed these two issues by developing a simple-to-use flow system that utilizes gas pressure instead of peristaltic or syringe pumps to drive multi-channel microflow. The delivery of steady flow over a wide range of flow rates enables small amounts of tissue to be maintained and assessed.
Kamat et al. develop a fluidics system that measures oxygen consumption, lactate production, cell signaling, and secretion by biological samples. The system is easy to use, and results are reproducible across laboratories, thus accelerating the establishment of powerful flow culture systems as standard laboratory tools in the life sciences.
Introduction
Real-time analysis of tissue/cell response plays a critical role in both basic and applied research and development. Three specifications of an ideal system to study live tissue include (1) maintenance of tissue/cell function and viability, (2) accurate methods to measure multiple pertinent parameters in real time, and (3) precise delivery of test compounds to the biological specimen.1 In all three criteria, flow systems offer distinct advantages over static by supplying adequate oxygenation to primary tissue being assessed,2 where many tissue models, including pancreatic islets, liver, and retina, which are highly energetic, do not remain viable under static culture conditions.3,4,5 We and others have developed fluidics systems that accomplish these goals,1,2,6,7,8,9,10,11,12 but in general, they have only impacted specialized laboratories. Historically, impediments to the wide usage of flow systems include the use of peristaltic pumps, which are cumbersome to set up and operate (involving the assembly of large numbers of parts including pump tubing and connectors), and ensuring the cleanliness of the fluidics system. In addition, peristaltic pumps have relatively high between-channel flow variability, and their minimum flow rate is not low enough to allow for analysis of small amounts of scarce tissue such as islets. Although microfluidics (“tissue on a chip”) shows promise in maintaining 3-dimensional tissue structures,13 this nanotechnology derived from computer chip fabrication has not yet been successful in incorporating real-time assessment and has not penetrated standard research laboratories due in part to the complexity of the systems.14
Accordingly, we have developed the BaroFuse,6,15 a pump-free fluidics system where multi-channel flow is driven by gas pressure provided to a sealed reservoir containing the perifusate (Figure 1). Generating flow by pressurizing the gaseous headspace above the flow culture media delivers very accurate, multi-channel, pulseless flow at a wide range of rates (5–100 μL/min) from a single pressure source while still allowing rapid changes in composition.6 In addition, the concentration of dissolved gases such as CO2 and O2 in the media can be controlled by allowing the gas in the headspace to equilibrate with the perifusate. State-of-the-art, multi-channel O2 sensors generate particularly accurate oxygen consumption rate (OCR) measurements. Notably, the perifusion system allows multi-channel fraction collection for subsequent assays of outflow, providing the ability to measure the kinetic relations between multiple components of intracellular regulation. This powerful combination of real-time sensing and fraction collection allows a wide range of multi-component analyses to be performed, where changes in metabolism and cell signaling induced by exposure to test compounds in turn control secretory function. There are systems to measure metabolic rate and secretory function separately, but there are great advantages to measuring their kinetic responses to test compounds concomitantly on the same tissue.
Figure 1.

Schematic of the 10 individual components of a single-channel BaroFuse system
Tissue is maintained in the tissue chambers (1), which are held in place by the perifusion chamber module (2) under flow culture conditions, where flow is driven through high-resistance tubing by gas pressure in the media reservoir module (3). The OCR is continuously monitored by a downstream detector (4), and outflow media is diverted to either a flow rate detector (5) or a fraction collector (6). Media composition is changed by injection of test compounds (7), and the entire device is housed in a temperature-controlled and optically shielded box (8). Data acquisition and protocol control are by a graphical user interface programmed on a laptop computer (9). Finally, assays such as lactate are measured in the outflow fractions to calculate the rate of production as a function of time. The number of channels is expandable but typically has 8 channels.
We have recently published very detailed procedures, including instructive videos, on how to perform the experiments on tissue of the eye including retina, retinal pigment epithelium (RPE) cell-choroid-sclera, and differentiated RPE cells.15 In this article, we focus on describing a wide range of illustrative examples to demonstrate the versatility of the instrument in its ability to maintain and assess a wide range of tissue and kinetic readouts. Specifically, we describe the pairing of OCR and insulin secretion rate (ISR), of OCR and lactate production rate (LPR), and of OCR and neurotransmitter release. Various protocols including dose responses and response to several combinations of test compounds were performed on a wide range of tissue (including retina, hypothalamus, pancreatic islets, and primary human lung microvascular endothelial [HLME] cells [adhered to culture beads]) to illustrate the versatility of the system. Experiments were performed at different O2 levels to illustrate the system’s ability to perform experiments at different levels of dissolved gas. Finally, accuracy and reproducibility were assessed by comparing the data generated to historical measurements with previously developed flow systems, as well as to experiments performed with the BaroFuse in multiple laboratories across the US. Overall, the relative ease of use (the apparatus can be set up in about 45 min and is ready for loading tissue after 30 additional minutes for the instrument to be reach temperature), the tight control of flow rate and dissolved CO2 and O2 in media, and the scientific need for maintenance and assessment of a wide range of tissue/cell types indicate that the BaroFuse is suitable to become an important and standard tool in life science laboratories.
Results
Establishing times to reach baseline and maintenance of tissue viability by the BaroFuse for retina and islets
The first and foremost specification the BaroFuse must meet is the ability to maintain viability of the perifused tissue during the period that the response to test compounds is evaluated. Although there are potentially many pathways and signals that may be changing after tissue harvesting, OCR and LPR reflect the state of bioenergetic processes, which we used as a global measure of tissue health. Moreover, to accurately resolve changes in response to test compounds, drift in baseline must be much less than the change induced by the test compound. For retina, it took 90 min for the OCR to stabilize following transfer of tissue into the BaroFuse. Following the establishment of the baseline (where time = 0 represented 90 min following loading of the retina), the OCR signal remained constant for the next 3 h, establishing that this period was valid for measuring the response to test compounds (Figure 2A). LPR by the retina was also very invariant. As beta cells (the most abundant cell type in islets) do not export lactate,16 ISR and OCR by islets were measured. When assessing islets, 120 min were needed to reach a flat baseline relative to the small changes in signal obtained for small numbers of islets (time = 0 represented 90 min following loading of the islets into the chambers). Following the establishment of the baseline, islets were stimulated with glucose, and the OCR approached a new steady state (Figure 2B). Glucose-stimulated ISR by islets increased rapidly and then from 30 to 120 min slowly increased, thereafter remaining fairly constant, consistent with the well-established attributes of islet secretory function.17
Figure 2.

Maintenance of retinal and islet metabolism during the experimental period as reflected by OCR and LPR or OCR and ISR
(A) Each channel was loaded with a single isolated mouse retina, and the flow rate was 32 μL/min. The time point at 0 represents 90 min after loading of the tissue followed by 3 h of flat baseline suitable for measuring responses to test compounds. OCR data are the average ± SE (a single experiment was performed with n = 6 channels for OCR and n = 4 channels for LPR after normalizing to the baseline; average of the 7 data points prior to time = 0 for OCR or 5 points for LPR). We only measured lactate in the outflow fractions of 4 of the 6 channels since this was all that was needed to demonstrate baseline stability.
(B) Each channel was loaded with 100 isolated rat islets, and the flow rate was 9 μL/min. The time point at 0 represents 120 min after loading of the tissue into KRB containing 3 mM glucose (Glc) followed by 3 h at 20 mM Glc. OCR data are the average ± SE (a single experiment was performed with n = 5 channels for OCR and n = 3 channels for ISR after normalizing to the baseline; average of the data points prior to time = 0).
Statistical analysis was performed using t tests on steady state values, where the significance was generated by comparing the effect of the agent to the previous treatment period (prior to the exposure to the test compound). Statistical significance was indicated as either p < 0.05, p < 0.01, or p < 0.001
Investigating real-time responses of metabolism, electrophysiology, cell signaling, and neurotransmitter secretion in rat retina vs. hypothalamus
Having established a valid time window where tissue viability is well maintained, the ability of the BaroFuse to resolve and contrast real-time responses in multiple parameters from retina and hypothalamus was demonstrated. Hypothalamus pieces and isolated single retina were harvested from one rat and immediately loaded in tissue chambers of the BaroFuse. After a 90 min baseline period, depolarization of plasma membranes was accomplished by the addition of 25 mM KCl (to increase [K+] from 5 to 30 mM), followed 30 min later with the addition of nimodipine to block L-type calcium channels (Figure 3). The OCR was measured in real time while collecting outflow fractions at 6 min intervals. The next day, the fractions were assayed for lactate, acetylcholine, glutamate, and guanosine 3′,5′-cyclic monophosphate (cGMP), and their rates of production were calculated and graphed. The kinetic increases in the OCR and the production rates of lactate, glutamate, and cGMP were all well resolved, as was the contrasting increase and decrease of acetylcholine production rate with retina and hypothalamus, respectively. The effects of depolarization on the hypothalamus were reversed by nimodipine, suggesting that the effects of depolarization are mediated by L-type calcium channels. The effects of depolarization on retina, however, were not mediated by L-type calcium channels, as nimodipine had little effect on measured parameters by this tissue. These data illustrate the ability of the BaroFuse to reveal tissue-specific responses and very efficiently assess multiple and related parameters.
Figure 3.

Multi-parameter assessment of tissue by the BaroFuse: Retina vs. hypothalamus
OCR and production rates of glutamate, lactate, acetylcholine, and cGMP by retina and hypothalamus (harvested from a single rat) were measured in response to KCl and nimodipine (a specific L-type calcium channel blocker) and plotted as fractional changes relative to the baseline. Retina (1 per channel) and hypothalamus (1/8th of a hypothalamus/channel) were perifused at a flow rate of 62 μL/min for 90 min prior to starting the injection protocol. Rat retina used about twice as much oxygen as mouse retina, and flow rate was increased accordingly. The injections occurred at time = 0 (30 mM KCl) and 30 min (5 μM nimodipine). OCR and production rates were calculated from Equation 1 for lactate, glutamate, cGMP, and acetylcholine and normalized to baseline steady-state values. Statistical analysis was performed using t tests on steady-State values, where the significance was generated by comparing the effect of the agent to the previous treatment period (prior to the exposure to the test compound). All measurements were carried out with n = 2 channels except for OCR for retina, which was done with n = 4 channels. Statistical significance was indicated as either p <0.05 or p <0.01.
Measuring metabolic and insulin secretory function by isolated islets
Insulin secretion elicited by glucose is mediated by metabolic pathways that convert ADP to ATP, thereby activating voltage-dependent calcium channels by the action of KATP channels.18 In contrast, significant potentiation of the ISR by protein kinases has only minor effects on bioenergetics. When studying islet models of insulin secretion in diabetes, it is a common aim to distinguish between fuel-induced and potentiation of the ISR to localize the site of impairment that leads to an inappropriate release of insulin. These two mechanisms can be distinguished with the BaroFuse by carrying out a protocol where glucose stimulation is followed by glucagon-like peptide 1 receptor (GLP1R) agonism and the OCR and ISR are concomitantly measured. The ISR (60 islets/channel at a flow rate of 6.8 μL/min) increased sequentially in response to glucose and a GLP1R agonist (liraglutide), where potentiation of the ISR was nearly twice the increase seen in response to the fuel (Figure 4A). In contrast, the increase in OCR in response to liraglutide was only about 20% of the increase simulated by glucose (Figure 4A), despite eliciting a larger increase in ISR. This example also illustrates that increases in OCR can be well resolved in response to both the glucose and liraglutide using 60 islets/channel due to the ability of the system to operate at low flow rates.
Figure 4.

Response of islet OCR and ISR to slow and fast changes in Glc, and the effect of O2 levels on retinal OCR and LPR
(A) Stimulation by fuel (20 mM Glc) and potentiation by a GLP1R agonist (liraglutide) on OCR and ISR. Rat islets (60 per channel) were loaded into 4 tissue chambers and perifused at 6.7 μL/min/channel for 120 min to establish a steady baseline. Subsequently, Glc was increased for 60 min, followed by an injection of 50 nM liraglutide. OCR and ISR were calculated from Equation 1 in the STAR Methods and normalized to baseline steady-state values.
(B) Resolution of first-phase ISR at faster flow and sampling rates. ISR by 10 islets/channel was measured at 80 μL/min in response to an increase in Glc, followed 45 min later by exposure to 50 nM liraglutide (n = 5).
(C and D) Mouse retina (1/channel) were perifused for 90 min with KRB buffer equilibrated with either 21% (n = 3) or 5% O2 (n = 3). OCR and LPR were measured before and after injecting cGMP and then ouabain (Na-K pump inhibitor) (C). Data were normalized to the baseline to highlight the similar contribution of the Na-K pump to overall OCR at 5% and 21% O2 (D). Flow rate was 23 μL/min, and data demonstrate the average of 3 channels. Statistical significance was calculated as described in the legend of Figure 3.
Of note, the kinetic response of ISR to glucose or other fuels will depend on how fast the flow rate is: slow flow rates such as that needed to measure the OCR (typically 1 μL/min per 10 islets) will generate a ramp-like increase in glucose concentration, which will not result in biphasic secretory response (Figure 4A). In contrast, fast flow rates (above 80 μL/min) will generate biphasic insulin secretion (Figure 4B). Thus, measuring biphasic ISR while measuring OCR is not possible at normal concentrations of dissolved oxygen. If only the ISR is required (and not the OCR), as few as 10 islets per channel are adequate.
Measuring the effect of O2 on retinal metabolism (OCR and LPR)
The adaptation and response to low oxygen is a critical and highly studied aspect of normo- and pathophysiology.19 Most laboratory experiments are done in media that are in equilibrium with atmospheric O2 partial pressure, although dissolved O2 in blood and tissue is about half of that.20 Moreover, under static conditions, dissolved O2 is depleted to unknown and variable levels.21 The BaroFuse allows control of dissolved gas levels by supplying gas pressure to the head space above the perifusate with the desired gas composition. To illustrate this capability, experiments were performed where the head space above the media feeding into channels on one side of the hemi-chamber of the media reservoir was supplied by a gas tank containing 21% O2/5% CO2/balance N2 and where the channels on the other side were supplied with 5% O2/5% CO2/balance N2. The effect of 5% O2 was to decrease the OCR by about 75% relative to the OCR obtained at 21% O2 while increasing the LPR (Figure 4C), a phenomenon known as the Pasteur effect.22 However, the LPR of the lower O2 level was only 20% higher than at 21% O2 and was not statistically significant. Thus, it appears that the OCR is much more sensitive to changes in O2 than the LPR, demonstrating the ability of the system to reveal differences in mechanisms sensing or responding to O2 To illustrate the ability of the system to evaluate metabolic effects at different O2 concentrations, retina were exposed to the blocker of the sodium potassium pump ouabain.23 The magnitude of the decrement in the OCR at low O2 was much smaller than at high O2 (Figure 4C), but expressed as a fraction of the baseline, the observed changes at the two levels of O2 in response to ouabain were similar (Figure 4D), which highlights the utility of displaying the data as fractional changes.
Concentration dependency analysis on cultured cells attached to Cytodex beads and rat liver slices
Many investigators study cell lines cultured as monolayers of single cells, in addition to primary cells cultured as a monolayer of single cells. The BaroFuse can maintain and assess cultured cells by attaching them to collagen-coated Cytodex cell culture beads24 1 day prior to the experiment. On the day of the experiment, the beads coated with cells are pipetted into the tissue chambers and perifused. As an illustrative example, HLME cells attached to beads were loaded into 2 chambers (675,000 cells/chamber) and perifused at 36 μL/min/channel, and their OCR response to sequentially increasing concentrations of an inhibitor of the electron transport chain was measured (Figure 5A). The effects of potassium cyanide (KCN) rapidly reached steady state, and a detailed concentration dependency was determined by sequentially increasing KCN concentrations, yielding a Ki of about 0.6 mM. Despite doing the experiment only in duplicate, all changes in the OCR induced by KCN for retina and HLME except one were statistically significant. Liver is a major source of toxicity for drugs, and the pharmaceutical industry routinely uses cellular models of liver tissue to ascertain drug safety.25 To demonstrate the ability of the BaroFuse to evaluate toxicity in liver, freshly harvested liver slices (6 mg/channel) were loaded into two channels of the BaroFuse (in the same experiment), where the responses to KCN were well resolved even at a concentration of KCN (100 μM) that induced only a 9% decrement in OCR (Figure 5B). The ability to detect small changes is particularly important when evaluating the effects of drugs at pharmacologically relevant blood concentrations that can be significantly lower than the Ki.
Figure 5.

Concentration dependencies of a mitochondrial poison (KCN) on OCR by primary human lung microvascular endothelial (HLME) cells attached to culture beads and rat liver slices, and mitochondrial stress test on HLME cells
(A and B) HLME cells attached to culture beads (675,000 cells/channel) (A) or rat liver slices 2 × 3 mg pieces/channel (B) were loaded into tissue chambers (n = 2 for each tissue type). After perifusing for 90 min at 36 μL/min to establish a stable baseline, KCN in increasing amounts was injected into the perifusate every 30 min as indicated.
(C) HLME cells attached to culture beads (500,000 per channel) were placed in 5 channels and perifused for 90 min at 27 μL/min to establish a stable baseline. Subsequently, oligomycin (Oligo), FCCP, and KCN were injected in series into the perifusate at the indicated times and concentrations. Statistical significance was calculated as described in the legend of Figure 3.
Mitochondrial stress test with human lung endothelial cells
The mitochondrial stress test26,27 is a very common protocol used in assessing mitochondrial capacity and state in cells by exposing samples to oligomycin followed by carbonyl cyanide 4-(trifluoromethoxy)phenylhydrazone (FCCP) and a combination of rotenone and antimycin A. We used the BaroFuse to perform this protocol on human lung endothelial cells (Figure 5C), where KCN was substituted for rotenone and antimycin A. Consistent with cell data obtained by other laboratories using this protocol with Seahorse (Agilent),28,29 the OCR was reduced by oligomycin, increased by FCCP, and finally extinguished in the presence of KCN with a signal-to-noise ratio greater than 200; steady-state values were reached prior to the subsequent addition with a coefficient of variation (CV) of about 3.5%.
Mitochondrial stress tests on retina and islets: Comparison of data generated across 4 different laboratories
A major problem in experimental biology is reproducibility of data and development of gold standards. As such, ease of mastering the procedure and showing agreement between laboratories are paramount. In addition to experiments performed on the BaroFuse in the Sweet laboratory (UW Medicine), separate instruments were shipped and set up at UW Biochemistry, the University of Michigan (U of Michigan), and Harvard University (Harvard U), and during the training/beta-testing period (accomplished by online manuals as well as conference calls), the technical staff generated data with the Mito Stress Test protocol on isolated retina. Feedback by the beta-testing laboratories with respect to usability, technical reliability, and software/data processing needs was addressed by changes in the software and modifications in the physical devices. Although there were differences in the source of the isolated retina (described in the legend of Figure 6), the changes in OCR in response to oligomycin and FCCP were similar for each laboratory (Figure 6). Decrements in the OCR (represented as a percentage of the OCR prior to addition of test compounds) in response to oligomycin fell into a relatively tight range (32%–49%), and the increase in response to FCCP ranged between 95% and 114%. These values are in accordance with previous measurements with retina obtained using a separate fluidics system.30 So, despite differences in the tissue sources (including age and diet), there was good agreement between the laboratories’ results, and all the laboratories captured the intrinsic attribute of retina to have small oligomycin-induced decrements and full recovery of retinal OCR response following FCCP with low standard error.
Figure 6.

Mitochondrial stress tests carried out on isolated mouse retina at 4 centers
(A–D) Mitochondrial stress tests were carried out on isolated mouse retina at (A) UW Medicine, (B) UW Biochemistry, (C) U of Michigan, and (D) Harvard U. Although all retina used at the different sites were harvested from C57BL/6 mice, the ages of the mice were not the same. Age of mice, number of channels (retina) perifused, and flow rate were as follows. UW Medicine: 2 months, (n = 5) and flow rate = 41 μL/min; UW Biochemistry: 4.5 months (n = 6) and flow rate = 30 μL/min; U of Michigan: 14 days post-natal (n = 6) and flow rate = 30 μL/min; Harvard U: 4–5 months (n = 3) and flow rate = 29 μL/min. Other details about the mice are in the key resources table and STAR Methods section. Tissues were perifused for 90 min to establish a stable baseline, and subsequently, Oligo, FCCP, and KCN were sequentially injected into the perifusate at the indicated times. Statistical significance was calculated as described in the legend of Figure 3.
(E) Steady-state (SS) comparisons between mitochondrial stress tests on retina performed at UW Medicine, UW Biochemistry, U of Michigan, and Harvard U. SS values from (A)–(D) were calculated as the final 7 values of each period of exposure and normalized to the baseline value.
In islets (isolated from rats at UW Medicine and from mice at U of Michigan), the response in OCR to increased glucose concentration increased by nearly 2-fold (corresponding to about 0.2 μmol/min/100 islets), consistent with previous measurements.31,32,33,34 In contrast to retina, the decrease of islet OCR in response to oligomycin was larger (56% for rat islets exposed to 10 μM oligomycin at UW and 69% for mouse islets exposed to 15 μM oligomycin at U of Michigan), and the FCCP responses were small and transient (Figure 7), as has been found previously using traditional perifusions powered by peristaltic pumps.35 Overall, despite small differences in experimental conditions and a low number of replicates, good agreement was observed from both islets and retina between the various laboratories.
Figure 7.

Mitochondrial stress tests carried out on isolated islets at UW Medicine and U of Michigan
(A and B) Each channel of the BaroFuse was loaded with 100 islets. (A) UW Medicine used islets from 2-month-old rats (n = 5 channels, flow rate = 9 μL/min), while (B) U of Michigan perifused 4.5-month-old mouse islets (n = 3 channels, 9 μL/min). Tissues were perifused for 120 min to establish a stable baseline at 3 mM Glc, and subsequently, 20 mM Glc, Oligo, FCCP, and KCN were sequentially injected into the perifusate at the indicated times. Statistical significance was calculated as described in the legend of Figure 3.
(C) SS comparisons between mitochondrial stress tests on islets performed at UW Medicine and U of Michigan. SS values from (A) and (B) were calculated as the final 7 values of each period of exposure and normalized to the baseline value.
Discussion
A need for simple fluidics systems in biological studies
Over the years, our laboratory1,2,6,36,37,38 and others7,39,40,41 have published on the design and functionality of fluidic systems (also known as perifusion systems). The advantages of flow systems over static systems with respect to maintaining and assessing tissue viability as well as delivering test compounds is well recognized.21,42,43 Unlike cell monolayers, tissue viability and function are not reliably maintained under static conditions, thereby leading to assessments that may not be representative or accurate. Our current studies and previous publications have shown stability in tissue OCR over hours and even days, supporting the ability of flow systems to maintain viability.38,44 However, flow systems are more difficult to implement and operate, which are major impediments to their widespread use. Thus, the goal of the study was to design and deliver a system that provides all the benefits and features of fluidics but with a quick and simple setup and only a modest investment in equipment and training. The most cumbersome aspect of standard perifusion systems is the use of multi-channel peristaltic pumps that require expensive pump tubing that can crimp, are variable from channel to channel, and do not operate accurately at flow rates below about 20 μL/min. We therefore developed a flow system that does not rely on pumps but rather on gas pressure to drive multi-channel flow (hence the name BaroFuse). The simplicity of the fluidics system allows for a setup time of about 45 min, followed by a 30 min period to let the system equilibrate prior to loading the tissue. With this system, steady flow through an unlimited number of channels is driven by elevated pressure in the head space above the media (supplied by a single pressure regulator) at flow rates ranging from 5 to 100 μL/min/channel with less than 3% variance between channels and drift of flow rate/hour (Figure S1). The low flow rates allow for consumption or production rates to be resolved with small amounts of tissue. Importantly, the composition of the source gas pressure can be selected to meet the needs of the tissue and the conditions of the experimental design. In this article, we illustrated the ability to vary levels of O2 levels and equilibrate the perifusate with 5% CO2, allowing for the use of bicarbonate-based buffers and media. The BaroFuse can maintain and assess a wide variety of tissue/cell models under precise conditions, including examples presented in a previous paper on retina, eyecups, and RPE cells15 and extended in this article to pancreatic islets, liver, hypothalamus, and cells attached to beads with tissues isolated from different animal models.
Assessment of biological samples maintained in the BaroFuse
There are two modes of assessment that the BaroFuse utilizes: optical sensors positioned on the inside of the glass tissue chamber and subsequent analysis of the outflow fractions. In this study, we illustrated the system with an O2-sensitive dye2,45 painted on the inside of tissue near the outflow, while in the future, we envision adding an additional sensor such as for lactate. As mitochondrial capacity and regulation are widely studied and involve numerous aspects of many cell types, a simple instrument to accurately measure the OCR response of tissue/cell to test compounds as well as dissolved gas composition alone will have great impact. In addition, the BaroFuse combines the power of the OCR measurement with measurements of functionally and mechanistically related compounds in the outflow fractions. The ability to resolve the kinetics of multiple parameters from the same preparation is optimal for testing mechanistic relationships between effector compounds, bioenergetics, cell signaling, and secreted hormones/neurotransmitters, and the concept was illustrated in this study with assays of insulin, lactate, glutamate, acetylcholine, and cGMP that were measured in concert with OCR.
Sensitivity and accuracy of OCR and assayed outflow fractions
The ability to resolve small (physiological) changes is a major strength of the BaroFuse. Maximal resolution of observed changes is achieved when data are represented as fractional changes relative to a user-specified baseline or steady-state value at the end of a period of exposure to a particular test compound. By normalizing to a baseline, each channel is its own control, and the variability between the relative changes is typically only a few percent. The signal-to-noise ratio of the measurements depends on the magnitude of the changes in OCR over time relative to the noise associated with error in the O2 detection system and changes in flow rate. The magnitude of the change is dependent on the ratio of OCR to the flow rate; the higher the ratio, the larger the difference between inflow and outflow O2. With a ratio that resulted in a difference between the inflow and outflow of about 20–35 mm Hg O2 (from 142 mm Hg O2), changes induced by glucose for islets, and oligomycin and FCCP for all tissues tested, were resolved with a signal-to-noise ratio of greater than 100. Moreover, a change in OCR of as little as 8% that occurred over the course of 10 min (in response to KCN) was statistically significant, even with small numbers of replicates.
When the goal is to investigate the changes mediated by test compounds, the fractional change is the appropriate calculation. However, when comparing tissue from genetically manipulated animal models and controls, it is appropriate to calculate absolute values and magnitudes of change. Often, the noise associated with these measurements includes the differences in how much biological sample is placed into the tissue channels. To the extent possible, we have found that it is best to load the same amount of tissue to each chamber, which can circumvent the need for normalizing the data from each channel. How to normalize data as a function of the quantity of tissue is a ubiquitous challenge in biology.46 In our studies, for islets and retina, tissue samples are loaded according to their number. When tissue pieces such as liver and hypothalamus are perifused, the tissue sample was weighed or its volume estimated. Other parameters commonly used to normalize data include DNA, RNA, protein, cell number, or ATP.47 Biological samples in each tissue chamber can be obtained after the real-time analysis for subsequent measurement of the normalization parameter that is optimal for the study. In our studies, without normalization, the CV for OCR per retina with 6 separate samples was 23%; for batches of 60 (n = 6) or 100 islets (n = 6), the CV of OCR per number of islets was 14%–18%, where there was no difference in the error for the two amounts of islets/channel loaded. This means that if differences due to treatment of less than about 25% are to be evaluated, more than 6 replicates would be needed.
Since islets are expensive and hard to obtain, the question of how many islets/chamber to use for optimal OCR results is a pertinent one. The number of islets that are needed per channel depends on both the magnitude and the kinetics of the change that is being resolved, as well as the flow rate. In addition, it depends on the number of replicates and the magnitude of differences between control and treated islets (if such a test is being performed). If there are relatively large changes such as in response to reagents used in the Mito Stress Test (oligomycin, FCCP, and rotenone/antimycin A), less islets are needed than if smaller, more physiological changes such as response to a fuel or potentiator of insulin secretion were being studied. We presented data generated from the BaroFuse with 60 (flow rate = 6 μL/min) or 100 islets (flow rate = 9 μL/min), a number of islets that generated optimal data from the instrument without taking too long for the outflow to collect in the fraction collector. If it is desired to use less islets, then the flow rate can be decreased (while the time allowed to reach steady state is increased).
Reproducibility: Similar results obtained from different laboratories
One of the most important challenges facing biologists is reproducing data from other laboratories and even from within their own laboratories. To assess the ability of the BaroFuse to support consistent results between laboratories, the Mito Stress Test was carried out by multiple laboratories. Despite not perfectly controlling for sources of tissue and technical staff generating data during their training period with only single experiments, we observed tissue-specific attributes of retina and islets by each laboratory. These include low decrements in retinal OCR by oligomycin and recovery of OCR in response to uncoupling. Furthermore, islet OCR was characterized by glucose stimulation, large decrements induced by oligomycin, and only a small transient increase in the presence of FCCP. In all tissues/experiments, smooth baselines with low levels of noise were achieved. These data support the robustness of the BaroFuse for experimental determinations of relative changes in response to test compounds, as well as the ability of technicians of various backgrounds and locations to successfully operate the instrument.
Features the fluidics system
We have described a pumpless fluidics system that includes the beneficial attributes accorded by flow culture but with major advantages over traditional perifusion systems. These include a small number of parts for rapid setup time, a significantly decreased lower limit of flow rate to require less tissue, state-of-the-art multi-channel O2 detection, and multi-channel fraction collection. These advantages allow for concomitant real-time changes in multiple factors reflecting secretion, signaling, and metabolism in parallel with OCR. A wide range of protocols can be performed such as dose responses, time courses to determine both acute and chronic effects, and responses to O2 and other dissolved gases. Notably, the sensitivity of the measurements allows for study of the effects of test compounds that induce physiologic levels of perturbations. We predict that the ability to maintain and assess a wide range of tissue and cell models, multiple readouts, versatility for test compound protocols, and ease of use will have great utility in a broad range of investigations.
Limitations of the study
As with any technique, there are limitations to the method that should be kept in mind when designing experiments with the system. Although there are no limits to the number of test compound injections that can injected, the compounds are introduced into a reservoir that then cannot be washed out. This was done to avoid the complications of valves and multiple inflow reservoirs. Regarding the need for optimizing the experimental conditions, we have provided working ranges of tissue amounts, chamber sizes, and flow rates for islets, hypothalamus, liver, and endothelial cells; for other tissue types, investigators will have to determine the tissue to flow rate that yields an adequate decrement in outflow O2 to be well resolved. Likewise, the times it takes to reach steady state with respect to the baseline as well as the maximum duration of the experimental protocol need to be determined for each tissue type and endpoint measurement.
STAR★Methods
Key resources table
| REAGENT or RESOURCE | SOURCE | IDENTIFIER |
|---|---|---|
| Biological samples | ||
| Rat Islets from UW Medicine | Harvested from Male Sprague-Dawley rats (∼250g; Envigo/Harlan) | N/A |
| Mouse Islets from U of Michigan | Harvested from C57BL/6NJ mice, Age = 4.5 months, Jackson Laboratory, Bar Harbor, ME | N/A |
| Rat hypothalamus tissue from UW Medicine | Extracted from adult male Sprague-Dawley rats (n = 1, ∼400g; Envigo/Harlan) | N/A |
| Rat retina tissue from UW Medicine | Harvested from Sprague-Dawley rats (∼250g; Envigo/Harlan) | N/A |
| Mouse retina tissue UW Medicine | Extracted from C57BL/6 mice, Jackson Laboratory | N/A |
| Mouse retina tissue UW Biochemistry | Extracted from male C57BL/6J, mice, Age = 4.5 months, Jackson Laboratory |
N/A |
| Mouse retina tissue U of Michigan | Harvested from C57BL/6J mouse, age: p14, Jackson Laboratory | N/A |
| Mouse retina tissue Harvard U | Extracted from C57BL/6J mice Age = 4–5 months old, Jackson Laboratory | N/A |
| Chemicals, peptides and recombinant proteins | ||
| Bovine serum albumin | Sigma-Aldrich | A3059 |
| Fetal bovine serum | R&D Systems | S11150H |
| Penicillin-streptomycin | ThermoFisher Scientific | 15140122 |
| RPMI 1640 | Sigma-Aldrich | R6504-10X1L |
| Complete Classic Medium with Serum and CultureBoost | Cell Systems | 4Z0-500 |
| Liberase | Roche Molecular Biochemicals (Indianapolis, IN) | 05339880001 |
| Beuthenasia-D | Virbac | RXEUTHASOL |
| Krebs-Ringer Bicarbonate (KRB) | ThermoScientific | 67795.K2 |
| Cytodex 1 | GE Healthcare and Biosciences | Cat no. 17-0448-01 |
| Liraglutide | Selleck Chemicals (Houston, TX) | S8256 |
| cGMP | Sigma Aldrich | G6129 |
| KCl | Sigma Aldrich | P9541 |
| KCN | Sigma Aldrich | 207810 |
| oligomycin | Cayman Chemicals | 11342 |
| FCCP | Sigma Aldrich | C2920 |
| nimodipine | Sigma Aldrich | PHR1293 |
| ouabain | Sigma Aldrich | O-3125 |
| Lactate Oxidase from Aerococcus viridans | MilliporeSigma | L9795 |
| L-Glutamate Oxidase from Streptomyces sp. | MilliporeSigma | G1924-1UN |
| Critical commercial assays | ||
| Insulin ELISA | Alpco | 80-INSMR-CH10 |
| Cyclic GMP Competitive ELISA Kit Competitive ELISA |
Invitrogen/ThermoFisher | EMSCGMPL |
| Amplex Red Glucose/Glucose Oxidase Assay Kit | ThermoFisher | A22189 |
| Acetylcholine/AChE Assay Kit | Invitrogen/ThermoFisher | A12217 |
| Experimental models: Cell lines | ||
| Primary Human Lung Microvascular Endothelial Cells, Female, Lot # 468.0101.04.06, | Cell Systems, Kirkland WA | ACBRI 468 |
| Software and algorithms | ||
| BaroFuse User Interface | EnTox Sciences, Inc. (Mercer Island, WA) | N/A |
| BaroFuse Data Processing Software | EnTox Sciences, Inc | N/A |
| Other | ||
| OneTouch Ultra Mini Glucometer | Lifescan (Malvern, PA) | |
| OneTouch Ultra Glucose test strips | Lifescan (Malvern, PA) | N/A |
| Spectrophotometer, plate reader, Synergy 4 | BioTek (Winooski, VT) | Model S4MLFPTA |
| Wizard 2, 5-channel gamma counter | Perkin Elmer | Model 2470-0050 |
| BaroFuse Multi-Channel perifusion system | EnTox Sciences, Inc. | Model 001-08 |
| Laptop computer running the User Interface Software | Dell | Inspiron 15 TGL 3000, 3511 |
Resource availability
Lead contact
Further information and requests for resources and reagents should be directed to and will be fulfilled by the lead contact Dr. Ian R Sweet (isweet@u.washington.edu)
Materials availability
This study did not generate new unique reagents.
Data and code availability
-
•
All data reported in this paper will be shared by the lead contact upon request.
-
•
This paper does not report original code.
-
•
Any additional information required to reanalyze the data reported in this paper is available from the lead contact upon request.
Experimental model and study participant details
Cell culture: Endothelial cells
Culturing endothelial cells and attaching cells to culture beads
Primary human lung endothelial cells (derived from a female donor and obtained from Cell Systems) were thawed, plated and grown for 2 weeks in Complete Classic Medium with Serum and CultureBoost (4Z0-500, Cell Systems, Kirkland WA) housed in a CO2 incubator at 37°C. Cells were harvested and split 1:3 each week into T-75 culture flasks. The day before experiments, cells were harvested, and cultured with Cytodex beads (2.5 mg/million cells) for 15 min in Media. They were then washed and cultured overnight in a CO2 incubator at 37°C until they were loaded into the BaroFuse system. Cells were authenticated by immunofluorescence detection of specific biomarkers of endothelial cells including inducible expression of CD 62E (E-Selectin), cytoplasmic VWF/Factor VIII, and Cytoplasmic uptake of DiI-Ac-LDL (Acetylated, fluorescently-labeled low-density lipoprotein). In addition, they tested negative for Bacterial, fungal, mycoplasma sterility.
Method details
Tissue harvesting: Retina, islets, hypothalamus
All procedures for harvesting tissue from mice and rats were approved by the Institutional Animal Care and Use Committees at University of Washington, Harvard University and University of Michigan.
Harvesting retina isolation from mice and rats
Retinas were harvested from C57BL/6J mice (euthanized by cervical dislocation) 10 min prior to loading as previously described.12 Briefly, the eye was enucleated and the extraocular muscle was trimmed. The eye was submerged in Hank’s Buffered Salt Solution (HBSS; GIBCO, Cat#: 14025-076) and the anterior part of the eye was removed by cutting at the ora serrata. After the lens was removed the remaining retina and RPE-choroid-sclera separate with minimal manipulation. Immediately afterward they were loaded into the tissue chambers of the BaroFuse. Retinas from Sprague-Dawley rats (∼250 g) were harvested in similar fashion, except that they were anesthetized by an intraperitoneal injection of pentobarbital sodium (150 mg/kg). At U of Michigan, fresh retina were harvested from mice (C57BL/6J) carrying a Cre-recombinase transgene under the control of the rhodopsin promoter (Rho-Cre+) but not carrying the rd8 allele at postnatal day 14 (p14). Using the cut-and-pick method previously described,48 retina were placed into fresh buffer being careful to remove and adhered iris or ciliary body before loading the retina into the tissue chamber.
Rat islet isolation and culture
Islets were harvested from Sprague-Dawley rats (∼250 g) that were anesthetized by an intraperitoneal injection of pentobarbital sodium (150 mg/kg). All procedures were approved by the University of Washington Institutional Animal Care and Use Committee (IACUC Protocol 4091-01). Islets were prepared and purified as described.34 Briefly, islets were prepared by injecting collagenase (10 mL of Liberase at 0.23 mg/mL) into the pancreatic duct followed by surgical removal of the pancreas. The isolated pancreata were placed into 15 mL conical tubes containing 10 mL of 0.23 mg/mL Liberase and incubated at 37°C for 30 min. The digests were then filtered and rinsed with Hank’s buffered salt solution (HBSS). Islets were purified using an Optiprep gradient (Nycomed, Oslo, Norway) as previously described49 and cultured for 18 h in a 37°C in a 5% CO2 incubator in RPMI 1640 medium supplemented with 10% heat-inactivated fetal bovine serum before use in experiments.
Mouse islet isolation and culture (U of Michigan)
Mice (C57BL/6NJ strain, Age = 4.5 months) were housed on a standard 12-h light/12-h dark cycle with ad libitum access to food and water. Islets were isolated from male and female mice between the ages of 8 and 15 weeks, and then cultured as previously described.50,51
Harvesting rat hypothalamus
Hypothalamus was harvested from Sprague-Dawley rats (∼250 g) that were anesthetized and then sacrificed by decapitation. Brains were removed immediately and the medial basal hypothalamus bounded rostrally by the posterior border of the optic chiasma, laterally by the lateral sulcus, caudally by the mammillary bodies and to a dorsal depth of 2 mm was dissected out52 and immediately cut into 8 equal pieces.
BaroFuse (EnTox Sciences, Inc): consisting of the Enclosure, Temperature Control, Fluid Flow, 8 Tissue Perifusion Chambers, a Gas/Perifusate Equilibration System, Test Compound Injection/Mixing System, Flow Rate Monitoring, and Software (BaroFuse UI). The BaroFuse instrument is a multi-component system that consists of an Enclosure that is maintained at 37° by a thermostatted heater, a multi-channel fluidics system comprised of a single gas pressure regulator that pressurizes the chamber containing the perifusion media, and inflow tubes the end of which are submerged beneath the surface of the perifusion media and provide fluid to the tissue chambers. O2 is detected by measuring the lifetime of an O2-sensitive phosphorescent dye2,45 using pairs of LEDs and photodetectors for each tissue chamber tuned to 405 nm excitation and 600 nm and above for emission. The reservoir that contained the perifusate was divided into two chambers, one feeding the frontmost channels (1–4) and one feeding the back 4 channels (5–8). Each hemi-reservoir was equipped with a port for injection of test compounds, and magnetic stir bar that continuously mixed the perifusate assuring that perifusate equilibrated with the gas mixture in the headspace above the perifusate. When different dissolved gas concentrations were desired, two separate gas sources were used, and the divider between the two sides of the reservoir created a gas impermeable seal. Outflow from each channel was collected into wells of a 96-well plate whose position was computer-controlled with respect to time. When fractions were not being collected, flow rate was measured by use of a load cell that continuously recorded the mass of the fluid in the waste receptacle. The BaroFuse User Interface is a desktop application written in Python to run on Windows - in this study a Dell laptop was used - and which controls the fraction collector, the magnetic stirrer speed, as well as receiving inputs from the load cell and calculating and plotting the flow rates using Matplotlib.53 The University of Washington is the owner of a pending patent and EnTox Sciences (Mercer Island, WA) can provide machines through their sales channels.
Perifusion methodology
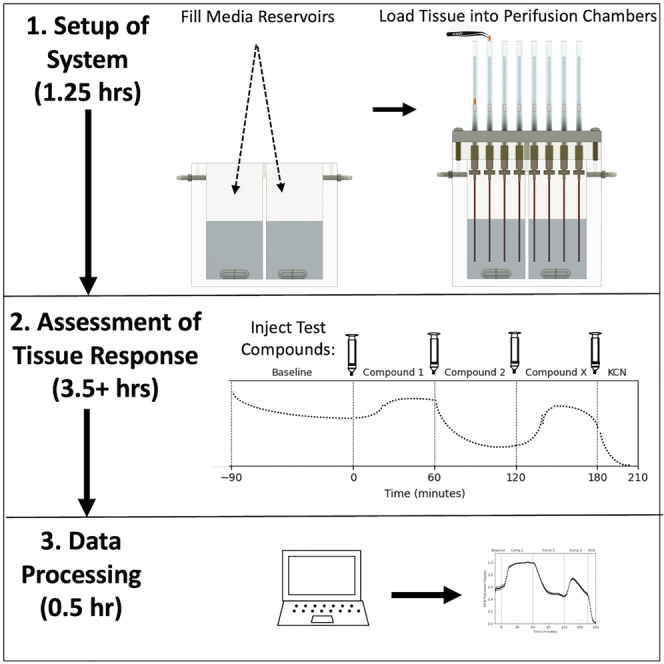
Setup of the perifusion system involves 4 steps: 1. Preheating the system followed by filling the Media Reservoirs with pre-equilibrated Media; 2. Insertion of the Tissue Chamber Assemblies into the Perifusion Module and securing it in place on top of the Media Reservoir to create a gas tight seal; 3. Purge the headspace of the Media Reservoirs with the desired gas composition (typically 5% CO2/21% O2 balance N2) and allow the gas in the headspace to equilibrate with the perifusate in the reservoir; and 4. close the purge port and allow the flow to fill up the Tissue Chambers. When the Tissue Chambers have almost filled, tissue can be loaded into 6 of the 8 chambers and 2 are left empty to be used as an inflow reference. For tissue pieces including retina and hypothalamus, forceps are used to drop the tissue into the chamber. For islets and cells attached to beads, tissue is transferred into the Tissue Chamber with a P-200 pipet. Different Tissue Chamber sizes are used depending on the amount of tissue or cells and flow rate. For islets, the Tissue Chamber ID = 1.5 mm, and for all other tissue types, ID = 3.4 mm. Once the tissue is loaded, the magnetic stirrers, O2 detector and flow rate monitor are started, and the system and the tissue are allowed to equilibrate and establish a stable baseline for 90–120 min. Subsequently, test compounds are injected at precise times, and outflow fractions were collected at desired intervals.
Preparation of test compounds for in vitro experiment
Adding test compounds to solutions for perifusion protocols involved making up a stock solution and then adding a small volume to the perifusate. Stock solutions of test compounds that were water soluble were made up at 20 times the final assay concentration in buffer (including glucose, liraglutide, cGMP, KCl and KCN). For test compounds that were insoluble in water (oligomycin, FCCP, nimodipine and ouabain) stocks were made up in DMSO, and the final concentration of DMSO in the assay ranged from 0.1–0.3% (vol./vol). Since we observed a transient effect of DMSO on OCR in most tissues, DMSO was kept as low as possible without causing the test compound to come out of solution.
Assays performed on outflow fractions: Insulin, lactate, cGMP, acetylcholine, glutamate
Assays using commercially available kits were performed according to the manufacturers’ instructions and the procedures are briefly summarized.
Insulin measured by radioimmunoassay (RIA)
Briefly, specific anti-insulin antiserum was incubated with the sample together with defined amounts of 125I-labeled insulin. Antibody-bound tracer was separated from the unbound tracer by precipitation in solution provided in the kit containing 3% PEG and 0.05% Triton X-100 in 0.05M phosphosaline with 0.025M EDTA and 0.08% sodium azide. The 125I remaining in the tube was assessed quantitatively on a five-channel gamma counter. The amount of 125I detected in the supernatant is inversely proportional to the amount of insulin in the original sample.
Lactate measured by stoichiometric generation of hydrogen peroxide and fluorescent detection of hydrogen peroxide with Amplex Red
Briefly, a kit designed to measure glucose was used to measure lactate by substituting lactate oxidase for glucose oxidase. A solution containing Amplex Red, horseradish peroxidase and lactate oxidase is added to samples or standards. The lactate oxidase then converts lactate to form pyruvate and hydrogen peroxide. In the presence of horseradish peroxidase, the hydrogen peroxide then reacts with the Amplex Red reagent in a 1:1 stoichiometry to generate the red-fluorescent oxidation product, resorufin. Resorufin is then measured with a fluorometer (Synergy 4, BioTek) (excitation 560 nm and emission 590 nm).
Quantitative evaluation of cGMP levels by competitive ELISA
The cyclic GMP solid-phase sandwich ELISA (enzyme-linked immunosorbent assay) measures the amount of the cGMP bound between a matched antibody pair. Samples, standards, or controls were added into the wells of a microplate that has been pre-coated with a cGMP-specific (capture) antibody. A second antibody (detector) was added forming a sandwich, and a substrate solution was subsequently added that reacts with the enzyme-antibody-cGMP complex to produce a colorimetric signal that is measured at 405 nm using a spectrophotometer (Synergy 4, BioTek). The intensity of this signal is inversely proportional to the concentration of target present in the original specimen.
Acetylcholine is measured with fluorescence by coupling acetylcholinesterase (AChE) to the detection of hydrogen peroxide by Amplex Red
Briefly, sample containing acetylcholine are incubated with AChE and choline oxidase, thereby converting acetylcholine to choline and subsequently hydrogen peroxide. The Amplex Red reagent 10-acetyl-3,7-dihydroxyphenoxazine, a sensitive fluorogenic probe for hydrogen peroxide is then added and the resulting resorufin which is generated in a 1:1 stoichiometric ratio is quantified with fluorescent plate reader (Synergy 4, BioTek) (excitation 560 nm and emission 590 nm).
Glutamate measured by stoichiometric generation of hydrogen peroxide and fluorescent detection of hydrogen peroxide with Amplex Red
Briefly, Glutamate was measured in outflow fractions using the same procedure as with lactate, except glutamate oxidase is substituted for lactate oxidase.
Quantification and statistical analysis
Calculations: Absolute Consumption and Production Rate
General calculations for flux
The general equation used for measuring the rate of consumption or production is based on measuring the difference between inflow and outflow concentrations times the flow rate and divided by the amount of tissue in the chamber as follows.
| Equation 1 |
where flow rate is in mL/min and [C] is in units of concentration (per mL).
Oxygen consumption rate
The approach to measuring O2 was based on an O2-sensitive dye whose phosphorescent lifetime was measured by an 8-channel spectrometer. The O2 dependency of the dye signal conformed to the Stern-Volmer equation where the
| Equation 2 |
and lifetime is in units of usec. Equation 2 was used to as a calibration curve to convert the optical signals to O2 content, which could then be plugged into Equation 1 to calculate OCR. The use of lifetime detection produces very stable and sensitive data at both standard and low O2 levels. Perifusate flow rates were set to result in a difference between inflow and outflow O2 of between 5 and 25% of the inflow O2 signal, so it was large enough to be accurately measured, but small enough to avoid exposure to unintended hypoxic conditions.
Calculations: Steady-state values
The timing of the protocols was designed so that the effect of a test compound on a parameter had plateaued before the next test compound was injected. Accordingly, steady state values were calculated as the average of the final time points of an exposure period; the number of data points was typically between 6 and 10 depending on how completely steady state had been reached.
Calculations: Absolute vs. fractional change
To maximize the statistical power of the data in testing whether changes in a parameter were significant, data was plotted relative to the baseline. Thus, normalized data expressed as fractional change was calculated by dividing the absolute rate at each time point by the steady state rate obtained in the baseline prior to the addition of test compounds.
Data processing and graphing
Raw data generated by the lifetime detection system (for OCR calculations) and supplemental assays of fractions were uploaded into the BaroFuse Data Processing package, a cross platform desktop application that works on Windows and macOS. The software was written in Python (Python Software Foundation, DE), utilizes libraries to perform mathematical analysis (Go, company and city) and plots using Matplotlib.53
Statistical analysis
All perifusion data is expressed as means ± standard error (SE) from multiple time courses. Statistical significance was calculated by t-test for steady state values (calculated as the average of the final 7 min of data obtained after exposure of a test compound). For all statistical tests, a p value less than 0.05 was considered significant, and significance of 0.01 and 0.001 were reported.
Acknowledgments
We thank Jesse Damm and Cell Systems for the HMLE cells and culturing protocols. This research was funded by grants from the National Institutes of Health (R01 GM148741 to I.R.S.; R01 EY006641, R01 EY017863, and R21EY032597 to J.B.H.; K08 EY031757 to T.J.W.; P30 EY007003 at the U of Michigan; K01 DK133533 to E.M.W.; R01 DK135268, R01 DK108921, R01 DK135032, R01 DK136547, and U01 DK127747 to S.A.S.; R01 EY017017 to L.E.H.S. and Z.F.; R01 EY030904 to L.E.H.S.; R01 EY032492 to Z.F.; and R03 DK128383 to J.M.S.); the National Science Foundation (STTR Phase 2, 1853066 to D.C. and I.R.S.); the Department of Veterans Affairs (I01 BX004444 to S.A.S.); the JDRF (COE-2019-861 to S.A.S.); Boston Children’s Hospital IDDRC (U54 HD090255 to L.E.H.S.); the Massachusetts Lions Eye Foundation (73735 to L.E.H.S. and 77426 to Z.F.); and an unrestricted grant from the Research to Prevent Blindness within the Department of Ophthalmology and Visual Sciences at the U of Michigan (T.J.W.).
Author contributions
I.R.S., D.C., and G.K. conceived and designed the BaroFuse. I.R.S. conceived and innovated the gas-driven multi-channel fluidics system. G.K. conceived and designed the lifetime detection system. K.B. constructed and automated the fraction collector and load cell and wrote the software for the BaroFuse user interface. K.B. wrote the code for the BaroFuse data processing software. M.K.G. and K.B. assembled the BaroFuse instrument and fluidics systems, and M.K.G. performed quality control (QC) for the machines that were disseminated. V.K. performed the majority of the optimization tests of the BaroFuse. V.K., M.K.G., B.M.R., K.M., M.G., E.M.W., J.Z., J.H., and M.B. performed experiments at the UW, U of Michigan, and Harvard U. R.H. and B.C. constructed the multi-channel lifetime detection system, and B.C. wrote the software for the user interface that controlled the real-time detection of lifetime for each channel. I.R.S., T.J.W., S.A.S., L.E.H.S., Z.F., and J.B.H. participated in the multi-institutional collaboration and beta testing of the BaroFuse. I.R.S. analyzed and graphed the data and wrote the manuscript’s technical method sections. J.M.S. harvested the hypothalamus, assisted in the post-surgical processing and the procedure for loading of the tissue into the BaroFuse, and contributed to the protocol design. All authors contributed to the discussion and interpretation of the results and editing and commented on the manuscript.
Declaration of interests
I.R.S., D.C., G.K., K.B., and M.K.G. have financial ties to EnTox Sciences, Inc. (Mercer Island, WA, USA), the manufacturer/distributor of the BaroFuse perifusion system used in this study. There is a patent pending on the BaroFuse, the rights to which would be granted to the University of Washington. T.J.W. has received equity and royalty from Ocutheia, LLC. S.A.S. has received grant funding from Ono Pharmaceutical Co., Ltd., and is a consultant for Novo Nordisk.
Published: November 13, 2023
Footnotes
Supplemental information can be found online at https://doi.org/10.1016/j.crmeth.2023.100642.
Supplemental information
References
- 1.Kamat V., Robbings B.M., Jung S.R., Kelly J., Hurley J.B., Bube K.P., Sweet I.R. Fluidics system for resolving concentration-dependent effects of dissolved gases on tissue metabolism. Elife. 2021;10 doi: 10.7554/eLife.66716. [DOI] [PMC free article] [PubMed] [Google Scholar]
- 2.Sweet I.R., Khalil G., Wallen A.R., Steedman M., Schenkman K.A., Reems J.A., Kahn S.E., Callis J.B. Continuous measurement of oxygen consumption by pancreatic islets. Diabetes Technol. Ther. 2002;4:661–672. doi: 10.1089/152091502320798303. [DOI] [PubMed] [Google Scholar]
- 3.Ono J., Lacy P.E., Michael H.E., Greider M.H. Studies of the functional and morphologic status of islets maintained at 24 C for four weeks in vitro. Am. J. Pathol. 1979;97:489–503. [PMC free article] [PubMed] [Google Scholar]
- 4.Paish H.L., Reed L.H., Brown H., Bryan M.C., Govaere O., Leslie J., Barksby B.S., Garcia Macia M., Watson A., Xu X., et al. A Bioreactor Technology for Modeling Fibrosis in Human and Rodent Precision-Cut Liver Slices. Hepatology. 2019;70:1377–1391. doi: 10.1002/hep.30651. [DOI] [PMC free article] [PubMed] [Google Scholar]
- 5.Country M.W. Retinal metabolism: A comparative look at energetics in the retina. Brain Res. 2017;1672:50–57. doi: 10.1016/j.brainres.2017.07.025. [DOI] [PubMed] [Google Scholar]
- 6.Rountree A., Karkamkar A., Khalil G., Folch A., Cook D.L., Sweet I.R. BaroFuse, a novel pressure-driven, adjustable-throughput perfusion system for tissue maintenance and assessment. Heliyon. 2016;2 doi: 10.1016/j.heliyon.2016.e00210. [DOI] [PMC free article] [PubMed] [Google Scholar]
- 7.Doliba N.M., Qin W., Vatamaniuk M.Z., Buettger C.W., Collins H.W., Magnuson M.A., Kaestner K.H., Wilson D.F., Carr R.D., Matschinsky F.M. Cholinergic regulation of fuel-induced hormone secretion and respiration of SUR1-/- mouse islets. Am. J. Physiol. Endocrinol. Metab. 2006;291:E525–E535. doi: 10.1152/ajpendo.00579.2005. [DOI] [PubMed] [Google Scholar]
- 8.Schulze T., Morsi M., Reckers K., Brüning D., Seemann N., Panten U., Rustenbeck I. Metabolic amplification of insulin secretion is differentially desensitized by depolarization in the absence of exogenous fuels. Metabolism. 2017;67:1–13. doi: 10.1016/j.metabol.2016.10.008. [DOI] [PubMed] [Google Scholar]
- 9.Arthur P.G., Ngo C.T., Wakeford C.M. A perifusion system to control oxygen concentration in cell suspensions. Anal. Biochem. 1998;263:208–213. doi: 10.1006/abio.1998.2787. [DOI] [PubMed] [Google Scholar]
- 10.Boschmann M., Halangk W., Bohnensack R. Interrelation between mitochondrial respiration, substrate supply and redox ratio in perifused permeabilized rat hepatocytes. Biochim. Biophys. Acta. 1996;1273:223–230. doi: 10.1016/0005-2728(95)00146-8. [DOI] [PubMed] [Google Scholar]
- 11.Shibuki K. Calcium-dependent and ouabain-resistant oxygen consumption in the rat neurohypophysis. Brain Res. 1989;487:96–104. doi: 10.1016/0006-8993(89)90944-x. [DOI] [PubMed] [Google Scholar]
- 12.Bisbach C.M., Hass D.T., Robbings B.M., Rountree A.M., Sadilek M., Sweet I.R., Hurley J.B. Succinate Can Shuttle Reducing Power from the Hypoxic Retina to the O2-Rich Pigment Epithelium. Cell Rep. 2020;31 doi: 10.1016/j.celrep.2020.107606. [DOI] [PMC free article] [PubMed] [Google Scholar]
- 13.Dalsbecker P., Beck Adiels C., Goksör M. Liver-on-a-chip devices: the pros and cons of complexity. Am. J. Physiol. Gastrointest. Liver Physiol. 2022;323:G188–G204. doi: 10.1152/ajpgi.00346.2021. [DOI] [PubMed] [Google Scholar]
- 14.Au A.K., Huynh W., Horowitz L.F., Folch A. 3D-Printed Microfluidics. Angew. Chem. Int. Ed. Engl. 2016;55:3862–3881. doi: 10.1002/anie.201504382. [DOI] [PMC free article] [PubMed] [Google Scholar]
- 15.Grumbine M., Kamat V., Bao K., Mokate K., Lim R., Chao J., Robbings B.M., Hass D., Hurley J.B., IR. S. 2023. Procedures for Maintaining and Assessing Various Tissue- and Cell-Types of the Eye with the BaroFuse. JoVE. (Accepted for Publication) [DOI] [PMC free article] [PubMed] [Google Scholar]
- 16.Zhao C., Wilson M.C., Schuit F., Halestrap A.P., Rutter G.A. Expression and distribution of lactate/monocarboxylate transporter isoforms in pancreatic islets and the exocrine pancreas. Diabetes. 2001;50:361–366. doi: 10.2337/diabetes.50.2.361. [DOI] [PubMed] [Google Scholar]
- 17.Sando H., Grodsky G.M. Dynamic synthesis and release of insulin and proinsulin from perifused islets. Diabetes. 1973;22:354–360. doi: 10.2337/diab.22.5.354. [DOI] [PubMed] [Google Scholar]
- 18.Cook D.L., Hales C.N. Intracellular ATP directly blocks K+ channels in pancreatic B-cells. Nature. 1984;311:271–273. doi: 10.1038/311271a0. [DOI] [PubMed] [Google Scholar]
- 19.Yang C., Jiang L., Zhang H., Shimoda L.A., DeBerardinis R.J., Semenza G.L. Analysis of hypoxia-induced metabolic reprogramming. Methods Enzymol. 2014;542:425–455. doi: 10.1016/B978-0-12-416618-9.00022-4. [DOI] [PubMed] [Google Scholar]
- 20.Yazdani M. Uncontrolled Oxygen Levels in Cultures of Retinal Pigment Epithelium: Have We Missed the Obvious? Curr. Eye Res. 2022;47:651–660. doi: 10.1080/02713683.2022.2050264. [DOI] [PubMed] [Google Scholar]
- 21.Al-Ani A., Toms D., Kondro D., Thundathil J., Yu Y., Ungrin M. Oxygenation in cell culture: Critical parameters for reproducibility are routinely not reported. PLoS One. 2018;13 doi: 10.1371/journal.pone.0204269. [DOI] [PMC free article] [PubMed] [Google Scholar]
- 22.Krebs H.A. The Pasteur effect and the relations between respiration and fermentation. Essays Biochem. 1972;8:1–34. [PubMed] [Google Scholar]
- 23.Widmer H., Poitry S., Tsacopoulos M. The increase of oxygen consumption after a flash of light is tightly coupled to sodium pumping in the lateral ocellus of barnacle. J. Gen. Physiol. 1990;96:83–108. doi: 10.1085/jgp.96.1.83. [DOI] [PMC free article] [PubMed] [Google Scholar]
- 24.Hirtenstein M., Clark J., Lindgren G., Vretblad P. Microcarriers for animal cell culture: a brief review of theory and practice. Dev. Biol. Stand. 1980;46:109–116. [PubMed] [Google Scholar]
- 25.Donato M.T., Gallego-Ferrer G., Tolosa L. In Vitro Models for Studying Chronic Drug-Induced Liver Injury. Int. J. Mol. Sci. 2022;23 doi: 10.3390/ijms231911428. [DOI] [PMC free article] [PubMed] [Google Scholar]
- 26.Darcy J., Wang C.H., Tseng Y.H. Analyzing Mitochondrial Function in Brown Adipocytes with a Bioenergetic Analyzer. Methods Mol. Biol. 2020;2138:289–296. doi: 10.1007/978-1-0716-0471-7_20. [DOI] [PMC free article] [PubMed] [Google Scholar]
- 27.Leung D.T.H., Chu S. Measurement of Oxidative Stress: Mitochondrial Function Using the Seahorse System. Methods Mol. Biol. 2018;1710:285–293. doi: 10.1007/978-1-4939-7498-6_22. [DOI] [PubMed] [Google Scholar]
- 28.Plitzko B., Loesgen S. Measurement of Oxygen Consumption Rate (OCR) and Extracellular Acidification Rate (ECAR) in Culture Cells for Assessment of the Energy Metabolism. Bio. Protoc. 2018;8 doi: 10.21769/BioProtoc.2850. [DOI] [PMC free article] [PubMed] [Google Scholar]
- 29.Nolfi-Donegan D., Braganza A., Shiva S. Mitochondrial electron transport chain: Oxidative phosphorylation, oxidant production, and methods of measurement. Redox Biol. 2020;37 doi: 10.1016/j.redox.2020.101674. [DOI] [PMC free article] [PubMed] [Google Scholar]
- 30.Du J., Rountree A., Cleghorn W.M., Contreras L., Lindsay K.J., Sadilek M., Gu H., Djukovic D., Raftery D., Satrústegui J., et al. Phototransduction Influences Metabolic Flux and Nucleotide Metabolism in Mouse Retina. J. Biol. Chem. 2016;291:4698–4710. doi: 10.1074/jbc.M115.698985. [DOI] [PMC free article] [PubMed] [Google Scholar]
- 31.Sweet I.R., Gilbert M., Jensen R., Sabek O., Fraga D.W., Gaber A.O., Reems J. Glucose stimulation of cytochrome C reduction and oxygen consumption as assessment of human islet quality. Transplantation. 2005;80:1003–1011. doi: 10.1097/01.tp.0000178381.35014.37. [DOI] [PubMed] [Google Scholar]
- 32.Sweet I.R., Gilbert M., Scott S., Todorov I., Jensen R., Nair I., Al-Abdullah I., Rawson J., Kandeel F., Ferreri K. Glucose-stimulated increment in oxygen consumption rate as a standardized test of human islet quality. Am. J. Transplant. 2008;8:183–192. doi: 10.1111/j.1600-6143.2007.02041.x. [DOI] [PubMed] [Google Scholar]
- 33.Jung S.R., Kuok I.T.D., Couron D., Rizzo N., Margineantu D.H., Hockenbery D.M., Kim F., Sweet I.R. Reduced cytochrome C is an essential regulator of sustained insulin secretion by pancreatic islets. J. Biol. Chem. 2011;286:17422–17434. doi: 10.1074/jbc.M110.202820. [DOI] [PMC free article] [PubMed] [Google Scholar]
- 34.Rountree A.M., Neal A.S., Lisowski M., Rizzo N., Radtke J., White S., Luciani D.S., Kim F., Hampe C.S., Sweet I.R. Control of insulin secretion by cytochrome C and calcium signaling in islets with impaired metabolism. J. Biol. Chem. 2014;289:19110–19119. doi: 10.1074/jbc.M114.556050. [DOI] [PMC free article] [PubMed] [Google Scholar]
- 35.Rountree A.M., Reed B.J., Cummings B.P., Jung S.R., Stanhope K.L., Graham J.L., Griffen S.C., Hull R.L., Havel P.J., Sweet I.R. Loss of coupling between calcium influx, energy consumption and insulin secretion associated with development of hyperglycaemia in the UCD-T2DM rat model of type 2 diabetes. Diabetologia. 2013;56:803–813. doi: 10.1007/s00125-012-2808-6. [DOI] [PMC free article] [PubMed] [Google Scholar]
- 36.Sweet I.R., Cook D.L., Wiseman R.W., Greenbaum C.J., Lernmark A., Matsumoto S., Teague J.C., Krohn K.A. Dynamic perifusion to maintain and assess isolated pancreatic islets. Diabetes Technol. Ther. 2002;4:67–76. doi: 10.1089/15209150252924111. [DOI] [PubMed] [Google Scholar]
- 37.Sweet I.R., Cook D.L., DeJulio E., Wallen A.R., Khalil G., Callis J., Reems J. Regulation of ATP/ADP in pancreatic islets. Diabetes. 2004;53:401–409. doi: 10.2337/diabetes.53.2.401. [DOI] [PubMed] [Google Scholar]
- 38.Neal A., Rountree A.M., Philips C.W., Kavanagh T.J., Williams D.P., Newham P., Khalil G., Cook D.L., Sweet I.R. Quantification of Low-Level Drug Effects Using Real-Time, in vitro Measurement of Oxygen Consumption Rate. Toxicol. Sci. 2015;148:594–602. doi: 10.1093/toxsci/kfv208. [DOI] [PMC free article] [PubMed] [Google Scholar]
- 39.Lacy P.E., Walker M.M., Fink C.J. Perifusion of isolated rat islets in vitro. Participation of the microtubular system in the biphasic release of insulin. Diabetes. 1972;21:987–998. doi: 10.2337/diab.21.10.987. [DOI] [PubMed] [Google Scholar]
- 40.Alcazar O., Buchwald P. Concentration-Dependency and Time Profile of Insulin Secretion: Dynamic Perifusion Studies With Human and Murine Islets. Front. Endocrinol. 2019;10:680. doi: 10.3389/fendo.2019.00680. [DOI] [PMC free article] [PubMed] [Google Scholar]
- 41.Whitticar N.B., Strahler E.W., Rajan P., Kaya S., Nunemaker C.S. An Automated Perifusion System for Modifying Cell Culture Conditions over Time. Biol. Proced. Online. 2016;18:19. doi: 10.1186/s12575-016-0049-7. [DOI] [PMC free article] [PubMed] [Google Scholar]
- 42.Gonçalves I.M., Carvalho V., Rodrigues R.O., Pinho D., Teixeira S.F.C.F., Moita A., Hori T., Kaji H., Lima R., Minas G. Organ-on-a-Chip Platforms for Drug Screening and Delivery in Tumor Cells: A Systematic Review. Cancers. 2022;14 doi: 10.3390/cancers14040935. [DOI] [PMC free article] [PubMed] [Google Scholar]
- 43.Masand S.N., Mignone L., Zahn J.D., Shreiber D.I. Nanoporous membrane-sealed microfluidic devices for improved cell viability. Biomed. Microdevices. 2011;13:955–961. doi: 10.1007/s10544-011-9565-z. [DOI] [PubMed] [Google Scholar]
- 44.Neal A., Rountree A., Kernan K., Van Yserloo B., Zhang H., Reed B.J., Osborne W., Wang W., Sweet I.R. Real-time imaging of intracellular hydrogen peroxide in pancreatic islets. Biochem. J. 2016;473:4443–4456. doi: 10.1042/BCJ20160481. [DOI] [PMC free article] [PubMed] [Google Scholar]
- 45.Khalil G., Cook D.L., Sweet I.R. In: Advances in Chemistry Research. Taylor E.J.C., editor. Nova Science Publishers, Inc.; 2022. Porphyrins Luminescent Based Dyes for Dissolved Oxygen Sensing. [Google Scholar]
- 46.Quent V.M.C., Loessner D., Friis T., Reichert J.C., Hutmacher D.W. Discrepancies between metabolic activity and DNA content as tool to assess cell proliferation in cancer research. J. Cell Mol. Med. 2010;14:1003–1013. doi: 10.1111/j.1582-4934.2010.01013.x. [DOI] [PMC free article] [PubMed] [Google Scholar]
- 47.Chan G.K.Y., Kleinheinz T.L., Peterson D., Moffat J.G. A simple high-content cell cycle assay reveals frequent discrepancies between cell number and ATP and MTS proliferation assays. PLoS One. 2013;8 doi: 10.1371/journal.pone.0063583. [DOI] [PMC free article] [PubMed] [Google Scholar]
- 48.Winkler B.S., Arnold M.J., Brassell M.A., Puro D.G. Energy metabolism in human retinal Muller cells. Invest. Ophthalmol. Vis. Sci. 2000;41:3183–3190. [PMC free article] [PubMed] [Google Scholar]
- 49.Brandhorst H., Brandhorst D., Hering B.J., Bretzel R.G. Significant progress in porcine islet mass isolation utilizing liberase HI for enzymatic low-temperature pancreas digestion. Transplantation. 1999;68:355–361. doi: 10.1097/00007890-199908150-00006. [DOI] [PubMed] [Google Scholar]
- 50.Pearson G., Chai B., Vozheiko T., Liu X., Kandarpa M., Piper R.C., Soleimanpour S.A. Clec16a, Nrdp1, and USP8 Form a Ubiquitin-Dependent Tripartite Complex That Regulates beta-Cell Mitophagy. Diabetes. 2018;67:265–277. doi: 10.2337/db17-0321. [DOI] [PMC free article] [PubMed] [Google Scholar]
- 51.Soleimanpour S.A., Gupta A., Bakay M., Ferrari A.M., Groff D.N., Fadista J., Spruce L.A., Kushner J.A., Groop L., Seeholzer S.H., et al. The diabetes susceptibility gene Clec16a regulates mitophagy. Cell. 2014;157:1577–1590. doi: 10.1016/j.cell.2014.05.016. [DOI] [PMC free article] [PubMed] [Google Scholar]
- 52.Pal R., Sahu A. Leptin signaling in the hypothalamus during chronic central leptin infusion. Endocrinology. 2003;144:3789–3798. doi: 10.1210/en.2002-0148. [DOI] [PubMed] [Google Scholar]
- 53.Hunter J.D. Matplotlib: A 2D Graphics Environment. Comput. Sci. Eng. 2007;9:90–95. [Google Scholar]
Associated Data
This section collects any data citations, data availability statements, or supplementary materials included in this article.
Supplementary Materials
Data Availability Statement
-
•
All data reported in this paper will be shared by the lead contact upon request.
-
•
This paper does not report original code.
-
•
Any additional information required to reanalyze the data reported in this paper is available from the lead contact upon request.