

Summary
The definitive diagnosis of non-alcoholic steatohepatitis (NASH) currently relies on invasive and labor-intensive liver biopsy. Here, we identified soluble CUB domain-containing protein 1 (sCDCP1) as a top-ranked non-invasive biomarker for NASH using Olink-based proteomics in 238 obese individuals with liver biopsies. Both the circulating concentration and hepatic mRNA abundance of sCDCP1 were significantly elevated in patients with NASH and correlated closely with each histological feature of NASH. In the pooled multicenter validation cohort, sCDCP1 as a standalone biomarker achieved an area under the receiver operating characteristic (AUROC) of 0.838 (95% confidence interval [CI] 0.789–0.887) for diagnosing NASH, which is better than those achieved with cytokeratin-18 and other non-invasive tests. Furthermore, the C-DAG model established by the combination of sCDCP1 with diabetes, aspartate aminotransferase (AST), and gender accurately rules in and rules out both NASH and fibrotic NASH (gray zones <20%). Thus, sCDCP1-based non-invasive tests can be potentially implemented for screening and early diagnosis of NASH and for ruling out low-risk individuals to avoid unnecessary liver biopsies.
Keywords: proteomics, personalized risk stratification, non-invasive diagnosis, non-alcoholic steatohepatitis, biomarkers, metabolic steatohepatitis, metabolic syndrome
Graphical abstract
Highlights
-
•
Circulating sCDCP1 is the top-ranked classifier of NASH by Olink proteomics analysis
-
•
Hepatic mRNA abundance of CDCP1 is significantly elevated in patients with NASH
-
•
The decrease in sCDCP1 mirrors changes in liver enzymes after bariatric surgery
-
•
An sCDCP1-based algorithm shows excellent performance for risk stratification of NASH
Jia et al. identify sCDCP1 as a robust serum biomarker for NASH in obese individuals through an Olink-based proteomics study. They further develop an algorithm (C-DAG) combining sCDCP1 with three clinical parameters that can be potentially implemented as a non-invasive test to rule in and rule out patients with NASH.
Introduction
Non-alcoholic fatty liver disease (NAFLD) is the most common form of chronic liver disease, posing a significant public health burden. The global prevalence of NAFLD is approximately 32% in the general population and up to 75% in the obese population.1,2 While non-alcoholic fatty liver (NAFL) has a comparatively benign course, non-alcoholic steatohepatitis (NASH) and advanced fibrosis are strongly associated with adverse hepatic outcomes and are the leading indications for liver transplantation.3,4 Moreover, due to its largely asymptomatic (or minimally symptomatic) nature in the early phase, a large proportion of patients remain undiagnosed until the disease has progressed into more advanced and life-threatening stages.5 Furthermore, the presence of steatohepatitis increases the incidence of cardiovascular mortality independent of traditional risk factors.6 Thus, early detection of patients at high risk of NASH is of great importance for timely intervention and management, particularly as clinical trial inclusion criteria all require the presence of NASH and, typically, stage 2 or greater fibrosis.
To date, histological assessment of liver biopsy remains the gold standard for the diagnosis of steatohepatitis and for staging of liver fibrosis. However, the drawbacks of biopsy, such as sampling error, high cost, invasiveness, procedure-related complications, time-consuming nature, and interobserver variability,7 restrict its routine use. Despite recent advances,8 imaging-based diagnostic tools, such as ultrasonography and magnetic resonance imaging (MRI), are mainly used for the detection of hepatic steatosis and fibrosis but cannot reliably differentiate patients with NASH from patients with NAFL. An MRI-based scoring system was recently developed for the identification of patients with NASH and significant fibrosis,9 but it has not been externally validated in different populations and is limited by cost and availability. Although a number of circulating biomarkers have been identified for potential diagnosis of NASH,10,11 their specificity, reproducibility, and accuracy remain to be confirmed in independent liver-biopsy-proven NAFLD cohorts.
To search for novel NASH-related serological biomarkers, we conducted an unbiased quantitative proteomics analysis with a proximity extension assay-based Olink platform in a liver-biopsy-proven NAFLD cohort with the full histological spectrum of this disease and identified soluble CUB domain-containing protein 1 (sCDCP1) as a top candidate for differentiating patients with NASH from patients with NAFL and normal livers. We subsequently developed a highly specific and sensitive immunoassay for quantification of human sCDCP1 and validated its diagnostic performance in biopsy-confirmed NAFLD cohorts collected from several different clinical centers across China.
Results
Identification of serum sCDCP1 as the top-ranked biomarker of NASH by Olink proteomic screen
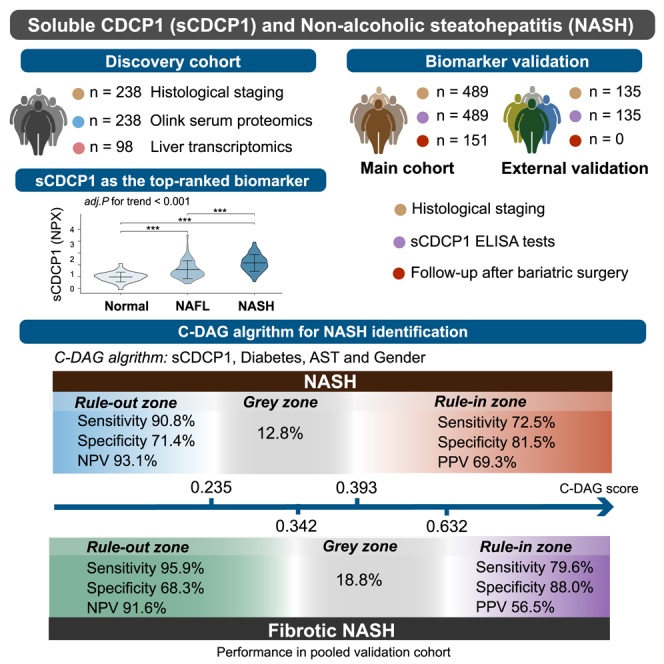
To systematically identify new circulating biomarkers for NASH, we performed Olink-based proteomics analysis in the biomarker discovery cohort of 202 patients with biopsy-proven NAFLD (100 NAFL and 102 NASH) and 36 subjects with normal livers (NL). The subjects in this cohort were 31 (26, 38) years old, and 44% were men. The body mass index (BMI) was 40.85 (35.90, 45.82) and 35.83 (31.98, 40.73) kg/m2 in subjects with and without NASH, respectively (Table S1).
After exclusion of those proteins that were not detected in >25% of the total samples, 874 proteins from 12 Olink panels were included for further analyses (Data S1). The reliability of our Olink data was demonstrated by the optimal performance of several well-known NASH-related biomarkers, such as fibroblast growth factor 21 (FGF21), interleukin-6 (IL-6), fatty acid binding protein4 (FABP4), growth differentiation factor15 (GDF15), and thrombospondin 2 (THBS2) (Data S1). Random forest feature selection showed sCDCP1 as the top-ranked protein selected from 874 proteins detected in identifying NASH with the highest mean decrease accuracy of 0.005 and was also selected as the best identifier for NASH by support vector machine (SVM) analysis (Figure 1A). Compared with individuals with NL and patients with NAFL, the NASH group displayed markedly elevated sCDCP1 levels (NLs and NAFLs vs. NASH, −0.003 [−0.289, −0.211] and 0.285 [0.009, −0.652] vs. 1.306 [0.749, 1.649] normalized protein expression [NPX], respectively; p < 0.0001, Kruskal-Wallis H test, and p for trend <0.0001; Figure 1B), which remained significant even after adjustment for age, gender, BMI, and homeostatic model assessment for insulin resistance (HOMA-IR) (adjusted [adj.] p for trend <0.0001).
Figure 1.

Olink proteomics-based identification of serum sCDCP1 as the top performer in identifying NASH in liver-biopsy-confirmed NAFLD cohort
(A) Random forest feature selection (left) and SVM learning (right) showing sCDCP1 was the top-ranked protein in identifying NASH.
(B) Violin plot showing the distribution of sCDCP1 levels in patients with biopsy-proven NL (n = 36), NAFL (n = 100), or NASH (n = 102).
(C) Heatmap based on the sCDCP1 expression level and the distribution of clinicopathological features. The p values of logistic regression between sCDCP1 and features are shown. ∗∗∗p < 0.001, ∗∗p < 0.01, ∗p < 0.05.
(D) The Spearman correlation plot of sCDCP1 with clinical indicators that closely correlated with NAFLD.
(E) Odds ratio (OR) for NASH with models being controlled for established risk factors in a stepwise manner. T1 (reference), the first tertile of sCDCP1 (−1.124 to 0.203 NPX); T2, the second tertile of sCDCP1 (0.203–0.971 NPX); T3, the third tertile of sCDCP1 (0.971–3.562 NPX). Model 1, non-adjusted; model 2, adjusted for gender, age, and BMI; model 3, adjusted for gender, age, BMI, ALT, AST, and HOMA-IR.
(F) Interaction of sCDCP1 with CK18, FGF21m and THBS2. Spearman’s R and p values are shown within each rectangle, with color intensity indicating the strength of association.
(G and H) Receiver operating characteristic (ROC) curve indicating the performance of sCDCP1, CK18, THSB2, and FGF21 in the diagnosis of NASH and fibrotic NASH. NPX, normalized protein expression, the Olink’s arbitrary unit.
High sCDCP1 levels were positively associated with histological characteristics of NASH (steatosis [p < 0.001], ballooning [p < 0.001], inflammation [p < 0.001]) and NAS scores (p < 0.001; Figure 1C). Remarkably, although sCDCP1 was picked based on NASH identification, it was also tightly correlated with the stage of fibrosis (p < 0.001; Figure 1C). Moreover, sCDCP1 exhibited significant correlations with the presence of several major NASH-related metabolic comorbidities, including diabetes (p < 0.001), hypertension (p < 0.001), dyslipidemia (p < 0.01), and metabolic syndrome (MetS) (p < 0.001; Figure 1C).
Among the 104 biochemical and clinical parameters collected in our cohort, serum sCDCP1 showed the strongest positive correlation with the liver injury markers AST and alanine aminotransferase (ALT), followed by several parameters of glucose dysregulation and insulin resistance (HOMA-IR, HbA1c, and C-peptide), BMI, waist circumference, and total triglycerides (Figure 1D). After adjustment for gender, age, BMI, ALT, AST, and HOMA-IR, high sCDCP1 levels (third tertile [T3]) were associated with a roughly 11-fold increased risk of NASH (T3: odds ratio [OR] = 11.48, 95% confidence interval [CI] 3.52–37.49 in model 3; p < 0.001; Figure 1E). Furthermore, there were strong positive correlations between sCDCP1 and several well-known serum biomarkers of NASH, including cytokeratin-18 (CK18), FGF21, and THBS2 (Spearman’s p for each <0.001, R > 0.3 for all; Figure 1F). Notably, sCDCP1 showed better performance in diagnosing NASH (area under the receiver operating characteristic [AUROC] = 0.851, 95% CI 0.802–0.901) and fibrotic NASH (n = 33, AUROC = 0.851, 95% CI 0.769–0.934) compared with CK18, FGF21, and THBS2 (p < 0.05 for each, Delong’s test; Figures 1G and 1H).
Increased CDCP1 mRNA expression in the liver in close association with elevated circulating sCDCP1 in patients with NASH
To explore whether the liver is an important production site for elevated circulating sCDCP1 in patients with NASH, we investigated mRNA abundance of the CDCP1 gene in the livers of 98 subjects (16 NL, 44 NAFL, and 38 NASH; Table S1). The RNA sequencing (RNA-seq)-based transcriptomics results showed CDCP1 to be progressively increased with the histological classification and was also able to differentiate NASH from non-NASH at an AUROC of 0.724 (95% CI 0.618–0.829) (Figures S1A–S1C). Furthermore, there was a significant positive correlation between CDCP1 mRNA expression levels in the liver and circulating sCDCP1 concentrations measured by Olink analysis (Spearman’s p < 0.001, R = 0.40; Figure S1D), supporting the liver as a potentially important source of elevated serum sCDCP1 in NASH. Real-time PCR analysis further validated significantly higher hepatic mRNA of CDCP1 in patients with NASH than in individuals with NL and NAFL (Figure S1E).
Verification of sCDCP1 as a robust biomarker for NASH in multiple cohorts
Cross-sectional studies
Another biopsy-proven NAFLD cohort (main cohort, n = 489 including 191 patients with NASH) and an external validation cohort (n = 135 including 43 patients with NASH) were used for biomarker validation. As shown in Table 1, both the main and external validation cohorts shared similar demographic, metabolic, and biochemical characteristics and histologic features of NAFLD. The distribution of scores for each histological feature and medication use, including antihypertensive, antidiabetic, and lipid-lowering drugs, are presented in Table S2. Serum sCDCP1 levels ranged from 15.63 to 935.24 pg/mL in these patients.
Table 1.
Demographic and clinical characteristics of main and external validation cohorts for ELISA analysis of sCDCP1
| Characteristic | Main cohort (n = 489) |
External validation cohort (n = 135) |
||
|---|---|---|---|---|
| Total (n = 489) | Training set (n = 326) | Test set (n = 163) | ||
| Male, n (%) | 211 (43.1) | 137 (42.0) | 74 (45.4) | 56 (41.5) |
| Age (years) | 31 (25, 36) | 31 (25, 37) | 31 (25, 35.5) | 31 (27, 36) |
| Disease stage, n (%) | ||||
| NL | 75 (15.3) | 56 (17.2) | 19 (11.7) | 30 (22.2) |
| NAFL | 223 (45.6) | 145 (44.5) | 78 (47.9) | 62 (45.9) |
| NASH | 191 (39.1) | 125 (38.3) | 66 (40.5) | 43 (31.9) |
| NAS score, n (%) | ||||
| 0–3 | 308 (63.0) | 210 (64.4) | 98 (60.1) | 99 (73.3) |
| 4–8 | 181 (37.0) | 116 (35.6) | 65 (39.9) | 36 (26.7) |
| Fibrosis, n (%) | ||||
| 0–1 | 377 (77.1) | 255 (78.2) | 122 (74.8) | 108 (82.2) |
| 2–4 | 112 (22.9) | 71 (21.8) | 41 (25.2) | 27 (17.8) |
| Diabetes, n (%) | 229 (46.8) | 139 (42.6) | 90 (55.2) | 44 (32.6) |
| BMI (kg/m2) | 38.2 (33.8, 43.6) | 38.4 (34.3, 43.8) | 37.9 (33.4, 42.3) | 37.9 (33.4, 42.6) |
| ALT (U/L) | 41.0 (25.0, 74.0) | 40.0 (25.0, 68.8) | 44.0 (25.0, 84.0) | 40.0 (25.5, 63.0) |
| AST (U/L) | 25.0 (18.0, 40.0) | 24.0 (18.0, 37.0) | 25.0 (18.0, 42.5) | 25.0 (18.0, 38.1) |
| γ-GT (U/L) | 34.0 (23.0, 61.0) | 32.5 (23.0, 57.8) | 38.0 (24.0, 69.0) | 33.0 (22.0, 53.0) |
| TG (mmol/L) | 1.61 (1.17, 2.21) | 1.61 (1.13, 2.16) | 1.65 (1.24, 2.36) | 1.84 (1.36, 2.79) |
| HDL-C (mmol/L) | 1.10 (0.92, 1.99) | 1.11 (0.91, 2.08) | 1.07 (0.93, 1.61) | 1.08 (0.97, 1.17) |
| LDL-C (mmol/L) | 2.57 (1.36, 3.19) | 2.54 (1.35, 3.24) | 2.63 (1.735, 3.095) | 2.95 (2.31, 3.09) |
| Insulin (mIU/L) | 19.11 (12.72, 26.69) | 19.02 (12.46, 25.49) | 19.60 (14.395, 28.44) | 16.22 (10.83, 27.40) |
| HbA1c (%) | 5.8 (5.4, 6.6) | 5.7 (5.4, 6.5) | 6.0 (5.5, 6.8) | 5.7 (5.3, 6.6) |
| Fasting glucose (mmol/L) | 5.58 (5.01, 7.01) | 5.49 (5.01, 6.48) | 5.85 (5.05, 7.68) | 5.49 (4.94, 7.06) |
| HOMA-IR | 5.15 (3.21, 7.42) | 4.87 (3.06, 6.88) | 5.50 (3.74, 8.37) | 5.33 (2.34, 6.98) |
| Ferritin (ng/mL) | 116.48 (48.56, 207.93) | 109.64 (45.92, 190.11) | 122.30 (52.06, 259.12) | 85.99 (28.64, 198.42) |
| Platelet (∗109/L) | 267.91 (228.47, 310.17) | 268.70 (230.02, 307.71) | 267.80 (227.01, 313.94) | 277.02 (240.51, 311.52) |
Data are presented as n (%) or median (interquartile range; non-normally distributed variables). See also Table S2. NL, normal liver; NAFL, non-alcoholic fatty liver; NASH, non-alcoholic steatohepatitis. BMI, body mass index; ALT, alanine aminotransferase; AST, aspartate aminotransferase; γ-GT, γ-glutamyl transferase; TG, total triglyceride; HDL-C, high-density lipoprotein cholesterol; LDL-C, low-density lipoprotein cholesterol; HOMA-IR, homeostatic model assessment for insulin resistance.
In the main cohort, consistent with the findings from Olink proteomics analysis, serum sCDCP1 in patients with NASH (223.01 [125.47, 352.59] pg/mL) was markedly higher than in individuals with NL (52.31 [25.81, 74.56] pg/mL) and NAFL (72.84 [48.54, 102.60] pg/mL) (p < 0.0001, Kruskal-Wallis H test, and p for trend < 0.001), and this significance remained robust even after adjustment for age, gender, BMI, and HOMA-IR (adj. p for trend < 0.001; Figure 2A). The risk of NASH exhibited a successive increase with the elevation in serum sCDCP1 levels, reflected by a higher OR (T3: OR = 5.00, 95% CI 3.39–7.36 after adjustment for age, gender, BMI, ALT, AST, and HOMA-IR; p < 0.001; Figure 2B). The levels of sCDCP1 were comparable between patients taking various medications and those not taking medication, and sCDCP1 remained a robust indicator for NASH after adjusting for medications in the multivariate logistic regression (adj. OR = 7.84, 95% CI 5.49–11.20; p < 0.001), suggesting that medication use did not affect the association between sCDCP1 levels and NASH (Figure S2). Furthermore, serum sCDCP1 levels correlated closely with the score of each individual histological feature of NASH as well as fibrosis (Figure 2C). When patients were stratified according to fibrosis stage—no/mild fibrosis (F 0–1, n = 377), significant fibrosis (F 2–4, n = 112), and advanced fibrosis (F 3–4, n = 35)—sCDCP1 was significantly elevated across fibrosis stages (F 0–1, 79.65 [51.79, 144.46] pg/mL vs. F 2–4, 250.82 [116.36, 424.25] pg/mL vs. F 3–4, 311.46 [181.15, 409.28], p = 0.001, Kruskal-Wallis H test; adj. p for trend = 0.008 after adjustment for age, gender, BMI, and HOMA-IR), indicating that sCDCP1 may also serve as a potential biomarker of fibrosis (Figure 2D).
Figure 2.

Validation of circulating sCDCP1 as a robust biomarker for NASH by quantitative ELISA in multiple cohorts
Data were collected from the main cohort (n = 489) (A–D) and external validation cohort (n = 135) (E–H).
(A and E) Boxplot showing the distribution of serum sCDCP1 levels in patients with biopsy-proven NL, NAFL, or NASH (75/223/191 in main cohort, 30/62/43 in external validation cohort). Adj. p for trend was calculated after adjustment of age, gender, BMI, and HOMA-IR. ∗∗∗p < 0.001, ∗∗p < 0.01, ∗p < 0.05, ns, p ≥ 0.05 (Dunn’s test).
(B and F) OR for NASH with models being controlled for established risk factors in a stepwise manner. T1 (reference), the first tertile of sCDCP1; T2, the second tertile of sCDCP1; T3, the third tertile of sCDCP1; T1/T2/T3, 15.63–69.08/69.08–170.01/170.01–935.24 pg/mL in the main cohort and 15.63–57.78/57.78–125.98/125.98–690.56 pg/mL in the external validation cohort. Model 1, non-adjusted; model 2, adjusted for gender, age, and BMI; model 3, adjusted for gender, age, BMI, ALT, AST, and HOMA-IR.
(C and G) Heatmap based on serum sCDCP1 level and the distribution of histopathological features. The p values of logistic regression between sCDCP1 and features were shown. ∗∗∗p < 0.001, ∗∗p < 0.01, ∗p < 0.05.
(D and H) Serum sCDCP1 in patients with NASH stratified by fibrosis stage (F 0–1, F 2–4, and F 3–4; 377/112/35 in the main cohort, 108/27/13 in the external validation cohort). Data are presented as Tukey boxplots. ∗∗∗p < 0.001 (Dunn’s test).
Similarly, sCDCP1 levels were elevated progressively across the disease spectrum in the external validation cohort (NL and NAFL vs. NASH, 59.12 [42.64, 77.74] and 77.19 [50.45, 115.61] vs. 186.55 [110.84, 347.34] pg/mL, respectively; p < 0.001, Kruskal-Wallis H test, and p for trend < 0.001 before and < 0.002 after adjustment for age, gender, BMI, and HOMA-IR; Figure 2E). Patients in the highest sCDCP1 tertile displaying a 2.08-fold (95% CI 1.27–2.35, p < 0.001) increased risk of NASH after multivariable adjustment (Figure 2F). Significant positive correlations were observed between sCDCP1 and each histological feature (Figure 2G). Additionally, higher sCDCP1 levels were also observed in patients with NASH with advanced fibrosis (F 3–4, n = 13) or significant fibrosis (n = 27) compared with those with no/mild fibrosis (n = 108) (F 0–1: 75.52 [47.36, 112.53] pg/mL vs. F 2–4: 212.12 [144.77, 356.89] vs. F 3–4: 224.12 [224.12, 448.23] pg/mL, p < 0.001, Kruskal-Wallis H test; adj. p for trend = 0.009 after adjustment for age, gender, BMI, and HOMA-IR; Figure 2H).
Longitudinal measurements of sCDCP1 levels before and after bariatric surgery
In addition to cross-sectional studies, we compared the sCDCP1 levels before and after bariatric surgery in 151 obese patients (including 75 patients with NASH) who were prospectively followed up with for 5–15 months (median: 12 months). As expected, the BMIs of the patients decreased (average: 8.9 kg/m2), accompanied by significant improvements in glucose and lipid profiles and reduction in insulin, HOMA-IR, liver enzymes, and CK18 after the operation (Table S3). Compared with the baseline level, the overall sCDCP1 levels decreased from 170.01 (82.69, 354.54) to 91.50 (28.31, 188.21) pg/mL with ΔsCDCP1 of −97.73 (95% CI −118.28, −80.40) pg/mL (p < 0.001). Notably, the magnitude of decrease in sCDCP1 levels in patients with NASH was much greater than in those without NASH (▵sCDCP1, −161.19 [95% CI −187.23, −135.45] in NASH vs. −40.50 [95% CI −54.75, −25.60] pg/mL in non-NASH; p = 0.002; Figure 3A), which remained significant after adjustment for age, gender, HbA1c, type of surgery, and changes in BMI after surgery (p = 0.006). Interestingly, changes in serum sCDCP1 closely paralleled reductions in CK18 levels (Spearman’s p < 0.001, R = 0.56) and liver injury markers ALT (Spearman’s p < 0.001, R = 0.67) and AST (Spearman’s p < 0.001, R = 0.61), further suggesting that sCDCP1 is a robust marker closely related to NASH remission (Figure 3B).
Figure 3.

The decline in serum sCDCP1 was closely associated with decreases in CK18 and liver enzymes after bariatric surgery
(A) Line plot showing paired sCDCP1 serum levels at baseline and follow-up after the surgical intervention in patients with (n = 75) and without (n = 76) NASH.
(B) Correlations heatmap. Delta values (▵) = post-operation values – pre-operation values. Spearman’s R and p values are shown within each rectangle, with color intensity indicating the strength of association. ∗∗∗p < 0.001, ∗∗p < 0.01, ∗p < 0.05
sCDCP1 and sCDCP1-based algorithms for identification and risk stratification of NASH
sCDCP1 as a single biomarker
To assess the diagnostic potential of sCDCP1 for NASH, the main cohort was randomly divided into a training set (n = 326, including 125 patients with NASH) and a test set (n = 163, including 66 patients with NASH) (Table 1), which resulted in AUROC values of 0.874 (95% CI 0.835–0.913) and 0.848 (95% CI 0.788–0.908), respectively. In the external validation cohort, the AUROC was 0.816 (95% CI 0.731–0.901). When combining the test set and external validation cohort into a pooled validation cohort, sCDCP1 showed an AUROC of 0.838 (95% CI 0.789–0.887), which outperformed several existing tests for NASH, including CK18 (0.779, 95% CI 0.724–0.833), the Nice model12 (0.783, 95% CI 0.728–0.837), and the NASH clinical scoring system (NCSS)13 (0.643, 95% CI 0.580–0.706). When the Youden criterium was adopted, sCDCP1 exhibited the highest sensitivity, specificity, negative predictive value (NPV), and positive predictive value (PPV) compared with the above tests (Table S4). Moreover, sCDCP1 was the best-fitting model, as it resulted in the lowest Akaike information criterion (AIC) score (Table S4).
Using the dual threshold approach, the cutoff of sCDCP1 for NASH rule out was <76.0 pg/mL with a sensitivity of 90.4%, a specificity of 62.2%, and an NPV of 91.2%, while the cutoff for NASH rule in was ≥153.3 pg/mL with a sensitivity of 64.8%, a specificity of 90.1%, and a PPV of 80.2% in the training set. When applying these two cutoffs to the test set and the external validation cohort, similar NPVs and PPVs were observed (Table S5). Approximately 70% of patients were classified, with “gray areas” of 34.4%, 25.8%, 41.5%, and 34.2% in the training set, test set, external validation cohort, and pooled validation cohort, respectively.
sCDCP1-based algorithm for identification of NASH
To further improve the efficiency in diagnosing NASH, two models were constructed and compared (Table S6). The C-DAG model, combining sCDCP1 and 3 clinical variables (diabetes [yes = 1 and no = 0], AST, and gender [female = 0 and male = 1]), was finally selected to predict the outcome of interest. The C-DAG score is defined as
Our analysis showed that the C-DAG score was sensitive to each individual histological feature and was not impacted by medication use (adj. OR = 549.14, 95% CI 188.08–1,603.38; p < 0.001) (Figure S3). Furthermore, the C-DAG score also demonstrated a significant decrease after bariatric surgery (0.477 [0.181, 0.871] pre-surgery vs. 0.244 [0.136, 0.494] post-surgery, p < 0.001). Compared with sCDCP1 as a single marker, the diagnostic accuracy of the C-DAG model for NASH further improved the AUROCs to 0.911 (95% CI 0.881–0.941), 0.891 (95% CI 0.844–0.939), and 0.895 (95% CI 0.844–0.946) in the training set, test set, and external validation cohort, respectively (Table 2). In the pooled validation cohort, the C-DAG model showed an AUROC of 0.893 (95% CI 0.859–0.927), significantly outperforming sCDCP1 alone (0.838, 95% CI 0.789–0.887, p = 0.004), CK18 (0.779, 95% CI 0.724–0.833, p < 0.001), the Nice model (0.783, 95% CI 0.728–0.837, p < 0.001), and the NCSS (0.643, 95% CI 0.580–0.706, p < 0.001) (Figure 4A). Moreover, C-DAG had the lowest AIC, indicating the best fit, and decision curve analyses showed that C-DAG had the highest clinical net benefit, further supporting that this algorithm will lead to the best clinical results (Figure S4A). Notably, the results of sensitivity analyses showed that the AUROCs of C-DAG remained stable (>0.80) regardless of gender, age, BMI, and presence/absence of diabetes, hypertension, or MetS in both the training set and the pooled validation cohort and were significantly superior to the performance of sCDCP1 alone and CK18 (Figure S5).
Table 2.
Diagnostic performance of C-DAG algorithm for identifying patients with NASH
| Training set (n = 326) | Test set (n = 163) | External validation cohort (n = 135) | Pooled validation cohort (n = 298) | |
|---|---|---|---|---|
| Number of patients with NASH | 125 | 66 | 43 | 109 |
| AUROC (95% CI) | 0.911 (0.881–0.941) | 0.891 (0.844–0.939) | 0.895 (0.844–0.946) | 0.893 (0.859–0.927) |
| Delong’s test p (vs. sCDCP1) | <0.001 | 0.071 | 0.017 | 0.004 |
| Rule-out cutoff | <0.235 | <0.235 | <0.235 | <0.235 |
| n (%) | 166 (50.9) | 69 (42.3) | 77 (57.0) | 145 (48.7) |
| Sensitivity, % | 90.3 | 93.9 | 86.0 | 90.8 |
| Specificity, % | 76.1 | 66.0 | 77.2 | 71.4 |
| NPV, % | 92.7 | 94.1 | 92.2 | 93.1 |
| Rule-in cutoff | ≥0.393 | ≥0.393 | ≥0.393 | ≥0.393 |
| n (%) | 111 (34.0) | 73 (44.8) | 42 (31.1) | 115 (38.6) |
| Sensitivity, % | 72.8 | 77.3 | 65.1 | 72.5 |
| Specificity, % | 90.0 | 78.4 | 85.9 | 81.5 |
| PPV, % | 82.0 | 70.8 | 68.3 | 69.3 |
| Gray zone n (%) | 49 (15.0) | 21 (12.9) | 16 (11.9) | 38 (12.8) |
The pooled validation cohort combines the test sets of the main cohort and the external validation cohort. NASH, non-alcoholic steatohepatitis; PPV, positive predictive value; NPV, negative predictive value.
Figure 4.

Comparison of the performance of sCDCP1 with CK18 and other non-invasive tests in diagnosing NASH and fibrotic NASH
(A and B) ROC curve of NASH (A) and fibrotic NASH (B) diagnosis in training set, test set, external validation cohort, and pooled validation cohort. The training set (n = 326) and the test set (n = 163) were split from the main cohort (n = 489) recruited from the First Affiliated Hospital of Jinan University in a ratio of 2:1. The external validation cohort (n = 135) was enrolled from three independent centers. The test set and the external validation cohort were combined into the pooled validation cohort (n = 298). NCSS, NASH clinical scoring system.
In the pooled validation cohort, a cutoff of 0.235 gave a sensitivity of 90.8%, a specificity of 71.4%, and an NPV of 93.1% for ruling out NASH. Conversely, a cutoff of 0.393 gave a specificity of 81.5%, a sensitivity of 72.5%, and a PPV of 69.3% for ruling in NASH.
The “gray zones” were 15.0%, 12.9%, 11.9%, and 12.8% in the training set, test set, external validation cohort, and pooled validation cohort, respectively, indicating that the C-DAG algorithm yielded actionable clinical results in approximately 90% of patients (Table 2).
C-DAG algorithm for risk stratification of fibrotic NASH
Patients with fibrotic NASH are at higher risk of disease progression and are candidates for clinical trials and emerging pharmacotherapies.14 Therefore, we subsequently evaluated the efficiency of C-DAG for identification of fibrotic NASH from all obese individuals (n = 54 in training set and 49 in pooled validation cohort). The AUROCs were 0.913 (95% CI 0.874–0.952) in the training set, 0.900 (95% CI 0.843–0.957) in the test set, and 0.934 (95% CI 0.885–0.982) in the external validation cohort. In the pooled validation cohort, the AUROC obtained from the C-DAG algorithm was 0.908 (95% CI 0.869–0.948), which was significantly higher than the AUROCs obtained with the other indices15: AUROC CK18 = 0.811 (95% CI 0.742–0.880; p = 0.017), AST-to-platelet ratio index (APRI) = 0.815 (95% 0.753–0.878; p = 0.002), fibrosis-4 index (FIB-4) = 0.652 (95% CI 0.564–0.741; p < 0.001), and NAFLD fibrosis score (NFS) = 0.588 (95% CI 0.489–0.677; p < 0.001) (Figure 4B). Decision curves also indicated that C-DAG had the highest clinical net benefit compared with the other tests (Figure S4B). The cutoff for rule out of at-risk NASH was 0.342 and for rule in was 0.632 in the training set, with the full diagnostic performance detailed in Table 3. In the training set, the NPV and the PPV were 92.8% and 60.3%, respectively, and 56 (17.2%) patients were in the gray zone. When these cutoffs were applied to the pooled validation cohort, the PPV and the NPV were 56.5% and 91.6%, respectively, with 56 (18.8%) patients in the gray zone. Table S7 compares the diagnostic performance of our C-DAG score with APRI, FIB-4, and NFS using dual cutoffs. In the pooled validation cohort, the C-DAG score demonstrated the highest diagnostic efficiency with the smallest proportion of patients classified into the gray zone (18.8%). In contrast, the percentages of patients falling into gray zones, as calculated by APRI, FIB-4, and NFS, were 43.6%, 44.6%, and 35.2%, which were significantly higher than that determined by C-DAG.
Table 3.
Diagnostic performance of C-DAG algorithm for identifying patients with fibrotic NASH
| Training set (n = 326) | Test set (n = 163) | External validation cohort (n = 135) | Pooled validation cohort (n = 298) | |
|---|---|---|---|---|
| Number of patients with fibrotic NASH | 54 | 28 | 21 | 49 |
| AUROC (95% CI) | 0.913 (0.874–0.952) | 0.900 (0.843–0.957) | 0.934 (0.885–0.982) | 0.908 (0.869–0.948) |
| Rule-out cutoff | <0.342 | <0.342 | <0.342 | <0.342 |
| n (%) | 202 (62.0) | 84 (51.5) | 88 (65.2) | 172 (57.7) |
| Sensitivity, % | 90.7 | 96.4 | 95.2 | 95.9 |
| Specificity, % | 72.1 | 60.7 | 76.3 | 68.3 |
| NPV, % | 92.8 | 88.1 | 94.6 | 91.6 |
| Rule-in cutoff | ≥0.632 | ≥0.632 | ≥0.632 | ≥0.632 |
| n (%) | 68 (20.9) | 47 (28.8) | 24 (17.8) | 70 (23.5) |
| Sensitivity, % | 75.9 | 85.7 | 71.4 | 79.6 |
| Specificity, % | 90.1 | 83.7 | 93.0 | 88.0 |
| PPV, % | 60.3 | 52.2 | 65.3 | 56.5 |
| Gray zone n (%) | 56 (17.2) | 32 (19.6) | 23 (17.0) | 56 (18.8) |
The pooled validation cohort combines the test sets of the main cohort and the external validation cohort. NASH, non-alcoholic steatohepatitis; PPV, positive predictive value; NPV, negative predictive value.
Discussion
The lack of reliable, non-invasive tests for the early diagnosis and risk stratification of NASH represents a major challenge for clinical management. In this study, we identified serum sCDCP1 as a top-ranked biomarker for stratifying patients with NASH from patients with NL and NAFL and observed a close association between increased CDCP1 mRNA expression in the liver and elevated circulating sCDCP1 in patients with NASH. Furthermore, we developed a highly sensitive ELISA for quantitative measurement of circulating sCDCP1 and validated its diagnostic accuracy, sensitivity, and specificity for NASH in liver biopsy-proven NAFLD cohorts recruited from four different clinical centers across different geographic regions in China.
CDCP1 is a 135–150 kDa transmembrane glycoprotein comprising 836 amino acids also known as CD318, SIMA135, gp140, and Trask.16,17 It has 3 extracellular domains, a transmembrane domain, and a cytoplasmic domain that is highly tyrosine phosphorylated and overexpressed in several types of cancers.18 sCDCP1 is a 65 kDa amino-terminal fragment cleaved from the ectodomain at R368 or K369 of CDCP1 by proteases such as urokinase, tissue plasminogen activator, and plasmin.19 Proteomic cleavage of CDCP1 is obligatory for dimerization of the membrane-spanning carboxyl-terminal fragment, which in turn triggers tyrosine phosphorylation and activation of several key oncogenic and metastatic signaling cascades.20 However, the functional role of sCDCP1 shed from the plasma membrane remains largely elusive, except one report has shown that it acts as a potential ligand for CD6 involved in development of autoimmune diseases.17 Several recent omics-based studies have identified serum sCDCP1 as a reliable biomarker for hepatic steatosis closely associated with liver fat deposition and liver enzymes in patients with NAFLD.21,22,23 However, diagnosis of NAFLD was made by various imaging methods in the aforementioned studies, without reference to liver histological parameters. In the current study, we identified sCDCP1, out of 874 serum proteins, as the most discriminatory biomarker for identification of NASH and observed a close correlation of serum sCDCP1 with several key histological features of NASH (lobular inflammation and ballooning) and fibrosis. Furthermore, our results demonstrated markedly increased CDCP1 gene expression in the liver as an important source for the elevated circulating sCDCP1 in patients with NASH.
Notably, several known inducers of CDCP1 gene expression, such as hypoxia,24 Ras/ERK 1/2 signaling,25 ADAM9 metallopeptidase,26,27 and Caveolin-1,28,29 have been reported to promote NASH development. The downstream signaling pathways of CDCP1, including PKCδ and ERK1/2, have been implicated in the onset and progression of steatohepatitis and liver fibrosis,30 suggesting the possible involvement of CDCP1 and/or its secreted form in the pathogenesis of NASH. In line with previous reports showing the positive correlation of circulating sCDCP1 with impaired insulin secretion,31 insulin resistance,32,33 and body fat and ectopic visceral fat deposition,21,22,34 our study found a close association of high serum sCDCP1 with the presence of diabetes, dyslipidaemia, and MetS, well-known metabolic contributors to NASH development.
Although a number of protein biomarkers for NASH have been reported, none of them have been implemented clinically due to the lack of specificity, reproducibility, accuracy, and independent validation. The M30 fragment of CK18, which is cleaved by caspases during cell apoptosis into the bloodstream, has been extensively validated as a NASH biomarker with reasonable diagnostic accuracy and has been used as a surrogate marker for NASH-related clinical trials.35 Nevertheless, it has not been introduced into the clinic due to the lack of standardized cutoffs (spanning from 111 to 670 U/L in different studies), and its diagnostic performance for NASH varies considerably among different cohorts, ranging from 0.66 to 0.93.36,37 In both our training and validation cohorts, we found that sCDCP1 as a standalone biomarker can identify patients with NASH with excellent reproducibility and accuracy with much better diagnostic performance than CK18 and the CK18-based Nice model and the NCSS, as determined by comparison of AUROCs, NPVs, PPVs, AICs, and clinical net benefits.
To further improve the diagnostic performance of sCDCP1 for NASH, we constructed the C-DAG model integrating sCDCP1 with three routine clinical parameters (diabetes, AST, and gender), which are well-established risk factors for NASH development. In the pooled validation cohort, the C-DAG algorithm further improved the diagnostic performance for NASH identification from an AUROC of 0.838 of sCDCP1 as a standalone marker to 0.893 with stable performance across all subgroups classified by age, gender, BMI, or other metabolic comorbidities. Furthermore, compared with sCDCP1, CK18, APRI, FIB-4, and NFS, the sCDCP1-based C-DAG algorithm exhibited the best performance in identifying fibrotic NASH, demonstrating its clinical applicability as a non-invasive test for screening both early and fibrotic NASH in high-risk populations such as obese individuals. Although the ARPI test showed the acceptable AUROC values for both the training set and the pooled validation cohort in our study, a significantly higher proportion of patients (approximately 40%) fell into the gray zone compared to the C-DAG test (<20%). The FIB-4 and NFS scores exhibited suboptimal performance in this study, possibly due to the fact that age is an important factor for calculation of both FIB-4 and NFS scores, whereas our study population consisted primarily of young adults.
In the clinic, patients with a C-DAG score <0.235 can be effectively ruled out for NASH and can avoid further invasive liver biopsy examination. Those patients with a C-DAG score ≥0.632 (rule-in cutoff value of fibrotic NASH) should be referred to hepatologists for further evaluation and timely therapeutic and lifestyle interventions. The C-DAG score can also be used to assist the selection of patients with NASH for evaluation of novel pharmacotherapies in clinical trials. NIS4, an algorithm recently developed based on a four-biomarker panel blood test (miR-34a-5p, alpha-2 macroglobulin, YKL-40, and HbA1c), has also been validated in several large-scale cohorts for non-invasive diagnosis of fibrotic NASH in the European population.38 However, unlike our cohorts, only fibrotic NASH was included for establishment of the NIS4 algorithm, and it remains unclear whether NIS4 can detect NASH without fibrosis. Further studies are warranted to compare the performance of our C-DAG and NIS4 in the diagnoses of NASH and fibrotic NASH in different populations.
Although there are currently no FDA-approved drugs available for treatment of NASH, bariatric surgery has been shown to be highly effective in ameliorating NASH in obese individuals.39 Our longitudinal study observed marked decreases in circulating sCDCP1 after bariatric surgery, independent of weight loss. Furthermore, the magnitude of decreases in sCDCP1 is more obvious than CK18 and is closely associated with the liver injury markers ALT and AST even after adjustment for multiple cofactors, further supporting the use of sCDCP1 as a robust biomarker for surrogate endpoints to monitor NASH progression in clinical trials.
This study has a number of strengths, including our multicenter cohorts with liver-histology-confirmed NAFLD by three independent pathologists, relatively large sample sizes, unbiased large-scale proteomics screening, biological plausibility demonstrated by paired hepatic transcripts, and high diagnostic performance of sCDCP1 and an sCDCP1-based algorithm for detection and risk stratification of NASH. The sCDCP1 immunoassay and the C-DAG algorithm established in this study may represent highly promising non-invasive tools for clinical management of NASH in obese individuals.
In conclusion, our study demonstrated that sCDCP1 is associated with the activity of NASH and that the sCDCP1-based algorithm outperformed CK18 for both early diagnosis and risk stratification of NASH. These data support the use of sCDCP1 and the C-DAG model as easy-to-implement tools to identify patients with NASH who are eligible for inclusion in clinical trials and to avoid unnecessary liver biopsy in low-risk individuals.
Limitations of this study
A major limitation of the study is that we were unable to examine the direct relationship between changes in circulating sCDCP1 and regression of NASH due to the lack of liver biopsies during prospective follow-up after bariatric surgery. Moreover, the sCDCP1 and C-DAG model for NASH was developed and validated only in morbidly obese Chinese individuals with relatively young age and a high percentage of non-fibrotic NASH. Further studies in different ethnic groups with a wide age range are warranted to validate the diagnostic efficacy of sCDCP1 and C-DAG and to evaluate the generalizability of sCDCP1 as a NASH biomarker in non-obese populations and cohorts with higher proportions of fibrotic NASH.
STAR★Methods
Key resources table
| REAGENT or RESOURCE | SOURCE | IDENTIFIER |
|---|---|---|
| Antibodies | ||
| Human CDCP1 antibody | R & D Systems | Cat# AF2666; RRID: AB_442166 |
| Biological samples | ||
| Human blood serum | This paper | N/A |
| Chemicals, peptides, and recombinant proteins | ||
| Human CDCP1 protein (extracellular domain) | Immunodiagnostics | Cat# 41C011; RRID: N/A |
| Critical commercial assays | ||
| Olink CARDIOMETABOLIC(v.3602) | Olink | N/A |
| Olink CARDIOVASCULAR II(v.5004) | Olink | N/A |
| Olink CARDIOVASCULAR III(v.6112) | Olink | N/A |
| Olink CELL REGULATION(v.3702) | Olink | N/A |
| Olink DEVELOPMENT(v.3511) | Olink | N/A |
| Olink IMMUNE RESPONSE(v.3202) | Olink | N/A |
| Olink INFLAMMATION(v.3012) | Olink | N/A |
| Olink METABOLISM(v.3403) | Olink | N/A |
| Olink NEURO EXPLORATORY(v.3901) | Olink | N/A |
| Olink NEUROLOGY(v.8012) | Olink | N/A |
| Olink ONCOLOGY II(v.7003) | Olink | N/A |
| Olink ORGAN DAMAGE(v.3311) | Olink | N/A |
| M30 fragment of cytokeratin 18 ELISA kit | Diapharma | Cat# P10011 |
| sCDCP1 ELISA kit | This paper | N/A |
| Deposited data | ||
| RNA-Seq data | This paper | NCBI BioProject: PRJNA1021341 |
| Olink data | This paper | Figshare: https://doi.org/10.6084/m9.figshare.23828121.v3 |
| R code | This paper | Zenodo: https://zenodo.org/record/8361775 |
| Oligonucleotides | ||
| CDCP1 primer (Forward) 5′-GTTCAAGCTGGAGGACAAGC-3′ |
This paper | N/A |
| CDCP1 primer (Reverse) 5′-CATGGCTCGCTCATTACTCA-3′ |
This paper | N/A |
| Software and algorithms | ||
| R Software | R core Team | https://www.r-project.org |
| SPSS | IBM | https://www.ibm.com/support/pages/downloading-ibm-spss-statistics-26 |
Resource availability
Lead contact
Further information and requests for resources and reagents should be directed to the lead Contact, Aimin Xu (amxu@hku.hk).
Materials availability
All reagents generated in this study are available from the Lead Contact with a completed Materials Transfer Agreement.
Experimental model and study participant details
Discovery cohort
A total of 302 patients with obesity were screened for eligibility from the bariatric surgery clinic at the First Affiliated Hospital of Jinan University, China, during the period January 2017 to January 2019. Detailed inclusion and exclusion criteria were as follows:
Inclusion: (1) older than 18 years; (2) alcohol consumption less than 140 g/week for males or 70 g/week for females.
Exclusion: (1) positive for HBsAg or anti-HCV Ab; (2) hepatocellular carcinoma or any other cancer; (3) other chronic liver disease including viral hepatitis, autoimmune liver disease, drug-induced liver disease, hemochromatosis, α1-antitrypsin deficiency and Wilson’s disease; (4) liver cirrhosis-related complications including ascites and portal hypertension; (5) unqualified liver biopsy that was not adequate in length or was uninterpretable.
A total of 238 participants spanning the full spectrum of NAFLD were enrolled, referred as the discovery cohort, and subjected to Olink proteomic screening. 98 subjects were randomly selected from this cohort according to a balanced distribution of histological stages for further RNA sequencing analysis.
Main cohort
A prospective cohort from the First Affiliated Hospital of Jinan University was recruited From January 2019 to March 2022. A total of 621 consecutive cases were evaluated with the same inclusion and exclusion criteria as above; 489 patients with qualifying liver biopsy samples were finally enrolled into the main cohort for biomarker validation and model establishment. This study was approved by the Institutional Review Board of Jinan University (2016-017) and the University of Hong Kong/Hospital Authority Hong Kong West Cluster (UW 20–700).
External validation cohort
A total of 135 cases for external validation were enrolled from 3 independent centers from March 2021 to January 2022 with the same inclusion and exclusion criteria as above, including i) Department of Hepatobiliary and intestinal Hernia Surgery, Zhengzhou Second Hospital, Zhengzhou, China (n = 43); ii) Department of General surgery, the Second Hospital of Anhui Medical University, Hefei, China (n = 56); and iii) Department of Gastrointestinal surgery, General hospital of Ningxia Medical University, YinChuan, China (n = 36). This study was approved by the Second Hospital of Anhui Medical University (YX2021-099(F1)), Zhengzhou Second Hospital (2020-003) and General Hospital of Ningxia Medical University (KYLL-2020-11).
All studies were in accordance with the principles of the Declaration of Helsinki. Written informed consent was obtained from all participants.
Follow-up evaluation after bariatric surgery
A total of 151 patients recruited in the main cohort were followed up for 5–15 months (median: 12 months) after bariatric surgery. Fasting blood specimens were collected for biochemical tests and measurements of serum protein biomarkers with ELISA as described above.
Method details
Liver biopsy and histology
Liver biopsies were obtained from the middle of the right lobe during laparoscopic bariatric surgery for all participants. The biopsies were then processed to generate Hematoxylin-eosin–stained and Masson trichrome–stained slides. Three independent liver pathologists evaluated the slides in a blinded manner at separate pathology laboratories using the NASH Clinical Research Network (NASH CRN) criteria5 to semi-quantitatively assess the presence of steatosis, ballooning, lobular inflammation, and fibrosis. The weighted Kendall interobserver scores were 0.914 for steatosis, 0.778 for inflammation, 0.748 for ballooning, and 0.884 for fibrosis, respectively. Any discrepancies were re-evaluated centrally and discussed among the pathologists until a consensus was reached. The definition of histologically normal liver (NL), NAFL and NASH were based on the Fatty Liver Inhibition of Progression (FLIP) algorithm.40 NASH activity was graded according to the Non-alcoholic Fatty Liver Disease Activity Score (NAS).41 Fibrotic NASH was defined as NASH with NAS score of ≥ 4 with fibrosis stage of ≥ 2.14
Definition of metabolic comorbidities
According to the standards of the American Diabetes Association, type 2 diabetes mellitus (T2DM) was defined as fasting glucose ≥ 7.0 mmol/L or HbA1c ≥ 6.5% or having T2DM history and receiving hypoglycaemic treatment.42 Hypertension was defined as systolic blood pressure (SBP) ≥ 130 mmHg or diastolic blood pressure (DBP) ≥ 80 mmHg or with self-reported hypertension or current use of antihypertensive drugs.43 Dyslipidaemia was defined as the presence of hyper-non-HDL-C (non-HDL-C ≥ 4.14 mmol/L) or hypertriglyceridemia (triglyceride ≥ 1.7 mmol/L).44 The diagnosis of metabolic syndrome (MetS) was defined as meeting 3 or more of the following criteria: (1) waist circumference ≥ 90 cm for male or ≥ 80 cm for female; (2) triglyceride ≥ 1.7 mmol/L; (3) HDL-C < 1.03 mmol/L for men or < 1.3 mmol/L for women; (4) SBP ≥ 130 mmHg or DBP ≥ 85 mmHg; and (5) fasting glucose ≥ 5.6 mmol/L.45
Quantification of biomarkers related to NASH
Serum samples were collected in overnight fasting patients and stored at −80°C for biochemical tests, Olink proteomics analysis (Uppsala, Sweden) and ELISA tests. The Olink assay, as described previously,46 was performed on 12 panels listed in the key resource table, encompassing a total of 1104 proteins. The median intra-assay coefficient of variability (CV) was 10%, as assessed by multiple replicates of a pooled sample included in the experiment. Values were presented as normalized protein expression (NPX) units on a log2 scale. Proteins not detected in >25% of the total sample were excluded from the analysis. For those proteins included in the analysis, values below the lower limit of detection (LOD) of the assay were replaced by the LOD. For biomarker validation, we developed a highly specific and sensitive ELISA for quantification of circulating sCDCP1 in humans.The M30 fragment of cytokeratin 18 (CK18) was analyzed using an ELISA kit according to the manufacturer’s instructions (Cat. No P10011, Diapharma). Total liver RNA was extracted from frozen liver tissues in TRIzol reagent (Invitrogen) using the Allprep DNA/RNA Micro Kit (Qiagen) and processed for RNA-Seq on the Illumina NovaSeq 6000 System or real-time PCR analysis to quantify the relative abundance of CDCP1, as described previously.47 The PCR primers for human CDCP1 were 5′-GTTCAAGCTGGAGGACAAGC-3’ (forward) and 5′-CATGGCTCGCTCATTACTCA-3’ (reverse).
Development of ELISA for quantitative measurements of sCDCP1
Recombinant soluble amino-terminal fragment corresponding to 30–367 amino acid residues of human CDCP1 (Immunodiagnostics, Hong Kong, Cat. No 41C011) were used as antigens for production of antibodies in New Zealand Rabbits and as ligand for affinity purification of anti-human sCDCP1 IgG. The affinity-purified IgG and biotin-labelled antibody (R & D system, Cat. No AF2666) were used for establishment of enzyme-linked immunosorbent assay (ELISA) kits as we described previously48 (Antibody and Immunoassay Services, University of Hong Kong). 100 μL of diluted human serum samples (1:4), calibrators, and quality control samples were applied to 96-well microtiter plates pre-coated with an affinity-purified rabbit anti-human sCDCP1 antibody. A calibration curve was constructed by plotting the absorbance values at 450 nm vs. the human sCDCP1 concentrations of the calibrators, and concentrations of unknown samples were obtained using this calibration curve. The intra- and inter-assay variations of the ELISA kits were evaluated by measuring 3 different samples in 10 replicates in a single assay, or in duplicate in 5 consecutive assays, respectively. The assay range of human sCDCP1 ELISA kit were 15.6–2000 pg/mL, and the lowest levels of human sCDCP1 that can be measured by the assays were 7.8 pg/mL. The intra- and inter-assay coefficient of variation for human sCDCP1 ELISA kit was 2.8–3.9% and 3.7–4.8%, respectively. The spiking recovery rate and linearity rate for human sCDCP1 ELISA kit was 96.4–104.6% and 94.3–114.5% respectively.
Quantification and statistical analysis
The Shapiro-Wilk normality test was used to check the data distribution. Continuous variables are presented as mean ± standard error or as median (inter-quartile range) if skewed. Categorical data are shown as counts and valid percentages. Continuous variables were compared by Student’s t test, Mann–Whitney U-test, one-way ANOVA with post hoc Tukey HSD or Kruskal–Wallis H test followed by Dunn’s test, as appropriate. Categorical variables were compared by the χ2 test or Fisher’s exact test. Analysis of covariance (ANCOVA) was used to evaluate the changes of continuous parameters before and after bariatric surgery.
Random forest and SVM methods were employed to assess the relative importance of each feature to classify NASH. Logistic regression was used to explore the relationship between sCDCP1 levels and the disease stage (NL, NAFL and NASH), grade of each histological feature and the presence/absence of metabolic comorbidities. To calculate odds ratios of NASH using logistic regression, patients were divided into tertiles based on their sCDCP1 levels, with the lowest tertile serving as the reference group.
The main cohort was randomly split into a training set and a test set in a 2:1 ratio with a balanced prevalence of NASH. Receiver operating characteristic (ROC) curve analysis was performed, and the area under the receiver operating characteristic curve (AUROC) and its 95% CI from 1000 times bootstrap were used to evaluate the predictive power. For diagnostic scoring model construction of NASH, in addition to sCDCP1, 125 clinical features were assessed, and 104 parameters with less than 25% missing values were included in this study (Table S8). Further missing data imputation was conducted with missForest package in R (version 4.0.4). The top 10 features with highest mean decrease in accuracy in random forest were included in univariate logistic regression statistics. The variables with p < 0.01 in univariate analysis were then input to multivariate logistic regression analysis. Two scoring algorithms were constructed by using the classic forward or backward stepwise approach, and the model with a lower AIC49 was selected as the best-fitting model. Multicollinearity was considered to be absent when the variance inflation factor (VIF) score was less than 5. AUROCs were compared using DeLong’s test. One optimal cut-off value was selected according to maximized Youden index. Two cut-offs were determined corresponding to 90% sensitivity (rule-out cut-off) and 90% specificity (rule-in cut-off). Values between these 2 cut-offs are referred to as indeterminate or “gray” zone. The positive predictive value (PPV), negative predictive value (NPV) were calculated at different cut-offs of predicted probabilities. AIC and the decision curve analysis (DCA) were used to evaluate the model performance.50 Statistical analyses were performed using SPSS version 26.0 (IBM, Armonk, NY, USA) and R software (version 4.0.4).
Acknowledgments
This work was supported by the National Key R&D Program of China (2022YFA0806102); the Hong Kong Research Grants Council/Area of Excellence (AoE/M-707/18); the European Union-Hong Kong Research and Innovation Cooperation Co-funding Mechanism (E-HKU703/20); National Natural Science Foundation of China (NSFC) grants (82070860 and 82161138026); the Hong Kong Health and Medical Research Fund (07182726); the Key Laboratory of Model Animal Phenotyping and Basic Research in Metabolic Diseases (2018KSYS003); and the Key Research and Development Program of Anhui Province (2022e07020049).
Author contributions
Study design, A.X.; data collection, C.W., E.S., D.Y., W.Y., L.W., and S.H.; data analysis, X.J. and J.C.; histological evaluation, S.C., H.M., and S.Y.; immunoassay development, P.W., Y.H., H.L., and X.J. All investigators contributed to the interpretation of the study results and manuscript writing. All investigators reviewed and approved the final manuscript.
Declaration of interests
The authors declare no competing interests.
Inclusion and diversity
We support inclusive, diverse, and equitable conduct of research.
Published: November 1, 2023
Footnotes
Supplemental information can be found online at https://doi.org/10.1016/j.xcrm.2023.101257.
Contributor Information
Cunchuan Wang, Email: twcc@jnu.edu.cn.
Aimin Xu, Email: amxu@hku.hk.
Supplemental information
Data and code availability
-
•
Olink proteomics data are available at Figshare (https://doi.org/10.6084/m9.figshare.23828121.v3).
-
•
RNA-seq raw data can be accessed under NCBI BioProject accession number PRJNA1021341.
-
•
This study reports original code deposited at Zenodo (https://zenodo.org/record/8361775).
-
•
Any additional information required to reanalyze the data reported in this paper is available from the Lead Contact upon request.
References
- 1.Younossi Z.M., Golabi P., Paik J.M., Henry A., Van Dongen C., Henry L. The global epidemiology of nonalcoholic fatty liver disease (NAFLD) and nonalcoholic steatohepatitis (NASH): a systematic review. Hepatology. 2023;77:1335–1347. doi: 10.1097/HEP.0000000000000004. [DOI] [PMC free article] [PubMed] [Google Scholar]
- 2.Quek J., Chan K.E., Wong Z.Y., Tan C., Tan B., Lim W.H., Tan D.J.H., Tang A.S.P., Tay P., Xiao J., et al. Global prevalence of non-alcoholic fatty liver disease and non-alcoholic steatohepatitis in the overweight and obese population: a systematic review and meta-analysis. Lancet. Gastroenterol. Hepatol. 2023;8:20–30. doi: 10.1016/S2468-1253(22)00317-X. [DOI] [PubMed] [Google Scholar]
- 3.Huang D.Q., El-Serag H.B., Loomba R. Global epidemiology of NAFLD-related HCC: trends, predictions, risk factors and prevention. Nat. Rev. Gastroenterol. Hepatol. 2021;18:223–238. doi: 10.1038/s41575-020-00381-6. [DOI] [PMC free article] [PubMed] [Google Scholar]
- 4.Balp M.M., Krieger N., Przybysz R., Way N., Cai J., Zappe D., McKenna S.J., Wall G., Janssens N., Tapper E. The burden of non-alcoholic steatohepatitis (NASH) among patients from Europe: A real-world patient-reported outcomes study. JHEP Rep. 2019;1:154–161. doi: 10.1016/j.jhepr.2019.05.009. [DOI] [PMC free article] [PubMed] [Google Scholar]
- 5.Kleiner D.E., Brunt E.M., Van Natta M., Behling C., Contos M.J., Cummings O.W., Ferrell L.D., Liu Y.C., Torbenson M.S., Unalp-Arida A., et al. Design and validation of a histological scoring system for nonalcoholic fatty liver disease. Hepatology. 2005;41:1313–1321. doi: 10.1002/hep.20701. [DOI] [PubMed] [Google Scholar]
- 6.Targher G., Bertolini L., Padovani R., Rodella S., Tessari R., Zenari L., Day C., Arcaro G. Prevalence of nonalcoholic fatty liver disease and its association with cardiovascular disease among type 2 diabetic patients. Diabetes Care. 2007;30:1212–1218. doi: 10.2337/dc06-2247. [DOI] [PubMed] [Google Scholar]
- 7.Spengler E.K., Loomba R. Recommendations for Diagnosis, Referral for Liver Biopsy, and Treatment of Nonalcoholic Fatty Liver Disease and Nonalcoholic Steatohepatitis. Mayo Clin. Proc. 2015;90:1233–1246. doi: 10.1016/j.mayocp.2015.06.013. [DOI] [PMC free article] [PubMed] [Google Scholar]
- 8.Ajmera V., Loomba R. Imaging biomarkers of NAFLD, NASH, and fibrosis. Mol. Metabol. 2021;50 doi: 10.1016/j.molmet.2021.101167. [DOI] [PMC free article] [PubMed] [Google Scholar]
- 9.Noureddin M., Truong E., Gornbein J.A., Saouaf R., Guindi M., Todo T., Noureddin N., Yang J.D., Harrison S.A., Alkhouri N. MRI-based (MAST) score accurately identifies patients with NASH and significant fibrosis. J. Hepatol. 2022;76:781–787. doi: 10.1016/j.jhep.2021.11.012. [DOI] [PubMed] [Google Scholar]
- 10.Wong V.W.S., Adams L.A., de Lédinghen V., Wong G.L.H., Sookoian S. Noninvasive biomarkers in NAFLD and NASH - current progress and future promise. Nat. Rev. Gastroenterol. Hepatol. 2018;15:461–478. doi: 10.1038/s41575-018-0014-9. [DOI] [PubMed] [Google Scholar]
- 11.Angelini G., Panunzi S., Castagneto-Gissey L., Pellicanò F., De Gaetano A., Pompili M., Riccardi L., Garcovich M., Raffaelli M., Ciccoritti L., et al. Accurate liquid biopsy for the diagnosis of non-alcoholic steatohepatitis and liver fibrosis. Gut. 2023;72:392–403. doi: 10.1136/gutjnl-2022-327498. [DOI] [PMC free article] [PubMed] [Google Scholar]
- 12.Anty R., Iannelli A., Patouraux S., Bonnafous S., Lavallard V.J., Senni-Buratti M., Amor I.B., Staccini-Myx A., Saint-Paul M.C., Berthier F., et al. A new composite model including metabolic syndrome, alanine aminotransferase and cytokeratin-18 for the diagnosis of non-alcoholic steatohepatitis in morbidly obese patients. Aliment. Pharmacol. Ther. 2010;32:1315–1322. doi: 10.1111/j.1365-2036.2010.04480.x. [DOI] [PubMed] [Google Scholar]
- 13.Campos G.M., Bambha K., Vittinghoff E., Rabl C., Posselt A.M., Ciovica R., Tiwari U., Ferrel L., Pabst M., Bass N.M., Merriman R.B. A clinical scoring system for predicting nonalcoholic steatohepatitis in morbidly obese patients. Hepatology. 2008;47:1916–1923. doi: 10.1002/hep.22241. [DOI] [PubMed] [Google Scholar]
- 14.Schwabe R.F., Tabas I., Pajvani U.B. Mechanisms of Fibrosis Development in Nonalcoholic Steatohepatitis. Gastroenterology. 2020;158:1913–1928. doi: 10.1053/j.gastro.2019.11.311. [DOI] [PMC free article] [PubMed] [Google Scholar]
- 15.Shah A.G., Lydecker A., Murray K., Tetri B.N., Contos M.J., Sanyal A.J., Nash Clinical Research Network Comparison of noninvasive markers of fibrosis in patients with nonalcoholic fatty liver disease. Clin. Gastroenterol. Hepatol. 2009;7:1104–1112. doi: 10.1016/j.cgh.2009.05.033. [DOI] [PMC free article] [PubMed] [Google Scholar]
- 16.Hooper J.D., Zijlstra A., Aimes R.T., Liang H., Claassen G.F., Tarin D., Testa J.E., Quigley J.P. Subtractive immunization using highly metastatic human tumor cells identifies SIMA135/CDCP1, a 135 kDa cell surface phosphorylated glycoprotein antigen. Oncogene. 2003;22:1783–1794. doi: 10.1038/sj.onc.1206220. [DOI] [PubMed] [Google Scholar]
- 17.Enyindah-Asonye G., Li Y., Ruth J.H., Spassov D.S., Hebron K.E., Zijlstra A., Moasser M.M., Wang B., Singer N.G., Cui H., et al. CD318 is a ligand for CD6. Proc. Natl. Acad. Sci. USA. 2017;114:E6912–E6921. doi: 10.1073/pnas.1704008114. [DOI] [PMC free article] [PubMed] [Google Scholar]
- 18.Lim S.A., Zhou J., Martinko A.J., Wang Y.H., Filippova E.V., Steri V., Wang D., Remesh S.G., Liu J., Hann B., et al. Targeting a proteolytic neoepitope on CUB domain containing protein 1 (CDCP1) for RAS-driven cancers. J. Clin. Invest. 2022;132 doi: 10.1172/JCI154604. [DOI] [PMC free article] [PubMed] [Google Scholar]
- 19.Kryza T., Khan T., Lovell S., Harrington B.S., Yin J., Porazinski S., Pajic M., Koistinen H., Rantala J.K., Dreyer T., et al. Substrate-biased activity-based probes identify proteases that cleave receptor CDCP1. Nat. Chem. Biol. 2021;17:776–783. doi: 10.1038/s41589-021-00783-w. [DOI] [PubMed] [Google Scholar]
- 20.Wright H.J., Arulmoli J., Motazedi M., Nelson L.J., Heinemann F.S., Flanagan L.A., Razorenova O.V. CDCP1 cleavage is necessary for homodimerization-induced migration of triple-negative breast cancer. Oncogene. 2016;35:4762–4772. doi: 10.1038/onc.2016.7. [DOI] [PMC free article] [PubMed] [Google Scholar]
- 21.Zeybel M., Altay O., Arif M., Li X., Yang H., Fredolini C., Akyildiz M., Saglam B., Gonenli M.G., Ural D., et al. Combined metabolic activators therapy ameliorates liver fat in nonalcoholic fatty liver disease patients. Mol. Syst. Biol. 2021;17 doi: 10.15252/msb.202110459. [DOI] [PMC free article] [PubMed] [Google Scholar]
- 22.Lovric A., Granér M., Bjornson E., Arif M., Benfeitas R., Nyman K., Ståhlman M., Pentikäinen M.O., Lundbom J., Hakkarainen A., et al. Characterization of different fat depots in NAFLD using inflammation-associated proteome, lipidome and metabolome. Sci. Rep. 2018;8 doi: 10.1038/s41598-018-31865-w. [DOI] [PMC free article] [PubMed] [Google Scholar]
- 23.Zeybel M., Arif M., Li X., Altay O., Yang H., Shi M., Akyildiz M., Saglam B., Gonenli M.G., Yigit B., et al. Multiomics Analysis Reveals the Impact of Microbiota on Host Metabolism in Hepatic Steatosis. Adv. Sci. 2022;9 doi: 10.1002/advs.202104373. [DOI] [PMC free article] [PubMed] [Google Scholar]
- 24.Emerling B.M., Benes C.H., Poulogiannis G., Bell E.L., Courtney K., Liu H., Choo-Wing R., Bellinger G., Tsukazawa K.S., Brown V., et al. Identification of CDCP1 as a hypoxia-inducible factor 2alpha (HIF-2alpha) target gene that is associated with survival in clear cell renal cell carcinoma patients. Proc. Natl. Acad. Sci. USA. 2013;110:3483–3488. doi: 10.1073/pnas.1222435110. [DOI] [PMC free article] [PubMed] [Google Scholar]
- 25.Uekita T., Fujii S., Miyazawa Y., Iwakawa R., Narisawa-Saito M., Nakashima K., Tsuta K., Tsuda H., Kiyono T., Yokota J., Sakai R. Oncogenic Ras/ERK signaling activates CDCP1 to promote tumor invasion and metastasis. Mol. Cancer Res. 2014;12:1449–1459. doi: 10.1158/1541-7786.MCR-13-0587. [DOI] [PubMed] [Google Scholar]
- 26.Schmidt-Arras D., Rose-John S. Regulation of Fibrotic Processes in the Liver by ADAM Proteases. Cells. 2019;8 doi: 10.3390/cells8101226. [DOI] [PMC free article] [PubMed] [Google Scholar]
- 27.Lin C.Y., Chen H.J., Huang C.C., Lai L.C., Lu T.P., Tseng G.C., Kuo T.T., Kuok Q.Y., Hsu J.L., Sung S.Y., et al. ADAM9 promotes lung cancer metastases to brain by a plasminogen activator-based pathway. Cancer Res. 2014;74:5229–5243. doi: 10.1158/0008-5472.CAN-13-2995. [DOI] [PubMed] [Google Scholar]
- 28.Han M., Piorońska W., Wang S., Nwosu Z.C., Sticht C., Wang S., Gao Y., Ebert M.P., Dooley S., Meyer C. Hepatocyte caveolin-1 modulates metabolic gene profiles and functions in non-alcoholic fatty liver disease. Cell Death Dis. 2020;11:104. doi: 10.1038/s41419-020-2295-5. [DOI] [PMC free article] [PubMed] [Google Scholar]
- 29.Fernandez-Rojo M.A., Ramm G.A. Caveolin-1 Function in Liver Physiology and Disease. Trends Mol. Med. 2016;22:889–904. doi: 10.1016/j.molmed.2016.08.007. [DOI] [PubMed] [Google Scholar]
- 30.Foglia B., Cannito S., Bocca C., Parola M., Novo E. ERK Pathway in Activated, Myofibroblast-Like, Hepatic Stellate Cells: A Critical Signaling Crossroad Sustaining Liver Fibrosis. Int. J. Mol. Sci. 2019;20 doi: 10.3390/ijms20112700. [DOI] [PMC free article] [PubMed] [Google Scholar]
- 31.Magnusson L., Espes D., Casas R., Carlsson P.O. Increased Plasma Levels of the Co-stimulatory Proteins CDCP1 and SLAMF1 in Patients With Autoimmune Endocrine Diseases. Front. Immunol. 2020;11:1916. doi: 10.3389/fimmu.2020.01916. [DOI] [PMC free article] [PubMed] [Google Scholar]
- 32.Gummesson A., Björnson E., Fagerberg L., Zhong W., Tebani A., Edfors F., Schmidt C., Lundqvist A., Adiels M., Bäckhed F., et al. Longitudinal plasma protein profiling of newly diagnosed type 2 diabetes. EBioMedicine. 2021;63 doi: 10.1016/j.ebiom.2020.103147. [DOI] [PMC free article] [PubMed] [Google Scholar]
- 33.Herder C., Maalmi H., Strassburger K., Zaharia O.P., Ratter J.M., Karusheva Y., Elhadad M.A., Bódis K., Bongaerts B.W.C., Rathmann W., et al. Differences in Biomarkers of Inflammation Between Novel Subgroups of Recent-Onset Diabetes. Diabetes. 2021;70:1198–1208. doi: 10.2337/db20-1054. [DOI] [PubMed] [Google Scholar]
- 34.Klevebro S., Björkander S., Ekström S., Merid S.K., Gruzieva O., Mälarstig A., Johansson Å., Kull I., Bergström A., Melén E. Inflammation-related plasma protein levels and association with adiposity measurements in young adults. Sci. Rep. 2021;11 doi: 10.1038/s41598-021-90843-x. [DOI] [PMC free article] [PubMed] [Google Scholar]
- 35.Rinella M.E., Dufour J.F., Anstee Q.M., Goodman Z., Younossi Z., Harrison S.A., Loomba R., Sanyal A.J., Bonacci M., Trylesinski A., et al. Non-invasive evaluation of response to obeticholic acid in patients with NASH: Results from the REGENERATE study. J. Hepatol. 2022;76:536–548. doi: 10.1016/j.jhep.2021.10.029. [DOI] [PubMed] [Google Scholar]
- 36.Lee J., Vali Y., Boursier J., Duffin K., Verheij J., Brosnan M.J., Zwinderman K., Anstee Q.M., Bossuyt P.M., Zafarmand M.H. Accuracy of cytokeratin 18 (M30 and M65) in detecting non-alcoholic steatohepatitis and fibrosis: A systematic review and meta-analysis. PLoS One. 2020;15 doi: 10.1371/journal.pone.0238717. [DOI] [PMC free article] [PubMed] [Google Scholar]
- 37.He L., Deng L., Zhang Q., Guo J., Zhou J., Song W., Yuan F. Diagnostic Value of CK-18, FGF-21, and Related Biomarker Panel in Nonalcoholic Fatty Liver Disease: A Systematic Review and Meta-Analysis. BioMed Res. Int. 2017;2017 doi: 10.1155/2017/9729107. [DOI] [PMC free article] [PubMed] [Google Scholar]
- 38.Harrison S.A., Ratziu V., Boursier J., Francque S., Bedossa P., Majd Z., Cordonnier G., Sudrik F.B., Darteil R., Liebe R., et al. A blood-based biomarker panel (NIS4) for non-invasive diagnosis of non-alcoholic steatohepatitis and liver fibrosis: a prospective derivation and global validation study. Lancet. Gastroenterol. Hepatol. 2020;5:970–985. doi: 10.1016/S2468-1253(20)30252-1. [DOI] [PubMed] [Google Scholar]
- 39.Lassailly G., Caiazzo R., Ntandja-Wandji L.C., Gnemmi V., Baud G., Verkindt H., Ningarhari M., Louvet A., Leteurtre E., Raverdy V., et al. Bariatric Surgery Provides Long-term Resolution of Nonalcoholic Steatohepatitis and Regression of Fibrosis. Gastroenterology. 2020;159:1290–1301.e5. doi: 10.1053/j.gastro.2020.06.006. [DOI] [PubMed] [Google Scholar]
- 40.Bedossa P., FLIP Pathology Consortium Utility and appropriateness of the fatty liver inhibition of progression (FLIP) algorithm and steatosis, activity, and fibrosis (SAF) score in the evaluation of biopsies of nonalcoholic fatty liver disease. Hepatology. 2014;60:565–575. doi: 10.1002/hep.27173. [DOI] [PubMed] [Google Scholar]
- 41.Brunt E.M., Kleiner D.E., Wilson L.A., Belt P., Neuschwander-Tetri B.A., NASH Clinical Research Network CRN Nonalcoholic fatty liver disease (NAFLD) activity score and the histopathologic diagnosis in NAFLD: distinct clinicopathologic meanings. Hepatology. 2011;53:810–820. doi: 10.1002/hep.24127. [DOI] [PMC free article] [PubMed] [Google Scholar]
- 42.American Diabetes Association Classification and Diagnosis of Diabetes: Standards of Medical Care in Diabetes-2019. Diabetes Care. 2019;42:S13–S28. doi: 10.2337/dc19-S002. [DOI] [PubMed] [Google Scholar]
- 43.Flack J.M., Adekola B. Blood pressure and the new ACC/AHA hypertension guidelines. Trends Cardiovasc. Med. 2020;30:160–164. doi: 10.1016/j.tcm.2019.05.003. [DOI] [PubMed] [Google Scholar]
- 44.Navar-Boggan A.M., Peterson E.D., D'Agostino R.B., Neely B., Sniderman A.D., Pencina M.J., Pencina M.J. Hyperlipidemia in early adulthood increases long-term risk of coronary heart disease. Circulation. 2015;131:451–458. doi: 10.1161/CIRCULATIONAHA.114.012477. [DOI] [PMC free article] [PubMed] [Google Scholar]
- 45.Alberti K.G.M.M., Zimmet P., Shaw J., IDF Epidemiology Task Force Consensus Group The metabolic syndrome--a new worldwide definition. Lancet. 2005;366:1059–1062. doi: 10.1016/S0140-6736(05)67402-8. [DOI] [PubMed] [Google Scholar]
- 46.Diaz-Canestro C., Chen J., Liu Y., Han H., Wang Y., Honoré E., Lee C.H., Lam K.S.L., Tse M.A., Xu A. A machine-learning algorithm integrating baseline serum proteomic signatures predicts exercise responsiveness in overweight males with prediabetes. Cell Rep. Med. 2023;4 doi: 10.1016/j.xcrm.2023.100944. [DOI] [PMC free article] [PubMed] [Google Scholar]
- 47.Jin L., Geng L., Ying L., Shu L., Ye K., Yang R., Liu Y., Wang Y., Cai Y., Jiang X., et al. FGF21-Sirtuin 3 Axis Confers the Protective Effects of Exercise Against Diabetic Cardiomyopathy by Governing Mitochondrial Integrity. Circulation. 2022;146:1537–1557. doi: 10.1161/CIRCULATIONAHA.122.059631. [DOI] [PubMed] [Google Scholar]
- 48.Yu H., Xia F., Lam K.S.L., Wang Y., Bao Y., Zhang J., Gu Y., Zhou P., Lu J., Jia W., Xu A. Circadian rhythm of circulating fibroblast growth factor 21 is related to diurnal changes in fatty acids in humans. Clin. Chem. 2011;57:691–700. doi: 10.1373/clinchem.2010.155184. [DOI] [PubMed] [Google Scholar]
- 49.Bozdogan H. Model selection and Akaike's Information Criterion (AIC): The general theory and its analytical extensions. Psychometrika. 1987;52:345–370. doi: 10.1007/BF02294361. [DOI] [Google Scholar]
- 50.Fitzgerald M., Saville B.R., Lewis R.J. Decision curve analysis. JAMA. 2015;313:409–410. doi: 10.1001/jama.2015.37. [DOI] [PubMed] [Google Scholar]
Associated Data
This section collects any data citations, data availability statements, or supplementary materials included in this article.
Supplementary Materials
Data Availability Statement
-
•
Olink proteomics data are available at Figshare (https://doi.org/10.6084/m9.figshare.23828121.v3).
-
•
RNA-seq raw data can be accessed under NCBI BioProject accession number PRJNA1021341.
-
•
This study reports original code deposited at Zenodo (https://zenodo.org/record/8361775).
-
•
Any additional information required to reanalyze the data reported in this paper is available from the Lead Contact upon request.