

Summary
The spread of severe acute respiratory syndrome coronavirus 2 (SARS-CoV-2) has fueled the COVID-19 pandemic with its enduring medical and socioeconomic challenges because of subsequent waves and long-term consequences of great concern. Here, we chart the molecular basis of COVID-19 pathogenesis by analyzing patients’ immune responses at single-cell resolution across disease course and severity. This approach confirms cell subpopulation-specific dysregulation in COVID-19 across disease course and severity and identifies a severity-associated activation of the receptor for advanced glycation endproducts (RAGE) pathway in monocytes. In vitro THP1-based experiments indicate that monocytes bind the SARS-CoV-2 S1-receptor binding domain (RBD) via RAGE, pointing to RAGE-Spike interaction enabling monocyte infection. Thus, our results demonstrate that RAGE is a functional receptor of SARS-CoV-2 contributing to COVID-19 severity.
Keywords: COVID-19, SARS-CoV-2, RAGE, single-cell multi-omics, monocytes, longitudinal profiling, disease severity, drug repurposing
Graphical abstract
Highlights
-
•
RAGE activation in monocytes strongly correlates with COVID-19 severity at admission
-
•
Patients’ healing is associated with deactivation of the RAGE pathway
-
•
RAGE and the S1-RBD of SARS-CoV-2 interact directly in silico and in vitro
-
•
RAGE is involved in monocyte permissiveness to SARS-CoV-2 entry
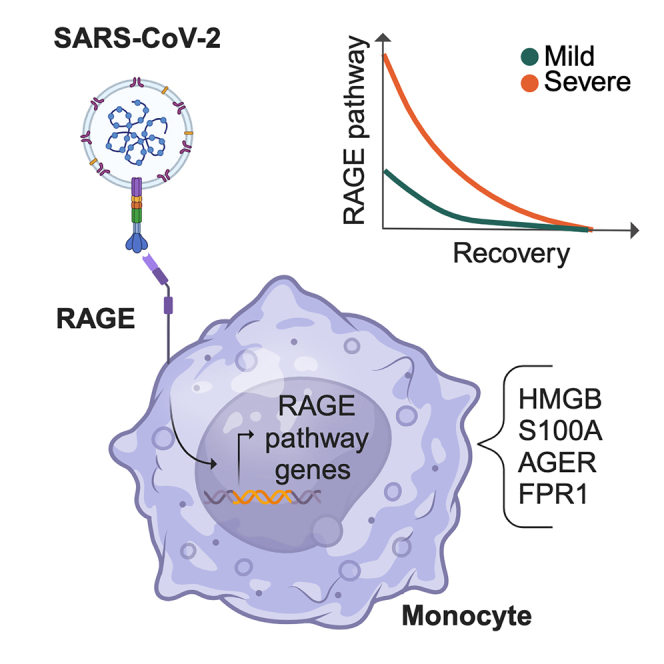
The study by Angioni et al. delves into the mechanisms behind COVID-19’s progression by examining the immune response longitudinally at single-cell multi-omics resolution. The findings highlight activation of the RAGE pathway in monocytes, uncovering its role as a SARS-CoV-2 receptor contributing to COVID-19 severity.
Introduction
Since the onset of the coronavirus disease 2019 (COVID-19) pandemic, more than 535 million infections and over 6 million deaths have been reported worldwide (as of June 2022; https://covid19.who.int/). Despite the striking success of vaccines at mitigating disease severity with the ensuing relaxation of restrictions in many countries, the pandemic remains a major global challenge because of vaccination campaigns remaining largely incomplete when not effectively halted worldwide, lack of timely access to effective oral treatments for most patients, the evolution of new variants with increasing immune escape, and the emergence of post-COVID sequelae at alarming scales. Thus, despite the remarkable progress achieved so far, the elucidation of the molecular pathogenesis of the disease, especially in its most severe forms, remains an obviously pressing need.1
COVID-19 is caused by severe acute respiratory syndrome coronavirus 2 (SARS-CoV-2), an enveloped single-positive-strand RNA virus closely related to severe acute respiratory syndrome coronavirus (SARS-CoV) and Middle East respiratory syndrome coronavirus (MERS-CoV), belonging to the family Coronaviridae and genus Betacoronavirus.2
Structurally, SARS-CoV-2 is shaped by four structural proteins: the nucleocapsid protein (N), membrane protein (M), an envelope protein (E), and the Spike protein (S).3 S is a trimeric glycoprotein with two functional subunits (S1 and S2) responsible for host recognition and virus-host cell membrane fusion, respectively. Through the receptor binding domain (RBD) of the S1 subunit, exposed upon S2 subunit proteolytic activation, SARS-CoV-2 binds to angiotensin-converting enzyme 2 (ACE2) in target cells.4,5 While ACE2 expression can directly account for SARS-CoV-2 pathogenesis in several target organs,6,7 accumulating evidence indicates that additional receptors may be at play in mediating widespread indirect damage through disruption of tissue-specific vascular and immune homeostasis.8,9,10 Likely as a result of the combination of direct and indirect damage, COVID-19 prognosis and its long-term sequelae display remarkable heterogeneity, with host genetics, age, gender, and several comorbidities, such as obesity, hypertension, cardiovascular diseases, chronic kidney disease, and diabetes identified as risk factors of mortality.11,12,13,14 However, the precise molecular mechanisms linking these conditions to a substantial risk for COVID-19 mortality remain to be elucidated.
In general, severe COVID-19 patients show innate immunity deviations (including hyperactivation) associated with an impaired adaptive immune response. The peculiar delayed innate induction, mainly because of compromised type I interferon (IFN) myeloid response, allows a higher extent of viral replication,15 limiting viral clearance and paradoxically aggravating the immunopathological response.16 The resulting inflammation, including the massive release of pro-inflammatory mediators that has been referred to as viral sepsis,17 in turn underlies the severe complications and poor outcome in COVID-19 patients.18
While single-cell omics studies have already provided important insights into the molecular pathogenesis of COVID-19,19,20 much remains to be elucidated about the molecular mechanisms through which the virus induces immune cell dysregulation across disease course and severity. This is particularly the case for the myeloid compartment, which plays pivotal functions in protective and detrimental antiviral responses.21,22,23 Interestingly, though permissive to SARS-CoV-2 infection, circulating monocytes and macrophages do not express ACE2, and phagocytosis of infected cells and antibody-mediated entry24 have been proposed as possible mechanisms for infection. Importantly, high-resolution investigation of the immune landscape in a pre-vaccine cohort of COVID-19 patients is also relevant for the clinical management of patients in the still large group of vaccine-hesitant subjects. Elucidating immune mechanisms contributing to COVID-19 severity in these groups might pave the way to therapeutic options.
The receptor for advanced glycation endproducts (RAGE) is a member of the immunoglobulin receptor superfamily that is considered a pattern recognition receptor (PPR) recognizing a wide range of ligands, including polynucleotides, phosphatidylserine, and high-mobility group box 1 (HMGB1).25 RAGE ligation triggers a cascade of signaling events that have been implicated in various diseases, including cancer, diabetes, and endothelial dysfunction. RAGE internalizes its ligands through the endocytic pathway and induces phagocytosis of apoptotic cells and yeast spores.26 Furthermore, the receptor has been involved in several inflammatory conditions through a signaling pathway that promotes and sustains the activation of the proinflammatory transcription factors nuclear factor κB (NF-κB) and STAT1.27
Here, we adopted a longitudinal design to characterize, at a single-cell multi-omics level, the temporal and severity dynamics of COVID-19 immune response. Our approach identified a severity-associated activation of the RAGE pathway in circulating monocytes. Furthermore, we demonstrated that monocytes bind the SARS-CoV-2 S1-RBD via RAGE and that RAGE-S interactions drive monocyte infection. Finally, the longitudinal analysis allowed us to identify drugs potentially useful to reverse COVID-19 immune dysregulation during the initial stage of the disease, fostering the development of therapeutic strategies.
Results
Single-cell multi-omics characterization of the immune compartment of a longitudinal cohort of COVID-19 patients
Peripheral blood mononuclear cells (PBMCs) from a cohort of 20 COVID-19 patients were longitudinally sampled at hospital admission, discharge, and 1 month thereafter (Table S1). To investigate the molecular dynamics of COVID-19 across time and disease severity (10 patients mild, 3 patients moderate, 4 patients severe, 3 patients critical), we adopted a multi-omics pipeline using a multiwell-based single-cell technology (BD Rhapsody) that includes the analysis of PBMCs’ whole transcriptome and surface proteins (Figure 1A). We normalized and batch-corrected data for 143,428 cells with state-of-the-art tools. Subsequently, we integrated data with Harmony28 (Figures S1A and S1B) and visualized single cells following dimensionality reduction (via principal-component analysis [PCA] and uniform manifold approximation projection [UMAP]) and Leiden clustering to characterize the different immune cell types and subtypes present in our cohort. We then followed complementary approaches, including supervised exploration of marker genes and surface proteins (Figure S1C; Table S3) to annotate the identity of each cluster, including T cells, B cells, myeloid cells, natural killer (NK) cells, and progenitor cells (Figure 1A) (from now on we refer to “cell family” for the identity of the main immune cell types and “cell subclusters” for the identity of the subpopulation of cells included in each cell family). Patients were homogeneously distributed across gender and age (Figures 1A and 1B). To analyze the impact of SARS-CoV-2 infection on the relative abundance of the different immune cell types and point out differences across disease severity and time, we followed a differential abundance analysis that tests for significant changes in cell composition across conditions.29 After quantifying the number of cells per cell family and per cell subcluster, we identified which clusters were depleted or enriched across disease severity and time (Table S3). Among the cell family clusters, we observed a significant increase of progenitors in mild patients at admission and a significant decrease of B cells over time, particularly in severe patients (Figure S2A). When testing for the changes in the subclusters instead, we identified several significant alterations (Figure 1C). Notably, although the expected reduction of IFN-producing monocytes from admission to later time points was consistent across mild and severe patients, there was an opposite trend of CD8+ T effector lymphocytes in mild and severe patients, with an increase in the former and a decrease in the latter. Moreover, the abundance of proliferating CD8+ T cells was higher at admission time in mild compared with severe/critical patients. These results highlight the importance of charting the temporal dynamics of the disease at single-cell resolution and are in line with the enrichment of NK T and proliferating CD8+ T cells in individuals with more severe infection independently observed by Stephenson et al.19To identify the specific longitudinal patterns characterizing the gene expression changes induced by SARS-CoV-2 infection in each cell type along the course of the disease, data were further analyzed through pseudo-bulk expression profiles, generated by summing counts for all cells of the same patients and time points, per cell family cluster, to leverage the statistical rigor of generalized linear models for differential expression analysis.30,31 Next, we performed a regression analysis along disease time separately for mild and severe patients (Figure 2A) to define lists of differentially expressed genes (DEGs) (Table S3) showing a specific pattern of expression change over time (admission, discharge, and follow-up), as shown by the heatmaps in Figure S2B. For each cell family and severity, we focused on the DEGs that increased or decreased linearly over time and characterized them through functional enrichment analysis. By systematically comparing the categories that show significant enrichment across all cell families and severities for the linear-pattern DEGs, we observed that biological domains related to immune response, cell cycle, metabolism, and translational regulation characterize most of the identified DEGs (Figure 2B). In detail, we observed significantly enriched pathways in metabolic, mitochondrial, and ribosomal associated gene families in T cells (Figure 2B; Table S3). Concomitantly, as expected, the functional enrichment analysis revealed a widespread activation of genes belonging to the immune response pathway family. Looking more in depth at the specific differences in the immune response pathway of each cell family in severe/critical versus mild patients (Figure 2C), in line with previous reports,32 we observed a strong enrichment in family pathways associated with the IFN signaling and antiviral response, mainly in B, myeloid, and NK cells, with a decreasing trend of expression over time, independent from patients’ severity. On the other hand, in innate cells (myeloid and NK cell families), the analysis revealed activation of genes involved in positive or negative immune response regulation in mild and more severe patients over time. Conversely, in myeloid and T cells, antigen (Ag) processing and Ag-dependent responses were up-regulated over time, especially in severe patients. Intriguingly, among the significantly enriched pathways, we identified only one category underpinning the direct involvement of a receptor, Gene Ontology (GO):0050786 “RAGE receptor binding” (Figure 2C).
Figure 1.

COVID-19 patient single-cell transcriptomic data and cell population enrichment
(A) Overview of cell clusters by uniform manifold approximation projection (UMAP) plots from the analysis of 143,428 single cells from 20 patients. Main clusters were identified and annotated by family and then classified in subclusters by specific cell type and their distribution over time (admission, discharge, and post 1 month).
(B) UMAP plot of the cell colored by patient gender (left), by patient age binned in 10-year intervals (center), and by patient ID code (right).
(C) Box-and-whisker plots showing the significant changes of cell type abundance for the COVID-19 samples across time and patient severity (“sev+cri” labels the combined group of severe and critical patients). The box shows the dataset quartiles, while the whiskers extend to the rest of the distribution, except for “outlier” points that are below/above the first/third quartile with a distance of more than 1.5 times the interquartile range. The p values reported are not corrected for multiple testing. ∗p ≤ 0.05, ∗∗p ≤ 0.01, ∗∗∗p ≤ 0.001.
See also Figures S1 and S2A.
Figure 2.

Functional enrichment analysis
(A) Schematic of the pseudo-bulk differential expression analysis that was done with the single-cell data.
(B) Stacked histograms reporting the counts of significantly enriched pathways (false discovery rate [FDR] ≤0.001 for terms with the number of genes in background between 3 and 500) by cell population, expression trend over time, and severity; the counts were normalized by the total number of terms mapped onto each pathway family.
(C) Heatmap showing the distribution of the significantly enriched terms related to immunity response among the DEGs identified for each cell population, colored according to −log(FDR) of the enrichment analysis.
See also Figure S2.
RAGE pathway activation in Monocytes_IFN is a signature of disease severity at admission time
RAGE has been implicated in the pathogenesis of several disorders and associated with conditions that predispose to development of severe or critical COVID-19, such as diabetes, hypertension, and aging.33 In our analysis, up-regulation of the RAGE pathway in myeloid cells emerged as a signature of severe/critical patients. Interestingly, myeloid cells are known to be permissive to SARS-CoV entry34 even though they do not express ACE2, the conventional SARS-CoV and SARS-CoV-2 receptor35,36 We thus reasoned that SARS-CoV-2 might interact with RAGE and trigger signaling events in myeloid cells of COVID-19 patients. We computed the average expression of the genes included in the GO:0050786 “RAGE receptor binding” category (pathway score).37 We observed that the RAGE pathway score was negligible in all other cell families but much higher in monocytes (Figures 3A and 3B), particularly in IFN-activated monocytes (Figures 3B and 3C). Moreover, we found a significant decrease of the pathway over our longitudinal timeline and a significant difference in its expression between mild and non-mild patients at admission (Figure 3D). All single genes of the RAGE pathway plotted in monocytes are depicted in Figure S2C.
Figure 3.

RAGE pathway enrichment
(A) UMAP plot of the average expression of the RAGE pathway, defined as the gene score of the RAGE receptor binding GO term (GO:0050786).
(B) View of selected myeloid populations (left) with the corresponding RAGE pathway gene score (right) shown in a re-computed UMAP plot.
(C) Dot plot of the average expression values of the GO:0050786 gene list for each of the selected myeloid subclusters. Dots are colored according to the expression value averaged over cells labeled with the same cell type and standardized between 0 and 1 for each variable considered. The size of the dot indicates the fraction of cells within each group with an expression value greater than 0.
(D) Differential analysis of the RAGE pathway gene score across time and patient severity. The box-and-whisker plot shows the value of the RAGE pathway gene score for all samples averaged over the cells of the myeloid family. The box and the whiskers are defined analogously to Figure 1B. The table lists some RAGE pathway enrichment p values, computed as described in STAR Methods.
See also Figure S2.
Remarkably, we observed that RAGE pathway activation is a reproducible signature validated in all main publicly available single-cell RNA sequencing (RNA-seq) datasets on COVID-19 (Figure S3A). After selecting blood cells annotated as myeloid from 13 single-cell studies previously integrated by Tian et al.,20 we observed that the RAGE receptor binding gene score is consistently different when comparing COVID-19 patients with healthy controls and across severity (Figure S3B). Moreover, we performed pseudo-bulk differential expression analysis and found that DEGs are enriched for the RAGE receptor binding pathway in patients and, among them, for the more severe cases (Figure S3B). Together, these data uncover RAGE pathway activation as a highly robust signature of SARS-CoV-2 impact on myeloid cells that is associated with COVID-19 severity across cohorts.
Monocytes bind the SARS-CoV-2 S1-RBD via RAGE
To test whether this activation was dependent on the binding of the S protein with RAGE, potential RAGE and S1-RBD interaction was first investigated by generating a computational model of the interaction of S1-RBD to the RAGE receptor (Figures 4A and S4A). The model was obtained by molecular docking and further refined using molecular dynamics simulations. Two different models for S1-RBD were obtained, using the original reference sequence first discovered in Wuhan38 and the Omicron variant sequence39 that is rapidly spreading worldwide. Docking models generated using the LZerD webserver40 suggest that binding between the two proteins is possible and stable within the simulated time window and that the interaction is mainly mediated by a salt bridge between S1-RBD Glu471 and RAGE Lys37 and by a network of hydrophobic interactions of S1-RBD residues Leu452, Ile472, and Phe490, with RAGE residues Pro33, Val35, Phe62, Leu79, and Pro87 (Figures S4A and S4B). A visual inspection of the trajectories shows that there are very minor differences between the reference type and the Omicron variant (Figure S4C). Indeed, the only difference in the contact zone for the two variants is represented by the mutation E484A. In the reference type, Glu484 interacts weakly with Arg216 and the backbone of Val35, while in the Omicron variant it interacts exclusively with Val35. Computation of the binding free energy confirms that the binding of the S1-RBD to the RAGE receptor for the two variants is indistinguishable within the error range (Figure 4B), and it is much lower than the estimated binding energy between S1-RBD and the human ACE2 receptor, with a ΔΔG of −4.1 kcal/mol.41 To confirm these results, we set out to measure the dissociation constant (KD) of the interaction between the extracellular region of RAGE and SARS-CoV-2 S protein. We expressed and purified from mammalian cells (Figure S6) the first moiety of RAGE (construct 1–231, which results in soluble RAGE 23–231 upon secretion) and two constructs of S: its whole extracellular domain (ECD) and RBD.42 We used microscale thermophoresis and measured a KD of ∼6 μM (−7.1 kcal/mol) for the RBD region, in excellent agreement with the computational model predictions (Figures 4B and 44C), and ∼1 μM (−8.2 kcal/mol) for the ECD region (Figure 4C), thus confirming that the SARS-CoV-2 S protein binds the RAGE receptor, mainly through its RBD, with a much lower affinity than the ACE2 receptor.
Figure 4.

SARS-CoV-2 binds monocytes through an alternative receptor
(A) Computational model of the interaction of S1-RBD to the RAGE receptor. Regions of interaction between the two proteins are shown in cartoon representation, and residues important for the binding are explicitly shown from different point of views in (1) and (2).
(B) Computations of the absolute binding free energies of the reference type and Omicron S RBDs to the RAGE receptor are the same within the errors (STAR Methods).
(C) RAGE23–231 binding to S detected by microscale thermophoresis (MST). Dots are data from three independent experiments, and curves are their “one-site binding” fits, with respective calculated KD values and 95% confidence intervals reported on the graphs.
(D) Representative blot of co-immunoprecipitation and quantification analysis of 4 independent experiments in human peripheral blood monocytes treated with 100 ng/mL His tag S protein (+). IgG was used as an antibody-specific control. Ø, empty well.
Data are presented as mean ± SEM. Kruskal-Wallis test for multiple comparisons with Dunns post hoc test. ∗p ≤ 0.05. See also Figure S4.
The interaction between SARS-CoV-2 S and RAGE predicted by the computational model and verified in vitro with recombinant proteins was also proven through co-immunoprecipitation experiments in human peripheral blood monocytes (Figure 4D). Notably, although the THP1 monocytic cell line expresses ACE2 and RAGE concomitant with ADAM metallopeptidase domain 17 (ADAM17) and transmembrane serine protease 2 (TMPRSS2), primary monocytes do not express ACE2 or TMPRSS2 but express RAGE and ADAM17 proteins (Figure 5A).35 We analyzed the binding of His tag S to THP1 cells treated with azeliragon and FPS-ZM1, two small-molecules antagonist of RAGE,43,44 or angiotensin II, a vasoconstrictor peptide that competes for the ACE2 receptor (Figures 5B, S5A, and S5B). We observed that S1-RBD binding to THP1 cells was hindered by azeliragon and FPS-ZM1 and, as expected, by angiotensin II treatment. Because azeliragon is already approved by the US Food and Drug Administration (FDA), and it is used in clinics,43 henceforth we perform experiments using this drug. Azeliragon was not toxic to THP1 cells (Figure S5C), even after 72 h of treatment. To confirm the RAGE-mediated entry of SARS-CoV-2 in THP1 cells, infections were performed using replicative SARS-CoV-2. Significant reduction of viral titers was obtained 72 h post infection in THP1 cells pretreated with 2 μM azeliragon (Figures 5C and S5D). As expected, consistent with the expression of ACE2 in THP1 cells, angiotensin II strongly reduced the viral titers in this cell line (Figures 5C and S5D). These results demonstrate that both receptors are involved in THP1 cell permissiveness of SARS-CoV-2 entry. To investigate whether SARS-CoV-2 can bind to RAGE independent of ACE2, we moved to primary monocytes, which are characterized by undetectable levels of ACE2 expression. We confirmed that S protein binds to monocytes and that azeliragon significantly blocks this interaction (Figure S5E). Additionally, SARS-CoV-2 S protein induced RAGE internalization in primary monocytes, as detected by flow cytometry 30 min after S1-RBD stimulation (Figures 5D and S5F). To corroborate these data, we incubated freshly isolated human monocytes with heat-inactivated SARS-CoV-2 (iVirus, VR-1986HK, ATCC). Immunofluorescence staining revealed the presence of viral particles in monocytes, while viral particles were not found in cells treated with azeliragon (Figures 5E and 5F). To further confirm the involvement of RAGE in SARS-CoV-2 infection in monocytes, we generated a RAGE knockout (KO) THP1 monocytic cell line; the absence of RAGE in THP1 cells (Figure S5H) significantly reduced iVirus content and, most importantly, the treatment of RAGE KO cells with the ACE2 inhibitor angiotensin II completely abrogated iVirus entrance into cells to a level comparable with untreated cells (Figure 5G). Interestingly, angiotensin II (AngII) treatment resulted in a complete block of viral entry in AGER KO THP1 cells only, thus confirming the key role played by RAGE in SARS-CoV-2 binding.
Figure 5.

RAGE-S protein interaction is required for SARS-CoV-2 entry into monocytes
(A) Representative western blot (WB) of RAGE, ACE2, ADAM17, and TMPRSS2 in the THP-1 cell line, human-derived monocytes (Mono), and CaCo2. Actin was used as a loading control.
(B) The binding of His tag S to THP1 cells treated with 1–2 μM azeliragon (Aze) or left untreated was measured as mean fluorescence intensity (M.F.I.) by confocal microscopy after 2 h of stimulation.
(C) Plaque-forming unit (PFU) quantification after THP1 cells were infected with SARS-CoV-2 (0.01 MOI) for 24, 48, 72, and 144 h in the absence or presence of Aze and AngII.
(D) RAGE internalization in human-derived monocytes exposed to 100 ng/mL S protein alone (+) or upon pre-treatment with 2 μM Aze (+Aze), measured by flow cytometry after 60 min. Data represent the M.F.I. of RAGE antibody measured by flow cytometry. Values were normalized on the RAGE M.F.I. of untreated cells (−) at 5 min of S protein treatment.
(E and F) Representative images obtained by confocal microscopy (E, scale bar: 15 μm) and relative quantification (F) of heat-inactivated SARS-CoV-2 (iVirus) binding human-derived monocytes after 2 h of incubation in the absence or presence of Aze. Data are presented as M.F.I. normalized on uninfected cells.
(G) Graph representing the M.F.I. (measured by confocal microscopy and normalized on uninfected cells) of iVirus that binds to wild-type (WT) and KO RAGE (ΔRAGE) THP1 cells after 2 h of incubation in the absence or presence of AngII (10 μM). Data are collected from 3 donors tested in 2 independent experiments. Dots represent individual cells identified in 10 different regions of each acquired image.
(H) Representative TEM pictures of monocytes treated with replicative SARS-CoV-2 virus (+), MOI 0.1, in the presence or absence of Aze pre-treatment.
(I) Virion quantification from TEM analysis.
Data are presented as number of particles per field ± SEM. Kruskal-Wallis test for multiple comparisons with Dunns post hoc test. ∗p ≤ 0.05, ∗∗p ≤ 0.01, ∗∗∗p ≤ 0.001. See also Figure S5.
Finally, the internalization of replicative SARS-CoV-2 in monocytes was further confirmed through transmission electron microscopy (TEM) (Figures 4I, 4J, and S5I). In accordance with previous results, pre-treatment of monocytes with 2 μM azeliragon reduced the internalization of infectious SARS-CoV-2 (Figures 4I, 4J, and S5I).
Transcriptional impact of existing and repurposable compounds on the RAGE pathway
To probe the potential of available compounds to mimic and potentially revert the transcriptional dynamics underpinning disease course or severity uncovered above, we interrogated the Connectivity Map (CMap) database,41 a comprehensive catalog comprising gene expression profiles of cell lines treated with a panel of ∼5,000 compounds. We first tested whether current COVID-19 therapeutics (dexamethasone, baricitinib, and ritonavir) were able to mimic the transcriptional changes occurring from admission to post 1 month (Table S2). Among the three, only baricitinib recurrently showed a significant effect on the interrogated COVID-related transcriptional signature (p < 0.05 for B cells, NK cells, and myeloid cells). To assess the significance of this result, we re-performed this analysis following 10,000 randomizations of the CMap drug labels. This highlighted that the probability of retrieving baricitinib as a significant hit by random chance, because of the recurrence of this drug label in the CMap, is less than 5%. Interestingly, the dissection of baricitinib’s impact on RAGE pathway expression confirmed an effect on these genes, with the raw Z scores indicating that baricitinib is expected to effect a general repression of the RAGE pathway along the disease course for mild and severe patients (Figure 6A).
Figure 6.

Candidate compounds for COVID-19 treatment based on the pathogenic mechanisms uncovered through our longitudinal study design
(A) Extended network of the RAGE receptor binding interactors. In each node, three metrics are reported: on the central heatmap, the predicted effects of baricitinib on gene expression; on the inner circle, the predicted overall effect of interactors on the gene expression in mild (left half-arch) and single cell (SC; right half-arch); and on the outer circle, the measured gene expression trend in mild (left half-arch) and SC (right half-arch).
(B) Heatmap showing compounds recurrently reverting gene expression signatures of severity across the cell lines tested in the CMap database. Only drugs resulting in a significant one-sided Fisher’s test false discovery rate (FDR < 0.05) in at least three cell families were selected. The color code represents the enrichment test FDR.
See also Figure S6.
We then focused our attention on drugs able to interfere specifically with the RAGE pathway. By interrogating again the CMap database, we identified two compounds with a significant impact on the RAGE pathway in multiple cell lines that were significantly enriched among the top-scoring drugs for severe and mild patient lists of genes: anandamide and BRD-A15079084, an endocannabinoid derived from arachidonic acid and phorbol 12-myristate 13-acetate, respectively. Post-treatment expression Z scores of both compounds showed an independent modulation of most of the RAGE receptor binding interactors, leading to an overall repression of their expression (Figure S6). We could not test the transcriptional impact of azeliragon on this widest set of RAGE pathway genes because it is not part of the compounds screened in the CMap database. Finally, we performed an unbiased analysis of the CMap database, seeking compounds potentially capable of reversing severity signatures across cell families (Figure 6B). This analysis yielded six hit compounds (NVP-BEZ235, SA-1973507, simvastatin, sotrastaurin, BRD-K69894866, and U-18666A) significantly and recurrently predicted to rescue the transcriptional program underlying disease severity in at least three cell families (Figure 6B). The reliability of this result was again tested via CMap drug label reshuffling, showing that the likelihood of these drugs to be retrieved as significant hits by random chance is less than 10−4. Overall, these analyses led to the identification of compounds of potential interest for the treatment or prevention of COVID-19 infection despite further studies being needed to specifically address their impact.
Discussion
The molecular mechanisms that alter innate and adaptive responses leading to hyperinflammation, eventually resulting in acute respiratory distress syndrome (ARDS) and multiorgan failure in COVID-19 patients, remain to be fully elucidated. Our longitudinal single-cell multi-omics investigation uncovered complex dynamics of COVID-19 immune response across time and disease severity. At admission we observed, independent of severity, a significant increase in IFN monocytes, a subset distinguished by the expression of IFN-stimulated genes (ISG), consistent with what has been reported recently.45 At discharge, confirming previous observations,19,46 patients displayed a higher level of proliferating cytotoxic CD8+ T cells compared with admission, reflecting the activation of adaptive immune responses over time. While this accrued across severity, the number of proliferating cytotoxic CD8+ T cells was higher in mild than in severe/critical COVID-19 patients already at admission, suggesting either a delay in the induction of CD8+ T cell proliferation or active inhibition of their activity in more severe patients. Consistently, mild patients displayed, vis-à-vis severe/critical ones, higher levels of effector CD8+ T cells throughout hospitalization and 1 month after discharge. As for B plasma cells, their highest abundance was found at discharge in all patients, with a drop 1 month later. Notably, at discharge, 100% of patients had measurable anti-SARS-CoV-2 immunoglobulin G (IgG) vis-à-vis a more heterogeneous distribution at admission, confirming previous findings.47 While the presence of plasma cells in our cohort is consistent with the recovery of all enrolled patients, we probed whether different modalities or kinetics of immune response activation reflected disease severity and time to recovery. We thus investigated differential expression across cell families, comparing disease severity across time, with a focus on distinct functional pathways increasing or decreasing linearly over time, which yielded the following readouts: (1) specific metabolic, mitochondrial, and ribosomal signatures in T cells, (2) a significant enrichment for genes induced in response to type I IFN and genes implicated in the regulation of viral replication in IFN monocytes from mild and severe/critical patients at admission, and (3) a strong increase over time, in severe/critical patients, of Ag processing- and presentation-related genes, consistent with a delayed rise of the adaptive immune response in these patients. Finally, the functional profiling of myeloid cells in our cohort revealed the RAGE receptor binding pathway as significantly enriched at admission in non-mild patients (p = 0.0142) with a general decreasing trend over time (p = 0.0282 for mild patients, p = 0.0073 for the others). RAGE belongs to the immunoglobulin superfamily and is expressed in several cell types, including alveolar, neuronal, endothelial, and immune cells.48,49,50,51 Of note, RAGE expression is increased in most of the pathological conditions associated with COVID-19 severity, such as aging,52,53 diabetes,54 obesity,55,56,57 atherosclerosis,58 cancer,59 chronic obstructive pulmonary disease,60 and ARDS.61 Unfortunately, the limited number of patients enrolled in our single-cell study did not allow us to perform a solid correlations analysis of the patient covariates (for instance, body mass index, HbA1C, etc.) with the estimated RAGE expression, thus restricting the investigation of the direct contribution of these parameters to modulating RAGE levels.
Myeloid cells are known to be permissive to SARS-COV-2 entry,62 although they do not express ACE2. Very recently, it has been reported that a small percentage of circulating monocytes and lung macrophages is infected by antibody-opsonized SARS-CoV-2 through CD16 and/or CD64 receptor binding.24 Remarkably, this interaction led to inflammasome caspase-1 activation and pyroptosis, possibly contributing to the inflammatory sequelae observed in severe patients. However, in our cohort, 75% of severe/critical patients who clinically experienced high inflammatory features at hospital admission had no detectable (anti-S) IgG antibody titers. Thus, alternative mechanisms must be at play in driving systemic inflammatory responses by a direct interaction with circulating monocytes.
Extensive glycosylation has been observed at the interface between the S-RBD and ACE2 interaction, thus pointing to a glycan-based mechanism, well beyond shielding, evolved by the virus for receptor recognition and effective infection.63 Reasoning on such evidence, we hypothesized the involvement of RAGE in SARS-CoV-2 recognition by myeloid cells. Through a combination of computational and biochemical assays, we show that the RBD region of SARS-CoV-2 S binds the extracellular region of the RAGE receptor, albeit with a relatively low affinity (low micromolar range). Despite the weakness of the interaction with respect to the one scored for the ACE2 receptor, the absence of expression of the latter in myeloid cells grants a relevant role to S recognition by RAGE for the entry of SARS-CoV-2 into monocytes. Our results highlight that, in the absence of the “conventional” high-affinity receptor, lower-affinity receptors might be hijacked by SARS-CoV-2 for internalization. Our cellular assays uncover a robust signature of RAGE pathway activation that is replicated across all major cohorts profiled worldwide at comparable resolution. Although our cohort refers to patients infected with the Alpha variant of SARS-CoV-2, the predicted residues in the RBD of the S protein interacting with RAGE have the potential to undergo mutations. Indeed, the E484K and L452R mutations observed in the predicted binding region have already been reported in the Omicron variant in comparison with the Alpha one. However, the molecular dynamics simulations we performed and reported (Figure S4) indicated that these mutations do not alter the binding affinity between the RBD and RAGE. Currently, other mutations have been predicted in our residues of interest. For instance, F490S has been reported in the Lambda variant, maintaining the change of a hydrophobic residue to a polar one. Furthermore, S494P, V483A, and T470N have been identified, but they were not associated with any differences in terms of hydrophobic or polar characteristics, respectively.64 Along the same lines, a serine within tight turns on the RBD might be altered, providing a change for the serine side-chain hydroxyl oxygen to form a hydrogen bond with the protein backbone, effectively mimicking substitution with proline. Using our computational binding model, we can speculate that the mutations S494P and V483A would not change the binding affinity between the RBD and RAGE. On the other hand, the mutation F490S leads to a loss of hydrophobic interaction, and the introduction of a residue with a longer side chain in the binding interface (mutation T470N) could interfere with the RBD-RAGE binding. For example, it has been reported that mutations of the RBD linked to variants of concerns or variant of interests weakly affect the binding affinity between the RBD and the ACE2 receptor.65 However, these alterations have been associated with antibody resistance and immune evasion.66 Thus, understanding these molecular dynamics and the consequences of these and future mutations might provide insight for monitoring viral evolution, developing effective countermeasures, and evaluating the effectiveness of current interventions.
RAGE is a multi-ligand receptor recognizing several damage-associated molecular pattern (DAMP) molecules. Our findings identify a role of RAGE in COVID-19 as a viral receptor. This result confirms the crucial importance of glycosylation sites for viral transmission and pathogenesis14,67 and prompts us to reconsider the role of RAGE in viral diseases and host-pathogen interactions. Interestingly, human RAGE is encoded by the AGER gene, which presents multiple single-nucleotide polymorphisms. Different studies have reported a direct link between AGER genetic polymorphisms and the severity of different pathological conditions, including non-alcoholic fatty liver disease,68 cancer,69 Alzheimer’s disease,70 and cardiovascular disorders.71 A direct contribution of these comorbidities to the RAGE expression levels cannot be excluded. However, by providing evidence of a direct interaction between RAGE and SARS-CoV-2 in monocytes, we showed that the RAGE pathway is per se crucial for SARS-CoV-2 infection and that specific comorbidities might contribute to its activation in more severe patients. Further analysis of the association between RAGE genetic variants and COVID-19 severity will be valuable for mapping patient susceptibility to developing damaging inflammatory signs.
In this line, the link between the soluble isoform of RAGE and COVID-19 severity is still controversial. Indeed, although some papers have reported that patients with positive IgG showed a significant elevation in the serum level of interleukin-6 (IL-6), soluble RAGE (sRAGE), and ACE2 compared with the IgG-negative patient subgroup,72 it has also been demonstrated that sRAGE concentrations are elevated in COVID-19 patients as disease severity increases,73,74 thus highlighting its role as a predictor of mortality among COVID-19 patients.75,76 Unfortunately, it is not defined how the sRAGE expression changes before, during, and after SARS-CoV-2 infection, thus making clear interpretation of sRAGE’s role in COVID-19 progression difficult. Furthermore, it is not clear whether there is a positive/negative correlation between the expression level of sRAGE and the membrane isoform, mostly in monocytes. Indeed, sRAGE has been classically considered a decoy receptor associated with protection from inflammatory stress and disease. On the other hand, it has also been postulated that high levels of sRAGE in circulation indicate overstimulation of cell-surface RAGE, which, when persistent, leads to the amplification of pro-inflammatory processes and the exacerbation of pathological states.77 Our results indicated that the RAGE pathway actively contributed to COVID-19 progression and severity. However, although we provided experimental evidence of direct binding of membrane RAGE and the SARS-CoV-2 S protein, further investigations will be needed to dissect the contribution of the different RAGE isoforms on COVID-19 disease progression.
Finally, we leveraged the scale of the CMap to identify candidate compounds that could be repurposed for COVID-19 treatment based also on the pathogenic mechanisms uncovered through our longitudinal study design.
First, given the transcriptional dynamics underpinning disease course (with a peak at admission and resolution post 1 month), we used the tendency of gene expression (high at admission, medium at discharge, low post 1 month, and vice versa) to identify drugs that mimicked this pattern and are thereby predicted to enhance antiviral response. This approach is based on the observation that the treatments inducing gene expression changes toward the baseline (e.g., non-diseased state) are the most effective in reducing the physiological manifestations of the disease.78 Importantly, the transcription restoration paradigm has proven valuable in selecting repurposable drugs for various diseases, such as skeletal muscle atrophy79 and inflammatory bowel disease.80 Strikingly, the only CMap compound, among those in current use for COVID-19 treatment, that had a significant effect on the interrogated COVID-related transcriptional signatures (p < 0.05 for B cells, NK cells, and myeloid cells) was baricitinib. Of note, this drug was found to impact the RAGE pathway, inducing a general reduction of its expression despite not necessarily interfering with S-RAGE interaction but potentially acting downstream of it. Besides providing an independent validation on the centrality of RAGE to COVID-19 transcriptional dynamics, this analysis of the CMap revealed that several IFN-dependent interactors of the RAGE pathway have a trend of downregulation concordant with the healing course in mild and severe/critical patients. This is consistent with the fact that, for proper viral clearance, these genes must be strongly induced during the early stages of SARS-CoV-2 infection. Their uncontrolled activation is linked, however, with detrimental hyperinflammation and cytokine storms.81 This double edge is consistent with the progressive decline in their activation over time, coinciding with the healing of mild and more severe patients. Interestingly though, this general trend does not hold for IFN regulatory factor 4 (IRF4), whose expression over time decreases in mild but increases in severe patients, in line with a recent report that demonstrates the direct IRF7 activation RAGE-depended to perpetuate pro-inflammatory profile,82 and likely reflecting different kinetics of activation in the two patient groups. Because baricitinib enhances the IRF4 pathway in mild and more critical patients, further studies are needed to determine the optimal timing protocol for the potential use of this drug in patients with varying degrees of severity. Besides baricitinib, we mined CMap to identify further drugs that could modulate the RAGE pathway independent of the interrogated COVID-related transcriptional signatures. This led us to identify anandamide and BRD-A15079084 (or phorbol myristate acetate; PMA), which affect RAGE-associated genes predicted by Ingenuity Pathway Analysis (IPA)83 to be altered in COVID-19 patients. Because we inferred similar effects on RAGE pathway modulation by these drugs in comparison with baricitinib, we hypothesized that the structures of these molecules could be used as a baseline for designing RAGE-modulating drugs.
Next, we also pursued an unbiased complementary analysis aimed at identifying repurposable compounds that could revert SARS-CoV-2-induced transcriptional alterations in all identified cell families. Our results revealed six compounds with evidence of healing pathway-modulatory potential: NVP-BEZ235, SA-1973507, simvastatin, sotrastaurin, BRD-K69894866, and U-18666A. Among these, U18666A and NVP-BEZ235 have been already reported to interfere with human coronavirus entry and viral production.84 In addition, the use of statins, the class of compounds to which simvastatin belongs, has been associated with lower COVID-19 patient mortality,85 and simvastatin can downregulate the expression of RAGE,86,87 providing a mechanistic rationale for the further exploration of statin treatments in terms of timing- and RAGE-based stratification.
While our own evidence of the activation of the RAGE pathway was gathered from a cohort of COVID-19 patients likely infected with the same SARS-CoV-2 variant, its replication in 13 published cohorts spanning multiple waves and our in silico data strongly suggest a similar behavior for the currently dominant Omicron variant. Furthermore, we cannot exclude that activation of the RAGE signaling observed in vivo may also be partially due to binding by other alarmins, such as the S100 proteins.88 Indeed, recent evidence showed a systemic upregulation of mainly S100A8/9 in severe patients,46 and it has been proposed recently that tocilizumab, currently used in the COVID-19 therapeutic regimen, may exert some of its effects by blocking S100A8/9 expression in COVID-19.36 While additional work is needed to precisely partition the direct (SARS-CoV-2) versus possibly indirect (alarmins) contribution to RAGE activation in severe patients, the effect of tocilizumab on S100A8/9 further supports the relevance of the RAGE pathway as a target for therapeutic strategies for severe COVID-19. Moreover, our data suggest the presence of an additional sensing of SARS-CoV-2 by the RAGE receptor in monocytes, perhaps involved in the extrapulmonary post-acute sequelae of COVID-19.89 To our knowledge, this report reveals that RAGE might act as a SARS-CoV-2 sensor. Our high-resolution longitudinal analysis of the COVID-19 course uncovers the RAGE pathway (so far held only as a theoretical possibility90) as a crucial route underlying COVID-19 severity and amenable to therapeutic targeting.
Limitations of the study
The relatively restricted number of COVID-19 patients enrolled in our cohort needs to be considered when extrapolating the reach of our conclusions to different contexts. For instance, although we demonstrated a crucial involvement of RAGE expression in COVID-19 severity, additional work will further elucidate (1) whether the basal expression level of RAGE at the time of infection might be associated with different disease severities and, consequently, (2) the role of altered levels of RAGE, which characterizes different comorbidities associated with a negative COVID-19 prognosis, during disease progression. Given the range of such comorbidities, it therefore remains to be dissected to which extent the high RAGE expression contributing to severe COVID-19, including by acting as virus receptor, is an upstream driver per se and/or a consequence of the comorbidities. Furthermore, our cohort limited the investigation of RAGE polymorphisms in SARS-CoV-2 recognition. When the feasibility of gene editing and receptor titration in primary monocytes has streamlined functional interrogation and further quantification of the RAGE contribution to SARS-CoV-2 monocyte infection in various settings, further studies might also help elucidate the roles of specific RAGE isoforms in terms of the remarkable heterogeneity of responses to SARS-CoV-2 infection.
STAR★Methods
Key resources table
| REAGENT or RESOURCE | SOURCE | IDENTIFIER |
|---|---|---|
| Antibodies | ||
| Anti-6X His tag | Abcam | Cat ab18184; RRID:AB_444306 |
| Anti-Mouse IgG | Invitrogen | Cat# 10400C |
| Anti-SARS-CoV-2 spike protein | GeneTex | Cat# GTX632604 |
| Alexa Fluor 488 chicken anti-mouse IgG | Invitrogen | Cat# A21200 |
| Anti-RAGE | Thermo Scientific | Cat# PA5-24787 |
| Anti-RAGE | Abcam | Cat# ab216329; RRID:AB_2884897 |
| Anti-ACE2 | Abcam | Cat# ab15348; RRID:AB_301861 |
| Anti-TMPRSS2 | Abcam | Cat# ab109131; RRID:AB_10863728 |
| Anti-ADAM17 | Abcam | Cat# ab2051; RRID:AB_302796 |
| Bacterial and virus strains | ||
| Heat-inactivated SARS-CoV-2 | ATCC | VR-1986HK |
| SARS-CoV-2 | GISAID ID | EPI_ISL_413489 |
| Biological samples | ||
| PBMC COVID-19 Patients | Infectious Diseases Unit (IDU) of the University Hospital of Padua | N/A |
| Primary monocytes | This paper | N/A |
| Chemicals, peptides, and recombinant proteins | ||
| C-term His-tag Spike protein (RBD) | GenScript | Z03514 |
| FPS-ZM1 | Merck | 553030 |
| Azeliragon | Selleckchem | S6415 |
| Critical commercial assays | ||
| Single Cell Labeling with the BD Single-Cell Multiplexing Kit | BD Biosciences | Cat# 633781; RRID:AB_2870299 |
| BD Rhapsody™ WTA Amplification Kit | BD Biosciences | #633801 |
| BD Rhapsody™ Whole Transcriptome Analysis (WTA) Reagent Kit | BD Biosciences | #665915 |
| BD Rhapsody™ Cartridge Reagent Kit | BD Biosciences | #633731 |
| BD Rhapsody™ Cartridge Kit | BD Biosciences | #633733 |
| His-Tag Labeling Kit RED-tris-NTA 2ND Generation | NanoTemper | SKU: MO-L018 |
| Deposited data | ||
| Raw data files files for scRNA-seq | This study | EGA: EGAS00001007529 |
| Standardized COVID-19 datasets from ref. 20 | https://doi.org/10.1038/s41587-021-01131-y | https://atlas.fredhutch.org/fredhutch/covid/ |
| Experimental models: Cell lines | ||
| THP-1 | ATCC | TIB-202 |
| Vero | Istituto Zooprofilattico (Brescia) | BS CL 86 |
| Expi293F | Thermo Scientific | A14527 |
| Recombinant DNA | ||
| Mammalian CRISPR Vertor (Dual gRNA) | VectorBuilder GmbH | VB220923-1189fnt |
| SARS-CoV-2 – RBD domain expressing vector | BEI Resources | NR-52309 |
| SARS-CoV-2 – ECD domain expressing vector | BEI Resources | NR-52394 |
| pcDNA3.1+ spsRAGE expressing vector | this paper | N/A |
| pcDNA3.1+ spVC1 expressing vector | this paper | N/A |
| Software and algorithms | ||
| FIJI | PMID: 22743772 | https://fiji.sc/ |
| FlowJo | BD Bioscience | V10.0 |
| ZEN Blue edition | Carl Zeiss | V3.0 |
| Prism 8 | GraphPad | V8.0.2 |
| BD Rhapsody™ WTA Analysis Pipeline and BD Rhapsody™ Targeted Analysis Pipeline hosted on the Seven Bridges Platform | BD Bioscience | v1.9.1 |
| scanpy v1.7.0 | https://doi.org/10.1186/s13059-017-1382-0 | https://github.com/scverse/scanpy |
| edgeR 3.32.1 | https://doi.org/10.1093/bioinformatics/btp616 | https://doi.org/10.18129/B9.bioc.edgeR |
| Docker container with R 4.0.5 and python 3.8.5 single-cell analysis environment (from Dockerhub) | N/A | testalab/downstream:covidiamo-2.1.0 |
| STRING database v11.0 | PMID: 30476243 | https://version-11-0.string-db.org/ |
| STRINGdb R interface v2.4.2 | PMID: 33237311 | https://doi.org/10.18129/B9.bioc.STRINGdb |
| GO.db v3.14.0 | N/A | https://doi.org/10.18129/B9.bioc.GO.db |
| Cytoscape v3.9.0 | The Cytoscape Consortium | https://cytoscape.org |
| Gromacs 2020 | https://doi.org/10.1016/0010–4655(95)00042-E | https://www.gromacs.org/ |
| [clue.io] CMap query and command web portal | Broad Institute | https://clue.io/ |
| Other | ||
| HisPrep FF 16/10 | Cytiva | 28936551 |
| Superose 6 Increase 10/300 | Cytiva | 29091596 |
| Capto S HiRes 5/50 | Cytiva | 29275877 |
Resource availability
Lead contact
Further information and requests for resources and reagents should be directed to and will be fulfilled by the lead contact, Dr. Giuseppe Testa (giuseppe.testa@fht.org).
Materials availability
The study did not generate new unique reagents.
Data and code availability
-
-
The single-cell RNA-Seq raw data reported in this study cannot be deposited in a public repository because of ethical and privacy restrictions. Sequence data have been deposited at the European Genome-phenome Archive (EGA) under the study accession number EGA: EGAS00001007529. They are available through controlled access. Microscopy, Flow Cytometry and Drug repurposing data reported in this paper will be shared by the lead contact upon request.
-
-
This paper analyses existing, publicly available data. These datasets can be downloaded from https://atlas.fredhutch.org/fredhutch/covid/.
-
-
All the code used to produce the results of this study has been organised in a repository available at GitHub: https://github.com/GiuseppeTestaLab/covid19-RAGE.
-
-
Any additional information required to reanalyse the data reported in this work paper is available from the Lead Contact upon request.
Experimental model and study participant details
Human samples
20 adult patients, 50% male, 50% female with a median age of 56.5 years, who were admitted to the infectious Diseases Unit (IDU) of the University Hospital of Padua, Italy, between April and May 2020, were enrolled in the study (Demographic and Clinical data fully described in the Table S1). All patients were diagnosed with COVID-19, confirmed by SARS-CoV-2 reverse transcription-polymerase chain reaction (RT-PCR) testing of a nasopharyngeal swab. According to WHO guidelines, all patients were classified into mild, moderate, severe, and critical cases based on symptoms, clinical examination, and chest imaging. Demographic, clinical, laboratory data were extracted from paper and electronic medical records using a standardised data collection form. Laboratory data included: complete blood count, ESR, CRP, coagulation profile, serum biochemical tests and lymphocyte subpopulations. Both Chest X-rays and Ct scan were also performed in all patients. The study was performed according to the ethical guidelines of the Declaration of Helsinki (7th revision) and was approved by the Ethics Committee and the general authorization issued by the Data Protection Authority, Cod CESC n. 4933/AO/20. Written, inform consent was obtained from all participants prior to performing any procedures.
PBMC isolation
Peripheral blood from enrolled controls and COVID-19 in patients was collected in EDTA tubes and stored at 4 °C prior to processing for Peripheral blood mononuclear cells (PBMC) isolation. PBMC were isolated by density-gradient sedimentation using Ficoll–Paque PLUS (GE Healthcare, Germany) according to the manufacturer’s protocol. Post-purification the isolated PBMC were cryopreserved in cell recovery media containing 10% DMSO (Gibco), supplemented with 90% heat inactivated HyClone Fetal Bovine Serum (FBS; GE Healthcare, Germany) and stored in liquid nitrogen, until analysis.
Cell line culture
THP1 cells (TIB-202 ATCC) were cultured in complete medium (RPMI1640 Cat.BE12-702F/12- Lonza, supplemented with 10% Fetal Bovine Serum (FBS) (Cat.10270-106-Gibco), 1% HEPES (Cat.BE17-737E-Lonza), 1% Penicillin-Streptomycin (Cat. DE17-602E-Lonza) at 37°C 5%CO2 until confluence and split 1:10 every 2–3 days. Primary human monocytes were obtained with the Pan Monocyte Isolation kit (130-096-537, Miltenyibiotec) following the manufacturer’s instructions. Azeliragon toxicity was tested through an apoptosis assay. 1 × 10⁵ THP-1 cells were seeded on a 24-well plate in their culture medium. After 2 h of starvation, Azeliragon (2 or 4 μM) was added to cells. 2 μM Staurosporin (Sigma) was used as a positive control. Cells were incubated for 24, 48 and 72 h at 37°C 5% CO2. Supernatants and cells were collected and stained with Annexin V APC (BD Pharmingen Cat#550475) according to the manufacturer’s instructions. Labeled cells were detected at FACS CelestaSorp (BD). Data are expressed as the percentage of Annexin V APC positive events. The gating strategy and the relative analysis were performed with FlowJo software.
Method details
Single-cell multi-omics experimental pipeline
For all transcriptomics experiments, we took advantage of the BD Rhapsody Express platform. After thawing, PBMC from the 3-time point from each patient were labeled using Single Cell Labeling with the BD Single-Cell Multiplexing Kit (BD Biosciences, #633781) and 52 different BD AbSeq Ab-Oligos reagents following the manufacturer’s protocol (BD Biosciences). Three different timepoints (adm, disch, pst1mo) from two patients were pooled, washed twice, and resuspended in cold BD Sample Buffer (BD Biosciences) to achieve approximately 60000 cells in 620 mL (10000 cells per sample). Single cells isolated using Single Cell Capture and cDNA Synthesis with the BD Rhapsody Express Single-Cell Analysis System following the manufacturer’s protocol (BD Biosciences). After priming the nanowell cartridges, pooled samples from two were loaded into BD Rhapsody cartridges. Cell Capture Beads (BD Biosciences) were prepared and then loaded onto the cartridge according to the manufacturer’s protocol. Cartridges were then washed, cells were lysed, and Cell Capture Beads were retrieved. After retrieval beads were split in two, and different libraries were prepared. Firstly, we generated whole transcriptome analysis (WTA) cDNA libraries according to manufacturer instructions. Briefly, after reverse transcription, performed with BD Rhapsody cDNA Kit, Sample Tag and AbSeq sequences were separated from Cell Capture Beads by denaturation and Sample Tag and AbSeq libraries were generated with two PCR, according to BD protocol. Target cDNA on Cell Capture Beads was subjected to Random Primer Extension (RPE). RPE products were then amplified by PCR. All the three libraries were finally indexed with one of the 16 indexes for Illumina sequencing. For the other half of the beads, cDNA underwent targeted amplification using the Human Immune Response Panel primers and a VDJ CDR3 supplemental panel via PCR, according to BD protocol. PCR products were purified, and mRNA PCR products were separated from sample tag and AbSeq products with double-sided size selection using Agentcourt AMPure XP magnetic beads (Beckman Coulter, #A63880). mRNA and Sample Tag products were further amplified. and purified using Agentcourt AMPure XP magnetic beads. Quality and quantity of PCR products were determined by using an Agilent 4150 TapeStation with High Sensitivity D5000 ScreenTape (Agilent). Final libraries were indexed using one of the 16 indexes for Illumina sequencing. A different index was used for each cartridge Quality of final libraries was assessed by using Agilent 2200 TapeStation with High Sensitivity D5000 ScreenTape and quantified using a Qubit Fluorometer using the Qubit dsDNA HS Kit (ThermoFisher, #Q32854).
Sequencing
Different library types were pooled at different ratios based on their targeted reads per cell and the nanomolarity of the library pools was confirmed using the Agilent Bioanalyzer 2100. The library pools were sequenced on the NovaSeq 6000 (Illumina) loading the instrument with the concentration of 440 p.m. WTA libraries were sequenced to achieve a minimum of 50.000 paired-end reads per cell for gene expression libraries, 26.000 for AbSeq libraries and 480 for Sample Tag libraries. For the Immune response and VDJ panels: libraries were sequenced to achieve a minimum of 8.000 paired-end reads for Immune Response libraries, 26.000 for AbSeq libraries, 480 for Sample Tag libraries, 3.000 for TCR libraries and 3.000 for B-enriched libraries.
Molecular modeling and dynamics
The model of the RAGE protein was derived by the X-ray crystal structure 3O3U,91 while the reference type (RT) variant and the omicron variant models of COVID-19 RBD were both derived by the X-ray crystal structure 6ZGG chain B92 (omicron mutations were introduced by mutating the relevant residues on the RT structure). The starting docking models for both S1-RBD variants interacting with the RAGE receptor were obtained from the highest-scoring configuration produced by using the LZerD webserver.40 The models were then solvated with fully atomistic TIP3P water, and Cl− and K+ ions at a concentration of ∼0.15 M in order to mimic the physiological ionic strength. MD simulations were carried on using the Gromacs 2020 package93 and the Amber14SB force field,94 following simulation protocols similar to those we used in our previous works.95 Specifically, after energy minimization, we performed 200 ps of Simulated Annealing to allow side chains to equilibrate. We then performed two short simulations lasting 100 ps first in the NVT ensamble, and then in the NPT ensamble both with positional restraint on the heavy atoms of the protein. Finally, we performed an equilibrium MD simulation under periodic boundary conditions at constant pressure for 100 ns. Analysis was performed after 25 ns of equilibration. During the equilibrium MD simulation, temperature (T) and pressure (P) were kept constant at 300 K and 1 atm, respectively, using the Berendsen thermostat and barostat. Fast smooth Particle-Mesh Ewald summation was used for long–range electrostatic interactions, with a cut-off of 1.0 nm for the direct interactions. Each simulation was performed in five identical replicas in order to check the results consistency and reduce the risk of being trapped by entropic barriers, thus improving the sampling of the configuration space available. Interaction probability was measured as the fraction of time in which the heavy atoms of listed Covid19-S1-RBD (or RAGE) residues were in close contact (distance < 3 Å) with the RAGE (or Covid19-S1-RBD) protein during the MD simulation, as previously done in ref. 96. Only the important interactions (interaction probability >60%) are shown.
Binding free energy computations
To produce reliable predictions of the binding free energy, we use the PRODIGY web server following the procedure used in our previous work.65 Specifically, the binding free energies are calculated as ensemble averages over the configuration space explored by the five different replicas. To speed up the calculation, we clustered the configuration space sampled by the various MD trajectories after equilibration (i.e., the last 75 ns each of the five replicas) according to their root-mean-square deviation (RMSD), and calculate the binding energy using one representative for 60 bigger clusters, being the clustering distance 1.3 Å. The final result is then obtained as the weighted average of the free energy computed for each of these configurations using the number of elements in the cluster as weight.
Protein production
His-tagged SARS-CoV-2 extra cellular domain (ECD) and receptor binding domain (RBD) constructs for expression in mammalian cells were a kind gift from prof. Florian Krammer (Icahn School of Medicine at Mount Sinai, New York). For RAGE a synthetic, codon optimized sequence coding for residues 1–231, followed by a 3C protease cleavage site, His-tag, and 3x FLAG tag has been inserted into pcDNA3.1 vector. Expi293F cells (ThermoFisher) were cultured in Expi293 Expression Medium (ThermoFisher) at 130 rpm, 8% CO2, 37°C, 85% humidity. For production of RAGE1-231, SARS-CoV-2 ECD and SARS-CoV-2 RBD, cells were prepared to 3 ⋅ 106/mL. Per liter of culture, 1.1 mg of each plasmid and 3 mg of polyethylenimine (PEI Prime, Sigma-Aldrich) were mixed in 50 mL of pre-warmth expression medium, incubated for 20 min at room temperature, and added to cells dropwise. Protein expression and secretion were carried out for 3 days. Cells were removed by centrifugation at 3,300g for 10 min, and remaining cell debris and precipitates were removed by centrifugation at 20,000g for 10 min. Supernatants were then filtered through 0.22 μm filters and loaded onto a HisPrep FF 16/10 column (Cytiva) pre-equilibrated in 60 mM NaH2PO4 pH 8.0, 300 mM NaCl (buffer A), having prepared an elution buffer (buffer B) with 60 mM NaH2PO4 pH 8.0, 300 mM NaCl, 250 mM imidazole. The resin was washed with 3 column volumes of 10% elution buffer (25 mM imidazole), and His-tagged proteins were eluted with three step gradients, increasing buffer B concentration to 20% (50 mM imidazole), then 40% (100 mM imidazole) and finally 60% (150 mM imidazole) for 2.5 column volumes each step. Fractions containing eluted proteins, as judged by Coomassie stained SDS-PAGE gel, were pooled. Spike constructs were dialyzed overnight against PBS 1x, 2% glycerol, concentrated in Vivaspin devices (Sartorius), loaded on Superose 6 Increase 10/300 column, and eluted in PBS 1x, 2% glycerol. RAGE23-231 (the secreted product) was treated overnight with 3C protease to remove tags, then diluted with water and addition of 1 M NaH2PO4 pH 6.0 to obtain a solution at pH ca. 6.5 with: 100 mM NaH2PO4, 60 mM NaCl, 10 mM imidazole, that was loaded on a Capto S HiRes 5/50 column (Cytiva) pre-equilibrated in 60 mM NaH2PO4 pH 6.0. Elution was carried out with a linear gradient of buffer B (60 mM NaH2PO4 pH 6.0, 1 M NaCl) and fractions containing RAGE23-231 were concentrated on Vivaspin devices, loaded on a Superdex 75 Increase 10/300 column (Cytiva), and eluted with in PBS 1x, 2% glycerol. Peak fractions from gel filtrations were pooled, concentrated, and stored at −80°C after snap freezing in liquid nitrogen. Protein concentrations were determined by absorbance at 280 nm using calculated extinction coefficients for mature polypeptide sequences.
Microscale thermophoresis
MST assays were performed with Spike-ECD and Spike-RBD constructs labeled with His-Tag Labeling Kit RED-tris-NTA 2nd Generation (NanoTemper) following manufacturer’s instructions. Briefly, His-tagged proteins and RED-tris-NTA 2nd Generation dye were incubated 30 min at room temperature in a 2:1 M ratio, and then labeled proteins were used to set-up the MST assay, which was measured in a NanoTemper Monolith RED instrument. 50 nM of labeled Spike proteins were mixed with unlabeled RAGE23-231 to concentrations ranging from 10 nM to 1.3 mM in 25 mM NaHepes pH 7.5, 150 mM NaCl, 0.05% Tween 20, and the mixtures were incubated 30 min at room temperature prior to measurement. The reactions were then transferred into Monolith capillaries and MST experiment was performed. Three independent experiments were performed for each Spike constructs, data were analyzed with the MO.Affinity Analysis software (NanoTemper), and dissociation constant was calculated with GraphPad Prism software (One Site – Specific binding fit), which was also used to plot the data.
Western Blot
Total protein extract was obtained with FASP buffer supplemented with cOmplete, EDTA-free Protease Inhibitor Cocktail (Sigma-Aldrich). 30 μg of Protein extracts were separated by 4–12% Bold NuPage (ThermoScientific) and transferred onto PVDF membranes (BioRad). After blocking with 3% albumin (Sigma-Aldrich) and primary antibody incubation RAGE (ab216329, Abcam), ACE2 (ab15348, Abcam), ADAM17 (ab2051, Abcam)), TMPRSS2 (ab109131, Abcam), the membranes were incubated with an anti-rabbit peroxidase-conjugated secondary antibody (GE healthcare). Chemiluminescence was obtained by the ICL Substrate (GE healthcare), and images were captured with an imaging iBright (Thermo Fisher Scientific).
Co-IP
For immunoprecipitation, 10x106 human peripheral blood monocytes cells were treated with SARS-CoV-2 C-term His-tag Spike protein (RBD, His Tag) (GenScript) 100 ng/mL for 2 h. After the treatment, the protein extraction was done with IP buffer (50 mM HEPES pH 7,5 (Lonza), 150 mM NaCl (Sigma-Aldrich), 1 mM EGTA (Sigma-Aldrich), 1.5 mM MgCl2 (Sigma-Aldrich), 10 mM NaF (Sigma-Aldrich), 10 mM Na2P2O7 (Sigma-Aldrich), 1 mM Na3PO4 (Sigma-Aldrich), 1% Triton X-(Fluka), 10% Glycerol (Fluka), supplemented with cOmplete, EDTA-free Protease Inhibitor Cocktail (Sigma-Aldrich). 500 μg of protein lysate was incubated with Anti-6X His tag antibody [HIS.H8] (ab18184, Abcam) overnight at 4°C, anti-Mouse IgG (Invitrogen) was used as isotype control. The protein complex was precipitated with Pierce Protein G Agarose (Thermo Fisher Scientific) for 2 h at 4°C. The immune complexes were analyzed by Western blot with Anti-RAGE (ab3611, Abcam), antibody.
THP1 and monocytes infection with SARS-CoV-2
THP1 cells were plated at 5x10⁵ cell/ml in 48-well plates in 200 μL of RPMI-1640 supplemented with 1% fetal bovine serum (FBS) (Euroclone). Twenty-four hours later, the drug Azeliragon (Aze) was added in a range of concentrations from 1, to 4μM; 10μM Angiotensin II (AngII) was added alone or in combination with 2 μM of Aze. After 30 min, 20 μL of SARS-CoV-214 (kindly provided by prof. Nicasio Mancini, Vita-Salute University, Milan, Italy) were added to obtain three multiplicities of infection (MOI): 1, 0.1, 0.01. After 1 h of virus adsorption, 400 μL of RPMI supplemented with 10% fetal bovine serum was added. Cell culture supernatants were collected 24, 48, 72 and 144 h post-infection and stored at – 80°C until the determination of the viral titers by a plaque-forming assay in Vero cells. Primary human monocytes were plated at 6x10⁶ cells for TEM processing in low-adhesion 6-well plates and incubated for 30 min with 2 μM of Aze immediately after purification. After 30 min, 60 μL of SARS-CoV-2 isolate14 were added to obtain a MOI of 1. After 2 h of virus adsorption, monocytes were collected into 2.0 mL Eppendorf and pellet for 10 min at 1500 rpm. Pellets were washed once with PBS and either 1 mL of TRIzol was added for RNA samples or 1.2 mL of fixation buffer was added for TEM samples as described below.
TEM
Samples were fixed with 2.5% glutaraldehyde in 0.1M sodium cacodylate buffer pH 7.4 ON at 4°C. The samples were postfixed with 1% osmium tetroxide plus potassium ferrocyanide 1% in 0.1M sodium cacodylate buffer for 1 h at 4°. After three water washes, samples were dehydrated in a graded ethanol series and embedded in an epoxy resin (Sigma-Aldrich). Ultrathin sections (60–70 nm) were obtained with an Ultratome Leica Ultracut EM UC7 ultramicrotome, counterstained with uranyl acetate and lead citrate and viewed with a Tecnai G2 (FEI) transmission electron microscope operating at 100 kV. Images were captured with a Veleta (Olympus Soft Imaging System) digital camera. Viral particles at higher magnification were manually counted using the multipoint function in FIJI.
Plaque-forming assay
Vero cells were seeded at 5.0x10⁵ cell/ml in 24-well plates in 500 μL of 1 mL of Eagle’s Minimum Essential Medium (EMEM) supplemented with 1% FBS (complete medium). Twenty-four hours later, 10-fold serial dilutions of SARS-CoV-2 containing supernatants were added in 300 μL of complete medium. After 1 h of incubation, the viral inoculum was removed and methylcellulose (Sigma, 1 mL in EMEM supplemented with 5% FBS) was overlaid in each well. After 4 days of incubation, the cells were stained with 1% crystal violet (Sigma) in 70% methanol. The plaques were counted after examination with a stereoscopic microscope (SMZ-1500; Nikon Instruments) and the virus titer was calculated in terms of plaque-forming units (PFU)/mL.
Generation of AGER KO THP1 cells
The Mammalian CRISPR Vertor (Dual gRNA) was obtained by VectorBuilder GmbH, (Figure S5G). Transfection of the plasmid was performed with AMAXA Cell Line Nucleofector Kit V, according to manufacturer indications. Briefly, 1∗106 THP1 were resuspended in Nucleofection Solution and combined with 0.5 mg of CRISPR Vector. Cell suspension was transferred into the Nucleofector Cuvette and electroporated using the Nucleofector II Device. Immediately after electroporation, cells were transferred into a 6 well with a final volume of 1.5 mL of complete medium per well. The expression of the plasmid was monitored every 24h by measuring the reporter gene fluorescence (mCherry). After 48h, 1 mg/mL of Geneticin (Thermo Fisher Scientific) was added to the medium and cells were cultured in the selection medium for 72h. AGER deletion was confirmed by Western blot for RAGE protein (Figure S5H).
Immunofluorescence
Primary monocytes were used just after the purification; THP1 were seeded at500.000 cells/mL the day before in a complete medium in a 24 well non-tissue culture plate (Cat. 351147 Falcon), at 100.000 cells per well. The following day, cells were pretreated or not with 2μM Azeliragon (Cat.S6415-Selleckchem) for 30 min or 10μM FPS-ZM1 (cat.553030 Merk) for 2 h before adding 100 ng/mL of Sars-CoV-2 spike protein (RBD, HisTag) (Cat. ZO3483-1- GenScript) or infected using Heat-inactivated SARS-CoV-2 (VR-1986HK, ATCC) at 4 TCID50/mL for 2h at 37°C 5%CO2. Cells were collected and centrifuged at 120g for 5 min with cytospin (MPW-223c, MPW) to prepare slides carrying 50.000 cells each. Slides were then fixed for 20 min in Paraformaldehyde (PFA) 4% p/v (Cat.158127 Sigma-Aldrich). Cells were permeabilized in the permeabilization buffer (PBS with calcium and magnesium (Cat. P4417-100TAB-Sigma-Aldrich) plus 1% Bovine Serum Albumin (BSA) (Cat.A9647-500G-Sigma-Aldrich) and 0.02% NP-40 alternative (Cat.492016-100ML) for 1h at room temperature prior to overnight incubation at 4°C with primary antibody 1:100 (6xHisTag clone#HIS.H8 Cat.ab18184-Abcam or SARS-CoV-2 spike polyclonal antibody, GeneTex). Secondary antibody (Alexa Fluor 488 chicken anti-mouse IgG Cat.A21200-Invitrogen) was diluted 1:500 in PBS with calcium and magnesium and maintained for 1h room temperature. Nuclei were counterstained with Hoechst 33342 (Cat.H3570-Thermo Scientific) for 15 min at room temperature. Images were acquired with Zeiss LSM800 confocal microscope and analyzed with FIJI software.
Internalisation assay
Fresh primary human monocytes were pretreated or not with 2μM Azeliragon (Cat.S6415-Selleckchem) for 30 min before being exposed with 100 ng/mL of Sars-CoV-2 spike protein (RBD, HisTag) (Cat. ZO3483-1- GenScript) at different times (5, 15, 30 and 60 min). Cells were collected and stained using primary RAGE antibody 1:100 (PA5-24787, Thermo Scientific) for FACS analysis. Samples were read with BD FACSCelesta Flow Cytometer (BD Bioscience) and analyzed with FlowJo V10.0 software.
Drug repurposing
The CMap database97 was interrogated through the Query tool on the clue.io web portal (QUERY [clue.io]). Up- and down-regulated lists of genes were given in input to obtain compounds reverting severity signatures for each cell family separately or inhibiting RAGE pathway. Where gene signatures comprised more than 150 genes, the 150 most strongly differentially expressed (up- and down-regulated) were kept (150 is the maximum length allowed for a query). Outputted connectivity score tables were downloaded from the web portal and processed to identify compounds recurrently displaying a positive connectivity score and FDR<0.01 across screened cell lines. A one-sided Fisher’s test was performed for each compound on each cell family separately, and only drugs with Fisher’s FDR<0.05 in at least 3 cell families were selected.
For the analysis of drugs in current clinical use, the CMap database was interrogated similarly with the list of genes changing expression longitudinally. The output was filtered for the three compounds Dexamethasone, Baricitinib and Ritonavir and processed to test whether these compounds recurrently display a positive connectivity score and FDR<0.01 across screened cell lines (one-sided Fisher test). For the RAGE-pathway focused analysis, a similar approach was pursued using activated and deactivated genes obtained from IPA predictions. The z-scores indicating the effect of Anandamide and BRD-A15079084 on gene expression were obtained from the CMap Command tool (COMMAND [clue.io]), downloaded as a gdc file and averaged across all the cell lines with a significant drug-driven reversal of gene expression signature in both mild and severe patients. The z-scores indicating the effect of Baricitinib on gene expression were obtained from GSE70138 (files GSE70138_Broad_LINCS_Level4_ZSPCINF_mlr12k_n345976x12328.gctx and GSE70138_Broad_LINCS_inst_info.txt) and averaged across all the tested cell lines. The average Z score for RAGE-pathway genes decreasing expression longitudinally was compared with the average Z score of random genes with a one-sided Wilcoxon Rank-Sum test. Randomizations needed to compute empirical p values quantifying hits significance were performed by reshuffling the CMap drug labels 10,000 times.
Quantification and statistical analysis
Alignment and quantification
The demultiplexing of the raw data was performed bcl2fastq v2.20.0.422. The reads obtained from the demultiplexing were used as the input for the BD Rhapsody WTA and targeted analysis pipelines hosted on the Seven Bridges Platform. In detail, Reads have been aligned to the human genome GRCh38 with release 29 of GENCODE annotation, then collapsed to unique molecular identifier (UMI) counts and labeled by cell barcodes and sample tags. The result is a large digital expression matrix with cell barcodes as rows and gene identities as columns.
Quality control, normalisation, batch correction, embedding and clustering
After getting the count matrices, standardised pipelines for filtering (cells with less than 800 genes expressed and more than 30% of mitochondrial reads have been filtered out), normalisation, dimensionality reduction, clustering and annotation of cell population were used.98 In particular, UMAP dimensionality reduction as implemented in Scanpy99 was applied. Clusters were identified by applying the Leiden algorithm from Scanpy, which is a community detection algorithm that has been optimised to identify communities that are guaranteed to be connected. This resulted in clusters of cells that are more coherent with the biological phenotype and more reliably identify cell populations. The resolution parameter value was optimised by surveying the stability of the resulting clusters. This resulted in the identification of 32 clusters. Three of these clusters were isolated and then further sub-clustered to allow the assignment of a well-defined identity. Cluster annotation and integration with external references.
Cluster annotation in immune cell types was obtained by a combination of the following approaches: i) Scanpy’s rank_genes_groups to identify the most characterising genes per clusters; ii) visualisation of specific immune markers for each cell population, iii) projection onto external references through ingestion (link) a function implemented in Scanpy,99 to integrate embeddings and annotations projecting on a PCA that has been fitted on the reference data. In particular the single cell PBMC dataset from ref. 45, including single cell multi-omics readouts from COVID-19 patients and controls using a similar single cell sequencing approach, was used as a reference.
Differential abundance testing
Abundances of the different cell families and cell subclusters were compared across patient severity and sample time-points. Counts were analyzed with the edgeR package,31,100,101 using a Negative Binomial Generalised Linear Model (GLM) that is suited to model over-dispersed data in the presence of limited replication.
Pseudo-bulk differential expression analysis
The sc-RNAseq counts of each cell family, patient and sample time-point were summed together to generate pseudo-bulk counts, with the aim of obtaining more robust expression values while keeping the relevant information from the experimental design and the single-cell resolution. Separately for the two selected categories of disease severity (mild vs. severe/critical), the pseudo-bulk counts were then fitted with a generalised linear model using the EdgeR package, to identify those genes characterised by a well-defined decreasing or increasing trend of the expression over the sample time-points.
Functional enrichment analysis
The differentially expressed genes (DEG) of the pseudo-bulk analysis outlined above showing an absolute fold-change (FC) ≥ 2 and a false discovery rate (FDR) ≤ 0.05 were selected for further enrichment analysis in each immune cell type. The selected DEGs were used as input for the 'string_db$get_enrichment'102 using Gene Ontology (GO) terms with 3–500 elements as background. Enriched GO terms with FDR ≤ 0.001 were then selected and the corresponding genesets investigated. Among these sets, the GO:0050786 genelist was then expanded using the Cytoscape 'stringApp'103 in order to identify among the nearest neighbors with confidence score >0.7 the ones showing the highest absolute FC values in Myeloid cells. These shortlisted genes were further investigated using the IPA software, starting from this list we have expanded the genes based on the connections categorised in IPA as discovered only in the immune system. This expanded list was then connected considering the same sources. The derived network was then overimposed with the DEG identified for both mild and severe and critical patients. This data was used as a source for a Molecule Activity Predictor (MAP) and the identified networks used for the subsequent drug repurposing analysis.
RAGE pathway enrichment analysis
The enrichment of the RAGE receptor binding Gene Ontology Term (GO:0050786) was computed with a Gene Set Enrichment Analysis (GSEA) of relevant DEGs list. The DE analysis has been done as described previously by fitting the Negative Binomial GLM of EdgeR to pseudo-bulk expression values, comparing mild vs. non-mild patients, and the pattern over time for mild and non-mild patients separately. The GSEA has been done with the clusterProfiler library,104,105 using gene lists ranked by the FDR of the differential analysis and the sign of the logFC.
Analysis of RAGE pathway activation in monocytes from publicly available datasets
To validate the RAGE pathway activation gene signature that is described in the main text, we repeated the analysis described in the STAR Methods section (“RAGE pathway enrichment analysis”) on several publicly available sc-RNAseq results. To work on data in the same format and with the same annotation, we started from the datasets that have been identified and standardised by Tian et al. in ref. 20. These authors thoroughly cataloged the public single-cell dataset from COVID-19 patients and processed the relevant ones, by aligning cell and patient metadata and standardising the file formats. The datasets that we considered in our analysis were originally obtained from Ref.s15,22,45,106,107,108,109,110,111,112,113,114,115. We downloaded the processed datasets from the portal https://atlas.fredhutch.org/fredhutch/covid/and converted them from Seurat object format to AnnData, to work with Scanpy. We took the normalised sc-RNAseq count matrices, and followed this procedure:
-
1)
selection of the cells from blood samples and annotated as myeloid (CD14 Mono/CD16 Mono/cDC1 and cDC2),
-
2)
aggregation of the counts to compute pseudo-bulk expression values for each sample of the dataset (filtering samples for which the number of myeloid cells is less than 50),
-
3)
DE analysis with EdgeR, comparing COVID-19 patients vs. healthy controls, and a pattern of increasing severity using the mild, moderate, severe annotation of ref. 20.
-
4)
for each of the DEG lists, GSEA with the clusterProfiler library,104,105 using gene lists ranked by the FDR of the differential analysis and the sign of the logFC.
Figure S3A shows the RAGE receptor binding gene score (computed as described in the text), for the relevant conditions and for each of the 13 datasets considered. The results of the enrichment test, reported in Figure S3B, show a consistent enrichment of the RAGE receptor binding pathway for the patients and – among them – for the more severe forms of COVID-19. Figure S3B displays results of the enrichment tests for the differential expression analysis performed on the COVID-19 public dataset. For each of the tests, the position of the dot on the x axis indicates the value of normalised enriched score (NES) whereas the size and color of the dot report the significance level of the test in terms of the negative logarithm of the p value. NES and p values have been computed as described.
Acknowledgments
We acknowledge DeBioImaging Facility, Department of Biology, Padua University; the Microscopy Facility of the Fondazione Istituto di Ricerca Pediatrica (IRP) Città della Speranza; and the engagement of the Department of Experimental Oncology at the European Institute of Oncology IRCCS in Milan to enable this work to be initiated during the immensely challenging times of the COVID-19 pandemic onset, including by hosting and incubating the setup of the Genomics Facility of Human Technopole. We thank all patients who participated in the study, the entire clinical staff of the Infectious Disease Unit of the Padova University Hospital, the GSA-IDEA project of the University of Milan, and the LifeTime for COVID-19 initiative. The study was funded by Fondazione Istituto di Ricerca Pediatrica (IRP) Città della Speranza grant 20/02CoV and Human Technopole (COVIDIAMO Project).
Author contributions
R.A., R.S.-R., F.M., N.B., and B.M. designed and performed in vitro experiments. P.F., E.R., and L.R. performed sequencing. M.B., N.C., F.E., C.Z., and C.E.V. performed computational analysis. D.B. and F.Z. performed docking and molecular dynamics simulations. I.P., S.G., and E.V. designed and performed SARS-CoV-2 infection experiments. A. Savino and F.I. designed and performed drug repurposing analyses. C.P. and A.M.C. enrolled and obtained consent from patients. A. Scardua, J.W., V.C., S.P., and A. Vannini produced proteins and designed and performed in vitro binding affinity experiments. A. Viola and G.T. supervised the study, interpreted data, and wrote the manuscript with input from all authors.
Declaration of interests
The authors declare no competing interests.
Inclusion and diversity
We support inclusive, diverse, and equitable conduct of research.
Published: November 8, 2023
Footnotes
Supplemental information can be found online at https://doi.org/10.1016/j.xcrm.2023.101266.
Contributor Information
Antonella Viola, Email: antonella.viola@unipd.it.
Giuseppe Testa, Email: giuseppe.testa@fht.org.
Supplemental information
Sheet 1.) Differential expression analysis of the sc-RNAseq data for the cells of each cell type cluster compared against all the other cells. Statistical analysis has been performed with Wilcoxon rank-sum test with Benjamini-Hochberg correction for multiple testing, as implemented in the Scanpy rank_genes_groups function. Only genes with corrected p-value <0.05 are reported. Sheet 2.) Differential expression analysis of the AbSeq data for the cells of each cell type cluster compared against all the other cells. Statistical analysis has been performed with Wilcoxon rank-sum test with Benjamini-Hochberg correction for multiple testing, as implemented in the Scanpy rank_genes_groups function. Sheet 3.) Cell type abundance for each patient computed from sc-RNAseq data. Abundances corresponding to each patient are normalised to one. Sheet 4.) Differential analysis of the sc-RNAseq data across the course of the disease for different patient severities. The DE analysis has been done by fitting the Negative Binomial GLM of EdgeR to pseudo-bulk expression values, comparing the pattern over time for mild and severe+critical patients separately. FDR values were computed by correcting p-values for multiple testing using Benjamini-Hochberg method. Sheet 5.) List of Gene Ontology terms with FDR ≤0.001 in the functional enrichment analysis described in Materials and Methods. The table lists gene sets showing significantly increased or decreased expression trends over time in the mild and severe+critical patients.
References
- 1.The Lancet COVID-19: the next phase and beyond. Lancet. 2022;399:1753. doi: 10.1016/S0140-6736(22)00817-0. [DOI] [PMC free article] [PubMed] [Google Scholar]
- 2.Coronaviridae Study Group of the International Committee on Taxonomy of Viruses The species Severe acute respiratory syndrome-related coronavirus: classifying 2019-nCoV and naming it SARS-CoV-2. Nat. Microbiol. 2020;5:536–544. doi: 10.1038/s41564-020-0695-z. [DOI] [PMC free article] [PubMed] [Google Scholar]
- 3.Wang M.-Y., Zhao R., Gao L.-J., Gao X.-F., Wang D.-P., Cao J.-M. SARS-CoV-2: Structure, Biology, and Structure-Based Therapeutics Development. Front. Cell. Infect. Microbiol. 2020;10 doi: 10.3389/fcimb.2020.587269. [DOI] [PMC free article] [PubMed] [Google Scholar]
- 4.Hoffmann M., Kleine-Weber H., Schroeder S., Krüger N., Herrler T., Erichsen S., Schiergens T.S., Herrler G., Wu N.-H., Nitsche A., et al. SARS-CoV-2 Cell Entry Depends on ACE2 and TMPRSS2 and Is Blocked by a Clinically Proven Protease Inhibitor. Cell. 2020;181:271–280.e8. doi: 10.1016/j.cell.2020.02.052. [DOI] [PMC free article] [PubMed] [Google Scholar]
- 5.Shang J., Wan Y., Luo C., Ye G., Geng Q., Auerbach A., Li F. Cell entry mechanisms of SARS-CoV-2. Proc. Natl. Acad. Sci. USA. 2020;117:11727–11734. doi: 10.1073/pnas.2003138117. [DOI] [PMC free article] [PubMed] [Google Scholar]
- 6.Brodin P. Immune determinants of COVID-19 disease presentation and severity. Nat. Med. 2021;27:28–33. doi: 10.1038/s41591-020-01202-8. [DOI] [PubMed] [Google Scholar]
- 7.Wang C., Wang Z., Wang G., Lau J.Y.-N., Zhang K., Li W. COVID-19 in early 2021: current status and looking forward. Signal Transduct. Targeted Ther. 2021;6:114. doi: 10.1038/s41392-021-00527-1. [DOI] [PMC free article] [PubMed] [Google Scholar]
- 8.Wang K., Chen W., Zhang Z., Deng Y., Lian J.-Q., Du P., Wei D., Zhang Y., Sun X.-X., Gong L., et al. CD147-spike protein is a novel route for SARS-CoV-2 infection to host cells. Signal Transduct. Targeted Ther. 2020;5:283. doi: 10.1038/s41392-020-00426-x. [DOI] [PMC free article] [PubMed] [Google Scholar]
- 9.Zhao Y., Kuang M., Li J., Zhu L., Jia Z., Guo X., Hu Y., Kong J., Yin H., Wang X., You F. SARS-CoV-2 spike protein interacts with and activates TLR41. Cell Res. 2021;31:818–820. doi: 10.1038/s41422-021-00495-9. [DOI] [PMC free article] [PubMed] [Google Scholar]
- 10.Cantuti-Castelvetri L., Ojha R., Pedro L.D., Djannatian M., Franz J., Kuivanen S., van der Meer F., Kallio K., Kaya T., Anastasina M., et al. Neuropilin-1 facilitates SARS-CoV-2 cell entry and infectivity. Science. 2020;370:856–860. doi: 10.1126/science.abd2985. [DOI] [PMC free article] [PubMed] [Google Scholar]
- 11.Deng G., Yin M., Chen X., Zeng F. Clinical determinants for fatality of 44,672 patients with COVID-19. Crit. Care. 2020;24:179. doi: 10.1186/s13054-020-02902-w. [DOI] [PMC free article] [PubMed] [Google Scholar]
- 12.Niemi M.E.K., Karjalainen J., Liao R.G., Neale B.M., Daly M., Ganna A., Pathak G.A., Andrews S.J., Kanai M., Veerapen K., et al. Mapping the human genetic architecture of COVID-19. Nature. 2021;600:472–477. doi: 10.1038/s41586-021-03767-x. [DOI] [PMC free article] [PubMed] [Google Scholar]
- 13.Kousathanas A., Pairo-Castineira E., Rawlik K., Stuckey A., Odhams C.A., Walker S., Russell C.D., Malinauskas T., Wu Y., Millar J., et al. Whole-genome sequencing reveals host factors underlying critical COVID-19. Nature. 2022;607:97–103. doi: 10.1038/s41586-022-04576-6. [DOI] [PMC free article] [PubMed] [Google Scholar]
- 14.Stravalaci M., Pagani I., Paraboschi E.M., Pedotti M., Doni A., Scavello F., Mapelli S.N., Sironi M., Perucchini C., Varani L., et al. Recognition and inhibition of SARS-CoV-2 by humoral innate immunity pattern recognition molecules. Nat. Immunol. 2022;23:275–286. doi: 10.1038/s41590-021-01114-w. [DOI] [PubMed] [Google Scholar]
- 15.Arunachalam P.S., Wimmers F., Mok C.K.P., Perera R.A.P.M., Scott M., Hagan T., Sigal N., Feng Y., Bristow L., Tak-Yin Tsang O., et al. Systems biological assessment of immunity to mild versus severe COVID-19 infection in humans. Science. 2020;369:1210–1220. doi: 10.1126/science.abc6261. [DOI] [PMC free article] [PubMed] [Google Scholar]
- 16.Channappanavar R., Fehr A.R., Vijay R., Mack M., Zhao J., Meyerholz D.K., Perlman S. Dysregulated Type I Interferon and Inflammatory Monocyte-Macrophage Responses Cause Lethal Pneumonia in SARS-CoV-Infected Mice. Cell Host Microbe. 2016;19:181–193. doi: 10.1016/j.chom.2016.01.007. [DOI] [PMC free article] [PubMed] [Google Scholar]
- 17.Li H., Liu L., Zhang D., Xu J., Dai H., Tang N., Su X., Cao B. SARS-CoV-2 and viral sepsis: observations and hypotheses. Lancet. 2020;395:1517–1520. doi: 10.1016/S0140-6736(20)30920-X. [DOI] [PMC free article] [PubMed] [Google Scholar]
- 18.Yang L., Xie X., Tu Z., Fu J., Xu D., Zhou Y. The signal pathways and treatment of cytokine storm in COVID-19. Signal Transduct. Targeted Ther. 2021;6:255. doi: 10.1038/s41392-021-00679-0. [DOI] [PMC free article] [PubMed] [Google Scholar]
- 19.Stephenson E., Reynolds G., Botting R.A., Calero-Nieto F.J., Morgan M.D., Tuong Z.K., Bach K., Sungnak W., Worlock K.B., Yoshida M., et al. Single-cell multi-omics analysis of the immune response in COVID-19. Nat. Med. 2021;27:904–916. doi: 10.1038/s41591-021-01329-2. [DOI] [PMC free article] [PubMed] [Google Scholar]
- 20.Tian Y., Carpp L.N., Miller H.E.R., Zager M., Newell E.W., Gottardo R. Single-cell immunology of SARS-CoV-2 infection. Nat. Biotechnol. 2022;40:30–41. doi: 10.1038/s41587-021-01131-y. [DOI] [PMC free article] [PubMed] [Google Scholar]
- 21.Singh D.K., Aladyeva E., Das S., Singh B., Esaulova E., Swain A., Ahmed M., Cole J., Moodley C., Mehra S., et al. Myeloid cell interferon responses correlate with clearance of SARS-CoV-2. Nat. Commun. 2022;13:679. doi: 10.1038/s41467-022-28315-7. [DOI] [PMC free article] [PubMed] [Google Scholar]
- 22.Schulte-Schrepping J., Reusch N., Paclik D., Baßler K., Schlickeiser S., Zhang B., Krämer B., Krammer T., Brumhard S., Bonaguro L., et al. Severe COVID-19 Is Marked by a Dysregulated Myeloid Cell Compartment. Cell. 2020;182:1419–1440.e23. doi: 10.1016/j.cell.2020.08.001. [DOI] [PMC free article] [PubMed] [Google Scholar]
- 23.Schultze J.L., Aschenbrenner A.C. COVID-19 and the human innate immune system. Cell. 2021;184:1671–1692. doi: 10.1016/j.cell.2021.02.029. [DOI] [PMC free article] [PubMed] [Google Scholar]
- 24.Junqueira C., Crespo Â., Ranjbar S., de Lacerda L.B., Lewandrowski M., Ingber J., Parry B., Ravid S., Clark S., Schrimpf M.R., et al. FcγR-mediated SARS-CoV-2 infection of monocytes activates inflammation. Nature. 2022;606:576–584. doi: 10.1038/s41586-022-04702-4. [DOI] [PMC free article] [PubMed] [Google Scholar]
- 25.Sparvero L.J., Asafu-Adjei D., Kang R., Tang D., Amin N., Im J., Rutledge R., Lin B., Amoscato A.A., Zeh H.J., Lotze M.T. RAGE (Receptor for Advanced Glycation Endproducts), RAGE ligands, and their role in cancer and inflammation. J. Transl. Med. 2009;7:17. doi: 10.1186/1479-5876-7-17. [DOI] [PMC free article] [PubMed] [Google Scholar]
- 26.He M., Kubo H., Morimoto K., Fujino N., Suzuki T., Takahasi T., Yamada M., Yamaya M., Maekawa T., Yamamoto Y., Yamamoto H. Receptor for advanced glycation end products binds to phosphatidylserine and assists in the clearance of apoptotic cells. EMBO Rep. 2011;12:358–364. doi: 10.1038/embor.2011.28. [DOI] [PMC free article] [PubMed] [Google Scholar]
- 27.Ott C., Jacobs K., Haucke E., Navarrete Santos A., Grune T., Simm A. Role of advanced glycation end products in cellular signaling. Redox Biol. 2014;2:411–429. doi: 10.1016/j.redox.2013.12.016. [DOI] [PMC free article] [PubMed] [Google Scholar]
- 28.Korsunsky I., Millard N., Fan J., Slowikowski K., Zhang F., Wei K., Baglaenko Y., Brenner M., Loh P.-R., Raychaudhuri S. Fast, sensitive and accurate integration of single-cell data with Harmony. Nat. Methods. 2019;16:1289–1296. doi: 10.1038/s41592-019-0619-0. [DOI] [PMC free article] [PubMed] [Google Scholar]
- 29.Amezquita R.A., Lun A.T.L., Becht E., Carey V.J., Carpp L.N., Geistlinger L., Marini F., Rue-Albrecht K., Risso D., Soneson C., et al. Orchestrating single-cell analysis with Bioconductor. Nat. Methods. 2020;17:137–145. doi: 10.1038/s41592-019-0654-x. [DOI] [PMC free article] [PubMed] [Google Scholar]
- 30.Squair J.W., Gautier M., Kathe C., Anderson M.A., James N.D., Hutson T.H., Hudelle R., Qaiser T., Matson K.J.E., Barraud Q., et al. Confronting false discoveries in single-cell differential expression. Nat. Commun. 2021;12:5692. doi: 10.1038/s41467-021-25960-2. [DOI] [PMC free article] [PubMed] [Google Scholar]
- 31.McCarthy D.J., Chen Y., Smyth G.K. Differential expression analysis of multifactor RNA-Seq experiments with respect to biological variation. Nucleic Acids Res. 2012;40:4288–4297. doi: 10.1093/nar/gks042. [DOI] [PMC free article] [PubMed] [Google Scholar]
- 32.Liu C., Martins A.J., Lau W.W., Rachmaninoff N., Chen J., Imberti L., Mostaghimi D., Fink D.L., Burbelo P.D., Dobbs K., et al. Time-resolved systems immunology reveals a late juncture linked to fatal COVID-19. Cell. 2021;184:1836–1857.e22. doi: 10.1016/j.cell.2021.02.018. [DOI] [PMC free article] [PubMed] [Google Scholar]
- 33.Roy D., Ramasamy R., Schmidt A.M. Journey to a receptor for advanced glycation end products connection in severe acute respiratory syndrome coronavirus 2 infection: with stops along the way in the lung, heart, blood vessels, and adipose tissue. Arterioscler. Thromb. Vasc. Biol. 2021;41:614–627. doi: 10.1161/ATVBAHA.120.315527. [DOI] [PMC free article] [PubMed] [Google Scholar]
- 34.Cheung C.Y., Poon L.L.M., Ng I.H.Y., Luk W., Sia S.-F., Wu M.H.S., Chan K.-H., Yuen K.-Y., Gordon S., Guan Y., Peiris J.S.M. Cytokine responses in severe acute respiratory syndrome coronavirus-infected macrophages in vitro: possible relevance to pathogenesis. J. Virol. 2005;79:7819–7826. doi: 10.1128/JVI.79.12.7819-7826.2005. [DOI] [PMC free article] [PubMed] [Google Scholar]
- 35.Song X., Hu W., Yu H., Zhao L., Zhao Y., Zhao X., Xue H.-H., Zhao Y. Little to no expression of angiotensin-converting enzyme-2 on most human peripheral blood immune cells but highly expressed on tissue macrophages. Cytometry A. 2023;103:136–145. doi: 10.1002/cyto.a.24285. [DOI] [PubMed] [Google Scholar]
- 36.Unterman A., Sumida T.S., Nouri N., Yan X., Zhao A.Y., Gasque V., Schupp J.C., Asashima H., Liu Y., Cosme C., et al. Single-cell multi-omics reveals dyssynchrony of the innate and adaptive immune system in progressive COVID-19. Nat. Commun. 2022;13:440. doi: 10.1038/s41467-021-27716-4. [DOI] [PMC free article] [PubMed] [Google Scholar]
- 37.Tirosh I., Izar B., Prakadan S.M., Wadsworth M.H., Treacy D., Trombetta J.J., Rotem A., Rodman C., Lian C., Murphy G., et al. Dissecting the multicellular ecosystem of metastatic melanoma by single-cell RNA-seq. Science. 2016;352:189–196. doi: 10.1126/science.aad0501. [DOI] [PMC free article] [PubMed] [Google Scholar]
- 38.Wu F., Zhao S., Yu B., Chen Y.-M., Wang W., Song Z.-G., Hu Y., Tao Z.-W., Tian J.-H., Pei Y.-Y., et al. A new coronavirus associated with human respiratory disease in China. Nature. 2020;579:265–269. doi: 10.1038/s41586-020-2008-3. [DOI] [PMC free article] [PubMed] [Google Scholar]
- 39.National Center for Immunization and Respiratory Diseases (NCIRD), Division of Viral Diseases . CDC COVID-19 Science Briefs. Centers for Disease Control and Prevention; 2020. Science brief: omicron (B.1.1.529) variant. ) [Google Scholar]
- 40.Venkatraman V., Yang Y.D., Sael L., Kihara D. Protein-protein docking using region-based 3D Zernike descriptors. BMC Bioinf. 2009;10:407. doi: 10.1186/1471-2105-10-407. [DOI] [PMC free article] [PubMed] [Google Scholar]
- 41.van der Meer D., Barthorpe S., Yang W., Lightfoot H., Hall C., Gilbert J., Francies H.E., Garnett M.J. Cell Model Passports-a hub for clinical, genetic and functional datasets of preclinical cancer models. Nucleic Acids Res. 2019;47:D923–D929. doi: 10.1093/nar/gky872. [DOI] [PMC free article] [PubMed] [Google Scholar]
- 42.Amanat F., Stadlbauer D., Strohmeier S., Nguyen T.H.O., Chromikova V., McMahon M., Jiang K., Arunkumar G.A., Jurczyszak D., Polanco J., et al. A serological assay to detect SARS-CoV-2 seroconversion in humans. Nat. Med. 2020;26:1033–1036. doi: 10.1038/s41591-020-0913-5. [DOI] [PMC free article] [PubMed] [Google Scholar]
- 43.Burstein A.H., Sabbagh M., Andrews R., Valcarce C., Dunn I., Altstiel L. Development of azeliragon, an oral small molecule antagonist of the receptor for advanced glycation endproducts, for the potential slowing of loss of cognition in mild alzheimer’s disease. J. Prev. Alzheimers Dis. 2018;5:149–154. doi: 10.14283/jpad.2018.18. [DOI] [PubMed] [Google Scholar]
- 44.Hong Y., Shen C., Yin Q., Sun M., Ma Y., Liu X. Effects of RAGE-Specific Inhibitor FPS-ZM1 on Amyloid-β Metabolism and AGEs-Induced Inflammation and Oxidative Stress in Rat Hippocampus. Neurochem. Res. 2016;41:1192–1199. doi: 10.1007/s11064-015-1814-8. [DOI] [PubMed] [Google Scholar]
- 45.Wilk A.J., Rustagi A., Zhao N.Q., Roque J., Martínez-Colón G.J., McKechnie J.L., Ivison G.T., Ranganath T., Vergara R., Hollis T., et al. A single-cell atlas of the peripheral immune response in patients with severe COVID-19. Nat. Med. 2020;26:1070–1076. doi: 10.1038/s41591-020-0944-y. [DOI] [PMC free article] [PubMed] [Google Scholar]
- 46.Ren X., Wen W., Fan X., Hou W., Su B., Cai P., Li J., Liu Y., Tang F., Zhang F., et al. COVID-19 immune features revealed by a large-scale single-cell transcriptome atlas. Cell. 2021;184:1895–1913.e19. doi: 10.1016/j.cell.2021.01.053. [DOI] [PMC free article] [PubMed] [Google Scholar]
- 47.McAndrews K.M., Dowlatshahi D.P., Dai J., Becker L.M., Hensel J., Snowden L.M., Leveille J.M., Brunner M.R., Holden K.W., Hopkins N.S., et al. Heterogeneous antibodies against SARS-CoV-2 spike receptor binding domain and nucleocapsid with implications for COVID-19 immunity. JCI Insight. 2020;5 doi: 10.1172/jci.insight.142386. [DOI] [PMC free article] [PubMed] [Google Scholar]
- 48.Akirav E.M., Preston-Hurlburt P., Garyu J., Henegariu O., Clynes R., Schmidt A.M., Herold K.C. RAGE expression in human T cells: a link between environmental factors and adaptive immune responses. PLoS One. 2012;7 doi: 10.1371/journal.pone.0034698. [DOI] [PMC free article] [PubMed] [Google Scholar]
- 49.Ruelas Cinco E.D.C., Ruíz Madrigal B., Domínguez Rosales J.A., Maldonado González M., De la Cruz Color L., Ramírez Meza S.M., Torres Baranda J.R., Martínez López E., Hernández Nazará Z.H. Expression of the receptor of advanced glycation end-products (RAGE) and membranal location in peripheral blood mononuclear cells (PBMC) in obesity and insulin resistance. Iran. J. Basic Med. Sci. 2019;22:623–630. doi: 10.22038/ijbms.2019.34571.8206. [DOI] [PMC free article] [PubMed] [Google Scholar]
- 50.Piras S., Furfaro A.L., Domenicotti C., Traverso N., Marinari U.M., Pronzato M.A., Nitti M. RAGE Expression and ROS Generation in Neurons: Differentiation versus Damage. Oxid. Med. Cell. Longev. 2016;2016 doi: 10.1155/2016/9348651. [DOI] [PMC free article] [PubMed] [Google Scholar]
- 51.Xu D., Young J., Song D., Esko J.D. Heparan sulfate is essential for high mobility group protein 1 (HMGB1) signaling by the receptor for advanced glycation end products (RAGE) J. Biol. Chem. 2011;286:41736–41744. doi: 10.1074/jbc.M111.299685. [DOI] [PMC free article] [PubMed] [Google Scholar]
- 52.Angioni R., Sánchez-Rodríguez R., Munari F., Bertoldi N., Arcidiacono D., Cavinato S., Marturano D., Zaramella A., Realdon S., Cattelan A., et al. Age-severity matched cytokine profiling reveals specific signatures in Covid-19 patients. Cell Death Dis. 2020;11:957. doi: 10.1038/s41419-020-03151-z. [DOI] [PMC free article] [PubMed] [Google Scholar]
- 53.Son M., Chung W.-J., Oh S., Ahn H., Choi C.H., Hong S., Park K.Y., Son K.H., Byun K. Age dependent accumulation patterns of advanced glycation end product receptor (RAGE) ligands and binding intensities between RAGE and its ligands differ in the liver, kidney, and skeletal muscle. Immun. Ageing. 2017;14:12. doi: 10.1186/s12979-017-0095-2. [DOI] [PMC free article] [PubMed] [Google Scholar]
- 54.Ramasamy R., Yan S.F., Schmidt A.M. Receptor for AGE (RAGE): signaling mechanisms in the pathogenesis of diabetes and its complications. Ann. N. Y. Acad. Sci. 2011;1243:88–102. doi: 10.1111/j.1749-6632.2011.06320.x. [DOI] [PMC free article] [PubMed] [Google Scholar]
- 55.Corica D., Aversa T., Ruggeri R.M., Cristani M., Alibrandi A., Pepe G., De Luca F., Wasniewska M. Could AGE/RAGE-Related Oxidative Homeostasis Dysregulation Enhance Susceptibility to Pathogenesis of Cardio-Metabolic Complications in Childhood Obesity? Front. Endocrinol. 2019;10:426. doi: 10.3389/fendo.2019.00426. [DOI] [PMC free article] [PubMed] [Google Scholar]
- 56.Feng Z., Zhu L., Wu J. RAGE signalling in obesity and diabetes: focus on the adipose tissue macrophage. Adipocyte. 2020;9:563–566. doi: 10.1080/21623945.2020.1817278. [DOI] [PMC free article] [PubMed] [Google Scholar]
- 57.Ruiz H.H., Ramasamy R., Schmidt A.M. Advanced glycation end products: building on the concept of the “common soil” in metabolic disease. Endocrinology. 2020;161 doi: 10.1210/endocr/bqz006. [DOI] [PMC free article] [PubMed] [Google Scholar]
- 58.Barlovic D.P., Soro-Paavonen A., Jandeleit-Dahm K.A.M. RAGE biology, atherosclerosis and diabetes. Clin. Sci. 2011;121:43–55. doi: 10.1042/CS20100501. [DOI] [PubMed] [Google Scholar]
- 59.Gebhardt C., Riehl A., Durchdewald M., Németh J., Fürstenberger G., Müller-Decker K., Enk A., Arnold B., Bierhaus A., Nawroth P.P., et al. RAGE signaling sustains inflammation and promotes tumor development. J. Exp. Med. 2008;205:275–285. doi: 10.1084/jem.20070679. [DOI] [PMC free article] [PubMed] [Google Scholar]
- 60.Calfee C.S., Ware L.B., Eisner M.D., Parsons P.E., Thompson B.T., Wickersham N., Matthay M.A., NHLBI ARDS Network Plasma receptor for advanced glycation end products and clinical outcomes in acute lung injury. Thorax. 2008;63:1083–1089. doi: 10.1136/thx.2008.095588. [DOI] [PMC free article] [PubMed] [Google Scholar]
- 61.Nakamura T., Sato E., Fujiwara N., Kawagoe Y., Maeda S., Yamagishi S.i. Increased levels of soluble receptor for advanced glycation end products (sRAGE) and high mobility group box 1 (HMGB1) are associated with death in patients with acute respiratory distress syndrome. Clin. Biochem. 2011;44:601–604. doi: 10.1016/j.clinbiochem.2010.12.014. [DOI] [PubMed] [Google Scholar]
- 62.Knoll R., Schultze J.L., Schulte-Schrepping J. Monocytes and Macrophages in COVID-19. Front. Immunol. 2021;12 doi: 10.3389/fimmu.2021.720109. [DOI] [PMC free article] [PubMed] [Google Scholar]
- 63.Casalino L., Gaieb Z., Goldsmith J.A., Hjorth C.K., Dommer A.C., Harbison A.M., Fogarty C.A., Barros E.P., Taylor B.C., McLellan J.S., et al. Beyond Shielding: The Roles of Glycans in the SARS-CoV-2 Spike Protein. ACS Cent. Sci. 2020;6:1722–1734. doi: 10.1021/acscentsci.0c01056. [DOI] [PMC free article] [PubMed] [Google Scholar]
- 64.da Costa C.H.S., de Freitas C.A.B., Alves C.N., Lameira J. Assessment of mutations on RBD in the Spike protein of SARS-CoV-2 Alpha, Delta and Omicron variants. Sci. Rep. 2022;12:8540. doi: 10.1038/s41598-022-12479-9. [DOI] [PMC free article] [PubMed] [Google Scholar]
- 65.Buratto D., Saxena A., Ji Q., Yang G., Pantano S., Zonta F. Rapid Assessment of Binding Affinity of SARS-COV-2 Spike Protein to the Human Angiotensin-Converting Enzyme 2 Receptor and to Neutralizing Biomolecules Based on Computer Simulations. Front. Immunol. 2021;12 doi: 10.3389/fimmu.2021.730099. [DOI] [PMC free article] [PubMed] [Google Scholar]
- 66.Carabelli A.M., Peacock T.P., Thorne L.G., Harvey W.T., Hughes J., COVID-19 Genomics UK Consortium. Peacock S.J., Barclay W.S., de Silva T.I., Towers G.J., Robertson D.L. SARS-CoV-2 variant biology: immune escape, transmission and fitness. Nat. Rev. Microbiol. 2023;21:162–177. doi: 10.1038/s41579-022-00841-7. [DOI] [PMC free article] [PubMed] [Google Scholar]
- 67.Li Y., Liu D., Wang Y., Su W., Liu G., Dong W. The importance of glycans of viral and host proteins in enveloped virus infection. Front. Immunol. 2021;12 doi: 10.3389/fimmu.2021.638573. [DOI] [PMC free article] [PubMed] [Google Scholar]
- 68.Mehta R., Shaw G., Masschelin P., Felix S., Otgonsuren M., Baranova A., Goodman Z., Younossi Z. Polymorphisms in the receptor for advanced glycation end-products (RAGE) gene and circulating RAGE levels as a susceptibility factor for non-alcoholic steatohepatitis (NASH) PLoS One. 2018;13 doi: 10.1371/journal.pone.0199294. [DOI] [PMC free article] [PubMed] [Google Scholar]
- 69.Su S.-C., Hsieh M.-J., Chou Y.-E., Fan W.-L., Yeh C.-B., Yang S.-F. Effects of RAGE gene polymorphisms on the risk and progression of hepatocellular carcinoma. Medicine (Baltim.) 2015;94 doi: 10.1097/MD.0000000000001396. [DOI] [PMC free article] [PubMed] [Google Scholar]
- 70.C R.C., Lukose B., Rani P. G82S RAGE polymorphism influences amyloid-RAGE interactions relevant in Alzheimer’s disease pathology. PLoS One. 2020;15 doi: 10.1371/journal.pone.0225487. [DOI] [PMC free article] [PubMed] [Google Scholar]
- 71.Gao J., Shao Y., Lai W., Ren H., Xu D. Association of polymorphisms in the RAGE gene with serum CRP levels and coronary artery disease in the Chinese Han population. J. Hum. Genet. 2010;55:668–675. doi: 10.1038/jhg.2010.85. [DOI] [PubMed] [Google Scholar]
- 72.Al-Hakeim H.K., Al-Jassas H.K., Morris G., Maes M. Increased ACE2, sRAGE, and Immune Activation, but Lowered Calcium and Magnesium in COVID-19. Recent Adv. Inflamm. Allergy Drug Discov. 2022;16:32–43. doi: 10.2174/2772270816666220318103929. [DOI] [PubMed] [Google Scholar]
- 73.Tojo K., Yamamoto N., Tamada N., Mihara T., Abe M., Nishii M., Takeuchi I., Goto T. Early alveolar epithelial cell necrosis is a potential driver of COVID-19-induced acute respiratory distress syndrome. iScience. 2023;26 doi: 10.1016/j.isci.2022.105748. [DOI] [PMC free article] [PubMed] [Google Scholar]
- 74.Lim A., Radujkovic A., Weigand M.A., Merle U. Soluble receptor for advanced glycation end products (sRAGE) as a biomarker of COVID-19 disease severity and indicator of the need for mechanical ventilation, ARDS and mortality. Ann. Intensive Care. 2021;11:50. doi: 10.1186/s13613-021-00836-2. [DOI] [PMC free article] [PubMed] [Google Scholar]
- 75.Butcher L., Zaldua J.-C., Carnicero J.A., Hawkins K., Whitley J., Mothukuri R., Evans P.A., Morris K., Pillai S., Erusalimsky J.D. High levels of soluble RAGE are associated with a greater risk of mortality in COVID-19 patients treated with dexamethasone. Respir. Res. 2022;23:303. doi: 10.1186/s12931-022-02220-5. [DOI] [PMC free article] [PubMed] [Google Scholar]
- 76.Wick K.D., Siegel L., Neaton J.D., Oldmixon C., Lundgren J., Dewar R.L., Lane H.C., Thompson B.T., Matthay M.A., ACTIV-3/TICO study group RAGE has potential pathogenetic and prognostic value in nonintubated hospitalized patients with COVID-19. JCI Insight. 2022;7 doi: 10.1172/jci.insight.157499. [DOI] [PMC free article] [PubMed] [Google Scholar]
- 77.Erusalimsky J.D. The use of the soluble receptor for advanced glycation-end products (sRAGE) as a potential biomarker of disease risk and adverse outcomes. Redox Biol. 2021;42 doi: 10.1016/j.redox.2021.101958. [DOI] [PMC free article] [PubMed] [Google Scholar]
- 78.Wagner A., Cohen N., Kelder T., Amit U., Liebman E., Steinberg D.M., Radonjic M., Ruppin E. Drugs that reverse disease transcriptomic signatures are more effective in a mouse model of dyslipidemia. Mol. Syst. Biol. 2015;11:791. doi: 10.15252/msb.20145486. [DOI] [PMC free article] [PubMed] [Google Scholar]
- 79.Kunkel S.D., Suneja M., Ebert S.M., Bongers K.S., Fox D.K., Malmberg S.E., Alipour F., Shields R.K., Adams C.M. mRNA expression signatures of human skeletal muscle atrophy identify a natural compound that increases muscle mass. Cell Metabol. 2011;13:627–638. doi: 10.1016/j.cmet.2011.03.020. [DOI] [PMC free article] [PubMed] [Google Scholar]
- 80.Dudley J.T., Sirota M., Shenoy M., Pai R.K., Roedder S., Chiang A.P., Morgan A.A., Sarwal M.M., Pasricha P.J., Butte A.J. Computational repositioning of the anticonvulsant topiramate for inflammatory bowel disease. Sci. Transl. Med. 2011;3:96ra76. doi: 10.1126/scitranslmed.3002648. [DOI] [PMC free article] [PubMed] [Google Scholar]
- 81.Zhang J., Zhao C., Zhao W. Virus Caused Imbalance of Type I IFN Responses and Inflammation in COVID-19. Front. Immunol. 2021;12 doi: 10.3389/fimmu.2021.633769. [DOI] [PMC free article] [PubMed] [Google Scholar]
- 82.Senatus L., López-Díez R., Egaña-Gorroño L., Liu J., Hu J., Daffu G., Li Q., Rahman K., Vengrenyuk Y., Barrett T.J., et al. RAGE impairs murine diabetic atherosclerosis regression and implicates IRF7 in macrophage inflammation and cholesterol metabolism. JCI Insight. 2020;5 doi: 10.1172/jci.insight.137289. [DOI] [PMC free article] [PubMed] [Google Scholar]
- 83.Krämer A., Green J., Pollard J., Tugendreich S. Causal analysis approaches in Ingenuity Pathway Analysis. Bioinformatics. 2014;30:523–530. doi: 10.1093/bioinformatics/btt703. [DOI] [PMC free article] [PubMed] [Google Scholar]
- 84.Garcia G., Sharma A., Ramaiah A., Sen C., Purkayastha A., Kohn D.B., Parcells M.S., Beck S., Kim H., Bakowski M.A., et al. Antiviral drug screen identifies DNA-damage response inhibitor as potent blocker of SARS-CoV-2 replication. Cell Rep. 2021;35 doi: 10.1016/j.celrep.2021.108940. [DOI] [PMC free article] [PubMed] [Google Scholar]
- 85.Gupta A., Madhavan M.V., Poterucha T.J., DeFilippis E.M., Hennessey J.A., Redfors B., Eckhardt C., Bikdeli B., Platt J., Nalbandian A., et al. Association between antecedent statin use and decreased mortality in hospitalized patients with COVID-19. Nat. Commun. 2021;12:1325. doi: 10.1038/s41467-021-21553-1. [DOI] [PMC free article] [PubMed] [Google Scholar]
- 86.Cuccurullo C., Iezzi A., Fazia M.L., De Cesare D., Di Francesco A., Muraro R., Bei R., Ucchino S., Spigonardo F., Chiarelli F., et al. Suppression of RAGE as a basis of simvastatin-dependent plaque stabilization in type 2 diabetes. Arterioscler. Thromb. Vasc. Biol. 2006;26:2716–2723. doi: 10.1161/01.ATV.0000249630.02085.12. [DOI] [PubMed] [Google Scholar]
- 87.Liu M., Yu Y., Jiang H., Zhang L., Zhang P.p., Yu P., Jia J.g., Chen R.z., Zou Y.z., Ge J.b. Simvastatin suppresses vascular inflammation and atherosclerosis in ApoE(-/-) mice by downregulating the HMGB1-RAGE axis. Acta Pharmacol. Sin. 2013;34:830–836. doi: 10.1038/aps.2013.8. [DOI] [PMC free article] [PubMed] [Google Scholar]
- 88.Leclerc E., Fritz G., Vetter S.W., Heizmann C.W. Binding of S100 proteins to RAGE: an update. Biochim. Biophys. Acta. 2009;1793:993–1007. doi: 10.1016/j.bbamcr.2008.11.016. [DOI] [PubMed] [Google Scholar]
- 89.Xie Y., Xu E., Bowe B., Al-Aly Z. Long-term cardiovascular outcomes of COVID-19. Nat. Med. 2022;28:583–590. doi: 10.1038/s41591-022-01689-3. [DOI] [PMC free article] [PubMed] [Google Scholar]
- 90.Sellegounder D., Zafari P., Rajabinejad M., Taghadosi M., Kapahi P. Advanced glycation end products (AGEs) and its receptor, RAGE, modulate age-dependent COVID-19 morbidity and mortality. A review and hypothesis. Int. Immunopharm. 2021;98 doi: 10.1016/j.intimp.2021.107806. [DOI] [PMC free article] [PubMed] [Google Scholar]
- 91.Park H., Adsit F.G., Boyington J.C. The 1.5 Å crystal structure of human receptor for advanced glycation endproducts (RAGE) ectodomains reveals unique features determining ligand binding. J. Biol. Chem. 2010;285:40762–40770. doi: 10.1074/jbc.M110.169276. [DOI] [PMC free article] [PubMed] [Google Scholar]
- 92.Wrobel A.G., Benton D.J., Xu P., Roustan C., Martin S.R., Rosenthal P.B., Skehel J.J., Gamblin S.J. SARS-CoV-2 and bat RaTG13 spike glycoprotein structures inform on virus evolution and furin-cleavage effects. Nat. Struct. Mol. Biol. 2020;27:763–767. doi: 10.1038/s41594-020-0468-7. [DOI] [PMC free article] [PubMed] [Google Scholar]
- 93.Pronk S., Páll S., Schulz R., Larsson P., Bjelkmar P., Apostolov R., Shirts M.R., Smith J.C., Kasson P.M., van der Spoel D., et al. GROMACS 4.5: a high-throughput and highly parallel open source molecular simulation toolkit. Bioinformatics. 2013;29:845–854. doi: 10.1093/bioinformatics/btt055. [DOI] [PMC free article] [PubMed] [Google Scholar]
- 94.Maier J.A., Martinez C., Kasavajhala K., Wickstrom L., Hauser K.E., Simmerling C. ff14SB: Improving the Accuracy of Protein Side Chain and Backbone Parameters from ff99SB. J. Chem. Theor. Comput. 2015;11:3696–3713. doi: 10.1021/acs.jctc.5b00255. [DOI] [PMC free article] [PubMed] [Google Scholar]
- 95.Zonta F., Buratto D., Crispino G., Carrer A., Bruno F., Yang G., Mammano F., Pantano S. Cues to opening mechanisms from in silico electric field excitation of cx26 hemichannel and in vitro mutagenesis studies in hela transfectans. Front. Mol. Neurosci. 2018;11:170. doi: 10.3389/fnmol.2018.00170. [DOI] [PMC free article] [PubMed] [Google Scholar]
- 96.Ziraldo G., Buratto D., Kuang Y., Xu L., Carrer A., Nardin C., Chiani F., Salvatore A.M., Paludetti G., Lerner R.A., et al. A Human-Derived Monoclonal Antibody Targeting Extracellular Connexin Domain Selectively Modulates Hemichannel Function. Front. Physiol. 2019;10:392. doi: 10.3389/fphys.2019.00392. [DOI] [PMC free article] [PubMed] [Google Scholar]
- 97.Subramanian A., Narayan R., Corsello S.M., Peck D.D., Natoli T.E., Lu X., Gould J., Davis J.F., Tubelli A.A., Asiedu J.K., et al. A next generation connectivity map: L1000 platform and the first 1,000,000 profiles. Cell. 2017;171:1437–1452.e17. doi: 10.1016/j.cell.2017.10.049. [DOI] [PMC free article] [PubMed] [Google Scholar]
- 98.Luecken M.D., Theis F.J. Current best practices in single-cell RNA-seq analysis: a tutorial. Mol. Syst. Biol. 2019;15 doi: 10.15252/msb.20188746. [DOI] [PMC free article] [PubMed] [Google Scholar]
- 99.Wolf F.A., Angerer P., Theis F.J. SCANPY: large-scale single-cell gene expression data analysis. Genome Biol. 2018;19:15. doi: 10.1186/s13059-017-1382-0. [DOI] [PMC free article] [PubMed] [Google Scholar]
- 100.Robinson M.D., McCarthy D.J., Smyth G.K. edgeR: a Bioconductor package for differential expression analysis of digital gene expression data. Bioinformatics. 2010;26:139–140. doi: 10.1093/bioinformatics/btp616. [DOI] [PMC free article] [PubMed] [Google Scholar]
- 101.Chen Y., Lun A.T.L., Smyth G.K. From reads to genes to pathways: differential expression analysis of RNA-Seq experiments using Rsubread and the edgeR quasi-likelihood pipeline. F1000Res. 2016;5:1438. doi: 10.12688/f1000research.8987.2. [DOI] [PMC free article] [PubMed] [Google Scholar]
- 102.Franceschini A., Szklarczyk D., Frankild S., Kuhn M., Simonovic M., Roth A., Lin J., Minguez P., Bork P., von Mering C., Jensen L.J. STRING v9.1: protein-protein interaction networks, with increased coverage and integration. Nucleic Acids Res. 2013;41:D808–D815. doi: 10.1093/nar/gks1094. [DOI] [PMC free article] [PubMed] [Google Scholar]
- 103.Shannon P., Markiel A., Ozier O., Baliga N.S., Wang J.T., Ramage D., Amin N., Schwikowski B., Ideker T. Cytoscape: a software environment for integrated models of biomolecular interaction networks. Genome Res. 2003;13:2498–2504. doi: 10.1101/gr.1239303. [DOI] [PMC free article] [PubMed] [Google Scholar]
- 104.Wu T., Hu E., Xu S., Chen M., Guo P., Dai Z., Feng T., Zhou L., Tang W., Zhan L., et al. clusterProfiler 4.0: A universal enrichment tool for interpreting omics data. Innovation. 2021;2 doi: 10.1016/j.xinn.2021.100141. [DOI] [PMC free article] [PubMed] [Google Scholar]
- 105.Yu G., Wang L.-G., Han Y., He Q.-Y. clusterProfiler: an R package for comparing biological themes among gene clusters. OMICS. 2012;16:284–287. doi: 10.1089/omi.2011.0118. [DOI] [PMC free article] [PubMed] [Google Scholar]
- 106.Yao C., Bora S.A., Parimon T., Zaman T., Friedman O.A., Palatinus J.A., Surapaneni N.S., Matusov Y.P., Cerro Chiang G., Kassar A.G., et al. Cell-Type-Specific Immune Dysregulation in Severely Ill COVID-19 Patients. Cell Rep. 2021;34 doi: 10.1016/j.celrep.2020.108590. [DOI] [PMC free article] [PubMed] [Google Scholar]
- 107.Bost P., De Sanctis F., Canè S., Ugel S., Donadello K., Castellucci M., Eyal D., Fiore A., Anselmi C., Barouni R.M., et al. Deciphering the state of immune silence in fatal COVID-19 patients. Nat. Commun. 2021;12:1428. doi: 10.1038/s41467-021-21702-6. [DOI] [PMC free article] [PubMed] [Google Scholar]
- 108.Yu K., He J., Wu Y., Xie B., Liu X., Wei B., Zhou H., Lin B., Zuo Z., Wen W., et al. Dysregulated adaptive immune response contributes to severe COVID-19. Cell Res. 2020;30:814–816. doi: 10.1038/s41422-020-0391-9. [DOI] [PMC free article] [PubMed] [Google Scholar]
- 109.Silvin A., Chapuis N., Dunsmore G., Goubet A.-G., Dubuisson A., Derosa L., Almire C., Hénon C., Kosmider O., Droin N., et al. Elevated Calprotectin and Abnormal Myeloid Cell Subsets Discriminate Severe from Mild COVID-19. Cell. 2020;182:1401–1418.e18. doi: 10.1016/j.cell.2020.08.002. [DOI] [PMC free article] [PubMed] [Google Scholar]
- 110.Combes A.J., Courau T., Kuhn N.F., Hu K.H., Ray A., Chen W.S., Chew N.W., Cleary S.J., Kushnoor D., Reeder G.C., et al. Global absence and targeting of protective immune states in severe COVID-19. Nature. 2021;591:124–130. doi: 10.1038/s41586-021-03234-7. [DOI] [PMC free article] [PubMed] [Google Scholar]
- 111.Wen W., Su W., Tang H., Le W., Zhang X., Zheng Y., Liu X., Xie L., Li J., Ye J., et al. Immune cell profiling of COVID-19 patients in the recovery stage by single-cell sequencing. Cell Discov. 2020;6:31. doi: 10.1038/s41421-020-0168-9. [DOI] [PMC free article] [PubMed] [Google Scholar]
- 112.Lee J.S., Park S., Jeong H.W., Ahn J.Y., Choi S.J., Lee H., Choi B., Nam S.K., Sa M., Kwon J.-S., et al. Immunophenotyping of COVID-19 and influenza highlights the role of type I interferons in development of severe COVID-19. Sci. Immunol. 2020;5 doi: 10.1126/sciimmunol.abd1554. [DOI] [PMC free article] [PubMed] [Google Scholar]
- 113.Su Y., Chen D., Yuan D., Lausted C., Choi J., Dai C.L., Voillet V., Duvvuri V.R., Scherler K., Troisch P., et al. Multi-Omics Resolves a Sharp Disease-State Shift between Mild and Moderate COVID-19. Cell. 2020;183:1479–1495.e20. doi: 10.1016/j.cell.2020.10.037. [DOI] [PMC free article] [PubMed] [Google Scholar]
- 114.Zhu L., Yang P., Zhao Y., Zhuang Z., Wang Z., Song R., Zhang J., Liu C., Gao Q., Xu Q., et al. Single-Cell Sequencing of Peripheral Mononuclear Cells Reveals Distinct Immune Response Landscapes of COVID-19 and Influenza Patients. Immunity. 2020;53:685–696.e3. doi: 10.1016/j.immuni.2020.07.009. [DOI] [PMC free article] [PubMed] [Google Scholar]
- 115.Stephenson E., Reynolds G., Botting R.A., Calero-Nieto F.J., Morgan M., Tuong Z.K., Bach K., Sungnak W., Worlock K.B., Yoshida M., et al. The cellular immune response to COVID-19 deciphered by single cell multi-omics across three UK centres. medRxiv. 2021 doi: 10.1101/2021.01.13.21249725. Preprint at. [DOI] [PMC free article] [PubMed] [Google Scholar]
Associated Data
This section collects any data citations, data availability statements, or supplementary materials included in this article.
Supplementary Materials
Sheet 1.) Differential expression analysis of the sc-RNAseq data for the cells of each cell type cluster compared against all the other cells. Statistical analysis has been performed with Wilcoxon rank-sum test with Benjamini-Hochberg correction for multiple testing, as implemented in the Scanpy rank_genes_groups function. Only genes with corrected p-value <0.05 are reported. Sheet 2.) Differential expression analysis of the AbSeq data for the cells of each cell type cluster compared against all the other cells. Statistical analysis has been performed with Wilcoxon rank-sum test with Benjamini-Hochberg correction for multiple testing, as implemented in the Scanpy rank_genes_groups function. Sheet 3.) Cell type abundance for each patient computed from sc-RNAseq data. Abundances corresponding to each patient are normalised to one. Sheet 4.) Differential analysis of the sc-RNAseq data across the course of the disease for different patient severities. The DE analysis has been done by fitting the Negative Binomial GLM of EdgeR to pseudo-bulk expression values, comparing the pattern over time for mild and severe+critical patients separately. FDR values were computed by correcting p-values for multiple testing using Benjamini-Hochberg method. Sheet 5.) List of Gene Ontology terms with FDR ≤0.001 in the functional enrichment analysis described in Materials and Methods. The table lists gene sets showing significantly increased or decreased expression trends over time in the mild and severe+critical patients.
Data Availability Statement
-
-
The single-cell RNA-Seq raw data reported in this study cannot be deposited in a public repository because of ethical and privacy restrictions. Sequence data have been deposited at the European Genome-phenome Archive (EGA) under the study accession number EGA: EGAS00001007529. They are available through controlled access. Microscopy, Flow Cytometry and Drug repurposing data reported in this paper will be shared by the lead contact upon request.
-
-
This paper analyses existing, publicly available data. These datasets can be downloaded from https://atlas.fredhutch.org/fredhutch/covid/.
-
-
All the code used to produce the results of this study has been organised in a repository available at GitHub: https://github.com/GiuseppeTestaLab/covid19-RAGE.
-
-
Any additional information required to reanalyse the data reported in this work paper is available from the Lead Contact upon request.