

Abstract
In order to investigate Li2S as a potential protective coating for lithium anode batteries using superionic electrolytes, we need to describe reactions and transport for systems at scales of >10,000 atoms for time scales beyond nanoseconds, which is most impractical for quantum mechanics (QM) calculations. To overcome this issue, here, we first report the development of the reactive analytical force field (ReaxFF) based on density functional theory (DFT) calculations on model systems at the PBE0/TZVP and M062X/TZVP levels. Then, we carry out reactive molecular dynamics simulations (RMD) for up to 20 ns to investigate the diffusion mechanisms in bulk Li2S as a function of vacancy density, determining the activation barrier for diffusion and conductivity. We show that RMD predictions for diffusion and conductivity are comparable to experiments, while results on model systems are consistent with and validated by short (10–100 ps) ab initio molecular dynamics (AIMD). This new ReaxFF for Li2S systems enables practical RMD on spatial scales of 10–100 nm (10,000 to 10 million atoms) for the time scales of 20 ns required to investigate predictively the interfaces between electrodes and electrolytes, electrodes and coatings, and coatings and electrolytes during the charging and discharging processes.
Introduction
Lithium-ion batteries dominate the market for energy storage devices, but the current generation is reaching its maximum possible performance.1,2 The increasing demand for portable devices and electric vehicles (EVs)3,4 needs the much higher performance of Li–metal anode batteries: high capacity (∼3800–3900 mA h g–1), low electrochemical potential (about 3.0 V vs the standard hydrogen electrode, SHE), and low gravimetric density (close to 0.5 g cm–3).5,6
These promising properties make the application of Li anode batteries indispensable for next-generation energy-storage devices, such as Li–S and Li–air batteries. Despite this promise, Li metal anode batteries have been marginally studied until recently because of safety concerns originating from the high reactivity of Li that causes spontaneous reactions with electrolytes.
In this view, all solid-state batteries (ASSBs), which combine a solid electrolyte with a Li–metal anode, are most promising because they enable achievement of energy storage with higher energy densities and improved safety compared to standard Li-ion cells based on liquid electrolytes. This requires new electrolytes that are stable against a Li–metal anode or, alternatively, a protective layer to stabilize the solid-electrolyte interphase (SEI).
In the field of ionically conductive solids, significant progress has been made recently with the discovery of numerous sulfide-based compounds with superionic conductivities.7−11 Argyrodites Li6PS4XS with X = (Cl, Br, and I) belong to this family of compounds.12−14 They are PS4-based crystalline Li-rich solids with unusually high Li+ mobility. Unfortunately, these electrolytes can react with Li metal anodes. Therefore, we investigate coatings designed to suppress the degradation of the electrolyte while maintaining high Li+ conductivity. This provides insight into the stabilization of solid electrolytes at the interface with the Li metal electrodes.
One possible coating at the Li anode is “sulfide-based”. Indeed, ionic materials such as Li2S can form during charge/discharge processes during battery operation in sulfur–graphite batteries.15 In addition, in a recent paper, we showed the presence of Li2S at the termination of {111} and {001} stable surfaces of the Cl–Argyrodite,16 which supports the hypothesis of an incipient phase separation working naturally as a possible coating agent. Therefore, Li2S represents an interesting starting material to develop and test a comprehensive simulation methodology aimed at understanding how diffusion phenomena occurring at electrolyte/electrode interfaces affect battery performance.
Given the great difficulties for the experimental assessment of the atomistic details of the SEI, we need to use theory to provide a full characterization of the SEI.
Quantum mechanics (QM) on model systems can provide a fundamental atomistic-level description of some of the reactive processes at the interface between Li–metal and the electrolyte, which may help improve our comprehension of solid electrolytes via accurate estimates of ion migration energy barriers, relevant thermodynamic properties, and preferred diffusion pathways.17−19 However, the practical size and time scale for QM-based MD (AIMD) are 200–300 atoms (2–3 nm) and 50–100 ps. Instead, we need a tool that allows a reliable prediction of complex reactions involving “sulfides” once the electrode is put in contact with a solid electrolyte. To describe the reactions forming the SEI and its effect on transport during charging and discharging, realistic simulations of the Li anode electrolyte interface require spatial scales of 10–100 nm (10,000 to 10 million atoms) at temperatures of 300 to 400 K for times of 1–20 ns. Consequently, we propose to use the reactive force field (ReaxFF) methodology, which has been employed widely to predict the dynamics of complex multiphase chemical reactions on a large number of systems (>5320 citations), including molecular dynamics (MD) simulations on electrolyte molecules20,21 and batteries.22,23 ReaxFF uses general bond order-bond distance and bond energy-bond order relationships to describe bond breaking and formation processes,22 while optimizing the charge distribution using the charge equilibration (QEq) formalism that uses Gaussian-shaped charges instead of point charges to describe shielding at short distances.24 Unfortunately, no ReaxFF is available to describe reactive processes for Li/Li2S (or to simulate “sulfide-based” electrolytes such as Argyrodites) systems. Thus, we report here the development of ReaxFF parameters based on comparison to QM using model systems; we apply it to computations on Li2S systems with up to eight hundred atoms to provide insight into the properties of the Li2S protective layer. We report the formation energies of possible defects in Li2S and conduct an exhaustive MD study of anion and cation diffusion in these systems for up to 20 ns over a temperature range of 300 to 900 K. Later, we will use this ReaxFF to obtain a deeper understanding of the complex SEI that should be useful in developing a new generation of highly efficient batteries.
Computational Methods
ReaxFF Reactive Force Field Method
The force field optimization procedure we adopted is the one identified by Van Duin for various systems.22,25 To optimize the parameters of a force field, it requires a training set of quantum mechanics data for model systems. This training set must contain the kind of data that the force field must be able to produce. Since the major reasons for developing the ReaxFF force field are to predict the mechanisms of Li+ diffusion in Li2S, the reproduction of the energy cost for Li+ vacancies in Li2S bulk, and the energy cost for sulfur vacancies and a trivacancy (single unit formula of Li2S) by our ReaxFF is of prime concern. The force field must also be able to reproduce: the experimental heat of formation, the expansion/contraction behavior (“roughly” the equation of state (EOS)) of the bulk system, and the interaction between the ionic species Li+ and LiS– as a function of distance r. The values of energy are considered for a volume variation of ΔV ± 10% with respect to zero temperature and zero pressure equilibrium volume V0.
To build our training set, we considered the energy associated with the processes of formation of vacancies described in the following equations
| 1 |
 =
=  + ELi – n
 is the energy cost for removing the Li
atom in Li2S corrected for basis set superposition energy
(BSSE)26 according to the counterpoise
method
is the energy cost for removing the Li
atom in Li2S corrected for basis set superposition energy
(BSSE)26 according to the counterpoise
method
| 2 |
where corresponding
formation energy  =
=  +
+  – n
– n is the energy cost for the S atom in its
bulk with orthorhombic Pmn21 symmetry,
which contains S8 cycles.
is the energy cost for the S atom in its
bulk with orthorhombic Pmn21 symmetry,
which contains S8 cycles.
| 3 |
where  =
=  +
+  is the energy cost for remotion of one
unit formula of Li2S from bulk Li2S corrected
for BSSE according to the counterpoise method (see Table 1).
is the energy cost for remotion of one
unit formula of Li2S from bulk Li2S corrected
for BSSE according to the counterpoise method (see Table 1).
| 4 |
where  =
=  –
–  is the dissociation energy of
Li2Sgas-phase to interacting ions Li+ and LiS– at a distance of 4 Å.
is the dissociation energy of
Li2Sgas-phase to interacting ions Li+ and LiS– at a distance of 4 Å.
Table 1. Predicted Formation Energies (in eV) for Vacancies in Li2S at the DFT and ReaxFF Levels for the Reactions Adopted in the Training Set.
| vacancy | PBE0BS1 | PBE0BS2 | M06-2XBS2 | ReaxFF |
|---|---|---|---|---|
| Li | 5.971 | 6.030 | 6.336 | 5.943 |
| S(S8) | 5.389 | 5.452 | 5.992 | 5.341 |
| Li2S trivac. | 7.315 | 7.516 | 8.198 | 6.793 |
| Li+–LiS– | 3.067 | 3.033 | 3.134 | 2.901 |
The development of this tailored ReaxFF was performed by using the LAMMPS environment. Together with the introduction and optimization of bond, angle, torsion, off-diagonal terms, overcoordination, and under-coordination terms, we also include terms pertaining to the ATOM part of the force field and concerning the Coulomb part described by the QEq approach, for which electronegativity and hardness (χ and J) have been optimized24 to match well the DFT data adopted as the training set. About the cost function used, the error in the individual quantities is defined as
| 5 |
with ffvalue, the ReaxFF energy, and QMvalue, the DFT energy as obtained at the UPBE0/Ahlrichs TZVP level, as described in the Computational Methods Section, while the total error or cost function is defined as
| 6 |
The weight is 1.0 for each property adopted in the training set, apart for the heat of formation, where the weight we attributed is 3.0, and the energy differences with reference to minimum energy volume V0 at 0 K in the two cases of 0.99 V0 and 1.01 V0, where a weight of 0.2 was assigned. A code by van Duin implementing the methodology reported in refs (22) and (25) was adopted, which was previously used in a number of published papers. The electronegativity and hardness were optimized to reproduce the interaction between free ions Li+ and LiS–. Moreover, the charges on atoms closer to Li vacancies have been optimized to reproduce the Mulliken charges obtained in DFT calculations at the PBE0/Ahlrichs TZVP level.
Quantum Mechanical Calculations
Unrestricted PBE0 (as implemented in the Crystal periodic program27,28) calculations were performed together with the Lichanot basis set29 and the Ahlrichs split valence triple-ζ basis sets plus polarization (TZVP) for all the elements.30 The M06-2X Minnesota high-nonlocality functional with doubled nonlocal exchange, 2X, was also adopted to account for noncovalent interactions31 The truncation criteria of the Coulomb and exchange for infinite lattice series were controlled by five thresholds: Ti = 8 (for T1–T4) and T5 = 16. The convergence threshold on energy for the self-consistent-field (SCF) procedure was set to 1 × 10⁻⁸ hartree for structural optimizations. A pruned Becke grid with 75 radial and 974 angular points in regions relevant for chemical bonding was used. Reciprocal space sampling is based on a regular Pack–Monkhorst32 grid centered at the Γ point, with a shrinking factor of 6 along each vector. For DFT calculation of defects in bulk Li2S, we adopted a 2 × 2 × 2 supercell (96 atoms) of the conventional cubic bulk cell in the Fm3̅m symmetry group. To estimate the dissociation energy of Li2Sgas-phase to interacting ions Li+ and LiS–, we used single point PBE0/Ahlrichs split valence triple-ζ basis sets plus the polarization (TZVP) level on the geometry obtained at the PBE0/QZVP level.
Molecular Dynamics Simulations
On both perfect bulk and defective model systems, we performed minimization and molecular dynamics simulation by employing our newly optimized ReaxFF, using the LAMMPS code.33 Initial structures started with the DFT minimum energy structures for the cubic cell of Li2S, as described above for both the Frenkel defects and for vacancies. From these starting points, we built 3 × 3 × 3 supercell structures, including a lithium vacancy for systems containing 324 atoms and 4 × 4 × 4 supercells containing 768 atoms for systems containing Frenkel defects. The diffusion of Li and sulfur atoms was investigated using molecular dynamics. MD simulations were performed with the following steps:
Minimization using ReaxFF;
Simulations at constant volume with a thermostat for 10 ps at 10 K to generate initial velocities for atoms;
Heating the structure from 10 K to T = 300 K using NVT for 100 ps;
Additional MD simulations at 500, 600, 700, and 800 K for 1 ns;
NVT molecular dynamics simulations for production at 300 K, applying the Nose–Hoover thermostat. The same for all other temperatures 500, 600, 700, and 800 K for 1 ns.
From the Nernst–Einstein diffusion equation, we can obtain the diffusion coefficient (D) from the mean square displacement (log MSD) versus time (log t) at various temperatures
| 7 |
where MSD indicates the average change for each ΔR2 for Δ(t) averaged over the whole trajectory. In the limit of Fickian-régime, we recover the D coefficient from the slope of log MSD vs log t.
We also computed the self-diffusion D coefficient by applying an electric field E to evaluate the mobility μ after attaining a constant velocity v = μE. We then obtained the diffusion coefficient D from the eq 8
| 8 |
where q is the charge averaged over all Li atoms during the 1 ns trajectories, and kB is the Boltzmann constant. Then, we compute the ion conductivity (σ) from eq 9
| 9 |
where c is the concentration of vacancies (cm–3 of Li-ion), and q (Coulomb) is the charge for Li averaged over all Li-ion in the system and between the first and last frame of trajectory.34,35
The activation energy Ea was calculated from the Arrhenius equation for conductivity
| 10 |
We applied an electric field E along the x, y, and z directions with various fields. We report the averaged diffusion coefficient. This method for determining Ea and the autodiffusion coefficient will be indicated hereafter as Method 1 or M1.
The activation energy Ea for the Li diffusion in both vacancy and interstitial mechanisms was also evaluated by structural analysis (Method 2, M2 hereafter) by considering the displacement of Li ions and the consequent change of coordination at sulfur atoms. The number of diffusion events in units of time (s–1) provides the velocity of migration at different temperatures along the molecular dynamics trajectory. The velocity is a function of temperature according to the following Arrhenius equation
| 11 |
where the ratio between the number of events of vacancy migration in seconds is on the log scale versus the inverse of temperature. The slope of the log plot gives the Ea/kB factor for Li diffusion.
Results and Discussion
Training Set: DFT and ReaxFF Predictions
The total energy for vacancy formation defined in eqs 1–3 for various levels of DFT and our ReaxFF is reported in Table 1. The various functionals lead to similar results, and the Lichanot basis set appears large enough to provide reliable thermodynamical results. For the Li vacancy case, we use an atomic reference state (according to eq 1), while for S, we use the crystal in the orthorhombic Pmn21 space group (according to eq 2). We see that the predictions from our customized ReaxFF are in good agreement with QM. Similarly, the prediction for an ionic behavior between the ionic species Li+ and LiS– with distance r matches well the DFT data shown in Table 1 for a system with ions interacting at a distance of 4.0 Å.
We underline the high accuracy of the present ReaxFF parametrization: the error in the PBE0BS2 DFT database is below 0.1 eV for the formation energy of both Li and S vacancies and for the dissociation of the Li2S molecule in the gas phase, achieving chemical accuracy for quantities on the order of several eV. Only the formation energy of the trivacancy is somewhat underestimated. The optimized ReaxFF was based on systems with various types of defects and was adopted for NVT molecular dynamics on systems with different types and concentrations of defects at a range of temperatures.
We also built models with cation Frenkel defects where an intersticial Li+ ion is present together with a “far away” vacancy to guarantee the neutrality of the systems (Frenkel VLi– Li+ pairs). In addition, we considered neutral vacancies in bulk Li2S.
To investigate vacancy diffusion, we considered three vacancy densities 1%, 2%, and 3% to determine Ea for Li+ ion diffusion by structural analysis according to method M1. To obtain results that are independent from a specific configuration of defects, the number of events per time unit has been averaged over three different configurations of defects to obtain the Ea value. The data come from 1 ns molecular dynamics run at 300, 400, 500, 600, 700, and 800 K. Unfortunately, the number of events at the lowest concentration of defects (1%) is so low that the predicted conductivity is less reliable. Instead, we use Ea from the higher concentrations to estimate the 300 K conductivity.
In no case are diffusion phenomena observed at 300 K; the first events are visible in NVT molecular dynamics performed at 600 K. This already provides an indication of a quite high barrier to Li diffusion. The diffusion of Li through the vacancy mechanism follows the path −8c–8c–8c– sites. The structure of a 2 × 2 × 2 supercell (96 atoms) of the conventional cubic bulk cell in the Fm3̅m symmetry group is reported in Figure 1 of Supporting Information, together with the identification of sites in Figure 2 of the same file.
The log plots of Li-ion diffusion vs 1/T (K) in the case of Li2S systems containing 3% of Li vacancies are reported in Figure 1; the open circle represents the outcome of simulations, and the straight line is the interpolating first-order polynomial. The predicted energy barrier for the hopping of a Li to a vacant Li site is Evaca = 0.201 eV. This prediction can be compared to the DFT counterpart,36 as discussed below.
Figure 1.

Log plots of Li-ion diffusion vs 1/T (K) for Li2S systems containing 3% of Li vacancies; the open circle represents the outcome of simulations; the straight line is the interpolating first order polynomial.
We also performed MD simulations at 600, 700, and 800 K in selected cases for 20 ns. The outcomes for Ea are in line with previous outcomes from 1 ns NVT simulations.
We built a system containing 786 atoms with 8 Frenkel defects (i.e., Li ions in interstitial positions are associated with an equal number of vacancies). In this case, the concentration of interstitial defects Li+ ∼ 1.01% is the same density of holes, representing its negative defect. NVT dynamics were carried out for 1 ns in the same temperature range of 300–800 K adopted for vacancy defects. The analysis of trajectories allowed us to identify the diffusion mechanism via the so-called knock-on mechanism, where an interstitial Li ion (in the octahedral site) kicks a Li sitting on a regular lattice site to an interstitial sit and so until the vacancy is annihilated; the diffusion of Li in our trajectories occurs along the path −8c–4b–8c– sites. Similarly to what we did for the vacancy diffusion mechanism, we obtained the Einterstitiala value for the diffusion process from the Arrhenius plot by running 1 ns molecular dynamics simulations at 300, 400, 500, 600, 700, and 800 K. The plot of interest is reported in Figure 3. We obtained that Einterstitiala is equal to 0.459 eV.
Figure 3.

Log plots of Li-ion diffusion vs 1/T (K) for the knock-on mechanism in the case of Li2S systems containing ∼1.01% of Li interstitial defects. The open circles represent the outcome of simulations; the straight line is the interpolating first-order polynomial.
Therefore, we can use the conventional cation vacancy model to interpret the conductivity of lithium sulfide and the collinear type of interstitial mechanism. Li-ion diffusion trajectories over a 1 ns simulation are shown in Figure 2a,b, respectively, for each mechanism.
Figure 2.

(a) Li-ion trajectories for Li2S with 3% of Li vacancies at 600 K for 1 ns RMD; the Li-ion jumps to a hole site are highlighted by red circles; (b) diffusion path for the knock-on mechanism identified in Li2S with Frenkel defects (2% of Frenkel pairs) at 600 K for 1 ns run.
Comparing the diffusion barriers for both mechanisms, we infer that ionic conductivity in Li2S may occur via the migration of both interstitial Frenkel Li+ pairs and vacancies, but the migration through vacancies is favored.
The Effect of Defect Density on Diffusion Coefficients and Activation Energy
AIMD simulations for 40 ps were reported previously for Li2S with a single Li vacancy out of 32 unit formulas at temperatures from T = 300 to 1300 K. Unfortunately, the MD needs to be > 1 ns to obtain reliable diffusion coefficients. In contrast, using ReaxFF, we were able to do MD up to 1 ns to determine the effect of defect density on the self-diffusion coefficient (D). This leads to the activation barrier Ea, mobility μ, and conductivity σ for vacancy concentrations of 0.3%, 2%, and 3%. The 0.3% model, which contained one vacancy for every 324 atoms, will be adopted as the case for very low defect density. Under the application of a static force F = q × E to each particle, we determined the displacement of each Li ion along the 1 ns trajectory for all defect-containing systems. The velocity was determined as an average over the displacements along all three Cartesian directions for the cubic symmetry Li2S. Reactive molecular dynamics (RMD) were carried out for 1 ns at various temperatures in the range 600–900 K. Depending on the concentration of defects in the system, we obtained a constant velocity of particles at various values of the applied electric field. Field strengths of 0.01 and a “weak” 0.0005 V/Å were applied to 2% and 3% vacancies in Li2S to obtain a constant velocity of Li+ ion migration. Stronger fields, of strength 0.03 V/Å, were applied in the case of 0.3% Li vacancy concentration to observe diffusion phenomena at the nanosecond time scale.
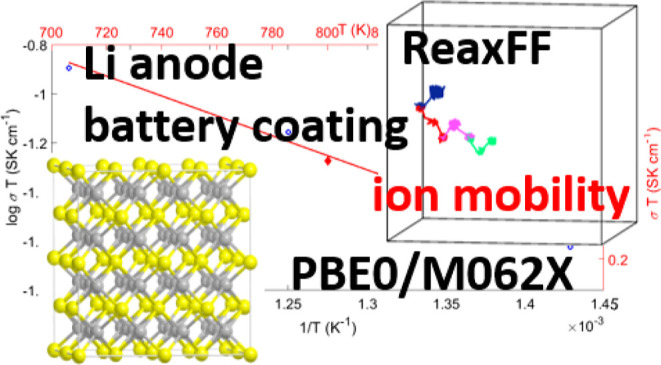
The plots of log σT vs 1/T and the plot of σT vs T are reported in Figure 4a–c for the Li vacancy cases; while Figure 4d reports the conductivity for interstitial defects.
Figure 4.

(a) Log plot of conductivity of Li-ion (the right axis) vs 1/T (K) (bottom axis) and conductivity (σT left axis) vs T (top axis) for a model of Li2S containing a vacancy at a very low dilution of ∼0.3%. The applied field is 0.03 V/Å. The open circles represent the (log σT points); the straight line is the interpolating first-order polynomial, whereas the diamonds represent the conductivity (σT) outcomes of simulations. (b) Log plot of conductivity of Li-ion (the right axis) vs 1/T (K) (bottom axis) and conductivity (σT left axis) vs T (top axis) for a model of Li2S containing 2% vacancy. The applied electric field is 0.01 V/Å. (c) Log plot of conductivity of Li-ion (the right axis) vs 1/T (K) (bottom axis) and conductivity (σT left axis) vs T (top axis) for a model of Li2S containing vacancies with a density of 3%. The applied field is 0.0005 V/Å. (d) Log plot of conductivity of Li-ion (the right axis) vs 1/T (K) (bottom axis) and conductivity (σT left axis) vs T (top axis) for a model of Li2S with a density of 1% interstitial Li+ ion or 2% of Frenkel pairs, as described in the text. The applied electric field is 0.01 V/Å.
The energy barrier Evaca for each vacancy density was derived from eq 10 leading to Evaca = 0.268 eV for 0.3% defect density and Evaca = 0.270 eV for 2% vacant Li sites. The result at low vacancy density indicates that the electric field has little effect on the barrier. For a higher vacancy density (3%), our Method 1 predicts a lower activation barrier of Evaca = 0.200 eV, which interestingly points to cooperative phenomena from vacancy–vacancy interactions. These results agree with the previous predictions of Evaca = 0.201 eV from the structural analysis of vacancy-rich Li2S models (crystals with 3% defects).
The predicted Li ion diffusivity and conductivity determined according to eqs 8 and 9 are reported in Table 2 at 700 K for each defective system, together with the activation energies for diffusion according to eq 10; the value for σT extrapolated to 300 K is 9.652 × 10⁻⁸ S K cm–1 for 0.3% defect density, as reported in the last column of Table 2, together with the values for various defect densities.
Table 2. Li-Ion Diffusivity (D) and Conductivity (σ) Per Formula Predicted From Our MD Simulations for 1 ns at 700 K and Extrapolated to 300 Ka.
| Li2S | D | σ | Ea(M1) | Ea(M2) | σT300 K |
|---|---|---|---|---|---|
| 0.3% Livac | 3.40 × 10⁻⁸ | 5.614 × 10⁻⁸ | 0.268 | 9.652 × 10⁻⁸ | |
| 2% Livac | 8.83 × 10⁻⁷ | 3.008 × 10⁻⁶ | 0.270 | 5.927 × 10⁻⁶ | |
| 3% Livac | 5.43 × 10⁻⁵ | 2.814 × 10⁻⁴ | 0.199 | 0.201 | 2.400 × 10⁻³ |
| 1% interst. | 3.49 × 10⁻⁹ | 2.651 × 10⁻⁹ | 0.348 | 0.459 | 1.659 × 10⁻⁹ |
| 2% Frenkel pair | 6.45 × 10⁻⁶ | 9.924 × 10⁻⁶ | 0.215 | 2.628 × 10⁻⁵ |
D is reported in (cm2 s–1), σ in (S cm–1), and Ea in eV.
For the interstitial mechanism (Frenkel V–Li Li+ pairs), the diffusion coefficient D = 3.49 × 10⁻⁹ cm2 s–1 at 700 K from application of an electric field of 0.01 V/Å, as reported in Table 2, with 1% Li+ and D = 6.45 × 10⁻⁶ (cm2 s–1) with 2% total density of defects, where we also consider the vacancies Livac. when the Frenkel pair is considered. This is consistent with the higher activation barrier we predict for the interstitial mechanism compared to the vacancy-hopping mechanism. For the Frenkel pair defects, both vacancy diffusion and interstitial migration may occur, but the vacancy diffusion will be faster since the diffusion of Frenkel defects happens via holes.
Considering only the vacancy mechanism for 2% Livac, we predict D = 8.83 × 10⁻⁷ cm2 s–1 using method M1. In the case of Frenkel VLi– Li+ pairs, the contribution from hopping, D = 6.45 × 10⁻⁶ (cm2 s–1), is larger than the D = 8.83 × 10⁻⁷ cm2 s–1) vacancy hopping with the same 2% Livac density of defects. This can be justified by the interaction of hole defects and interstitial defects that favor increased mobility. The NEB and AIMD lead to a diffusion activation barrier of Evaca = 0.2 eV for a single vacancy, which is in very good agreement with our ReaxFF predictions despite the very short AIMD.36,37 The paper titled “Theoretical study of superionic phase transition in Li2S″ published in Scientific Reports37 also reports 50 ps AIMD at temperatures T = 300, 600, 750, 830, 900, 1050, 1170, and 1300 K on the Li2S system in a small 2 × 2 × 2 supercell. Even if the latter paper aims at modeling a superionic phase transition above 900 K, the authors declared that “only a few number of Li vacancy hoppings were observed for T = 300, 600, and 750 K”; moreover, it is found that Li transport occurs mainly via Li vacancy hopping between regular Li sites (so-called 8c sites) at low temperatures such as T = 830 K. At higher temperatures, anharmonic elongation in Li ion positions appears. Although Li transport still takes place mainly via Li vacancy hopping between 8c sites, there are few Li jumps between 8c and interstitial defective sites (so-called 4b sites) at T = 900 K”. The paper clearly identifies the two mechanisms we report in our manuscript: hole-hopping (vacancy diffusion) at lower temperatures and interstitial diffusion (“Li jumps between 8c and interstitial defective sites 4b”), and the latter diffusion became obviously visible at higher temperatures. From the Arrhenius plot of the diffusion coefficient reported in the paper of Kaghazchi et al. (ln D vs 1/kBT), we recovered at 830 K (the lowest temperature datum the authors reported) D ∼ 3.2076 × 10⁻⁶ cm2/s, which can be compared with our value of 1.2316 × 10⁻⁶ cm2/s at 800 K for 2% vacancy density. If we consider that the concentration of vacancies in that paper “vac & dis” as charge carriers are both Li vacancy and disorder (interstitial Li) is about 2% (2/96, 96 is the number of atoms in a supercell 2 × 2 × 2) and that at “low temperature” the largest part of diffusion occurs via vacancy as the authors claim, we can assume that our results are in the same ballpark as AIMD. The tiny discrepancies between AIMD and RMD can be interpreted in terms of both the dimensions of the adopted models and the employment of the GGA (PBE) functional in the case of AIMD toward our ReaxFF, which we parametrized against a DFT approach using a hybrid exchange–correlation functional, which is recognized to be much more accurate than any gradient-corrected xc-functional.
We predict a strong dependence of diffusion coefficients upon the vacancy density, with Evaca decreasing dramatically from 2% to 3% up to Evaca = 0.2 eV in the latter case, corresponding to an intrinsic conductivity σT = 10–3 S K cm–1 at 300 K.
Experimental values for ionic conductivity σT (at 298 K) of Li2S38,39 are spread over a huge range from σT = 10–5 to 10–10 (S K cm–1) depending on sample preparation. The Li+ conductivity in films depends on the sputtering technique, the temperature of annealing, grain size, and the deposition parameters that affect the morphology of the sample.40 The change in the diffusion activation energy upon annealing can be attributed to a change in mechanism from dislocation-driven to grain-boundary-driven conduction and/or a space charge effect with a changing segregation energy. Experiments identify a range of 10–10–3 × 10⁻⁸ S cm–1 for conductivity in film of Li2S at 298 K.41 We predict the self-diffusion coefficient reported in Table 2 at 700 K for various defect concentrations, including vacancies and Frenkel pair defects. The same has been done for temperatures in the range 600–900 K. The values have also been extrapolated at 300 K to compare the simulation results to values obtained in battery operation conditions. Since the experimental conductivity is the product of intrinsic diffusion coefficients times the number of carriers, thus assuming grain boundaries as the most common defects, we estimated the grain size, concluding that the samples in refs (38) and (39) had a grain size of the order of tens of nm, whereas the samples in ref (41) had a grain size of the order of hundreds of microns. This leads to an estimate of semiquantitative agreement between our predictions and the experiment.
Up to
this point, we considered only the barrier for defect migration,
but before comparing the predicted conductivity to the experiment,
we recall that high conductivity can arise from both lower defect
formation energies and lower cation migration energies. Of course,
to estimate the total activation energy of diffusion for the vacancy
and interstitial Li+ mechanisms, we must consider both
the formation and migration processes of defects. Based on ReaxFF,
the formation energy is 2.33 eV for the Frenkel defect in Li2S bulk  compared
with
compared
with  = 5.943 eV for Li vacancy formation
(reported
in Table 1). The total
activation energy of diffusion for vacancy and interstitial Li+ diffusion mechanisms is predicted to be Evacall =
= 5.943 eV for Li vacancy formation
(reported
in Table 1). The total
activation energy of diffusion for vacancy and interstitial Li+ diffusion mechanisms is predicted to be Evacall =  + Evaca ∼ 6.144
eV, which can
be compared with Eintersticialall = Eintersticiala + 1/2
+ Evaca ∼ 6.144
eV, which can
be compared with Eintersticialall = Eintersticiala + 1/2 ∼
1.624 eV. Therefore, even if the
barrier for self-diffusion is lower for an isolated vacancy, the global
cost of the migration process in Li2S bulk via the two
investigated mechanisms seems to be favorable for Frenkel interstitial
migration. But the conductivity process may be dominated by grain
boundaries, where the largest fraction of defects reside. In that
case, the formation energy of defects and vacancies is surely lower.
In the research on superionic conductors, the challenge to attaining
a very high intrinsic conductivity in the material is identifying
new materials where the formation energy of defects is also reasonably
in bulk.42 We also analyzed the MSD of
Li+ to determine the self-diffusion coefficients according
to eq 7, with results
confirming the values determined from the application of the static
electric field, F = q × E. The analysis of MSD for sulfur ions reveals that no significant
anion diffusion is observed at 300 K and higher temperatures or as
a function of the electric field strength.
∼
1.624 eV. Therefore, even if the
barrier for self-diffusion is lower for an isolated vacancy, the global
cost of the migration process in Li2S bulk via the two
investigated mechanisms seems to be favorable for Frenkel interstitial
migration. But the conductivity process may be dominated by grain
boundaries, where the largest fraction of defects reside. In that
case, the formation energy of defects and vacancies is surely lower.
In the research on superionic conductors, the challenge to attaining
a very high intrinsic conductivity in the material is identifying
new materials where the formation energy of defects is also reasonably
in bulk.42 We also analyzed the MSD of
Li+ to determine the self-diffusion coefficients according
to eq 7, with results
confirming the values determined from the application of the static
electric field, F = q × E. The analysis of MSD for sulfur ions reveals that no significant
anion diffusion is observed at 300 K and higher temperatures or as
a function of the electric field strength.
Conclusions
In this work, we optimized ReaxFF to simulate both pristine bulk and defective Li2S systems containing both Li-ion vacancies and Frenkel pair defects. The new ReaxFF was validated against QM on model systems. It reproduces well
the equation of state for Li2S,
the cost for formation of Li vacancy, sulfur vacancy, and Li2S trivacancy.
We considered two Li+ diffusion mechanisms: vacancy and interstitial at various defect densities. We predicted the self-diffusion coefficient and conductivity with a reactive molecular dynamics simulation of up to 20 ns, both with and without applied electric field gradients. We predict the activation energy for Li-ion migration via the vacancy mechanism to be Evaca = 0.20–0.27 eV. For interstitial Li-ion migration, we find a larger Einterstitiala = 0.35–0.45 eV using two methodologies: structural analysis and applied electric field (along the three orthogonal directions).
In the presence
of a Frenkel pair, we found that defect diffusion
occurs via holes. The good agreement with 50 ps DFT-based AIMD confirms
the accuracy of our new ReaxFF. However, the relative order of the
formation energy of the defects in the bulk Li2S is reversed.
Therefore, to estimate the total activation energy of bulk diffusion
for both vacancy and interstitial Li+ mechanisms, we included
both the processes of defect formation and migration to obtain Evaca =  + Evac ∼
6.144 eV, which can be compared with Eintersticiala = Eintersticial + 1/2
+ Evac ∼
6.144 eV, which can be compared with Eintersticiala = Eintersticial + 1/2 ∼
1.624 eV. However, the conductivity
process in experimental films is likely dominated by grain-boundary
defects. For grain boundaries, the formation energy for defects and
vacancies is lower, leading to higher conductivity for defective materials.
∼
1.624 eV. However, the conductivity
process in experimental films is likely dominated by grain-boundary
defects. For grain boundaries, the formation energy for defects and
vacancies is lower, leading to higher conductivity for defective materials.
We predict the diffusion coefficient D and conductivity σ in the range of 600–900 K from 1 to 2 ns molecular dynamics and extrapolated them to T300 K for systems with various defect densities. We predict a strong dependence of diffusion coefficients on the vacancy density. Evaca decreasing dramatically for very defective systems. Indeed, we show that the intrinsic conductivity of a defective system can reach values as low as Evaca = 0.2 eV, corresponding to intrinsic conductivity as high as σT = 10–3 S K cm–1. These predictions constitute relevant groundwork toward a better understanding of ionic transport in Li-ion conductors at the electrolyte/anode and electrolyte/cathode interfaces. In the present paper, we identify a useful approach that allows the community to follow a reaction in a battery system over a time scale of nanoseconds. This, we believe, is the more valuable as we parametrized our ReaxFF against a DFT approach using a hybrid exchange-correlation functional, which is recognized to be much more accurate than any gradient-corrected xc-functional. In doing so, we thus go beyond the usual DFT static or dynamic simulations reported in the literature. In this research on superionic conductors, our calculations identify as the main challenge the identification of new materials, where the defect formation energy is reasonably low while leading to a very high intrinsic conductivity in the bulk materials.
Acknowledgments
M.D. thanks: the HPC resources of CINECA, i.e., Galileo 100 for Project ISCRA C, ‘ISc92: SEILIM’ and the WAG/Caltech computational resources. W.A.G. thanks Hong Kong Quantum AI Lab, AIR@In-noHK, Hong Kong Government, for financial support for this research. The financial support provided by the European Union Horizon 2020 SUBLIME Grant Agreement ID: 875028 is gratefully acknowledged.
Supporting Information Available
The Supporting Information is available free of charge at https://pubs.acs.org/doi/10.1021/acs.jpcc.3c04991.
ReaxFF force field optimized for Li/Li2S systems and adopted in all calculations reported in the present manuscript; 2 × 2 × 2 supercell (96 atoms) of the conventional cubic bulk cell in the Fm3̅m symmetry group; and sites 4b and 8c in 2 × 2 × 2 supercell of the conventional cubic bulk cell in the Fm3̅m symmetry group (PDF)
Folder containing input files (ZIP)
The authors declare no competing financial interest.
Supplementary Material
References
- Hagen M.; Yan J.; Cao W.; Chen X.; Shellikeri A.; Du T.; Read J.; Jow T.; Zheng J. Hybrid lithium-ion battery-capacitor energy storage device with hybrid composite cathode based on activated carbon/LiNi0.5Co0.2Mn0.3O2. J. Power Sources 2019, 433, 126689. 10.1016/j.jpowsour.2019.05.095. [DOI] [Google Scholar]
- Choi H. S.; Park C. R. Theoretical guidelines to designing high performance energy storage device based on hybridization of lithium-ion battery and supercapacitor. J. Power Sources 2014, 259, 1–14. 10.1016/j.jpowsour.2014.02.001. [DOI] [Google Scholar]
- Etacheri V.; Marom R.; Elazari R.; Salitra G.; Aurbach D. Challenges in the development of advanced Li-ion batteries: a review. Energy Environ. Sci. 2011, 4, 3243–3262. 10.1039/c1ee01598b. [DOI] [Google Scholar]
- Scrosati B.; Garche J. Lithium batteries: Status, prospects and future. J. Power Sources 2010, 195, 2419–2430. 10.1016/j.jpowsour.2009.11.048. [DOI] [Google Scholar]
- Lin D.; Liu Y.; Cui Y. Reviving the lithium metal anode for high-energy batteries. Nat. Nanotechnol. 2017, 12, 194–206. 10.1038/nnano.2017.16. [DOI] [PubMed] [Google Scholar]
- Albertus P.; Babinec S.; Litzelman S.; Newman A. Status and challenges in enabling the lithium metal electrode for high-energy and low-cost rechargeable batteries. Nat. Energy 2017, 3, 16–21. 10.1038/s41560-017-0047-2. [DOI] [Google Scholar]
- Kanno R.; Murayama M. Lithium ionic conductor thio-LISICON: The Li2S-GeS2-P2S5 system. J. Electrochem. Soc. 2001, 148, A742. 10.1149/1.1379028. [DOI] [Google Scholar]
- Yamane H.; Shibata M.; Shimane Y.; Junke T.; Seino Y.; Adams S.; Minami K.; Hayashi A.; Tatsumisago M. Crystal structure of a superionic conductor, Li7P3S11. Solid State Ionics 2007, 178, 1163–1167. 10.1016/j.ssi.2007.05.020. [DOI] [Google Scholar]
- Seino Y.; Ota T.; Takada K.; Hayashi A.; Tatsumisago M. A sulphide lithium super ion conductor is superior to liquid ion conductors for use in rechargeable batteries. Energy Environ. Sci. 2014, 7, 627–631. 10.1039/C3EE41655K. [DOI] [Google Scholar]
- Kamaya N.; Homma K.; Yamakawa Y.; Hirayama M.; Kanno R.; Yonemura M.; Kamiyama T.; Kato Y.; Hama S.; Kawamoto K.; et al. A lithium superionic conductor. Nat. Mater. 2011, 10, 682–686. 10.1038/nmat3066. [DOI] [PubMed] [Google Scholar]
- Kuhn A.; Duppel V.; Lotsch B. V. Tetragonal Li10GeP2S12 and Li7GePS8-exploring the Li ion dynamics in LGPS Li electrolytes. Energy Environ. Sci. 2013, 6, 3548–3552. 10.1039/c3ee41728j. [DOI] [Google Scholar]
- Deiseroth H.-J.; Kong S.-T.; Eckert H.; Vannahme J.; Reiner C.; Zaiß T.; Schlosser M. Li6PS5X: A Class of Crystalline Li-Rich Solids With an Unusually High Li+ Mobility. Angew. Chem., Int. Ed. 2008, 47, 755–758. 10.1002/anie.200703900. [DOI] [PubMed] [Google Scholar]
- Rao R. P.; Sharma N.; Peterson V.; Adams S. Formation and conductivity studies of lithium argyrodite solid electrolytes using in-situ neutron diffraction. Solid State Ionics 2013, 230, 72–76. 10.1016/j.ssi.2012.09.014. [DOI] [Google Scholar]
- Chen H. M.; Maohua C.; Adams S. Stability and ionic mobility in argyrodite-related lithium-ion solid electrolytes. Phys. Chem. Chem. Phys. 2015, 17, 16494–16506. 10.1039/C5CP01841B. [DOI] [PubMed] [Google Scholar]
- Wang D.-W.; Zeng Q.; Zhou G.; Yin L.; Li F.; Cheng H.-M.; Gentle I. R.; Lu G. Q. M. Carbon–sulfur composites for Li–S batteries: status and prospects. J. Mater. Chem. A 2013, 1, 9382–9394. 10.1039/c3ta11045a. [DOI] [Google Scholar]
- D’Amore M.; Daga L. E.; Rocca R.; Sgroi M. F.; Marana N. L.; Casassa S. M.; Maschio L.; Ferrari A. M. From symmetry breaking in the bulk to phase transitions at the surface: a quantum-mechanical exploration of Li6PS5Cl argyrodite superionic conductor. Phys. Chem. Chem. Phys. 2022, 24, 22978–22986. 10.1039/D2CP03599E. [DOI] [PubMed] [Google Scholar]
- Mo Y.; Ong S. P.; Ceder G. First Principles Study of the Li10GeP2S12 Lithium Super Ionic Conductor Material. Chem. Mater. 2012, 24, 15–17. 10.1021/cm203303y. [DOI] [Google Scholar]
- Zhang Y.; Zhao Y.; Chen C. Ab initio study of the stabilities of and mechanism of superionic transport in lithium-rich antiperovskites. Phys. Rev. B 2013, 87, 134303. 10.1103/PhysRevB.87.134303. [DOI] [Google Scholar]
- Cazorla C.; Sagotra A. K.; King M.; Errandonea D. High-Pressure Phase Diagram and Superionicity of Alkaline Earth Metal Difluorides. J. Phys. Chem. C 2018, 122, 1267–1279. 10.1021/acs.jpcc.7b10975. [DOI] [Google Scholar]
- Merinov B. V.; Zybin S. V.; Naserifar S.; Morozov S.; Oppenheim J.; Goddard W. A. I.; Lee J.; Lee J. H.; Han H. E.; Choi Y. C.; et al. Interface Structure in Li-Metal/[Pyr14] [TFSI]-Ionic Liquid System from ab Initio Molecular Dynamics Simulations. J. Phys. Chem. Lett. 2019, 10, 4577–4586. 10.1021/acs.jpclett.9b01515. [DOI] [PubMed] [Google Scholar]
- Wang A.; Kadam S.; Li H.; Shi S.; Qi Y. Review on modeling of the anode solid electrolyte interphase (SEI) for lithium-ion batteries. npj Comput. Mater. 2018, 4, 15. 10.1038/s41524-018-0064-0. [DOI] [Google Scholar]
- van Duin A. C. T.; Dasgupta S.; Lorant F.; Goddard W. A. ReaxFF A Reactive Force Field for Hydrocarbons. J. Phys. Chem. A 2001, 105, 9396–9409. 10.1021/jp004368u. [DOI] [Google Scholar]
- Chenoweth K.; van Duin A. C. T.; Goddard W. A. ReaxFF Reactive Force Field for Molecular Dynamics Simulations of Hydrocarbon Oxidation. J. Phys. Chem. A 2008, 112, 1040–1053. 10.1021/jp709896w. [DOI] [PubMed] [Google Scholar]
- Rappe A. K.; Goddard W. A. I. Charge equilibration for molecular dynamics simulations. J. Phys. Chem. 1991, 95, 3358–3363. 10.1021/j100161a070. [DOI] [Google Scholar]
- van Duin A. C. T.; Baas J. M. A.; van de Graaf B. Delft molecular mechanics: a new approach to hydrocarbon force fields. Inclusion of a geometry-dependent charge calculation. J. Chem. Soc., Faraday Trans. 1994, 90, 2881–2895. 10.1039/ft9949002881. [DOI] [Google Scholar]
- Boys S.; Bernardi F. The calculation of small molecular interactions by the differences of separate total energies. Some procedures with reduced errors. Mol. Phys. 1970, 19, 553–566. 10.1080/00268977000101561. [DOI] [Google Scholar]
- Dovesi R.; Erba A.; Orlando R.; Zicovich-Wilson C. M.; Civalleri B.; Maschio L.; Rérat M.; Casassa S.; Baima J.; Salustro S.; et al. Quantum-Mechanical Condensed Matter Simulations with CRYSTAL WIREs. Comput. Mol. Biosci. 2018, 8, e1360 10.1002/wcms.1360. [DOI] [Google Scholar]
- Dovesi R.; Pascale F.; Civalleri B.; Doll K.; Harrison N. M.; Bush I.; D’Arco P.; Noël Y.; Rérat M.; Carbonnière P.; et al. The CRYSTAL code, 1976–2020 and beyond, a long story. J. Chem. Phys. 2020, 152, 204111. 10.1063/5.0004892. [DOI] [PubMed] [Google Scholar]
- Lichanot A.; Aprà E.; Dovesi R. Quantum Mechnical Hartree-Fock Study of the Elastic Properties of Li2S and Na2S. Phys. Status Solidi B 1993, 177, 157–163. 10.1002/pssb.2221770111. [DOI] [Google Scholar]
- Schäfer A.; Huber C.; Ahlrichs R. Fully optimized contracted Gaussian-basis sets of triple zeta valence quality for atoms Li to Kr. J. Chem. Phys. 1994, 100, 5829–5835. 10.1063/1.467146. [DOI] [Google Scholar]
- Zhao Y.; Truhlar D. G. The M06 suite of density functionals for main group thermochemistry, thermochemical kinetics, noncovalent interactions, excited states, and transition elements: two new functionals and systematic testing of four M06-class functionals and 12 other functionals. Theor. Chem. Account 2008, 120, 215–241. 10.1007/s00214-007-0310-x. [DOI] [Google Scholar]
- Monkhorst H. J.; Pack J. D. Special Points for Brillouin-Zone Integrations. Phys. Rev. B 1976, 13, 5188–5192. 10.1103/PhysRevB.13.5188. [DOI] [Google Scholar]
- Plimpton S. Fast Parallel Algorithms for Short-Range Molecular Dynamics. J. Comput. Phys. 1995, 117, 1–19. 10.1006/jcph.1995.1039. [DOI] [Google Scholar]
- Kittel C.Introduction to Solid State, 8th ed.; John Wiley & Sons, 2004. [Google Scholar]
- Das T.; Nicholas J. D.; Qi Y. Composition, crystallography, and oxygen vacancy ordering impacts on the oxygen ion conductivity of lanthanum strontium ferrite. Phys. Chem. Chem. Phys. 2020, 22, 9723–9733. 10.1039/D0CP00206B. [DOI] [PubMed] [Google Scholar]
- Moradabadi A.; Kaghazchi P. Thermodynamics and kinetics of defects in Li2S. Appl. Phys. Lett. 2016, 108, 213906. 10.1063/1.4952434. [DOI] [Google Scholar]
- Jand S. P.; Zhang Q.; Kaghazchi P. Theoretical study of superionic phase transition in Li2S. Sci. Rep. 2017, 7, 5873. 10.1038/s41598-017-05775-2. [DOI] [PMC free article] [PubMed] [Google Scholar]
- Chen H.; Pei A.; Lin D.; Xie J.; Yang A.; Xu J.; Lin K.; Wang J.; Wang H.; Shi F.; Boyle D.; Cui Y. Uniform High Ionic Conducting Lithium Sulfide Protection Layer for Stable Lithium Metal Anode. Adv. Energy Mater. 2019, 9, 1900858. 10.1002/aenm.201900858. [DOI] [Google Scholar]
- Huggins R. A. In International Symposium on Solid Ionic and Ionic-Electronic Conductors; Armstrong R., Ed.; Pergamon, 1977, pp 773–781. [Google Scholar]
- Lorger S.; Fischer D.; Usiskin R.; Maier J. Sputter deposition and thermal evaporation of Li2O, Li2S, and Li2Se films. J. Vac. Sci. Technol. A 2019, 37, 061515. 10.1116/1.5123439. [DOI] [Google Scholar]
- Lorger S.; Narita K.; Usiskin R.; Maier J. Enhanced ion transport in Li2O and Li2S films. Chem. Commun. 2021, 57, 6503–6506. 10.1039/D1CC00557J. [DOI] [PubMed] [Google Scholar]
- Morozov S. I.; Merinov B. V.; Das T.; Zybin S. V.; Yang M. Y.; Goddard W. A. Quantum-mechanics-based molecular dynamics simulations of the structure and performance of sulfur-enriched Li3PS4 cathodes. Cell Rep. Phys. Sci. 2023, 4, 101326. 10.1016/j.xcrp.2023.101326. [DOI] [Google Scholar]
Associated Data
This section collects any data citations, data availability statements, or supplementary materials included in this article.