

Abstract
Microglia are the residential immune cells of central nervous system and they are crucial for brain development and homeostasis, as well as the progression of inflammatory brain diseases. To study microglia’s physiological and pathological functions, one of the most widely used models is primary microglia culture from neonatal rodents. However, primary microglia culture is time consuming and needs a great number of animals. In our microglia culture, we found a strain of spontaneously immortalized microglia that continued to divide without any known genetic intervention. We confirmed the immortalization of these cells for uninterrupted thirty passages and we named them as immortalized microglia like-1 cells (iMG-1). The iMG-1 cells kept their microglia morphology, and they expressed macrophage/microglia-specific proteins of CD11b, CD68, P2RY12, and IBA1 in vitro. iMG-1 cells were responsive to inflammatory stimulations with lipopolysaccharide (LPS) and Polyinosinic:polycytidylic acid (pIpC), triggering increased mRNA/protein levels of IL1-β, IL-6, TNF-α, and interferons. LPS and pIpC treated iMG-1 cells also significantly increased their accumulation of lipid droplets (LDs). We also generated a 3D spheroid model using immortalized neural progenitor cells and iMG-1 cells with defined percentages to study neuroinflammation. The iMG-1 cells distributed evenly in spheroids, and they regulated the basal mRNA levels of cytokines of neural progenitors in 3D spheroid. iMG-1 cells were responsive to LPS by increased expression of IL-6 and IL1-β in spheroids. Together, this study indicated the reliability of iMG-1 which could be readily available to study the physiological and pathological functions of microglia.
Keywords: Microglia, Immortalization, Neuroinflammation, LPS, pIpC, Spheroids, Coculture
Introduction
Microglia are the myeloid cells of the central nervous system (CNS) [1–4]. They are involved in brain development by responding to local changes in the microenvironment such as phagocytosis of dead cells, pruning synapses, modulation of neurogenesis, regulating synapse plasticity and myelin formation, and providing key functions for homoeostasis in the CNS [5]. As resident macrophages, microglia respond to disruptions caused by inflammation, injuries, and aging [6]. These responses, often termed as “activation,” are defined as any physical or biochemical changes of the microglial homeostatic state and include proliferation, migration to the sites of pathology, phagocytosis of debris and cells, and secretion of the cytokines and chemokines necessary to stimulate microglia and other types of brain cells [7, 8]. In brain diseases, microglia undergo extensive morphological, molecular, and functional changes, which establish new biological states relevant to the disease pathogenesis and progression [9].
Microglia have critical functions in brain infection, neuroinflammatory disorders, and neurodegenerative diseases [10]. To reveal the functions of microglia in neuroinflammation and brain diseases, methods for primary microglia culture were established to generate dissociated single cells from rodents, non-human primates, and humans [11]. Using rodent primary microglia provides a genetic homogenous and specific pathogen free population whose antemortem conditions and post-mortem delay can be tightly controlled [11]. Nevertheless, primary microglia culture is relatively expensive, time consuming, requiring essential skills and costs lots of animals for sufficient number of cells. The populations may not be completely homogeneous for microglia culture because astrocytes or oligodendrocytes may persist in the primary culture. Moreover, except for those from transgenic mice, the genetic manipulation of primary microglia is difficult to achieve substantial efficiency. To overcome the difficulties using primary microglia, over the past three decades, people immortalized rodent (BV2 [12] and N9 [13]) and human microglia (HMO6) [14] with retrovirus. There are several other rodent microglia cell lines (e.g., SIM-A9 cells [15], EOC cells [16], and HAPI cells [17]) from spontaneous immortalization. These microglia cell lines preserve basic characters of microglia and tend to be homogeneous models for experimentations [18]. Nevertheless, these immortalized microglia may yield different levels of responses to similar treatment conditions [18] and their availability is still limited for most researchers to perform in vitro studies. Thus, the field needs more convenient resources to study microglia in culture.
Microglia perform critical functions in both embryonic and postnatal brain development. Recent studies suggest critical roles of microglia on neural progenitor cells (NPCs) and immature neurons during development [19–23]. However, uncontrolled activation of microglia in inflammatory backgrounds decrease the functions of NPCs [24, 25]. In vitro, however, it is difficult to keep NPC characters when they are cultured in 2D. To fill this technical gap, we utilized our recently developed Ast-1 cells [26] with NPC characters to generate 3D spheroid culture. We incorporated iMG-1 cells into these spheroids and used this new coculture system to study inflammation responses from microglia in a situation that is more physiologically relevant to neural development.
Results
Spontaneously Immortalized Microglia Cell Line (iMG-1) Expressed Microglia/Macrophage-Specific Markers
We obtained an immortalized microglia cell line by chance from primary microglia shaken off in mixed cortical tissue culture of murine pup at postnatal day 1 (P1). Please see Materials and Methods for details of protocol to immortalize iMG-1 cells. By in vitro culturing for more than 2 months, these immortalized microglia regained proliferation and occupied most space in the culture dish after reseeding. We collected these cells, and we named them as immortalized MicroGlia-like 1 (designated as iMG-1) cells. The iMG-1 cells were passaged more than 30 times before we submitted our findings in this manuscript. We found that iMG-1 displayed microglia morphologies in culture under phase contrast microscope. Day 2 after seeding, we found that some iMG-1 cells were round without obvious processes and some other cells had spread out into ramified morphologies (Fig. 1A). These ramified iMG-1 cells were usually bipolar or polygonal with multiple processes or with one very long rod-like process (Fig. 1A, arrows). Some iMG-1 cells showed flattened appearances with the distal ends of the processes to form lamellipodia (Fig. 1A, arrowheads). These morphologies could still be observed in iMG-1 cells after 10 days in culture (Fig. 1A). Since these morphologies are frequently observed in primary microglia under different resting status in culture conditions [27], iMG-1 cells seemed to behave like the primary microglia in vitro.
Fig. 1.
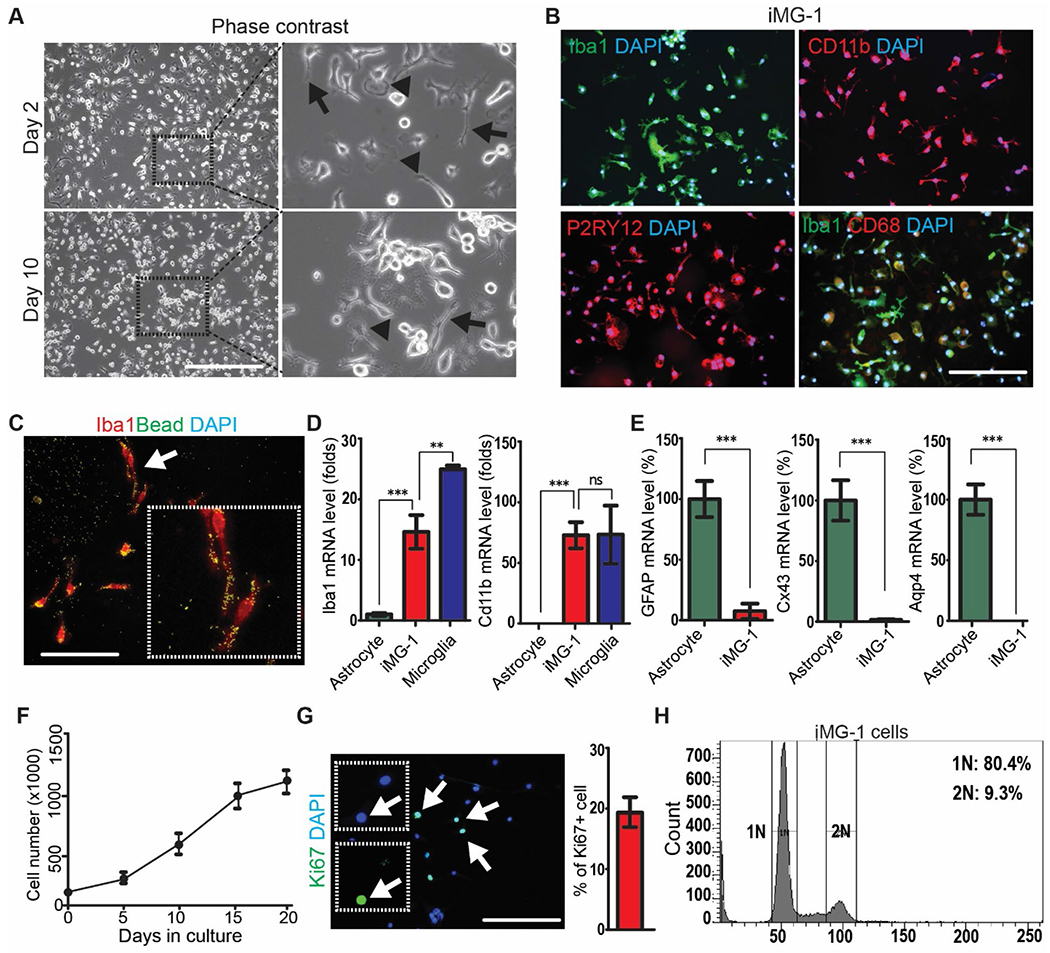
Establishment of a microglia-like iMG-1 cell line. A Representative phase contrast images of iMG-1 cells after 2 and 10 days in culture. The boxed areas were shown in detail on the right. B Immunofluorescence of IBA1, CD11B, P2RY12, CD68 and DAPI in iMG-1 cells. C Immunofluorescence of IBA1 and phagocytosed fluorescent beads in iMG-1 cells. The arrow indicated cells were enlarged to show as inset. D and E Mean ± S.E. of relative mRNA expression levels of Iba1 and Cd11b D, GFAP, Cx34 and Aqp4 E in primary astrocyte, primary microglia, and iMG-1 cells were shown. F Mean ± S.E. of cell number of iMG-1 cells for 0, 5, 10, 15, and 20 days in culture were shown. Experiments were repeated 5–6 times for each time point. G Immunofluorescence of Ki67 and DAPI in iMG-1 cells 3 days after reseeding. Mean ± S.E. of the percentage of Ki67+ iMG-1 cells were shown. H Cell cycle analysis of iMG-1 cells by FACS. Two-way anova and tukey post-hoc tests were used for statistic tests. Ns no significance, **p < 0.01, ***p < 0.001. Bar = 100 μm
Next, we examined the expression of microglia-specific markers of IBA1, CD11b, and P2RY12 in order to determine whether the iMG-1 cells had preserved microglia properties. Immunocytochemical staining showed that iMG-1 cells were strongly immunoreactive to IBA1, CD11B, and P2RY12, essentially with all cells stained (Fig. 1B). We double labeled iMG-1 cells with IBA1 and CD68 to indicate their phagocytotic activity. We found that ~ 40% of iMG-1 cells expressed CD68 and the flattened iMG-1 cells were more highlighted with CD68 staining (Fig. 1B). We also performed phagocytosis experiments by using fluorescence labelled micro-beads to incubate with iMG-1 cells [28]. Similarly, we found IBA1+ iMG-1 cells could engulf the fluorescent beads after 24 h incubation, indicating their phagocytotic activities (Fig. 1C). We carried out qPCR for microglia markers of Iba1 and Cd11b in iMG-1 cells and in primary microglia. We found that iMG-1 cells were positive for both markers with comparable level (Cd11b) or to a less extent (Iba1) as in primary microglia (Fig. 1D). As expected, the mRNA levels of Iba1 and Cd11b remained significantly lower or undetected in astrocyte samples (Fig. 1D). Moreover, our qPCR results showed that the expressions of glial fibrillary acidic protein (GFAP), connexin 43 (Cx43), aquaporin 4 (Aqp4) (Fig. 1E), or microtubule associated protein 2 (MAP2, data not show) in iMG-1 cells were significantly lower than those in astrocytes or in neurons, indicating that iMG-1 cells did not express astrocytic or neuronal markers. The iMG-1 cells were proliferative, and the doubling time was about 100 h after initial seeding (Fig. 1F). These cells reached confluency in dishes about 3 weeks after passage and their growth rate significantly decreased afterwards (Fig. 1F). The relative quiescence of iMG-1 cells is preferred in vitro as this might reveal the proliferative microgliosis upon inflammatory stimulations. We confirmed the proliferation of iMG-1 cells by Ki67 staining (Fig. 1G) and by cell cycle assay with flowcytometry (Fig. 1H). Taken together, the proliferative and subculturable iMG-1 cells exhibited a microglia phenotype consistent with their expression of microglia-specific mRNA and proteins.
Proinflammatory Response in iMG-1 Cells After Stimulation with LPS and pIpC
Microglia are the major cells involved in the innate immune response to pathogens in CNS. To examine the proinflammatory responses of iMG-1 cells, we stimulated them with 500 ng/ml LPS for 24 h. We also added 50 μg/ml pIpC to iMG-1 culture for 6 h and waited 18 h to collect samples. We found that both LPS and pIpC treatment significantly increased the number of iMG-1 cells (Fig. 2A). Interestingly, the vehicle treated iMG-1 cells were still heterogeneous in morphology with some cells exhibiting polarized shape of long processes while others spread their lamellipodia. In contrast, LPS-treated iMG-1 cells withdrew their processes and transformed into ameboid-like shape while pIpC treated microglia displayed a mixture of morphologies including bushy shape with more branched processes (Fig. 2A). These morphological changes of iMG-1 cells in response to LPS and pIpC were similar to primary microglia as in a previous report [29]. Next, we collected mRNA from LPS or pIpC treated iMG-1 cells for qPCR. We found that both molecules significantly upregulated the mRNA levels of IL-6, IL-1β, TNF-α, IFN-α, IFN-β, and IFN-γ (Fig. 2B). The M2 activation markers of Arg-1 and YM-1 in iMG-1 cells did not show significant changes after LPS treatment while pIpC increased their mRNA levels (Fig. 2C). These results indicated that iMG-1 cell transited to a M1 activation status after LPS or pIpC stimulation. We also assessed cytokine expression profiles in iMG-1 cells by flowcytometry after LPS or pIpC treatment. At the unstimulated condition, iMG-1 cells expressed basal levels of inflammatory cytokines of TNF-α and IL-6 (Fig. 2D). Treatments of LPS and pIpC for 24 h significantly increased the expression levels of both TNF-α and IL-6 (Fig. 2D). These results indicated that iMG-1 cells kept microglia characters to increase proinflammatory gene expression in response to pathogenic stimulations.
Fig. 2.

Proinflammation of iMG-1 cells in response to LPS and pIpC stimulations. A Representative phase contrast images of iMG-1 cells after treatment of vehicle, LPS and pIpC for 24 h. B and C Mean ± S.E. of relative mRNA expression levels of IL-6, TNF-α, IL-1β, IFN-α, IFN-β, and IFN-γ B, Arg-1 and YM-1 C in iMG-1 cells after vehicle, LPS, or pIpC treatment were shown. D Expression levels of TNF-α and IL-6 by FACS analysis of iMG-1 cells after treatments of vehicle, LPS, or pIpC for 24 h. Experiments were repeated 4–6 times. Ns no significance, *p < 0.05, **p < 0.01, ***p < 0.001. Bar = 50 μm
Increased Lipid Droplets (LDs) Formation in iMG-1 Cells After LPS or pIpC Treatment
Recently, the aberrant lipid metabolism in microglia was noticed in ageing, neurodegenerative diseases, and neuroinflammations in both animal models and in human subjects [30]. To test whether the lipid accumulation increased in iMG-1 cells after exposure to LPS and pIpC, we first stained LDs in these cells with BODIPY 493/503 as we did before [31]. We found that both LPS and pIpC treatment significantly increased the number of BODIPY+ iMG-1 cells and pIpC had a stronger effect to increase LDs accumulation (Fig. 3A and B). We also found that both LPS and pIpC treatment significantly increased the number of LDs in BODIPY+ iMG-1 cells (Fig. 3A and C), indicating more lipids accumulation in these inflammatory cells. Interestingly, we noticed a higher percentage of pIpC treated iMG-1 cells with more but smaller LDs than LPS treated iMG-1 cells (Fig. 3A and C). Next, we performed oil-Red-o (oRo) staining in iMG-1 cells and we got similar results as BODIPY 493/503 staining (Fig. 3D and E). Together, these results indicated that iMG-1 cells preserved their microglia metabolic characters to increase the formation of LDs in neuroinflammation conditions.
Fig. 3.
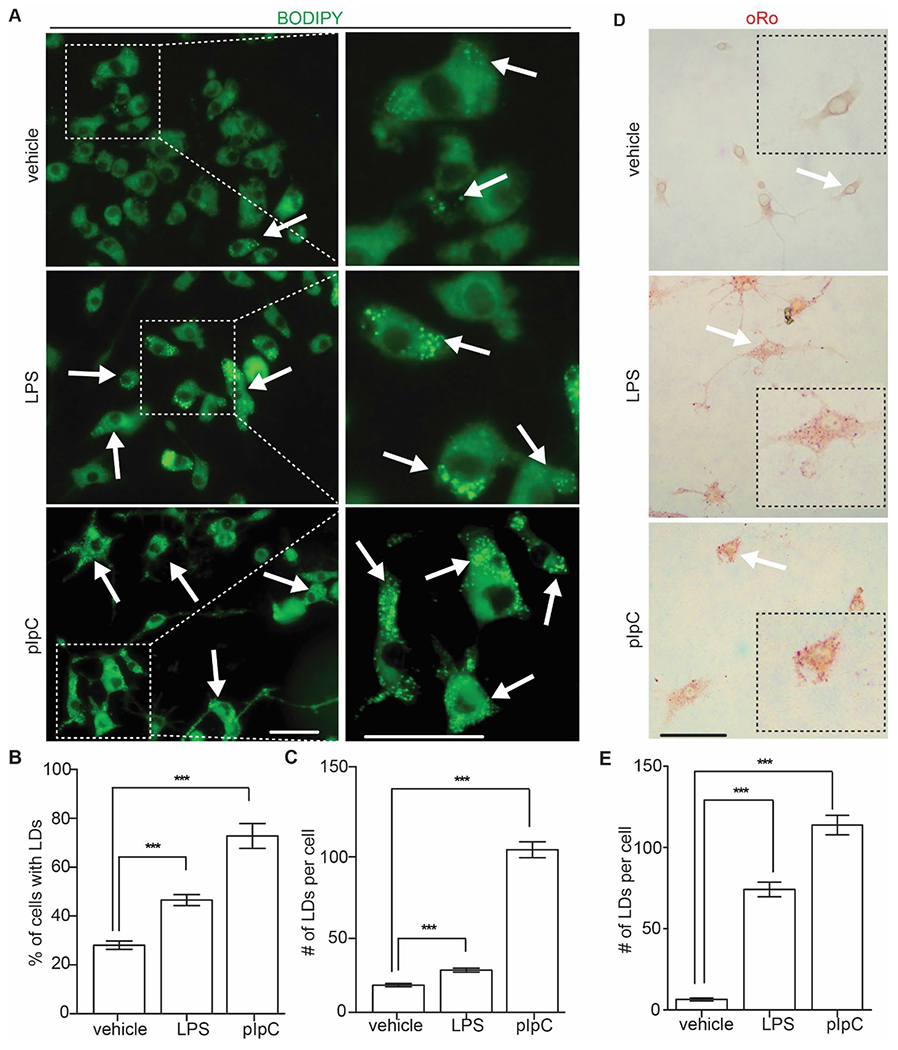
LDs accumulation in LPS and pIpC treated iMG-1 cells. A Fluorescence of LDs in iMG-1 cells after vehicle, LPS, or pIpC treatment. Arrows indicated BODIPY+ iMG-1 cells. The boxed areas were shown in detail on the right. B Mean ± S.E. of percentage of BODIPY+ iMG-1 cells after vehicle, LPS, or pIpC treatment were shown. C Mean ± S.E. of LDs number of each BODIPY+ iMG-1 cells after vehicle, LPS, or pIpC treatment were shown. D oRo staining of LDs in iMG-1 cells after vehicle, LPS, or pIpC treatment. E Mean ± S.E. of LDs number of each oRo+ iMG-1 cells after vehicle, LPS, or pIpC treatment were shown. For BODIPY staining, 709 vehicle treated cells, 785 LPS treated cells, and 417 pIpC treated cells were counted. For oRo staining, 97 vehicle treated cells, 107 LPS treated cells, and 121 pIpC treated iMG-1 cells were counted. ***p < 0.001. Bar = 10 μm
Incorporation of iMG-1 Cells in 3D-Spheroids from Immortalized Neural Progenitor Cells (NPC)
Brain spheroids are structurally and functionally relevant to brain tissues more than the conventional 2D cell culture. We adopted a new method to generate mouse brain spheroids that permits the integration of well-defined numbers and different types of neural cells. We mixed 5% iMG-1 cells with 95% immortalized mouse Ast-1 neural cells with NPC characters [26] in AggreWell plates to allow spheroids formation within 24 h (Fig. 4A). Overall, these spheroids from iMG-1 and Ast-1 cells generated fast in suspension and this method allowed generation of highly homogeneous organoids with comparable size and cell components. After 7 days in growing media, we added vehicle or LPS (500 ng/ml) to the spheroid culture for 24 h incubation and we collected the spheroids to carry out immunostaining to examine their neural markers. We did not observe deformations nor necrotic cores in these spheroid cultures (data not show). The spheroids expressed neural progenitor marker nestin which was not affected by LPS treatment (Fig. 4B). Next, we stained P2RY12 in these spheroids and we found P2RY12+ iMG-1 cells existing in both peripheral and inner regions of these neural spheroids (Fig. 4C). The LPS treatment did not significantly change the localization of iMG-1 cells within the spheroids (Fig. 4C) and the number of P2RY12+ cells in spheroids were similar between vehicle treated and LPS treated spheroids (Fig. 4D). We used qPCR to quantify the P2ry12 mRNA level in 2D iMG-1 cells and in cocultured iMG-1/Ast-1 3D spheroids. We found the relative mRNA level of P2ry12 in cocultured spheroids was 3–5% of the pure iMG-1 2D culture, confirming that ~ 3% iMG-1 cells in spheroids (Fig. 4E). Thus, the ability to generate spheroids with co-cultured NPCs and iMG-1 at defined ratios offered a valuable tool for the investigation of immune response of iMG-1 cells in a new 3D circumstance.
Fig. 4.
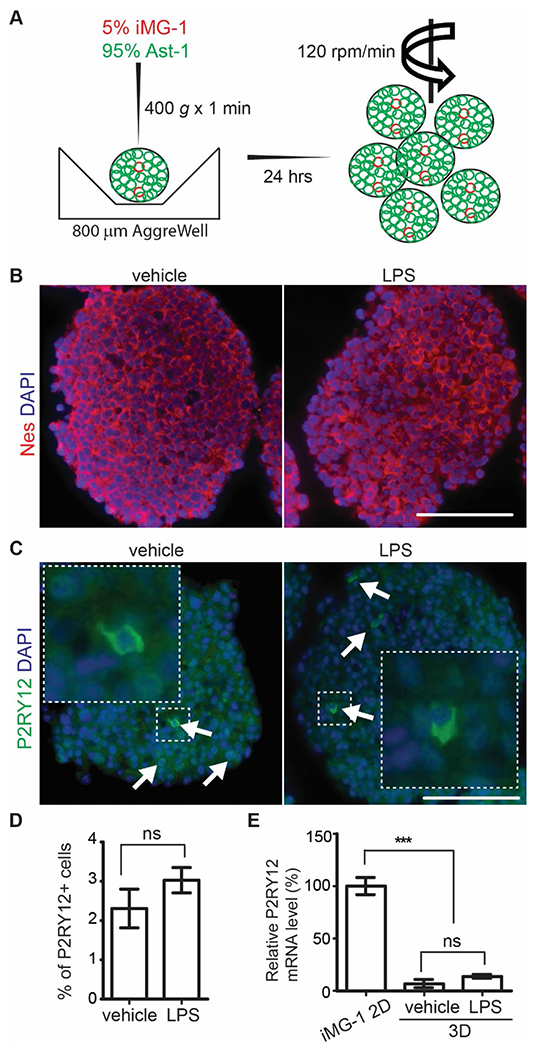
Incorporation of iMG-1 cells into 3D neural spheroid culture. A Schematic graphs of 3D spheroids generation using iMG-1 cells and Ast-1 cells. B, C Immunofluorescence of nestin and DAPI B, P2RY12 and DAPI C of iMG-1 cells in 3D spheroid coculture after vehicle or LPS treatment. Arrows in C indicated P2RY12+ iMG-1 cells in spheroid. The boxed areas were shown in detail as insets. D Mean ± S.E. of the percentage of P2RY12+ cell of cocultured spheroid cell after vehicle and LPS treatment were shown. E Mean ± S.E. of relative mRNA expression level of P2ry12 in cocultured spheroid after vehicle and LPS treatment were shown. Experiments were repeated 5–6 times. Ns no significance, ***p < 0.001. Bar = 100 μm
Neuroinflammation of in Pure and Cocultured 3D Spheroids
Inflammation in the CNS has been implicated as a key player in the pathogenesis of human neurodevelopmental disorders and neurodegenerative diseases. To examine microglia mediated neuroinflammation, we used vehicle or LPS to treat brain 3D spheroids with or without the inoculation of iMG-1 cells. We found that iMG-1 inoculation already changed the levels of cytokines in Ast-1 derived spheroids under basal levels. Addition of iMG-1 cells significantly increased the mRNA levels of IL-1β and TNF-α in 3D spheroids, but they dramatically decreased the expression of IL-6 and IFN-β under normal conditions (Fig. 5). iMG-1 spheroids also decreased the expression of IFN-α and IFN-γ without statistical difference (Fig. 5). These results suggested the immune modulation function of iMG-1 cells on NPC in 3D coculture. Treatment of LPS significantly upregulated the mRNA levels of IL-6 and IL-1β in 3D spheroids, irrespective of their inoculation of iMG-1 cells. Interestingly, the increase of IL-6 in pure Ast-1 spheroid was more obvious than that in spheroid containing iMG-1 cells. The increase of IL-1β mRNA was more prominent in spheroids cocultured with iMG-1 cells (Fig. 5). LPS increased mRNA levels of TNF-α and IFN-γ in pure Ast-1 spheroids but had no effect on spheroids cocultured with iMG-1 cells (Fig. 5). LPS did not change the mRNA levels of IFN-α and IFN-β in pure and cocultured spheroids (Fig. 5). These results from 3D coculture were different from the inflammation profile of 2D iMG-1 cells after LPS treatment, which showed a significant increase in mRNA levels of all proinflammatory cytokines examined (please see Fig. 2B and D). These results also suggested that iMG-1 cells could modulate the innate immune activity of spheroid cells and their responses to LPS triggered selective neuroinflammation in a more complicated 3D coculture system.
Fig. 5.

Altered cytokine expression by inoculating iMG-1 cells in 3D spheroid culture. Mean ± S.E. of relative mRNA expression levels of IL-1β, IL-6, TNF-α, IFN-α, IFN-β, and IFN-γ in cultured spheroids with or without iMG-1 cell inoculation after vehicle and LPS treatment were shown. Experiments were repeated 5–6 times. Ns no significance, *p < 0.05, **p < 0.01, ***p < 0.001
Discussion
The functions of microglia have been recognized as critical in diseases of neurodevelopmental disorders, neurodegenerative diseases, traumatic and ischemic brain injuries, meningitis, and brain cancers [3, 32]. Currently, primary culture from neonatal pups is still a major source for microglia to study their signaling pathways and molecular changes in vitro. Except for the retrovirus transformed microglia cell lines such as BV-2 cells and N2 cells or spontaneously immortalized SIM-A9 cells registered in ATCC [12, 15, 33], the availability of microglia cell lines without retroviral transformation is limited. Thus, it will be of great value to generate an immortalized microglia cell line with similar neuroinflammatory responses and metabolic changes to pathogenic stimulations as in primary microglia. In this study, we obtained a spontaneously immortalized microglia cell line (iMG-1) from sustained culture of mouse cortical microglia. The iMG-1 cells could be readily used for in vitro studies without extensive manipulation procedures, and they preserved microglia markers after more than 30 passages in vitro. Moreover, these cells presented typical microglial responses to neuroinflammations and they could be incorporated into a new 3D neural spheroid model.
iMG-1 cells expressed a series of microglia markers IBA1, CD11b, P2RY12, and CD68, but not astrocyte markers GFAP, Cx34, and Aqp4 (Fig. 1) or neuronal marker MAP2 (data not shown), indicating their committed microglia lineage during the spontaneous immortalization. Microglia are the first line of defense against invading pathogens to attack the brain [34] as microglia express toll-like receptors (TLRs) to regulate innate immunity and inflammation in the infected brain [35]. Microglia respond to TLR stimulation by secreting innate proinflammatory cytokines which generate a “danger signal” alert to the occurrence of invading pathogens [36]. For example, LPS produced from Gram-negative bacteria in bacterial meningitis could activate microglia through TLR4 [37]. Encephalitic retrovirus such as HIV and flavivirus such as Zika virus infect microglia and generate dsRNA during replication in the brain [38, 39]. It is reported that cultured microglia respond to West Nile virus [40] and Zika virus [41, 42] infection by up-regulating TLR3, which is a receptor for pIpC. The increased proinflammatory response and production of inflammatory cytokines in iMG-1 cells after stimulation with LPS or pIpC (Fig. 2) confirmed their inherited microglia reactions to invading pathogens in the CNS. We first noticed the activated morphology in cultured iMG-1 cells after exposure of LPS or pIpC (Fig. 2A). Accompanied by morphological changes, we found that the mRNA and protein levels of proinflammatory cytokines such as TNF-α, IL-6, and IFNs significantly increased in iMG-1 cells following LPS or pIpC treatment (Fig. 2B and D). These data are consistent with previous reports that primary microglia treated with LPS or pIpC result in their activation of transcription factor IRF3 and NF-κB, causing an increased expression of proinflammatory cytokines and their transition into M1 activation status [29]. Our results suggested that iMG-1 cells could substitute primary microglia to investigate the mechanisms of neuroinflammation in response to pathogen stimulations.
Besides the classic proinflammatory responses of cytokines/chemokines production and secretion from reactive microglia, recent studies revealed aberrant metabolism of microglia under the neuroinflammation, neurodegenerative diseases, and traumatic brain injuries [43–45]. Abnormal lipid metabolism has been observed in microglia in neurodegenerative diseases of Alzheimer’s disease, Parkinson’s disease, Huntington’s disease, and Frontotemporal dementia (FTD) [46]. Recently, a new form of microglia with accumulation of neutral lipids, namely lipid droplets (LDs) associated microglia (LDAM), has been characterized in primary microglia and microglia cell line after LPS stimulation or in FTD [30]. LDAM is different from the previously characterized disease associated microglia (DAM) and exhibited unique activation profiles [30]. We found that ~ 20% of iMG-1 cells had LDs at resting status (Fig. 3). However, the percentage of LDs+ iMG-1 cells and their LDs number significantly increased after LPS and pIpC treatment (Fig. 3). We noticed that both LD+ cells and their LDs number in iMG-1 culture were fewer than those in BV2 cells used in a previous study [30], which might be caused by the expression of Myc to stimulate lipogenesis and lipids accumulation in BV2 cells and in other cell types [47, 48]. Indeed, our experiments indicated that c-Myc levels were almost undetectable in both iMG-1 cells and primary microglia (data not show), suggesting a naïve status of lipid metabolism in iMG-1 cells. Together, our findings suggested iMG-1 cells as a useful tool to study the functions and mechanisms of LD accumulation in microglia and to identify the genetic factors involved in LDs accumulation in microglia under different disease models.
In this study, we created a fast method to produce microglia-containing brain 3D spheroids by co-culturing iMG-1 cells and Ast-1 NPCs. Using AggreWell, we could have spheroids forming from Ast-1 cell within 24 h (Fig. 4A) and the diameters of these spheroids were usually larger than 100 μm. The Ast-1 cells kept their NPC characters with NPC markers nestin (Fig. 4B), Sox2, and phosphorylated vimentin (data not shown) in spheroids. More importantly, the ratio of microglia in spheroids can be adjusted by controlling the starting number of Ast-1 cells and iMG-1 cells. We tested 5–15% of iMG-1 cells to coculture with 95–85% of Ast-1 cells in a spheroid. Our data indicated that more than 10% of iMG-1 cells in spheroid will cause the instability of 3D spheroids to fracture on an orbital shaker (data not shown). Thus, this new method can generate spheroids with a consistent and physiologically relevant percentage of microglia as reported in rodent brains [49–51]. Since NPCs are highly responsive to instructive neural patterning cues in vitro [52, 53], these iMG-1 cells containing brain spheroids will enable us to study microglia’s functions in early brain development in the future.
Environmental stimulations taking place in early brain development may have continuing consequences for mature brain functioning. There is a lot of data linking maternal infections to a higher incidence of psychiatric disorders with a presumed neurodevelopmental origin in the offspring, including schizophrenia and autism spectrum disorder [54]. Because of the NPC characters of Ast-1 cells, our 3D spheroid coculture model with iMG-1 cells will be useful to study the process of inflammation in embryonic brain. The inoculation of iMG-1 cells in spheroids changed the expression pattern of inflammatory cytokines to decrease IL-6 and IFNs while increase IL-1β and TNF-α levels in naïve status (Fig. 5). LPS treatment for spheroids from pure Ast-1 cells increased expression levels of IL-6, IL-1β, TNF-α, and IFN-γ; nevertheless, only mRNA level of IL-1β further increased in the cocultured spheroids after exposure to LPS (Fig. 5), suggesting a contribution from activated iMG-1 cells in 3D spheroid. Moreover, the decreased IL-6 and IFNs from cocultured 3D spheroids did not change after LPS treatment (Fig. 5). This result might be explained by the selective counteraction of iMG-1 cells in neuroinflammation dominated from NPC-like Ast-1 cells, which was a different mechanism from previous report that NSCs perform anti-inflammatory functions in injured spinal cords [55]. We noticed that the relative mRNA levels of IL-6, IL-1β, and TNF-α in spheroid coculture did not elevate to those as pure 2D iMG-1 cells (Fig. 2). It was possible that the fewer iMG-1 cells in 3D spheroids did not respond to LPS to trigger extensive proinflammatory responses. These results suggested that interactions between NPCs and microglia are complicated and they could impact on the net outcome of specific cytokine expression in neurodevelopment and neuroinflammation [56, 57]. The interesting phenotypes will be investigated in our future studies. It is noticed that specific gestational windows may be associated with a differing vulnerability to infection-mediated disturbances in normal brain development [58]. It will also be useful to use our cocultured spheroid model to determine the duration of inflammation to confer highest risk for neurodevelopmental disturbances following the prenatal exposure to infectious events such as bacteria, viruses, fungi, etc. [59]. Together, this new microglia-containing 3D brain spheroid model provides unique opportunities to investigate microglia-NPC communication in regulating neuroinflammation during brain development at different stages.
Our newly generated iMG-1 cells and the 3D spheroid model are useful for studies of neuroinflammation and neurodevelopment, nevertheless, we noticed several limitations for this in vitro culture system. First, the iMG-1 cells were obtained from pups in a colony with mixed FVB/B6 background. This might reduce the capacity of iMG-1 cells to be incorporated into the brain of syngeneic mouse to study their physiological functions in vivo. Second, we used our previously characterized Ast-1 cells for a 3D spheroid culture. These Ast-1 cells exhibit NPC characters and could be used to generate spheroids. However, Ast-1 cells generate tumors in Nude mice [26], which limits the use of Ast-1 cells as an ideal model to study crosstalk of microglia with NPC. In our future experiments, it will be interesting to incorporate iMG-1 cells with wild type NPCs isolated from primary (or secondary) neurospheres [60, 61] or neurospheres from neurodevelopmental disorder mouse models developed in our lab [31] for physiological and pathological relevance.
Overall, our findings demonstrate that the iMG-1 cell line keeps most of the immunological characters ascribed to microglia. The iMG-1 cell line provides a suitable tool for in vitro studies on the molecular mechanisms for the induction of biological activities in microglia. The preserved cell characters in iMG-1 cell line in 2D and 3D models may offer a better understanding of the microglia-involved pathologies including but not limited to neurodevelopmental disorders, brain infection and neuroinflammation, brain cancers, and neurodegenerative diseases.
Materials and Methods
Animals
Wild type mice from colony with mixed FVB and B6 backgrounds were described as before to produce neonatal pups for primary microglia culture. Mice were housed and handled according to local, state, and federal regulations. All experimental procedures were carried out according to the guidelines of Institutional Animal Care and Use Committee (IACUC) at University of Cincinnati.
Cell Cultures
Primary microglia and astrocytes were cultured as described previously [62, 63]. Newborn pups were decapitated, and the cortices were removed from meninges, hippocampi, basal ganglia, and midbrain and kept in cold DMEM. The cortical tissue was cut into ~1 mm3 cubes and incubated with trypsin for 30 min at 37 °C. After stopping the digestion with trypsin inhibitor and subsequent filtration with 70 μm and 40 μm mesh, the cell suspension was centrifuged at room temperature with 400 rpm for 5 min. The cells were resuspended with fresh DMEM with 10% FBS and were plated onto tissue culture flasks in incubator (37 °C, 5% CO2 and 95% humidity). Each cortex was plated in a 75 cm2 flask. Medium was changed 3 days after plating. On day 10, the primary microglia were harvested by vigorously shaking off from the flasks and after centrifuge at 400 g for 10 min, these cells were reseeded at 50,000 cells/cm2 in a new plate. The purity of primary microglia was routinely examined by IBA1 staining as we described before [62]. Most of the microglia will be used for experiments up to 10 days after reseeding. One plate of primary microglia set up in October 2020 was maintained for over one month with media change (10% FBS with DMEM) twice weekly. Unexpectedly, we found the microglia in this plate proliferated to occupy the empty space. We used 0.2% trypsin/EDTA to dissociate these cells and we centrifuged them at 400 g to collect the cell pellet. After resuspension in 10% FBS with DMEM, the cells were seeded in 10 cm plate for growth and expansion. When they reached to a confluence of 70–80%, these cells were dissociated by 0.2% trypsin/EDTA solution for serial passage once in a 2 week period. We changed media (DMEM with 10% FBS) twice every week and these cells were collected for preliminary analysis after 20 passages to indicate their microglia characters. After ~ 30 passages for continuous culturing over 1 year, these cells were used to determine their immortalization as iMG-1 cells and for all the experiments presented in this study.
We used the immortalized neural cells (Ast1) [26] to generate neural spheroids. In brief, one million Ast1 cells per well were seeded in neurosphere medium [neural basal media supplemented with B27, 1 mM GlutMax, 10 ng/ml basic FGF, and 20 ng/ml EGF (all from Invitrogen)] in 24-well AggreWell plate (Stem Cell Technology, Canada). To accumulate the cells at the well bottom, plates were centrifuged at 400 g (Heraeus Multifuge 1 S-R, Thermo Scientific, USA) for 1 min. Plates were incubated at 37 °C at 5% CO2 for 24 h. Cells aggregated spontaneously to form a sphere-like structure. We re-suspended the sphere-like structures in neurosphere media using tip-cut 1 ml pipetting tips. The re-suspended structures were put in a 6-well plate to shake at 120 rpm on an orbital shaker (OHAUS, NJ). Every 2 to 3 days, the spheroid medium was exchanged. For the generation of co-culture spheroids, 950,000 Ast1 cells were mixed with 50,000 iMG-1 cells (95:5) per well in a 24-well AggreWell plate. Generation of spheroids and the medium exchange was conducted in the same way as with mono-culture spheroids.
Cell Proliferation Assay
Cells were seeded in 24-well tissue culture plates (1.0 × 10⁵ cells per well). After 5, 10, 15, and 20 days incubation, cells were digested by trypsin and resuspend. Cell count was measured at the indicated days with Countessmy of Life Science Technology.
Immunofluorescence
A total of 1 × 10⁴ cells were seeded into an 8-well chamber for 24 h. Then, cells were permeabilized with pure methanol for 10 min on ice, followed with 1% bovine serum albumin blocking buffer for 1 h at room temperature. Anti CD11b (BD Pharmingen, CA), IBA1 (WAKO, Japan), P2RY12 (BioLegend, CA), and CD68 (CST, MA) antibodies were incubated with cells in the blocking buffer overnight at 4 °C. Next, Alexa fluorescence 594 goat anti-rabbit was used for 1 h at room temperature, followed by ProLong® Gold Antifade Mountant. Images were acquired with Zeiss LSM confocal 710.
Phagocytosis Assay
To determine iMG-1 cells phagocytosis, cells were seeded on 20 mm diameter glass coverslips in 12-well tissue culture plates. Cells were incubated in in serum-free DMEM for 24 h. Fluorescent beads (2 μl/well; Fluoresbrite® YG Carboxylate Microspheres 1.00 μm) (Polysciences, Inc) were added in warm DMEM for the wells. After 1 h incubation, cells were washed twice with warm PBS and fixed with 4% PFA. iMG-1 cells were stained with rabbit anti-Iba1 antibody (WAKO, Japan) and then incubated with alexa fluorescence 594 goat anti-rabbit for 1 h at room temperature. This was followed by ProLong® Gold Antifade Mountant. Images were acquired with Zeiss LSM confocal 710.
BODIPY and Oil-Red-o Staining
For BODIPY 493/503 (Invitrogen, CA) staining, a fresh solution of BODIPY was diluted in PBS at a concentration of 1 μg/ml and applied to 4% PFA fixed samples. After PFA was removed by three washes with PBS, samples were incubated in 1 μg/ml BODIPY 493/503 for 20 min at room temperature. The samples were mounted and observed using a Zeiss LSM 700 confocal microscope (Carl Zeiss).
For oil-Red-o staining, cells were fixed by removing media from the cells and washing 2× with PBS. 1 ml of 10% Formalin was added to each well and incubated for 30 min. oil-Red-o solution was prepared by filtering through a paper filter. Formalin was removed from the iMG-1 cells and washed 2× with dH2O. 1 ml 60% isopropanol was added to each well and incubated for 5 min. Isopropanol was then removed and oil-Red-o working solution was added to the wells and incubated for 20 min. oil-Red-o was then removed and cells were washed 5× with dH2O. Coverslips were mounted onto slides and images were acquired under a BX41 light microscope (Olympus America, Inc., Center Valley, PA).
Immunostaining of iMG-1 Cells in Spheroids
The 3D spheroid cocultures were kept in 4% paraformaldehyde at 4 °C for 30 min. The specimens were then processed, embedded in paraffin and sectioned at 5 μm, essentially as we did before [60, 61]. Heat-induced antigen retrieval was performed in citrate buffer using a pressure cooker. Sections were incubated with primary antibodies overnight at 4 °C. Primary antibodies used in this study were P2RY12 (BioLegend, CA) and Nestin (Rat401, DSHB) as we used in previous studies. Sections were then incubated with FITC- or TRICT-conjugated IgG (for 1 h at room temperature), followed by DAPI staining (Vector Laboratories). Images were acquired with Olympus BX41 microscope. Six random fields from three different tissues in each group were quantified using the ImageJ software.
FACS
Dissociated iMG-1 cells were fixed with 4% PFA for 15 min at room temperature and then the cells were permeabilized with 0.2% Triton X-100 in PBS for 10 min at room temperature. Cells were stained with IL-6-PE (BioLegend, CA) and TNF-α-APC (BioLegend, CA) for 60 min at room temperature, according to manufacturer’s instructions. Cells were resuspended in 2 μg/ml DAPI to distinguish live from dead cells. The cell cycle was also revealed by DAPI intensity in each cell. Flow cytometry was performed on a FACSVantage SE-dual laser, three-line flow cytometer or an FACSCanto (BD Biosciences) as described before [62].
Real Time PCR
Total RNAs were isolated from cells with GeneJET RNA Purification Kit (Thermo Scientific #K0731) according to the user manual. Reverse transcription complementary DNAs (cDNAs) were synthesized with iScript cDNA Synthesis Kit (Bio-Rad #1,708,891). Real-time PCR was performed with iQ SYBR Green Supermix Kit (Bio-Rad #170–8880). Expression values were normalized to β-actin. The primers were obtained from PrimerBank (https://pga.mgh.harvard.edu/primerbank/) unless specific references were cited. The specificity of all primers was validated with their dissociation curves.
Statistical Analysis
Statistical significance was evaluated by Two-way ANOVA, student’s t-test, with p < 0.05 as indicative of statistical significance using Graph Pad Prism (Version 7.0). The number of experiments used for quantification was indicated in the figure legends.
Acknowledgements
We thank Dr. Aarti Nagayach, Ms. Ellen Walter, Ms. Kaitlin Crilow, and other members in Dr. Chenran Wang’s lab for their support in the project.
Funding
This study was supported by NIH Grants (R01NS103981 and R01CA273586) and AARG-NTF-21-849207 to CRW.
Footnotes
Conflict of interest The authors declare no conflicts of interest.
Data Availability
Enquiries about data availability should be directed to the authors.
References
- 1.Ginhoux F et al. (2010) Fate mapping analysis reveals that adult microglia derive from primitive macrophages. Science 330(6005):841–845 [DOI] [PMC free article] [PubMed] [Google Scholar]
- 2.Li Q, Barres BA (2018) Microglia and macrophages in brain homeostasis and disease. Nat Rev Immunol 18(4):225–242 [DOI] [PubMed] [Google Scholar]
- 3.Wolf SA, Boddeke HW, Kettenmann H (2017) Microglia in physiology and disease. Annu Rev Physiol 79:619–643 [DOI] [PubMed] [Google Scholar]
- 4.Saijo K, Glass CK (2011) Microglial cell origin and phenotypes in health and disease. Nat Rev Immunol 11(11):775–787 [DOI] [PubMed] [Google Scholar]
- 5.Schafer DP, Stevens B (2015) Microglia function in central nervous system development and plasticity. Cold Spring Harb Perspect Biol 7(10):a020545. [DOI] [PMC free article] [PubMed] [Google Scholar]
- 6.Salter MW, Stevens B (2017) Microglia emerge as central players in brain disease. Nat Med 23(9):1018–1027 [DOI] [PubMed] [Google Scholar]
- 7.Hammond TR et al. (2019) Single-cell RNA sequencing of microglia throughout the mouse lifespan and in the injured brain reveals complex cell-state changes. Immunity 50(1):253–271 (e6) [DOI] [PMC free article] [PubMed] [Google Scholar]
- 8.Li Q et al. (2019) Developmental heterogeneity of microglia and brain myeloid cells revealed by deep single-cell RNA sequencing. Neuron 101(2):207–223e10 [DOI] [PMC free article] [PubMed] [Google Scholar]
- 9.Wright-Jin EC, Gutmann DH (2019) Microglia as dynamic cellular mediators of brain function. Trends Mol Med 25(11):967–979 [DOI] [PMC free article] [PubMed] [Google Scholar]
- 10.Bachiller S et al. (2018) Microglia in neurological diseases: a road map to brain-disease dependent-inflammatory response. Front Cell Neurosci 12:488. [DOI] [PMC free article] [PubMed] [Google Scholar]
- 11.Timmerman R, Burm SM, Bajramovic JJ (2018) An overview of in vitro methods to study microglia. Front Cell Neurosci 12:242. [DOI] [PMC free article] [PubMed] [Google Scholar]
- 12.Blasi E et al. (1990) Immortalization of murine microglial cells by a v-raf/v-myc carrying retrovirus. J Neuroimmunol 27(2–3):229–237 [DOI] [PubMed] [Google Scholar]
- 13.Righi M et al. (1989) Monokine production by microglial cell clones. Eur J Immunol 19(8):1443–1448 [DOI] [PubMed] [Google Scholar]
- 14.Nagai A et al. (2001) Generation and characterization of immortalized human microglial cell lines: expression of cytokines and chemokines. Neurobiol Dis 8(6):1057–1068 [DOI] [PubMed] [Google Scholar]
- 15.Nagamoto-Combs K, Kulas J, Combs CK (2014) A novel cell line from spontaneously immortalized murine microglia. J Neurosci Methods 233:187–198 [DOI] [PMC free article] [PubMed] [Google Scholar]
- 16.Walker WS et al. (1995) Mouse microglial cell lines differing in constitutive and interferon-gamma-inducible antigen-presenting activities for naive and memory CD4+ and CD8+ T cells. J Neuroimmunol 63(2):163–174 [DOI] [PubMed] [Google Scholar]
- 17.Cheepsunthorn P et al. (2001) Characterization of a novel brain-derived microglial cell line isolated from neonatal rat brain. Glia 35(1):53–62 [DOI] [PubMed] [Google Scholar]
- 18.Stansley B, Post J, Hensley K (2012) A comparative review of cell culture systems for the study of microglial biology in Alzheimer’s disease. J Neuroinflamm 9:115. [DOI] [PMC free article] [PubMed] [Google Scholar]
- 19.Bachstetter AD et al. (2011) Fractalkine and CX3 CR1 regulate hippocampal neurogenesis in adult and aged rats. Neurobiol Aging 32(11):2030–2044 [DOI] [PMC free article] [PubMed] [Google Scholar]
- 20.De Lucia C et al. (2016) Microglia regulate hippocampal neurogenesis during chronic neurodegeneration. Brain Behav Immun 55:179–190 [DOI] [PMC free article] [PubMed] [Google Scholar]
- 21.Ekdahl CT (2012) Microglial activation-tuning and pruning adult neurogenesis. Front Pharmacol 3:41. [DOI] [PMC free article] [PubMed] [Google Scholar]
- 22.Vukovic J et al. (2012) Microglia modulate hippocampal neural precursor activity in response to exercise and aging. J Neurosci 32(19):6435–6443 [DOI] [PMC free article] [PubMed] [Google Scholar]
- 23.Shigemoto-Mogami Y et al. (2014) Microglia enhance neurogenesis and oligodendrogenesis in the early postnatal subventricular zone. J Neurosci 34(6):2231–2243 [DOI] [PMC free article] [PubMed] [Google Scholar]
- 24.Monje ML, Toda H, Palmer TD (2003) Inflammatory blockade restores adult hippocampal neurogenesis. Science 302(5651):1760–1765 [DOI] [PubMed] [Google Scholar]
- 25.Ekdahl CT et al. (2003) Inflammation is detrimental for neurogenesis in adult brain. Proc Natl Acad Sci USA 100(23):13632–13637 [DOI] [PMC free article] [PubMed] [Google Scholar]
- 26.Tang X et al. (2021) The characterization of a subependymal giant astrocytoma-like cell line from murine astrocyte with mTORC1 hyperactivation. Int J Mol Sci 22(8):4116. [DOI] [PMC free article] [PubMed] [Google Scholar]
- 27.Giulian D, Baker TJ (1986) Characterization of ameboid microglia isolated from developing mammalian brain. J Neurosci 6(8):2163–2178 [DOI] [PMC free article] [PubMed] [Google Scholar]
- 28.Yanguas-Casás N et al. (2020) Aging and sex: impact on microglia phagocytosis. Aging Cell 19(8):e13182. [DOI] [PMC free article] [PubMed] [Google Scholar]
- 29.He Y et al. (2021) Mouse primary microglia respond differently to LPS and poly(I:C) in vitro. Sci Rep 11(1):10447. [DOI] [PMC free article] [PubMed] [Google Scholar]
- 30.Marschallinger J et al. (2020) Lipid-droplet-accumulating microglia represent a dysfunctional and proinflammatory state in the aging brain. Nat Neurosci 23(2):194–208 [DOI] [PMC free article] [PubMed] [Google Scholar]
- 31.Wang C et al. (2019) Autophagic lipid metabolism sustains mTORC1 activity in TSC-deficient neural stem cells. Nat Metab 1(11):1127–1140 [DOI] [PMC free article] [PubMed] [Google Scholar]
- 32.Kettenmann H et al. (2011) Physiology of microglia. Physiol Rev 91(2):461–553 [DOI] [PubMed] [Google Scholar]
- 33.Henn A et al. (2009) The suitability of BV2 cells as alternative model system for primary microglia cultures or for animal experiments examining brain inflammation. Altex 26(2):83–94 [DOI] [PubMed] [Google Scholar]
- 34.Muzio L, Viotti A, Martino G (2021) Microglia in Neuroinflammation and Neurodegeneration: from understanding to Therapy. Front Neurosci 15:742065. [DOI] [PMC free article] [PubMed] [Google Scholar]
- 35.Lehnardt S (2010) Innate immunity and neuroinflammation in the CNS: the role of microglia in toll-like receptor-mediated neuronal injury. Glia 58(3):253–263 [DOI] [PubMed] [Google Scholar]
- 36.Janssens S, Beyaert R (2003) Role of toll-like receptors in pathogen recognition. Clin Microbiol Rev 16(4):637–646 [DOI] [PMC free article] [PubMed] [Google Scholar]
- 37.Hines DJ et al. (2013) Prevention of LPS-induced microglia activation, cytokine production and sickness behavior with TLR4 receptor interfering peptides. PLoS ONE 8(3):e60388. [DOI] [PMC free article] [PubMed] [Google Scholar]
- 38.Heil F et al. (2004) Species-specific recognition of single-stranded RNA via toll-like receptor 7 and 8. Science 303(5663):1526–1529 [DOI] [PubMed] [Google Scholar]
- 39.Xu P et al. (2020) Role of microglia in the dissemination of Zika virus from mother to fetal brain. PLoS Negl Trop Dis 14(7):e0008413. [DOI] [PMC free article] [PubMed] [Google Scholar]
- 40.Wang T et al. (2004) Toll-like receptor 3 mediates West Nile virus entry into the brain causing lethal encephalitis. Nat Med 10(12):1366–1373 [DOI] [PubMed] [Google Scholar]
- 41.Ojha CR et al. (2019) Toll-like receptor 3 regulates Zika virus infection and associated host inflammatory response in primary human astrocytes. PLoS ONE 14(2):e0208543. [DOI] [PMC free article] [PubMed] [Google Scholar]
- 42.Chen Z, Zhong D, Li G (2019) The role of microglia in viral encephalitis: a review. J Neuroinflamm 16(1):76. [DOI] [PMC free article] [PubMed] [Google Scholar]
- 43.Lauro C, Limatola C (2020) Metabolic reprograming of microglia in the regulation of the innate inflammatory response. Front Immunol 11:493. [DOI] [PMC free article] [PubMed] [Google Scholar]
- 44.Kwon HS, Koh SH (2020) Neuroinflammation in neurodegenerative disorders: the roles of microglia and astrocytes. Transl Neurodegener 9(1):42. [DOI] [PMC free article] [PubMed] [Google Scholar]
- 45.Song S et al. (2022) Elevated microglial oxidative phosphorylation and phagocytosis stimulate post-stroke brain remodeling and cognitive function recovery in mice. Commun Biol 5(1):35. [DOI] [PMC free article] [PubMed] [Google Scholar]
- 46.Estes RE et al. (2021) Lipid metabolism influence on neurodegenerative disease progression: is the vehicle as important as the Cargo? Front Mol Neurosci 14:788695. [DOI] [PMC free article] [PubMed] [Google Scholar]
- 47.Hall Z et al. (2020) Myc linked to dysregulation of cholesterol transport and storage in nonsmall cell lung cancer. J Lipid Res 61(11):1390–1399 [DOI] [PMC free article] [PubMed] [Google Scholar]
- 48.Gouw AM et al. (2019) The MYC Oncogene cooperates with sterol-regulated element-binding protein to regulate lipogenesis essential for neoplastic growth. Cell Metab 30(3):556–572e5 [DOI] [PMC free article] [PubMed] [Google Scholar]
- 49.Dos Santos SE et al. (2020) Similar microglial cell densities across brain structures and mammalian species: implications for brain tissue function. J Neurosci 40(24):4622–4643 [DOI] [PMC free article] [PubMed] [Google Scholar]
- 50.von Bartheld CS, Bahney J, Herculano-Houzel S (2016) The search for true numbers of neurons and glial cells in the human brain: a review of 150 years of cell counting. J Comp Neurol 524(18):3865–3895 [DOI] [PMC free article] [PubMed] [Google Scholar]
- 51.Tan YL, Yuan Y, Tian L (2020) Microglial regional heterogeneity and its role in the brain. Mol Psychiatr 25(2):351–367 [DOI] [PMC free article] [PubMed] [Google Scholar]
- 52.Li W et al. (2011) Rapid induction and long-term self-renewal of primitive neural precursors from human embryonic stem cells by small molecule inhibitors. Proc Natl Acad Sci USA 108(20):8299–8304 [DOI] [PMC free article] [PubMed] [Google Scholar]
- 53.Galiakberova AA, Dashinimaev EB (2020) Neural stem cells and methods for their generation from induced pluripotent stem cells. Front Cell Dev Biol 8:815. [DOI] [PMC free article] [PubMed] [Google Scholar]
- 54.Meyer U, Yee BK, Feldon J (2007) The neurodevelopmental impact of prenatal infections at different times of pregnancy: the earlier the worse? Neuroscientist 13(3):241–256 [DOI] [PubMed] [Google Scholar]
- 55.Cheng Z et al. (2016) Anti-inflammatory mechanism of neural stem cell transplantation in spinal cord injury. Int J Mol Sci 17(9):1380. [DOI] [PMC free article] [PubMed] [Google Scholar]
- 56.de Almeida MMA, Goodkey K, Voronova A (2023) Regulation of microglia function by neural stem cells. Front Cell Neurosci 17:1130205. [DOI] [PMC free article] [PubMed] [Google Scholar]
- 57.Matarredona ER, Talaveron R, Pastor AM (2018) Interactions between neural progenitor cells and microglia in the subventricular zone: physiological implications in the neurogenic niche and after implantation in the injured brain. Front Cell Neurosci 12:268. [DOI] [PMC free article] [PubMed] [Google Scholar]
- 58.Meyer U et al. (2006) The time of prenatal immune challenge determines the specificity of inflammation-mediated brain and behavioral pathology. J Neurosci 26(18):4752–4762 [DOI] [PMC free article] [PubMed] [Google Scholar]
- 59.Boksa P (2010) Effects of prenatal infection on brain development and behavior: a review of findings from animal models. Brain Behav Immun 24(6):881–897 [DOI] [PubMed] [Google Scholar]
- 60.Wang C et al. (2013) FIP200 is required for maintenance and differentiation of postnatal neural stem cells. Nat Neurosci 16(5):532–542 [DOI] [PMC free article] [PubMed] [Google Scholar]
- 61.Wang C et al. (2016) Elevated p62/SQSTM1 determines the fate of autophagy-deficient neural stem cells by increasing superoxide. J Cell Biol 212(5):545–560 [DOI] [PMC free article] [PubMed] [Google Scholar]
- 62.Wang C et al. (2017) Autophagy gene FIP200 in neural progenitors non-cell autonomously controls differentiation by regulating microglia. J Cell Biol 216(8):2581–2596 [DOI] [PMC free article] [PubMed] [Google Scholar]
- 63.Gao K et al. (2013) Traumatic scratch injury in astrocytes triggers calcium influx to activate the JNK/c-Jun/AP-1 pathway and switch on GFAP expression. Glia 61(12):2063–2077 [DOI] [PubMed] [Google Scholar]
Associated Data
This section collects any data citations, data availability statements, or supplementary materials included in this article.
Data Availability Statement
Enquiries about data availability should be directed to the authors.