

Abstract
Background:
The contemporary burden and characteristics of coronary atherosclerosis, assessed using coronary computed tomography angiography (CCTA), is unknown among asymptomatic adults with diabetes and prediabetes in the United States. The Pooled Cohort Equations (PCE) and coronary artery calcium (CAC) score stratify atherosclerotic cardiovascular disease (ASCVD) risk but their association with CCTA findings across glycemic categories is not well established.
Methods:
Asymptomatic adults without ASCVD enrolled in the Miami Heart Study were included. Participants underwent CAC and CCTA testing and were classified into glycemic categories. Prevalence of coronary atherosclerosis (any plaque, non-calcified plaque, plaque with ≥1 high-risk feature, maximal stenosis ≥50%) assessed by CCTA was described across glycemic categories and further stratified by PCE-estimated ASCVD risk and CAC score. Adjusted logistic regression was used to evaluate the associations between glycemic categories and coronary outcomes.
Results:
Among 2,352 participants (49.5% women), the prevalence of euglycemia, prediabetes, and diabetes was 63%, 30%, and 7%, respectively. Coronary plaque was more commonly present across worsening glycemic categories (euglycemia=43%, prediabetes=58%, diabetes=69%), and similar pattern was observed for other coronary outcomes. In adjusted analyses, compared with euglycemia, prediabetes and diabetes were each associated with higher odds of any coronary plaque (OR 1.30[95%CI, 1.05–1.60] and 1.75[1.17–2.61], respectively), non-calcified plaque (OR 1.47[1.19–1.81] and 1.99[1.38–2.87], respectively), and plaque with ≥1 high-risk feature (OR 1.65[1.14–2.39] and 2.53[1.48–4.33], respectively). Diabetes was associated with stenosis ≥50% (OR 3.01[1.79–5.08], reference=euglycemia). Among participants with diabetes and estimated ASCVD risk <5%, 46% had coronary plaque and 10% had stenosis ≥50%. Among participants with diabetes and CAC=0, 30% had coronary plaque and 3% had stenosis ≥50%.
Conclusions:
Among asymptomatic adults, worse glycemic status is associated with higher prevalence and extent of coronary atherosclerosis, high-risk plaque, and stenosis. In diabetes, CAC was more closely associated with CCTA findings and informative in a larger population than the PCE.
Keywords: atherosclerosis, diabetic mellitus, prediabetic state, cardiovascular disease, diabetes, type 2, primary prevention, risk factors
Graphical abstract.

Introduction
Diabetes affects more than 37 million adults in the United States (US) and prevalence is increasing.1 Hyperglycemia below diagnostic thresholds for diabetes, or prediabetes, is found in approximately one-third of the US adult population and has a broad range of cardiometabolic manifestations.1, 2 The risk of atherosclerotic cardiovascular disease (ASCVD) in these dysglycemic states varies widely with significant heterogeneity in diabetes and inconsistent associations observed in prediabetes.2–4 This large burden of impaired glucose metabolism coupled with the variability in complication rates highlights the importance of characterizing subclinical markers of ASCVD and developing strategies to stratify risk across glycemic levels.
Coronary atherosclerosis is a key intermediate phenotype associated with ASCVD risk and can be readily assessed with cardiac imaging.5, 6 The American College of Cardiology/American Heart Association (ACC/AHA) guideline for primary prevention of ASCVD recommends coronary artery calcium (CAC) score to refine ASCVD risk estimation in select individuals but not those with diabetes.7 CAC does not fully capture the high long-term risk of ASCVD observed in diabetes which may be related to its inability to assess non-calcified plaque.8 Enhanced evaluation of total coronary plaque burden and characterization of high-risk features may inform prevention strategies and target cardioprotective therapies to those most likely to derive benefit. The association of CAC as well as recommended approaches for risk assessment using the ACC/AHA Pooled Cohort Equations (PCE) with coronary atherosclerosis among asymptomatic adults with diabetes and prediabetes in the US is not well characterized.7
Accordingly, we evaluated the prevalence and severity of coronary atherosclerosis assessed by coronary computed tomography (CT) angiography (CCTA) across the glycemic spectrum among asymptomatic, middle-aged adults in a community-based cohort in the US. Based on preliminary evidence,8–10 we hypothesized that more severe dysglycemia, including within the non-diabetes range, would be associated with greater burden of coronary atherosclerosis and hypothesized that the CAC score would correlate more closely with CCTA findings among individuals with hyperglycemia compared with PCE-based estimates of ASCVD risk.
Methods
The data that support the findings of this study are available from the corresponding author upon reasonable request.
Study population
The Miami Heart Study (MiHeart) at Baptist Health South Florida is an ongoing, observational, community-based prospective cohort study of adults free of clinical ASCVD at baseline. The design of MiHeart has been published previously and is described further in the Supplemental Methods.11 In brief, 2,459 adults 40–65 years of age who were Baptist Health South Florida employees or residents of the Greater Miami Area for at least 6 months were enrolled between May 2015 and September 2018. Individuals with creatinine >1.5 mmol/L were excluded. The Baptist Health South Florida institutional review board approved the study protocol and all participants provided written informed consent.
The present study is a baseline cross-sectional analysis of MiHeart participants with available CAC and CCTA data (n = 100 excluded) who were free of self-reported type 1 diabetes (n = 7 excluded) (Figure S1).
Clinical variables
As part of the baseline MiHeart visit, participants completed a detailed examination as described previously.10, 11 Briefly, sociodemographic information, medical history, and medication use were evaluated using questionnaires and described further in the Supplemental Methods. The PCE were used to estimate 10-year risk of an ASCVD event.12 For all non-Black participants, the PCE for White adults were used, as recommended in current guidelines from the ACC/AHA.7
Glycemic categories
Euglycemia, prediabetes, and diabetes were defined based on established criteria from the American Diabetes Association.13 Specifically, the presence of diabetes was based on self-reported history of diabetes, anti-hyperglycemic medication use, or hemoglobin A1c (HbA1c) ≥6.5%. Prediabetes was defined by HbA1c ≥5.7 to <6.5% among participants without diabetes. The definition of euglycemia was absence of diabetes and prediabetes.
Cardiac computed tomography angiography assessment
A 256-slice volumetric multi-detector CT scanner (Revolution CT, GE Healthcare, Milwaukee) was used for acquiring all CT images according to standardized protocols and analyzed by board-certified cardiac imagers as previously described and detailed in the Supplemental Methods.11 Non-contrast cardiac gated CT was completed prior to contrast-enhanced CT. CAC was quantified according to the Agatston method in Agatston units. Coronary arteries were assessed across 18 segments as described in the Supplemental Methods. Based on CCTA findings, coronary plaque was identified and classified according to the predominant plaque observed: non-calcified, calcified, predominantly non-calcified, and predominantly calcified plaque. Any coronary plaque included any of the four subtypes.
Outcomes of interest
The primary outcome for this analysis was presence of any coronary atherosclerotic plaque. Secondary outcomes were presence of any non-calcified plaque, high-risk plaque, maximal stenosis ≥50%, and maximal stenosis ≥70%. Plaque was considered high-risk based on the presence of at least one of the following findings: positive remodeling, low attenuation, spotty calcification, or napkin-ring sign. A more specific definition based on the presence of 2 or more of these high-risk features was also used. The maximal luminal stenosis of each coronary segment was classified as < or ≥50% as well as < or ≥70%. The segment involvement score (SIS) was also calculated as the total number of coronary segments with any plaque present.
Statistical analysis
Participants were stratified according to glycemic categories. Among participants with euglycemia, prediabetes, and diabetes, baseline characteristics were reported as mean (standard deviation) for continuous variables and number (percentage) for categorical variables. We also described the frequency of the study outcomes by glycemic categories, and the burden of any coronary plaque was plotted by coronary artery segments, for each of the three study groups. In unadjusted analyses, baseline characteristics and study outcomes were compared across glycemic categories using the Chi-squared or Fisher’s exact test for categorical variables, as appropriate, and analysis of variance or non-parametric tests for continuous variables, as appropriate.
Multivariable-adjusted logistic regression models were used to evaluate the independent associations between glycemic categories and each of the study outcomes: any plaque, any non-calcified plaque, presence of high-risk plaque features, maximal stenosis ≥50% and ≥70%. Based on biological plausibility and previous studies, potential confounders were selected a priori for inclusion in the logistic models, as follows: Model 1 adjusted for age, sex, and race/ethnicity, and Model 2 further adjusted for body mass index categories, hypertension, smoking status, non-HDL cholesterol, and statin use.2, 9, 10 The association of continuous measures of glycemia, based on HbA1c, with coronary atherosclerosis was evaluated in similar adjusted models plus additional adjustment for glucose lowering medication (non-insulin plus insulin) use (Model 3).
Unadjusted analyses of coronary plaque outcomes were also performed further stratifying participants by 10-year ASCVD risk estimates based on PCE (<5%, ≥5% to <7.5%, ≥7.5% to <20%, and ≥20%), as well as by CAC score categories (0, >0 to 99, and ≥100).
Additional analyses were performed across subgroups of interest, including sex (women vs. men) and race/ethnicity (Hispanic/Latino vs. non-Hispanic White). Among participants with diabetes, subgroup analyses were performed stratifying participants according to glycemic control (HbA1c < vs. ≥7%). Sensitivity analysis was performed incorporating fasting plasma glucose rather than HbA1c in the definition of glycemic categories (euglycemia: <100 mg/dL, prediabetes: 100–125 mg/dL, diabetes: ≥126 mg/dL).13
A two-sided p-value <0.05 was considered statistically significant. All analyses were performed using Stata version 16 (StataCorp, College Station, Texas, USA) or R version 4.2.0 (Vienna, Austria).
Results
Study participants and baseline characteristics
The present study included 2,352 MiHeart participants (mean age 53 years, 49.5% women, 47% Hispanic/Latino). The prevalence of euglycemia, prediabetes, and diabetes was 63.1%, 29.9%, and 6.9%, respectively. Compared with participants who had prediabetes or euglycemia, those with diabetes were more frequently Hispanic/Latino or Asian, and had a greater burden of CVD risk factors, including higher prevalence of obesity, hypertension, low HDL cholesterol, and hypertriglyceridemia; followed by those with prediabetes (except for Hispanic/Latino) (Table 1). Anti-hypertensive medication, statin, and aspirin use were also most common among participants with diabetes. Of participants with diabetes, 71.8% reported anti-hyperglycemic medication use and 9.2% reported insulin use. Additional details regarding anti-hyperglycemic medication use in diabetes are shown in Table S1.
Table 1.
Baseline characteristics of participants across glycemic categories (N=2,352).
| Euglycemia (n=1,485) |
Prediabetes (n=704) |
Diabetes (n=163) |
P-value | |
|---|---|---|---|---|
|
| ||||
| Age, years | 52.3(6.8) | 55.2(6.4) | 55.2(6.2) | <0.001 |
| Women | 745(50.2%) | 343(48.7%) | 77(47.2%) | 0.68 |
| Race/Ethnicity | <0.001 | |||
| Non-Hispanic White | 656(44.2%) | 309(43.9%) | 49(30.1%) | |
| Non-Hispanic Black | 34(2.3%) | 39(5.5%) | 9(5.5%) | |
| Non-Hispanic Asian | 28(1.9%) | 33(4.7%) | 10(6.1%) | |
| Non-Hispanic Other | 1(0.1%) | 0(0%) | 1(0.6%) | |
| Non-Hispanic ≥1 race | 15(1.0%) | 12(1.7%) | 5(3.1%) | |
| Hispanic/Latino | 724(48.8%) | 295(41.9%) | 87(53.4%) | |
| Unknown/not disclosed | 27(1.8%) | 16(2.3%) | 2(1.2%) | |
| Education | 0.012 | |||
| Less than high school | 2(0.1%) | 5(0.7%) | 1(0.6%) | |
| High school | 106(7.1%) | 70(9.9%) | 16(9.8%) | |
| Some college, no degree | 161(10.8%) | 88(12.5%) | 26(16.0%) | |
| Bachelors | 746(50.2%) | 333(47.3%) | 78(47.9%) | |
| Post graduate studies | 466(31.4%) | 201(28.6%) | 41(25.2%) | |
| Unknown/not disclosed | 4(0.3%) | 7(1.0%) | 1(0.6%) | |
| Income | <0.001 | |||
| <$25,000 | 29(2.0%) | 17(2.4%) | 3(1.8%) | |
| $25,000 to <$50,000 | 75(5.1%) | 68(9.7%) | 23(14.1%) | |
| $50,000 to <$75,000 | 121(8.1%) | 62(8.8%) | 18(11.0%) | |
| $75,000 to <$150,000 | 496(33.4%) | 241(34.2%) | 70(42.9%) | |
| ≥$150,000 | 622(41.9%) | 245(34.8%) | 35(21.5%) | |
| Not disclosed | 142(9.6%) | 71(10.1%) | 14(8.6%) | |
| Cigarette Use | 0.10 | |||
| Never smoker | 1096(73.8%) | 507(72.0%) | 105(64.4%) | |
| Former smoker | 345(23.2%) | 178(25.3%) | 50(30.7%) | |
| Current smoker | 44(3.0%) | 19(2.7%) | 8(4.9%) | |
| BMI categories | <0.001 | |||
| Underweight | 8(0.5%) | 2(0.3%) | 0(0%) | |
| Normal weight | 457(30.8%) | 134(19.0%) | 7(4.3%) | |
| Overweight | 643(43.3%) | 278(39.5%) | 57(35.0%) | |
| Obesity | 377(25.4%) | 290(41.2%) | 99(60.7%) | |
| Systolic BP, mm Hg | 122(14) | 126(14) | 130(14) | <0.001 |
| Diastolic BP mm Hg | 77(9) | 80(8) | 82(7) | <0.001 |
| Hypertension | 591(39.8%) | 391(55.5%) | 127(77.9%) | <0.001 |
| Lipids levels, mg/dL | ||||
| Total cholesterol | 206(39) | 208(42) | 193(44) | <0.001 |
| LDL cholesterol | 123(35) | 125(36) | 114(36) | 0.001 |
| HDL cholesterol | 62(20) | 58(19) | 48(16) | <0.001 |
| Non-HDL cholesterol | 144(39) | 150(42) | 146(43) | 0.003 |
| Triglycerides | 103(55) | 124(86) | 185(215) | <0.001 |
| High LDL cholesterol | 825(55.6%) | 506(71.9%) | 116(71.2%) | <0.001 |
| Low HDL cholesterol | 233(15.7%) | 157(22.3%) | 76(46.6%) | <0.001 |
| Hypertriglyceridemia | 214(14.4%) | 166(23.6%) | 70(42.9%) | <0.001 |
| Medication use | ||||
| BP lowering | 212(14.3%) | 171(24.3%) | 78(47.9%) | <0.001 |
| Statin | 239(16.1%) | 215(30.5%) | 68(41.7%) | <0.001 |
| Aspirin | 278(18.7%) | 201(28.6%) | 64(39.3%) | <0.001 |
| Glucose lowering | 0(0%) | 0(0%) | 117(71.8%) | <0.001 |
| Non-insulin | 0(0%) | 0(0%) | 112(68.7%) | <0.001 |
| Insulin | 0(0%) | 0(0%) | 15(9.2%) | <0.001 |
Data are presented as number (%) for categorical variables and mean (standard deviation) for continuous variables. Comparisons across groups were performed with Chi-squared or Fisher’s exact test for categorical variables and analysis of variance or non-parametric tests for continuous variables, as appropriate.
Abbreviations: BMI, body mass index; BP, blood pressure; HDL, high-density lipoprotein; LDL, low-density lipoprotein; N, number.
Estimated ASCVD risk and CAC burden
Figure 1 presents the distribution of PCE-based estimated ASCVD risk categories and CAC strata across glycemic groups. There was an increasing trend in the prevalence of higher estimated ASCVD risk with increasingly worse glycemic status, and participants with diabetes were more commonly at intermediate (≥7.5% to <20%) or high (≥20%) 10-year risk compared with those with prediabetes or euglycemia (Table S2). Only 0.7% of participants with prediabetes had an estimated risk ≥20%, and only 25.2% participants with diabetes had estimated ASCVD risk <5%.
Figure 1. Distribution of estimated ASCVD risk categories* and CAC score categories across glycemic strata.
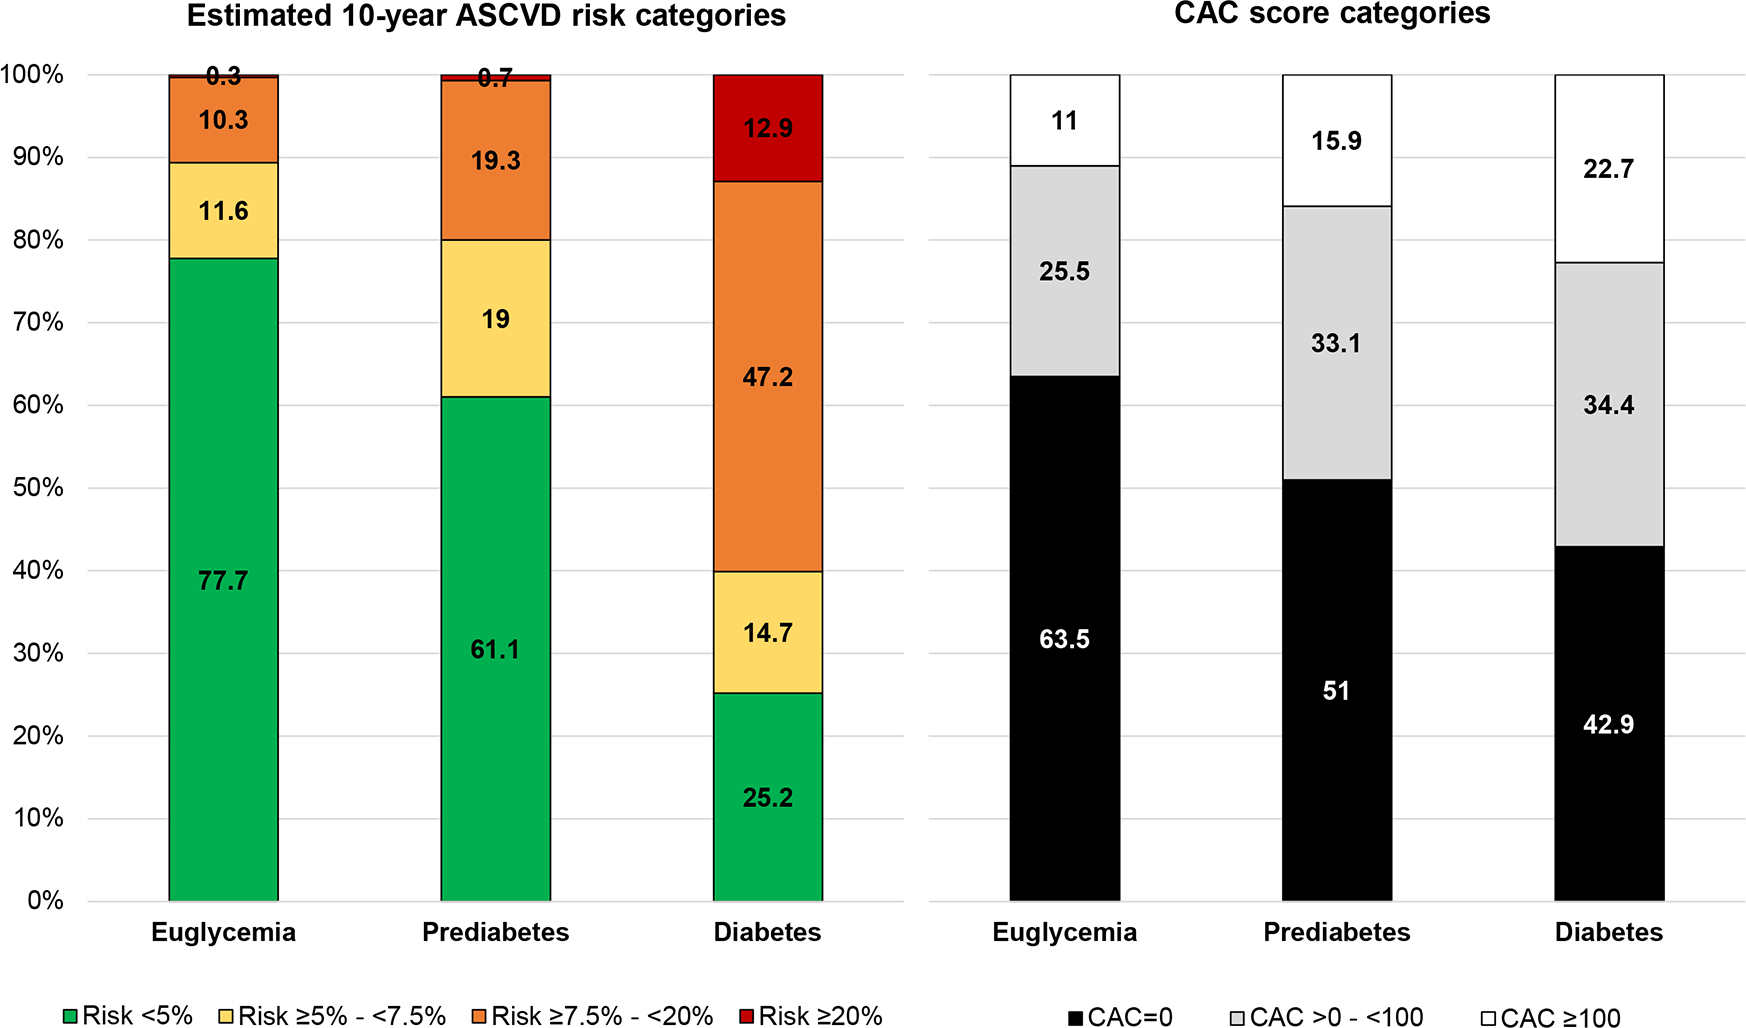
*Estimated using the Pooled Cohort Equations.12 CAC scores presented in Agatston units.
Abbreviations: ASCVD; atherosclerotic cardiovascular disease; CAC, coronary artery calcium
There was also an increasing trend in the prevalence of higher CAC scores with increasingly worse glycemic status (Figure 1, Table S2). However, 42.9% of participants with diabetes had CAC scores of 0. The prevalence of CAC >0 was highest among individuals with diabetes (57.1%), followed by those with prediabetes (49%) and was lowest in participants with euglycemia (36.5%). The prevalence of CAC>100 followed the same trend (22.7% and 15.9% in those with diabetes and prediabetes, respectively), and was much higher than a PCE-estimated risk ≥20% in all three study groups.
Glycemic categories and any coronary plaque on CCTA
Overall, any coronary plaque was detected in 48.9% of participants. The prevalence was highest among participants with diabetes (68.7%), lower in those with prediabetes (58%) and lowest in euglycemia (42.5%) (Table 2). In multivariable-adjusted logistic regression analyses accounting for demographics, there was a significant, graded association between glycemic categories and any coronary plaque (Model 1). Compared with participants with euglycemia, the prevalence of any coronary plaque was higher in those with prediabetes (odds ratio [OR] 1.59 [95% CI, 1.30–1.94]) and even higher in those with diabetes (OR 2.67 [95% CI, 1.83–3.90]). After further adjustment for other CVD risk factors, the association between glycemic categories and any coronary plaque was attenuated but remained statistically significant (prediabetes: OR 1.30 [95% CI, 1.05–1.60]; diabetes: OR 1.75 [95% CI, 1.17–2.61]) (Model 2). In continuous analyses, a similar pattern of association was observed such that higher HbA1c level was associated with higher odds of any coronary plaque after adjusting for demographics and other risk factors, as well as after further adjusting for anti-hyperglycemic medication use (Model 3: OR per 1 standard deviation [SD] higher HbA1c, 1.19 [95% CI, 1.05–1.36]).
Table 2.
Prevalence of study outcomes across glycemic categories and adjusted associations of glycemic categories and HbA1c levels with coronary artery plaque presence, composition, presence of high-risk plaque features, maximal stenosis ≥50% and ≥70%.
| Prevalence across glycemic strata | Multivariable-adjusted associations with each study outcome |
||||||
|---|---|---|---|---|---|---|---|
| Model 1 |
Model 2 |
Model 3 |
|||||
| OR (95% CI) | P-value | OR (95% CI) | P-value | OR (95% CI) | P-value | ||
|
| |||||||
| Any coronary plaque | |||||||
| Euglycemia | 631(42.5%) | 1.00 (Reference) | 1.00(Reference) | — | — | ||
| Prediabetes | 408(58.0%) | 1.59(1.30–1.94) | <0.001 | 1.30(1.05–1.60) | 0.02 | — | — |
| Diabetes | 112(68.7%) | 2.67(1.83–3.90) | <0.001 | 1.75(1.17–2.61) | 0.006 | — | — |
| Per 1-SD higher HbA1c | 1.35(1.20–1.51) | <0.001 | 1.16(1.05–1.30) | 0.006 | 1.19(1.05–1.36) | 0.008 | |
|
| |||||||
| Any non-calcified coronary plaque | |||||||
| Euglycemia | 443(29.8%) | 1.00(Reference) | 1.00(Reference) | — | — | ||
| Prediabetes | 315(44.7%) | 1.71(1.40–2.09) | <0.001 | 1.47(1.19–1.81) | <0.001 | — | — |
| Diabetes | 91(55.8%) | 2.69(1.90–3.82) | <0.001 | 1.99(1.38–2.87) | <0.001 | — | — |
| Per 1-SD higher HbA1c | 1.37(1.24–1.53) | <0.001 | 1.24(1.12–1.37) | <0.001 | 1.30(1.14–1.48) | <0.001 | |
|
| |||||||
| Any plaque with ≥1 high-risk feature | |||||||
| Euglycemia | 73(4.9%) | 1.00(Reference) | 1.00(Reference) | — | — | ||
| Prediabetes | 67(9.5%) | 1.78(1.25–2.55) | 0.001 | 1.65(1.14–2.39) | 0.008 | — | — |
| Diabetes | 24(14.7%) | 2.81(1.69–4.69) | <0.001 | 2.53(1.48–4.33) | 0.001 | — | — |
| Per 1-SD higher HbA1c | 1.26(1.12–1.41) | <0.001 | 1.22(1.08–1.37) | 0.001 | 1.24(1.07–1.43) | 0.004 | |
|
| |||||||
| Maximal stenosis ≥50% | |||||||
| Euglycemia | 62(4.2%) | 1.00(Reference) | 1.00(Reference) | — | — | ||
| Prediabetes | 49(7.0%) | 1.44(0.97–2.14) | 0.07 | 1.20(0.80–1.82) | 0.38 | — | — |
| Diabetes | 29(17.8%) | 4.18(2.55–6.86) | <0.001 | 3.01(1.79–5.08) | <0.001 | — | — |
| Per 1-SD higher HbA1c | 1.41(1.26–1.57) | <0.001 | 1.31(1.17–1.48) | <0.001 | 1.25(1.08–1.44) | 0.002 | |
| Maximal stenosis ≥70% | |||||||
| Euglycemia | 16(1.1%) | 1.00(Reference) | 1.00(Reference) | — | — | ||
| Prediabetes | 20(2.8%) | 2.39(1.22–4.71) | 0.01 | 1.77(0.88–3.59) | 0.11 | — | — |
| Diabetes | 7(4.4%) | 3.65(1.45–9.20) | 0.006 | 2.84(1.07–7.51) | 0.04 | — | — |
| Per 1-SD higher HbA1c | 1.42(1.23–1.63) | <0.001 | 1.41(1.20–1.65) | <0.001 | 1.51(1.25–1.82) | <0.001 | |
Results are presented as number (%), and as ORs from logistic regression models with 95% CIs, respectively. All models adjusted for the following covariates: Model 1: age, sex, and race/ethnicity; Model 2: further adjusted for BMI categories, hypertension, smoking status, non-HDL cholesterol, and statin use; Model 3: further adjusted for glucose lowering medications (non-insulin and insulin).
Abbreviations: CI, confidence interval; HbA1c, hemoglobin A1c; OR, odds ratio; SD, standard deviation (See Table 1 abbreviations).
Across individual coronary segments, there was a graded increase in prevalence of any coronary plaque across worsening glycemic categories (Figure 2). For example, in the proximal left anterior descending coronary artery, any coronary plaque was observed in 31.4% of participants with euglycemia and present in 44.2% and 49.7% of those with prediabetes and diabetes, respectively. The prevalence of any plaque in the left main coronary artery across glycemic categories followed a similar pattern with 10.0%, 16.5%, and 22.7% observed in participants with euglycemia, prediabetes, and diabetes, respectively. The extent of coronary atherosclerosis was higher across worsening glycemic categories as shown in Figure 3 (Table S3). The median (interquartile range) number of coronary segments containing any coronary plaque (segment involvement score) was 0 (0–2) in euglycemia followed by 1 (0–3) in prediabetes, and 2 (0–5) in diabetes.
Figure 2. Prevalence of atherosclerotic plaque in coronary segments across glycemic categories.

Each number (circles) identifies a coronary artery segment as follows: 1, proximal RCA; 2, mid RCA; 3, distal RCA; 4, posterolateral artery; 5, posterior descending artery; 6, left main coronary artery; 7, ramus intermedius; 8, proximal LAD; 9, first diagonal; 10, mid LAD; 11, second diagonal; 12, distal LAD; 13, proximal LCX; 14, first obtuse marginal; 15, distal LCX; 16, second obtuse marginal; 17, third obtuse marginal.
* The prevalence of plaque in the posterolateral artery includes the right and left posterolateral arteries.
Abbreviations: LAD, left anterior descending coronary artery; LCX, left circumflex coronary artery; RCA, right coronary artery
Figure 3. Distribution of number of coronary segments with atherosclerotic plaque across glycemic categories.

Abbreviations: ASCVD; atherosclerotic cardiovascular disease; CAC, coronary artery calcium; CCTA, cardiac computed tomography angiography; CT, computed tomography
Glycemic categories and CCTA-based coronary plaque characteristics
In the overall cohort, the prevalence of any non-calcified plaque and any high-risk plaque was 36.1% and 7.0%, respectively, with a higher burden among participants with diabetes followed by prediabetes and euglycemia (Table 2). Positive remodeling was the most common high-risk plaque feature followed by either low attenuation plaque or spotty calcification in each glycemic category (Table S4). The prevalence of high-risk plaque based on presence of at least 2 high-risk findings was 1.5%, 3.1%, and 6.1% among participants with euglycemia, prediabetes, and diabetes, respectively. Examples of high-risk plaque features assessed by CCTA are shown in Figure S2. In fully adjusted analyses, compared with participants with euglycemia, those with prediabetes and diabetes more commonly had non-calcified plaque and high-risk coronary artery plaque (Table 2).
For stenosis ≥50% (overall prevalence: 6.0%), the prevalence was 4.2% for participants with euglycemia, higher in prediabetes (7.0%), and highest in diabetes (17.8%). Similarly, the prevalence of stenosis ≥70% was higher across worsening glycemic categories (1.1% in euglycemia, 2.8% in prediabetes, 4.4% in diabetes). In adjusted analysis, compared with euglycemia, diabetes but not prediabetes was significantly associated with presence of stenosis ≥50% (OR 3.01 [95% CI, 1.79–5.08]) (Table 2). In continuous analyses, in the most adjusted model including anti-hyperglycemic medication use, higher HbA1c was significantly associated with higher non-calcified plaque (OR per 1 SD higher HbA1c, 1.30 [95% CI, 1.14–1.48]), high-risk plaque (OR per 1 SD higher HbA1c, 1.24 [95% CI, 1.07–1.43]), stenosis ≥50% (OR per 1 SD higher HbA1c, 1.25 [95% CI, 1.08–1.44]), and stenosis ≥70% (OR per 1 SD higher HbA1c, 1.51 [95% CI, 1.25–1.82]).
Glycemic categories, estimated ASCVD risk, and coronary artery plaque
Among individuals with diabetes, higher estimated risk using the PCE was associated with higher burden of all four study outcomes (Table 3). Specifically, among individuals with diabetes and estimated risk ≥20%, 95.2% had coronary plaque on CCTA, 33.3% had plaque with at least one high-risk feature, and 28.6% had stenosis ≥50%. Among those with diabetes and estimated risk <5%, 46.3% had detectable plaque, and 9.8% had stenosis ≥50%. Similar qualitative trends were observed among those with prediabetes, although the number who were considered at high ASCVD risk (≥20%) was very small (0.7%). Among participants with prediabetes and estimated risk <5%, 46.0% had plaque on CCTA.
Table 3.
Prevalence of the study outcomes across glycemic categories stratified by estimated 10-year ASCVD risk strata.
| Euglycemia | Prediabetes | Diabetes | |
|---|---|---|---|
|
| |||
| Participants with estimated risk <5% | |||
| Number | 1,143 | 428 | 41 |
| Any plaque | 387(33.9%) | 197(46.0%) | 19(46.3%) |
| Any non-calcified plaque | 260(22.7%) | 155(36.2%) | 16(39.0%) |
| Any plaque with ≥1 high-risk feature | 39(3.4%) | 24(5.6%) | 2(4.9%) |
| Stenosis ≥ 50% | 25(2.2%) | 10(2.3%) | 4(9.8%) |
| Stenosis ≥ 70% | 9(0.8%) | 3(0.7%) | 1(2.4%) |
| Participants with estimated risk ≥5 to <7.5% | |||
| Number | 171 | 133 | 24 |
| Any plaque | 117(68.4%) | 97(72.9%) | 12(50.0%) |
| Any non-calcified plaque | 86(50.3%) | 67(50.4%) | 10(41.7%) |
| Any plaque with ≥1 high-risk feature | 17(9.9%) | 16(12.0%) | 1(4.2%) |
| Stenosis ≥ 50% | 15(8.8%) | 14(10.5%) | 4(16.7%) |
| Stenosis ≥ 70% | 1(0.6%) | 6(4.5%) | 1(4.2%) |
| Participants with estimated risk ≥7.5% to <20% | |||
| Number | 152 | 135 | 77 |
| Any plaque | 114(75.0%) | 108(80.0%) | 61(79.2%) |
| Any non-calcified plaque | 86(56.6%) | 88(65.2%) | 51(66.2%) |
| Any plaque with ≥1 high-risk feature | 13(8.6%) | 25(18.5%) | 14(18.2%) |
| Stenosis ≥ 50% | 20(13.2%) | 23(17.0%) | 15(19.5%) |
| Stenosis ≥ 70% | 6(3.9%) | 9(6.7%) | 2(2.6%) |
| Participants with estimated risk ≥20% | |||
| Number | 5 | 5 | 21 |
| Any plaque | 5(100%) | 4(80.0%) | 20(95.2%) |
| Any non-calcified plaque | 5(100%) | 3(60.0%) | 14(66.7%) |
| Any plaque with ≥1 high-risk feature | 2(40.0%) | 1(20.0%) | 7(33.3%) |
| Stenosis ≥ 50% | 0(0%) | 2(40.0%) | 6(28.6%) |
| Stenosis ≥ 70% | 0(0%) | 2(40.0%) | 3(14.3%) |
ASCVD risk was estimated using the Pooled Cohort Equations.12 Results are presented as number (column %).
Abbreviation: ASCVD, atherosclerotic cardiovascular disease.
Note: Total cholesterol values were missing for 17 participants, for whom ASCVD risk was not calculated.
Within strata defined by estimated ASCVD risk categories, the prevalence of any coronary plaque increased across euglycemia, prediabetes, and diabetes groups in the low ASCVD risk group (<5%). Conversely, this pattern of association was not observed across the other estimated ASCVD risk strata: there was no consistent pattern for the prevalence of any high-risk plaque or stenosis ≥70% with worsening glycemic categories within ASCVD risk strata >5%.
Glycemic categories, CAC scores, and coronary artery plaque
Among individuals with diabetes, higher CAC scores were associated with higher burden of most study outcomes (Table 4). Specifically, among individuals with diabetes and CAC ≥100, 27% had plaque with at least one high-risk feature, and 59.5% were reported to have stenosis ≥50%. Among those with diabetes and CAC=0, 30.0% had detectable plaque, and only 2.9% had stenosis ≥50%. Similar qualitative trends were observed among participants with prediabetes. Specifically, among those with CAC=0, 21.7% had plaque on CCTA, while only 2.8% had coronary plaque with at least one high-risk feature, and only 0.8% had stenosis ≥50%. Among those with CAC ≥100, 22.3% had plaque with at least one high-risk feature and 28.6% had stenosis ≥50%.
Table 4.
Prevalence of the study outcomes across glycemic categories stratified by coronary artery calcium score strata.
| Euglycemia | Prediabetes | Diabetes | |
|---|---|---|---|
|
| |||
| Participants with CAC score = 0 | |||
| Number | 943 | 359 | 70 |
| Any plaque | 124(13.1%) | 78(21.7%) | 21(30.0%) |
| Any non-calcified plaque | 117(12.4%) | 73(20.3%) | 20(28.6%) |
| Any plaque with ≥1 high-risk feature | 18(1.9%) | 10(2.8%) | 3(4.3%) |
| Stenosis ≥ 50% | 6(0.6%) | 3(0.8%) | 2(2.9%) |
| Stenosis ≥ 70% | 3(0.3%) | 0(0%) | 0(0%) |
| Participants with CAC score >0 to 99 | |||
| Number | 378 | 233 | 56 |
| Any plaque | 344(91.0%) | 218(93.6%) | 55(98.2%) |
| Any non-calcified plaque | 204(54.0%) | 152(65.2%) | 39(69.6%) |
| Any plaque with ≥1 high-risk feature | 30(7.9%) | 32(13.7%) | 11(19.6%) |
| Stenosis ≥ 50% | 13(3.4%) | 14(6.0%) | 5(8.9%) |
| Stenosis ≥ 70% | 1(0.2%) | 4(1.7%) | 1(1.8%) |
| Participants with CAC score ≥100 | |||
| Number | 164 | 112 | 37 |
| Any plaque | 163(99.4%) | 112(100%) | 36(97.3%) |
| Any non-calcified plaque | 122(74.4%) | 90(80.4%) | 32(86.5%) |
| Any plaque with ≥1 high-risk feature | 25(15.2%) | 25(22.3%) | 10(27.0%) |
| Stenosis ≥ 50% | 43(26.2%) | 32(28.6%) | 22(59.5%) |
| Stenosis ≥ 70% | 12(7.1%) | 16(14.3%) | 6(16.2%) |
Results are presented as number (column %). CAC scores presented in Agatston units.
Abbreviation: CAC, coronary artery calcium.
Within strata defined by CAC score categories, the prevalence of most study outcomes was higher with increasing glycemic categories. Specifically, among participants with CAC score of 0, the prevalence of any non-calcified plaque was 15.3% overall and was highest in diabetes (28.6%) followed by prediabetes (20.3%) and euglycemia (12.4%). In the CAC score ≥100 category, non-calcified plaque was observed in 74.4%, 80.4%, and 86.5% of participants with euglycemia, prediabetes, and diabetes, respectively (overall prevalence = 78.0%).
Glycemic categories and coronary atherosclerosis in subgroups
In subgroup analysis stratified by sex (women and men), the prevalence of most coronary outcomes was lower among women compared with men irrespective of glycemic category (Table S5). The prevalence of any coronary plaque, non-calcified plaque, high-risk plaque, and stenosis ≥50% was higher across worsening glycemic categories in subgroups stratified by sex (women and men) and race/ethnicity (Hispanic/Latino and non-Hispanic White) (Tables S5 and S6). In adjusted analysis accounting for demographics, higher HbA1c was significantly associated with higher odds of any coronary plaque across subgroups (Model 1).
Among participants with diabetes, there were no significant differences in the odds of any coronary plaque, non-calcified plaque, high-risk plaque, and stenosis ≥50% between those with strict versus less strict glycemic control (Table S7).
Sensitivity analysis: fasting plasma glucose in glycemic category definitions
In sensitivity analysis incorporating fasting plasma glucose rather than HbA1c in the definition of glycemic categories, 2,029 participants were included with non-missing fasting plasma glucose (euglycemia: 75.2%; prediabetes: 18.4%; diabetes: 6.5%) (Table S8). A similar pattern of association between glycemic categories and coronary outcomes was observed overall (Table S9) and in stratified analyses according to estimated 10-year ASCVD risk (Table S10) and CAC score strata (Table S11) when incorporating fasting plasma glucose rather than HbA1c in the definitions of glycemic categories (Tables 2–4).
Discussion
We observed several important findings in this community-based cohort of asymptomatic, middle-aged US adults without prior history of CVD. First, there was a graded increase in the extent and severity of coronary artery plaque detected by CCTA across worsening glycemic categories (Graphical Abstract). The prevalence of any coronary plaque increased across categories of euglycemia, prediabetes, and diabetes, with a wider gradient (3- to 4-fold) for high-risk plaque and stenosis ≥50%. Second, the association of glycemic abnormalities with coronary plaque characteristics remained statistically significant after accounting for traditional CVD risk factors and extended to glycemic levels below the threshold for diabetes. Prediabetes was 4 times more common than diabetes in the present study and, compared with euglycemia, was independently associated with higher risk of any coronary plaque, non-calcified plaque, and high-risk plaque. Third, among individuals with diabetes, higher estimated ASCVD risk using the PCE and higher CAC scores were both associated with a higher burden of CCTA-based coronary outcomes. However, the patterns in the prevalence of the estimated risk <5% and ≥20% and of CAC=0 and ≥100, together with their associations with CCTA-based plaque findings, suggest that CAC=0 may be more reassuring (any plaque: 30%; stenosis ≥50%: 3%) than estimated risk <5% (any plaque: 46%; stenosis ≥50%: 10%) for “de-risking” patients with diabetes; and that CAC ≥100 (prevalence: 23%) detects more high-risk patients with diabetes than an estimated risk ≥20% (prevalence: 13%) (Graphical Abstract). Fourth, similar qualitative patterns were observed among participants with prediabetes stratified by PCE and CAC scores.
Prior studies evaluating coronary atherosclerosis using CCTA among asymptomatic individuals with hyperglycemia were limited to adults with diabetes living outside of the US with inclusion of few women and individuals of Hispanic/Latino race/ethnicity (Table S12).14 To the best of our knowledge, the present study is the largest to date of asymptomatic adults in the US with no history of ASCVD across the glycemic spectrum who underwent comprehensive plaque characterization by CCTA. Prediabetes is an important entity to examine as it accounts for more absolute ASCVD events than diabetes, despite the lower relative risk, due to its higher prevalence.2 Rossello, et al demonstrated a graded increase in prevalence of multi-territory subclinical atherosclerosis across higher levels of HbA1c among individuals without diabetes with consistent patterns in the carotid, coronary, iliac and femoral arteries.9 The low prevalence of atherosclerosis observed in the coronary arteries in this prior study compared with other macrovascular beds may be explained by use of CAC to detect atherosclerosis. We observed non-calcified plaque by CCTA in 45% of participants with prediabetes which may potentially be missed by CAC testing if calcified components were absent. Complex coronary plaque observed in dysglycemic states is a culmination of advanced glycation end products and activation of pro-inflammatory signaling pathways with infiltration of macrophages into atherosclerotic lesions.15 Our study findings add to the existing literature and provide insights into the elevated ASCVD risk observed in prediabetes and diabetes as each of the coronary outcomes evaluated are associated with risk of downstream ASCVD and may be future targets for preventive interventions.2, 5, 6 These findings further emphasize the importance of examining dysglycemia beyond a dichotomous threshold (HbA1c < versus ≥6.5%) as a broad range that extends well below diabetes thresholds. The degree of dysglycemia is correlated with the risk of coronary atherosclerosis which builds on prior work identifying the glycemic marker HbA1c as one the strongest predictors of subclinical atherosclerosis in the Progression and Early detection of Subclinical Atherosclerosis (PESA) study.16
Additionally, in the present study, women represented approximately one-half of the study population, consistent with a real-world setting, which is a larger proportion observed in previous studies of CCTA among asymptomatic adults with dysglycemia (Table S12) as well as clinical trials supporting clinical practice guidelines.17 Additional studies enrolling women with dysglycemia are needed to further our understanding of the higher relative risk of CVD associated with diabetes in women compared with men.18 Furthermore, Hispanic/Latino adults comprised nearly one-half of the present study population, far more than prior studies of CCTA in asymptomatic adults with dysglycemia (Table S12). Despite a higher burden of CVD risk factors, Hispanic/Latino individuals have lower risk of CVD compared with other racial/ethnic groups, known as the Hispanic paradox, which may be explained by their lower CAC burden.19 We demonstrated that the prevalence of overall coronary plaque and non-calcified plaque was higher with worsening glycemia among Hispanic/Latino and non-Hispanic White individuals. Future studies with long-term follow-up and CVD outcomes are needed to further evaluate the Hispanic paradox and contextualize the prognostic implications of dysglycemia and coronary atherosclerosis across racial/ethnic groups. Multiple vascular beds are oftentimes affected by atherosclerosis given its systemic nature and further investigation of these territories across the glycemic spectrum is warranted in diverse, asymptomatic populations.
Our study has several important clinical implications. First, among individuals with diabetes, we observed a high burden of coronary plaque, including non-calcified plaque, in those with estimated ASCVD risk <5% and those with CAC score of 0. These findings highlight the accelerated form of atherosclerosis observed in people with diabetes and provide further support for the ACC/AHA primary prevention guideline recommendations, which endorsed consideration of at least moderate-intensity statin therapy in all patients with diabetes, irrespective of their estimated ASCVD risk or their CAC burden.7, 15 However, while current ACC/AHA guidelines recommend using ASCVD risk factors to inform the intensity of statin therapy in patients with diabetes, our findings suggest that CAC may be an informative strategy for this purpose. Specifically, we observed that a CAC score of 0 was more frequent than an estimated ASCVD risk <5% in diabetes (43% vs 25%) and that it provided greater reassurance: the prevalence of any coronary plaque was lower in those with CAC=0 (30% vs. 46%), and the same was true for non-calcified plaque (29% vs. 39%) and stenosis ≥50% (3% vs 10%). Similar study findings would be expected for alternative ASCVD risk prediction tools for the general population incorporating traditional risk factors but diabetes-specific tools, especially those that integrate diabetes duration and glycemia, may enhance risk prediction and require further investigation.20
Second, “de-risking” patients with diabetes may be particularly relevant in the allocation of non-statin add-on preventive therapies, some of which may be costly and/or have significant side effects. While prospective studies are needed to better understand the prognostic implications of CAC=0 among individuals with diabetes treated with statins, recent analyses in prospective cohorts suggest that CAC burden may help guide a personalized allocation of add-on cardioprotective antihyperglycemic medications such as glucagon-like peptide 1 receptor agonists, as well as icosapent ethyl.3, 21 This use of CAC is not discussed in current ACC/AHA guidelines,7 but the National Lipid Association acknowledges this paradigm.22 Our findings expand this body of evidence, showing a strong correlation between CAC burden and highly relevant prognostic findings on CCTA among adults representative of the primary prevention population, and future ACC/AHA prevention guideline updates could consider incorporating guidance on the role of CAC to inform use of preventive therapies.
Third, we observed that prediabetes is characterized by a substantial burden of subclinical coronary atherosclerosis, including high-risk plaque features, that may contribute to the excess risk of ASCVD.2 The prevalence of prediabetes in our study cohort was 30% which resembles the nearly 100 million adults in the US affected by hyperglycemia below the thresholds for diabetes.1 Due to the burden of disease and associated risk, prediabetes accounts for a larger absolute number of ASCVD events than diabetes highlighting the need for effective preventive therapies in this growing population.2 Primordial prevention with an intensive lifestyle intervention is an effective strategy to reduce the incidence of diabetes but had no effect on coronary atherosclerosis.23 This latter null effect may be explained by the duration and intensity of the lifestyle intervention as well as the assessment of only calcified plaque imaged by CAC. In select individuals with prediabetes and elevated risk, therapies targeting reduction in ASCVD may be indicated rather than medications narrowly focusing on prevention of diabetes.
Fourth, CCTA provides detailed information regarding coronary plaque characteristics, such as high-risk plaque features, that are known to be associated with downstream risk of ASCVD and may be helpful in guiding selection of preventive therapies.5, 6 In asymptomatic populations, the FACTOR-64 trial showed no statistically significant difference in major adverse cardiovascular events among patients with diabetes who underwent CCTA screening compared with standard therapy (6.2% vs. 7.6%, p-value = 0.38).24 A potential explanation for the non-significant findings is that management recommendations in the CCTA arm were made based on luminal stenosis and CAC scores and prioritized coronary revascularization, i.e., did not take full advantage of the information that can be obtained from a contemporary CCTA scan. This information could be used to inform more aggressive preventive management in selected individuals. Nonetheless, another plausible explanation is that high-risk plaque findings are relatively infrequent, that most individuals with high-risk plaque features would qualify for aggressive preventive pharmacotherapy, and that a treat-all approach is a powerful paradigm reducing ASCVD events in patients with diabetes. Therefore, the potential value of contemporary CCTA in the management of patients with diabetes requires further evaluation in a randomized clinical trial.
Study limitations
The study findings should be interpreted in the context of limitations. MiHeart recruited participants who had a favorable safety profile to undergo CCTA, including individuals with normal kidney function. This may limit the generalizability of our study findings in prediabetes and diabetes, in which comorbid renal dysfunction is frequent.2 Diabetes accounted for 7% of the overall population with higher statin use and lower LDL-C levels than other groups. Enrollment of a relatively healthy study population may have also underestimated the strength of the associations between glycemic categories and subclinical coronary atherosclerosis.
There were missing data regarding specific glucose markers, such as fasting plasma glucose and glucose tolerance testing, for identification of glycemic categories. Self-report of clinical history may lead to misclassification of glycemic categories. Nonetheless, HbA1c data was available in 99% of participants plus self-reported medical history and medication use were incorporated suggesting participants were likely appropriately classified by glycemic status.
Finally, while this observational, cross-sectional study showed an association between glycemic categories and coronary atherosclerosis, causality cannot be established. Additionally, data regarding incident ASCVD events were not available. Nevertheless, the consistency with prior mechanistic and genetic studies and the dose-response associations observed between worsening glycemic categories and coronary outcomes provide further reassurance.15
Conclusions
Our study findings demonstrate a greater extent and severity of coronary atherosclerosis across worsening glycemic categories independent of traditional CVD risk factors. The excess burden of coronary atherosclerosis observed in diabetes extends to individuals with prediabetes, who accounted for a much larger proportion of the population in MiHeart. In both groups, CAC correlated more closely with CCTA findings than the PCE and was informative in a larger proportion of participants. Longitudinal studies are needed to better understand the prognosis of patients with diabetes and prediabetes, estimated risk <5% or CAC=0, and detectable plaque on CCTA; as well as the potential contemporary role of CCTA in their risk management.
Supplementary Material
CLINICAL PERSPECTIVES.
This study evaluated the prevalence of coronary atherosclerosis assessed by coronary computed tomography angiography (CCTA) across the glycemic spectrum among asymptomatic adults free of atherosclerotic cardiovascular disease enrolled in the Miami Heart Study at Baptist Health South Florida (n = 2,352 participants; euglycemia=63%; prediabetes=30%; diabetes=7%). The prevalence of any coronary plaque was 49% overall with a higher prevalence across worsening glycemic categories (euglycemia: 43%, prediabetes: 58%, diabetes: 69%). A similar pattern of association was observed for non-calcified plaque, plaque with ≥1 high-risk feature, and maximal stenosis ≥50%. The greater burden of coronary atherosclerosis associated with worsening dysglycemia was more closely correlated with coronary artery calcium score compared with 10-year atherosclerotic cardiovascular disease risk estimated from the ACC/AHA Pooled Cohort Equations. These findings suggest that the excess risk of coronary atherosclerosis observed with diabetes extends to prediabetes and coronary artery calcium score was more informative of this risk than the ACC/AHA Pooled Cohort Equations.
ACKNOWLEDGMENTS
The authors thank the Miami Heart Study participants, staff, and investigators. The authors also thank Ms. Rachael Whitehead from the Houston Methodist Research Institute for helping create the illustrations.
SOURCES OF FUNDING
The Miami Heart Study was funded by Baptist Health South Florida. This work was supported in part by National Institutes of Health 1R01-HL146145 (PI Dr. Shah).
ABBREVIATIONS AND ACRONYMS
- ACC/AHA
American College of Cardiology/American Heart Association
- CAC
coronary artery calcium
- CCTA
coronary computed tomography angiography
- MiHeart
Miami Heart Study
- PCE
Pooled Cohort Equations
Footnotes
DISCLOSURES
Dr. Patel has received research support from the National Heart, Lung, and Blood Institute (R21HL169708); has served as a consultant to Novo Nordisk. Dr. Blankstein receives research support from Amgen Inc. and Novartis Inc, and is a consultant to Caristo Diagnostics, Silence Therapeutics, and Roivant Sciences Inc. Dr. Shapiro is on the advisory boards of Amgen, Novartis, and Novo Nordisk and is a consultant for Regeneron. Dr. Pandey has received research support from the National Institute on Aging GEMSSTAR Grant (1R03AG067960-01), the National Institute on Minority Health and Disparities (R01MD017529), and the National Institute of Heart, Lung, and Blood Institute (R21HL169708). Dr. Pandey has received grant funding (to the institution) from Applied Therapeutics, Gilead Sciences, Ultromics, Myovista, and Roche; has served as a consultant for and/or received honoraria outside of the present study as an advisor/consultant for Tricog Health Inc, Lilly USA, Rivus, Cytokinetics, Roche Diagnostics, Sarfez Therapeutics, Edwards Lifesciences, Merck, Bayer, Novo Nordisk, Alleviant, Axon Therapies, and has received nonfinancial support from Pfizer and Merck. Dr. Pandey is also a consultant for Palomarin Inc. with stocks compensation. Dr. Cury declares that he is consultant to GE Healthcare, Covera Health, and Cleerly. Dr. Nasir is on the advisory board of Amgen, Novartis, Novo Nordisk, and his research is partly supported by the Jerold B. Katz Academy of Translational Research. Dr. Cainzos-Achirica and Dr. Nasir are part of the steering committee of the PAK-SEHAT study which is partly funded by Getz Pharma. The rest of authors declare that they have no conflicts of interest relevant to the content of this manuscript.
REFERENCES
- 1.Centers for Disease Control and Prevention. National Diabetes Statistics Report website. https://www.cdc.gov/diabetes/data/statistics-report/index.html. Accessed 08/29/2022.
- 2.Honigberg MC, Zekavat SM, Pirruccello JP, Natarajan P and Vaduganathan M. Cardiovascular and Kidney Outcomes Across the Glycemic Spectrum: Insights From the UK Biobank. J Am Coll Cardiol. 2021;78:453–464. [DOI] [PMC free article] [PubMed] [Google Scholar]
- 3.Cainzos-Achirica M, Patel KV, Quispe R, Joshi PH, Khera A, Ayers C, Lima JAC, Rana JS, Greenland P, Bittencourt MS, et al. Coronary Artery Calcium for the Allocation of GLP-1RA for Primary Prevention of Atherosclerotic Cardiovascular Disease. JACC Cardiovasc Imaging. 2021;14:1470–1472. [DOI] [PubMed] [Google Scholar]
- 4.Hubbard D, Colantonio LD, Tanner RM, Carson AP, Sakhuja S, Jaeger BC, Carey RM, Cohen LP, Shimbo D, Butler M, et al. Prediabetes and Risk for Cardiovascular Disease by Hypertension Status in Black Adults: The Jackson Heart Study. Diabetes Care. 2019;42:2322–2329. [DOI] [PMC free article] [PubMed] [Google Scholar]
- 5.Motoyama S, Ito H, Sarai M, Kondo T, Kawai H, Nagahara Y, Harigaya H, Kan S, Anno H, Takahashi H, et al. Plaque Characterization by Coronary Computed Tomography Angiography and the Likelihood of Acute Coronary Events in Mid-Term Follow-Up. J Am Coll Cardiol. 2015;66:337–46. [DOI] [PubMed] [Google Scholar]
- 6.Nerlekar N, Ha FJ, Cheshire C, Rashid H, Cameron JD, Wong DT, Seneviratne S and Brown AJ. Computed Tomographic Coronary Angiography-Derived Plaque Characteristics Predict Major Adverse Cardiovascular Events: A Systematic Review and Meta-Analysis. Circ Cardiovasc Imaging. 2018;11:e006973. [DOI] [PubMed] [Google Scholar]
- 7.Arnett DK, Blumenthal RS, Albert MA, Buroker AB, Goldberger ZD, Hahn EJ, Himmelfarb CD, Khera A, Lloyd-Jones D, McEvoy JW, et al. 2019 ACC/AHA Guideline on the Primary Prevention of Cardiovascular Disease: A Report of the American College of Cardiology/American Heart Association Task Force on Clinical Practice Guidelines. Circulation. 2019;140:e596–e646. [DOI] [PMC free article] [PubMed] [Google Scholar]
- 8.Valenti V, Hartaigh BO, Cho I, Schulman-Marcus J, Gransar H, Heo R, Truong QA, Shaw LJ, Knapper J, Kelkar AA, et al. Absence of Coronary Artery Calcium Identifies Asymptomatic Diabetic Individuals at Low Near-Term But Not Long-Term Risk of Mortality: A 15-Year Follow-Up Study of 9715 Patients. Circ Cardiovasc Imaging. 2016;9:e003528. [DOI] [PMC free article] [PubMed] [Google Scholar]
- 9.Rossello X, Raposeiras-Roubin S, Oliva B, Sanchez-Cabo F, Garcia-Ruiz JM, Caimari F, Mendiguren JM, Lara-Pezzi E, Bueno H, Fernandez-Friera L, et al. Glycated Hemoglobin and Subclinical Atherosclerosis in People Without Diabetes. J Am Coll Cardiol. 2021;77:2777–2791. [DOI] [PubMed] [Google Scholar]
- 10.Nasir K, Cainzos-Achirica M, Valero-Elizondo J, Ali SS, Havistin R, Lakshman S, Blaha MJ, Blankstein R, Shapiro MD, Arias L, et al. Coronary Atherosclerosis in an Asymptomatic U.S. Population: Miami Heart Study at Baptist Health South Florida. JACC Cardiovasc Imaging. 2022;15:1604–1618. [DOI] [PubMed] [Google Scholar]
- 11.Nasir K, Ziffer JA, Cainzos-Achirica M, Ali SS, Feldman DI, Arias L, Saxena A, Feldman T, Cury R, Budoff MJ, et al. The Miami Heart Study (MiHeart) at Baptist Health South Florida, A prospective study of subclinical cardiovascular disease and emerging cardiovascular risk factors in asymptomatic young and middle-aged adults: The Miami Heart Study: Rationale and Design. Am J Prev Cardiol. 2021;7:100202. [DOI] [PMC free article] [PubMed] [Google Scholar]
- 12.Goff DC Jr., Lloyd-Jones DM, Bennett G, Coady S, D’Agostino RB Sr., Gibbons R, Greenland P, Lackland DT, Levy D, O’Donnell CJ, et al. and American College of Cardiology/American Heart Association Task Force on Practice G. 2013 ACC/AHA guideline on the assessment of cardiovascular risk: a report of the American College of Cardiology/American Heart Association Task Force on Practice Guidelines. J Am Coll Cardiol. 2014;63:2935–59. [DOI] [PMC free article] [PubMed] [Google Scholar]
- 13.American Diabetes Association Professional Practice C, Draznin B, Aroda VR, Bakris G, Benson G, Brown FM, Freeman R, Green J, Huang E, Isaacs D, Kahan S, et al. 2. Classification and Diagnosis of Diabetes: Standards of Medical Care in Diabetes-2022. Diabetes Care. 2022;45:S17–S38. [DOI] [PubMed] [Google Scholar]
- 14.Celeng C, Maurovich-Horvat P, Ghoshhajra BB, Merkely B, Leiner T and Takx RA. Prognostic Value of Coronary Computed Tomography Angiography in Patients With Diabetes: A Meta-analysis. Diabetes Care. 2016;39:1274–80. [DOI] [PubMed] [Google Scholar]
- 15.Yahagi K, Kolodgie FD, Lutter C, Mori H, Romero ME, Finn AV and Virmani R. Pathology of Human Coronary and Carotid Artery Atherosclerosis and Vascular Calcification in Diabetes Mellitus. Arterioscler Thromb Vasc Biol. 2017;37:191–204. [DOI] [PMC free article] [PubMed] [Google Scholar]
- 16.Sanchez-Cabo F, Rossello X, Fuster V, Benito F, Manzano JP, Silla JC, Fernandez-Alvira JM, Oliva B, Fernandez-Friera L, Lopez-Melgar B, et al. Machine Learning Improves Cardiovascular Risk Definition for Young, Asymptomatic Individuals. J Am Coll Cardiol. 2020;76:1674–1685. [DOI] [PubMed] [Google Scholar]
- 17.Mas-Llado C, Gonzalez-Del-Hoyo M, Siquier-Padilla J, Blaya-Pena L, Coughlan JJ, de la Villa BG, Peral V and Rossello X. Representativeness in randomised clinical trials supporting acute coronary syndrome guidelines. Eur Heart J Qual Care Clin Outcomes. 2023; qcad007, 10.1093/ehjqcco/qcad007. [DOI] [PMC free article] [PubMed] [Google Scholar]
- 18.Regensteiner JG, Golden S, Huebschmann AG, Barrett-Connor E, Chang AY, Chyun D, Fox CS, Kim C, Mehta N, Reckelhoff JF, et al. , American Heart Association Diabetes Committee of the Council on L, Cardiometabolic Health CoE, Prevention CoFG, Translational B and Council on H. Sex Differences in the Cardiovascular Consequences of Diabetes Mellitus: A Scientific Statement From the American Heart Association. Circulation. 2015;132:2424–47. [DOI] [PubMed] [Google Scholar]
- 19.Reaven PD, Sacks J, Investigators for the Veterans Affairs Cooperative Study of Glycemic C and Complications in Diabetes Mellitus T. Reduced coronary artery and abdominal aortic calcification in Hispanics with type 2 diabetes. Diabetes Care. 2004;27:1115–20. [DOI] [PubMed] [Google Scholar]
- 20.Rossello X, Dorresteijn JA, Janssen A, Lambrinou E, Scherrenberg M, Bonnefoy-Cudraz E, Cobain M, Piepoli MF, Visseren FL, Dendale P, This Paper Is AC-PBEJOPCEHJACC and European Journal Of Cardiovascular N. Risk prediction tools in cardiovascular disease prevention: A report from the ESC Prevention of CVD Programme led by the European Association of Preventive Cardiology (EAPC) in collaboration with the Acute Cardiovascular Care Association (ACCA) and the Association of Cardiovascular Nursing and Allied Professions (ACNAP). Eur J Prev Cardiol. 2019;26:1534–1544. [DOI] [PubMed] [Google Scholar]
- 21.Cainzos-Achirica M, Quispe R, Dudum R, Greenland P, Lloyd-Jones D, Rana JS, Lima JAC, Doria de Vasconcellos H, Joshi PH, Khera A, et al. CAC for Risk Stratification Among Individuals With Hypertriglyceridemia Free of Clinical Atherosclerotic Cardiovascular Disease. JACC Cardiovasc Imaging. 2022;15:641–651. [DOI] [PubMed] [Google Scholar]
- 22.Orringer CE, Blaha MJ, Blankstein R, Budoff MJ, Goldberg RB, Gill EA, Maki KC, Mehta L and Jacobson TA. The National Lipid Association scientific statement on coronary artery calcium scoring to guide preventive strategies for ASCVD risk reduction. J Clin Lipidol. 2021;15:33–60. [DOI] [PubMed] [Google Scholar]
- 23.Goldberg RB, Aroda VR, Bluemke DA, Barrett-Connor E, Budoff M, Crandall JP, Dabelea D, Horton ES, Mather KJ, Orchard TJ, et al. , and Diabetes Prevention Program Research G. Effect of Long-Term Metformin and Lifestyle in the Diabetes Prevention Program and Its Outcome Study on Coronary Artery Calcium. Circulation. 2017;136:52–64. [DOI] [PMC free article] [PubMed] [Google Scholar]
- 24.Muhlestein JB, Lappe DL, Lima JA, Rosen BD, May HT, Knight S, Bluemke DA, Towner SR, Le V, Bair TL, et al. Effect of screening for coronary artery disease using CT angiography on mortality and cardiac events in high-risk patients with diabetes: the FACTOR-64 randomized clinical trial. JAMA. 2014;312:2234–43. [DOI] [PubMed] [Google Scholar]
- 25.Iwasaki K, Matsumoto T, Aono H, Furukawa H and Samukawa M. Prevalence of subclinical atherosclerosis in asymptomatic diabetic patients by 64-slice computed tomography. Coron Artery Dis. 2008;19:195–201. [DOI] [PubMed] [Google Scholar]
- 26.Park GM, Lee SW, Cho YR, Kim CJ, Cho JS, Park MW, Her SH, Ahn JM, Lee JY, Park DW, et al. Coronary computed tomographic angiographic findings in asymptomatic patients with type 2 diabetes mellitus. Am J Cardiol. 2014;113:765–71. [DOI] [PubMed] [Google Scholar]
- 27.Kim JJ, Hwang BH, Choi IJ, Choo EH, Lim S, Kim JK, Koh YS, Kim DB, Jang SW, Cho EJ, et al. Impact of diabetes duration on the extent and severity of coronary atheroma burden and long-term clinical outcome in asymptomatic type 2 diabetic patients: evaluation by Coronary CT angiography. Eur Heart J Cardiovasc Imaging. 2015;16:1065–73. [DOI] [PubMed] [Google Scholar]
- 28.van den Hoogen IJ, de Graaf MA, Roos CJ, Leen AC, Kharagjitsingh AV, Wolterbeek R, Kroft LJ, Wouter Jukema J, Bax JJ and Scholte AJ. Prognostic value of coronary computed tomography angiography in diabetic patients without chest pain syndrome. J Nucl Cardiol. 2016;23:24–36. [DOI] [PMC free article] [PubMed] [Google Scholar]
- 29.Lee KY, Hwang BH, Kim TH, Kim CJ, Kim JJ, Choo EH, Choi IJ, Choi Y, Park HW, Koh YS, et al. Computed Tomography Angiography Images of Coronary Artery Stenosis Provide a Better Prediction of Risk Than Traditional Risk Factors in Asymptomatic Individuals With Type 2 Diabetes: A Long-term Study of Clinical Outcomes. Diabetes Care. 2017;40:1241–1248. [DOI] [PubMed] [Google Scholar]
Associated Data
This section collects any data citations, data availability statements, or supplementary materials included in this article.