Abstract
Purpose
Loss of auditory nerve afferent synapses with cochlear hair cells, called cochlear synaptopathy, is a common pathology in humans caused by aging and noise overexposure. The perceptual consequences of synaptopathy in isolation from other cochlear pathologies are still unclear. Animal models provide an effective approach to resolve uncertainty regarding the physiological and perceptual consequences of auditory nerve loss, because neural lesions can be induced and readily quantified. The budgerigar, a parakeet species, has recently emerged as an animal model for synaptopathy studies based on its capacity for vocal learning and ability to behaviorally discriminate simple and complex sounds with acuity similar to humans. Kainic acid infusions in the budgerigar produce a profound reduction of compound auditory nerve responses, including wave I of the auditory brainstem response, without impacting physiological hair cell measures. These results suggest selective auditory nerve damage. However, histological correlates of neural injury from kainic acid are still lacking.
Methods
We quantified the histological effects caused by intracochlear infusion of kainic acid (1 mM; 2.5 µL), and evaluated correlations between the histological and physiological assessments of auditory nerve status.
Results
Kainic acid infusion in budgerigars produced pronounced loss of neural auditory nerve soma (60% on average) in the cochlear ganglion, and of peripheral axons, at time points 2 or more months following injury. The hair cell epithelium was unaffected by kainic acid. Neural loss was significantly correlated with reduction of compound auditory nerve responses and auditory brainstem response wave I.
Conclusion
Compound auditory nerve responses and wave I provide a useful index of cochlear synaptopathy in this animal model.
Keywords: Auditory brainstem response, Budgerigar, Cochlear histology, Cochlear synaptopathy, Compound action potential, Kainic-acid excitotoxicity
Introduction
Loss of afferent synapses between cochlear hair cells (HCs) and auditory nerve (AN) neurons, called cochlear synaptopathy, is a common pathology in humans [1–3]. Cochlear synaptopathy is often hypothesized to cause listening difficulties in noise, known as “hidden hearing loss” because this pathology is not detectable with standard clinical tools including the pure-tone audiogram. However, human studies have so far provided mixed results as to whether synaptopathy causes hidden hearing loss (associations: [4, 5]; no associations: [6–8]), potentially due to the difficulty of accurately measuring synaptopathy in living humans subjects.
Animal models provide an effective approach for advancing our understanding of physiological and perceptual consequences of cochlear synaptopathy. Unlike in humans, AN loss can be directly induced and assessed by both histological and physiological measurements (see [9] for review). Cochlear synaptopathy in animal models can be produced by noise exposure, where the frequency band and sound level of the noise are carefully controlled to limit damage to delicate cochlear HCs [10–12]. Alternatively, cochlear infusion of neurotoxic agents such as kainic acid (KA) or ouabain has the advantage of inducing profound AN loss/synaptopathy without adversely impacting HCs or HC function [13–15].
KA, the neurotoxic agent used in the present study, is an analog of the neurotransmitter glutamate. KA induces selective degeneration in neurons receiving rich glutamatergic innervation [16], such as the spiral ganglion neurons that make up the AN. KA infusion causes immediate swelling of the afferent terminals at the base of inner HCs [17], with substantial degeneration of ganglion neurons observed 10 days after infusion in rat [18]. Similar physiological and morphological effects of KA have been reported in various model species including chicken [19, 20], guinea pig [17], rat [18], chinchilla [21], and mice [22, 23].
The budgerigar is a parakeet species that has been used in several prior behavioral studies of cochlear synaptopathy based on their sensitive low-frequency hearing and ability to perform operant-conditioning tasks with many simple and complex sounds [24–31]. In budgerigars, intracochlear infusion of KA produces similar physiological effects as in many other species, including reduced amplitude of auditory brainstem response (ABR) wave I, AN compound action potentials (CAPs) [15, 32], and envelope following responses evoked by sinusoidally amplitude-modulated tones [33]. Furthermore, preservation of the cochlear microphonic, distortion-product otoacoustic emissions, and ABR thresholds following KA exposure all suggest preserved function of HCs [15, 32]. Perhaps surprisingly, given 40–70% reduction of compound AN responses, behavioral studies have found minimal impact of KA exposure on several challenging tasks including detection of short tones [32] and tones masked by narrowband noise [34].
Notably absent, histological studies of the impact of KA infusion on cochlear morphology in budgerigars have not yet been conducted. In this study, we quantified histological changes in the cochlear ganglion (known as the spiral ganglion in mammals), AN peripheral axons, and the HC epithelium caused by KA exposure. Furthermore, we evaluated correlations between the histological and physiological assessments of AN status.
Methods
Experiments were performed using budgerigars of both sexes (5 male, 10 female, 2 unsexed; aged 4–78 months) and were approved by the University of Rochester Committee on Animal Resources. Animals received either no KA infusion (10 animals), unilateral KA infusion (3 animals), or bilateral KA infusion (4 animals). Depending on the time span between KA infusion and cochlear dissection, the KA-exposed group was further subdivided into short-term (≤ 2 months post KA; 2 birds) and long-term (> 2 months post KA; 5 birds) survival times.
KA Infusions and CAP Recording Procedures
Procedures for infusing KA into the budgerigar cochlea and recording CAPs have been reported previously [15, 32, 33]. Briefly, anesthesia was induced with a subcutaneous injection of ketamine (5–6 mg/kg) and dexmedetomidine (0.09–0.11 mg/kg), and maintained throughout the procedure with slow infusion of ketamine (6–10 mg/kg/h) and dexmedetomidine (0.16–0.2 mg/kg/h) via an anesthetic infusion pump (Razel Scientific; Fairfax, VT, USA). Animals were maintained at 39.5–41.5 °C body temperature, measured with a sensor taped under the wing, with respiratory rate and electrocardiogram monitored continuously.
A ~ 150-µm cochleostomy was made following a craniotomy for exposing the basal prominence of the cochlea within the middle-ear space. 2.5 μL of 1-mM KA was administered slowly (full dose over 90 s) through the cochleostomy. Atropine (0.01 mg/kg) was administered preceding the KA infusion to minimize the possibility of cardiac arrhythmias. Following the infusion procedure, animals were given atipamezole (0.5 mg/kg) subcutaneously for anesthesia reversal. The analgesic carprofen (1 mg/kg) was given prior to the procedure and once daily for 3 days after the procedure.
CAPs were recorded using an 80-μm tungsten wire place in contact with the perilymph at the cochleostomy site. The measurement was performed in a double-walled acoustic isolation booth immediately before and after KA infusion. CAP measurements were also made prior to harvesting of cochlear tissue when possible. Stimuli were presented through a free-field loudspeaker positioned 45.7 cm in front of the animal’s head. CAP stimuli were 0.1-ms clicks (both polarities) presented at 35–90 dB peak-equivalent sound pressure levels (p.e. SPLs) with 5–10 dB steps, and 0.5, 1, 2, 3, and 4-kHz tones with 10-ms duration, presented at 40–70 dB SPL with 10 dB steps. Tone-CAP stimuli had 1-ms raised-cosine shaped onset and offset ramps.
CAP amplitude provides a measure of summed AN activity related to the number and synchrony of single-unit onset responses. CAPs were calculated as the average response to 100 clicks or 50 tone pips presentations. CAP amplitude was quantified as the voltage difference between the first negative peak and subsequent positive peak in the averaged CAP response (see [15]). The latency of the CAP was quantified as the time difference between stimulus arrival at the ear canal and the first negative CAP peak.
Processing of Cochlear Tissue
Animals were sacrificed with an injection of ketamine (30 mg, or to effect) into the breast muscle. Cochleae were dissected and immediately fixed with 4% paraformaldehyde in 10-mM phosphate-buffered saline (PBS, pH 7.4) at room temperature for 3 h. Small openings were made at the end of the lagena (apex), the oval window, and in one of the semicircular canals to facilitate fixation of the inner portions of the cochlea. Thereafter, 0.12-M ethylene diamine tetra-acetic acid (EDTA) was used to decalcify the cochlea for ~ 7 days. After decalcification, the cochlea was washed with 0.1-M PBS, transitioned to 15% and then 30% sucrose in 0.1-M PBS, incubated at 4 °C overnight, and then embedded in 14% gelatin in 10% sucrose solution. The embedded tissue was frozen sectioned at 40-μm thickness on a cryostat (Leica CM1800), with the plane of sectioning oriented approximately perpendicular to the longitudinal axis of the cochlea prior to the basal curvature.
Immunostaining was performed on the frozen cross-section samples of the bird cochlea. The sample was first blocked for 30 min in 10% goat serum with 3% bovine serum albumin, and then incubated for 2 h at room temperature and overnight at 4 °C (or for 48 h at 4 °C without any time at room temperature) with anti-myosin VIIa (MYO7A) primary antibodies. Incubation of species-appropriate secondary antibody coupled to Alexa Fluor dyes was performed following the primary incubation at room temperature for 2 h. 4′,6-Diamidino-2-phenylindole (DAPI) was used for nuclear staining. Eighty-two percent of the samples were stained with the mouse anti-MYO7A (Developmental Studies Hybridoma Bank) at 1:50, 1:100, or 1:200 as the primary antibodies, and 13% of the samples were stained with rabbit anti-MYO7A (Proteus) at 1:200 and 1:400, and 5% of the samples were stained with both MYO7A protocols. The selection of MYO7A antibodies was based on availability and is discussed in more detail below.
Confocal Image Acquisition and Analysis
The fluorescence images were obtained using a laser scanning confocal microscope (A1R HD Nikon, Japan) at 20× and 40× magnification. Z-sections were recorded at 1.15–1.79 μm (20×) and 0.38–0.63 μm (40×) intervals. Image analysis was conducted offline using ImageJ and custom-written MATLAB programs. The percent location along the ganglion axis was determined by the relative distance of each section from the apical to the basal extreme of the ganglion. The apical end was marked as 0% and basal end was marked as 100%. The mapping between cochlear locations and estimated characteristic frequency (CF) was based on Gleich and colleagues’ approximation using the behavioral audiogram [35].
Staining with MYO7A effectively labeled HCs, cochlear ganglion neurons (avian equivalent of spiral ganglion in mammals), and AN axons in the budgerigar cochlea. These cochlear structures were clearly distinguishable by their morphology (Fig. 1). For each frozen section, quantifications were made from a single z-plane with the highest average brightness of the DAPI and MYO7A channels, and were conducted by two trained observers who were blinded to the bird and section information.
Fig. 1.
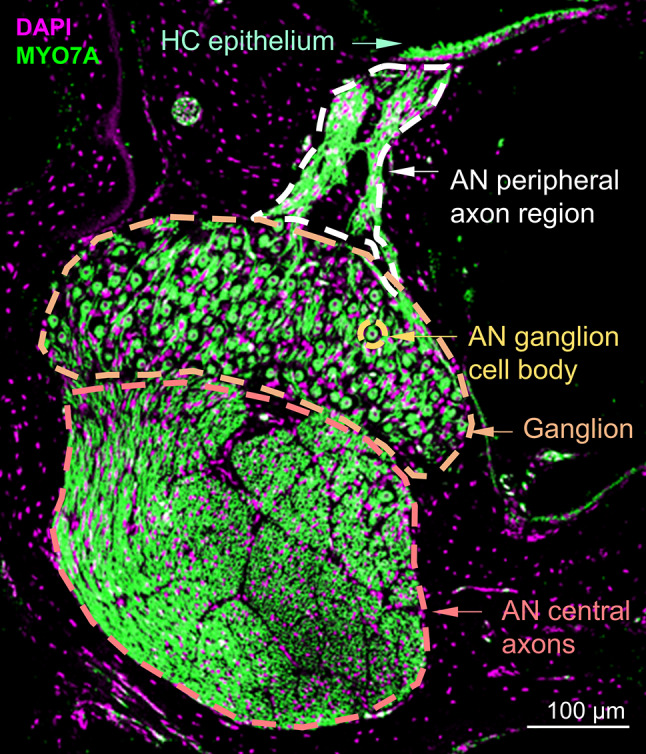
Cochlear histology. Representative frozen cross section of the budgerigar cochlea from a control animal. The location of the section is 78% the distance from the apical to the basal end of the cochlear ganglion. The section shows the hair-cell (HC) epithelium, auditory-nerve (AN) peripheral axon region, AN central axons, an AN fiber cell body, and the cochlear ganglion
HC counts and width of the HC epithelium were measured at 40×. The top edge of all HCs presented in the z-plane was marked, smoothed by a smoothing-spline (MATLAB fit() function), and calibration corrected to generate accurate papilla width measurements. Ganglion neuron counts and AN peripheral axon density were measured from 20× images. The presence of a neuron was determined by the shape of the cell body and the presence of the nucleus. The measurement for AN peripheral axon density was conducted by first semi-automatically identifying the axon region boundaries (custom-written edge-finding program). Then, the axon density was estimated as the percentage of pixels within the axon region boundaries that passed a threshold. The thresholds were the 87.5th percentile of the fluorescent intensities of the HC regions times a scale factor that was determined separately for mouse anti-MYO7A (0.235) and rabbit anti-MYO7A (0.325). The 87.5th percentile was selected because it represented the fluorescent intensity of the HC robustly across different sections. The different scale factors were selected to produce equivalent results between MYO7A antibodies for sections processed with both staining protocols.
Statistical Analyses
Linear mixed-effects models [36] were used to analyze the effects of KA exposure and other independent variables on histological measures while accounting for repeated measures (R, version 4.1.0). The dependent variables were HC epithelium width, HC count, ganglion cell count, and AN peripheral axon density. Independent variables included KA-exposure status (between-subjects effect) and percent location along the ganglion axis (within-subjects effect). The percent location was modeled as categorical factor when the relationship was non-linear (i.e., for AN peripheral axon density and ganglion cell counts); otherwise, percent location was modeled as a continuous variable. Subject intercepts were modeled as random effect. ANOVA tests for effect terms including two-way interactions were performed using the Satterthwaite method for approximating denominator degrees of freedom for F-tests. Pairwise comparisons were conducted by comparing the differences of least squares means using Satterthwaite’s approximation to degrees of freedom [difflsmeans()]. Linear regression analyses were conducted in MATLAB with fitlm().
Results
Histology
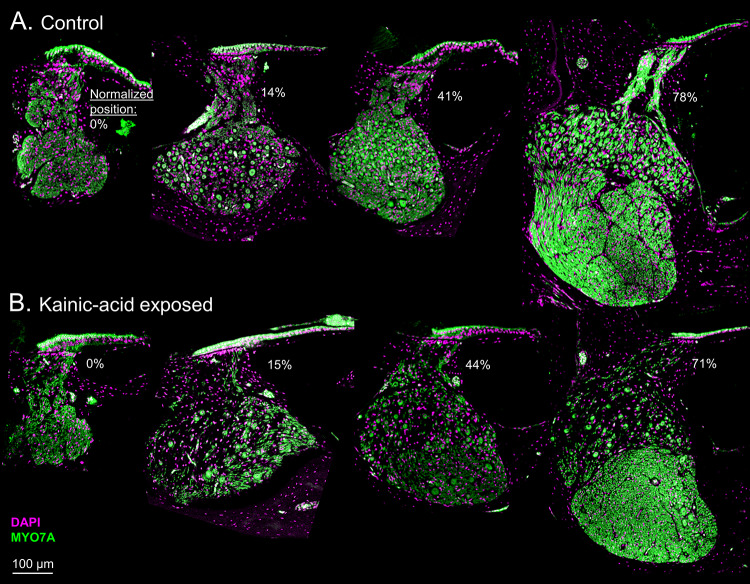
Cochleae obtained from 12 budgerigars (control ears: n = 12; KA-exposed ears: n = 11) were processed as frozen sections through standard immunohistochemical techniques and stained with DAPI and anti-myosin VIIa (MYO7A) primary antibodies. Three out of 11 KA-exposed ears had a post-KA survival time ranging from 59 to 63 days and were assigned to the short-term KA-exposed group. The remaining ears were considered long-term KA-exposed, with post-KA survival times ranging from 497 to 1829 days. The HCs, distal AN fibers, and ganglion neurons were clearly visible in the cross-sections (Fig. 1). Cochlear locations were sampled along the full-length of the ganglion. Note that the plane of sectioning was in some cases not strictly perpendicular to longitudinal axis of the cochlea, due to variation in the mounting procedure for the embedded tissue and the fact that no adjustments were made of the sectioning angle for curvature of the sensory epithelium in the basal third of the organ. Representative sections at different locations along the length of the ganglion in control and KA-exposed ears are presented in Fig. 2.
Fig. 2.
Comparison between representative control (A) and kainic acid (KA)-exposed (B) frozen cross-sections at different cochlear locations (marked below the HC epithelium in each panel). Normalized position is the percent distance from the apical to the basal end of the cochlear ganglion. Note that there are no ganglion cells in the left column because the ganglion does not extend to the extreme apical end of the HC epithelium. KA visibly reduces density of ganglion cells and distal AN fibers without impacting the HC epithelium
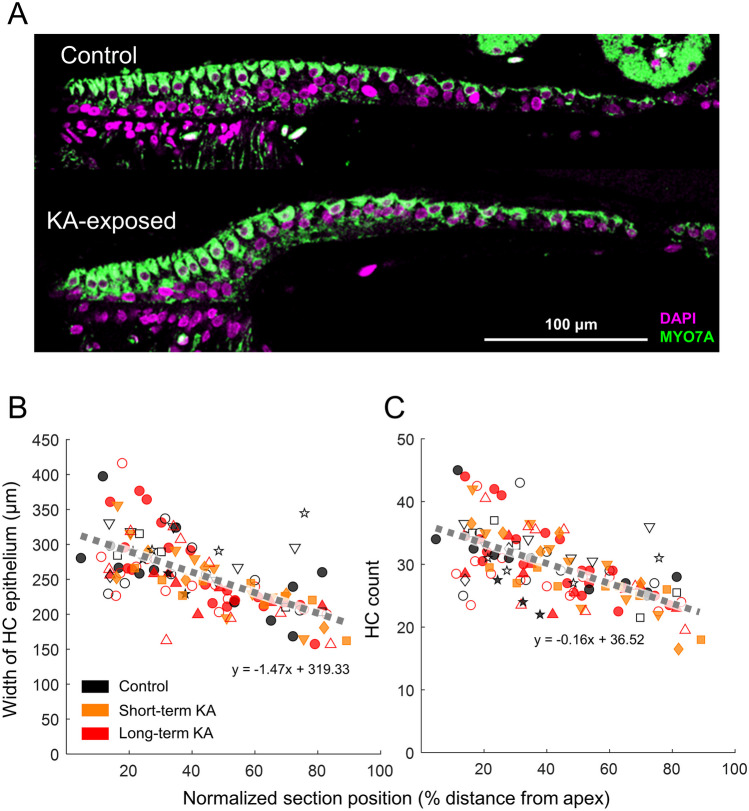
No morphological differences were apparent for the HC epithelium between control and KA-exposed cochleae (Fig. 3A). The width of the epithelium and the number of HCs decreased from the apical to basal end along the full-length of the sectioning axis (Fig. 3B, C; 0% HC: first occurrence of HC at the apical end of the cochlea). A mixed-model analysis showed significant effects of cochlear location on both HC epithelium width (F1,102 = 70.58, p < 0.0001) and the number of HCs (F1,98 = 82.51, p < 0.0001). KA-exposure status (including control, short-term KA-exposure, or long-term KA-exposure) and the interaction between cochlear location and the KA-exposure status did not have significant effects on either HC epithelium width (KA-status: F2,94 = 0.55, p = 0.58; KA-location interaction: F2,102 = 2.49, p = 0.09) or number of HCs (KA-status: F2,74 = 1.72, p = 0.19; KA-location interaction: F2,98 = 2.56, p = 0.08). In general, the number of HCs and width of the HC epithelium reduced near-linearly from 34 cells/304 µm at the apical end (10% HC) to 22 cells/191 µm at the basal end (87% HC). HC density, defined as the ratio of the HC count to the width of HC epithelium, remained relatively consistent throughout the full-length of the cochlea (~ 11 cells/100 µm).
Fig. 3.
No impact of KA exposure on HCs. A Representative sections of HC epithelium from control (upper) and KA-exposed (bottom) ears, taken at 40× magnification. Quantification of the width of the HC epithelium (B) and HC number (C) are shown as a function of position along the sectioning axis (0% and 100%: first and last occurrence of HCs, respectively, from apex to base). Gray dashed lines represent a linear fit to data from all groups. Open symbols represent the left ear; filled symbols represents the right ear. Data from animals that had both histological and physiological quantifications are presented by symbols other than circles: up-pointing triangle (△) bird K25; down-pointing triangle (▽) bird K24; square (□) bird K36; diamond (◇) bird K33; star (☆) bird K35
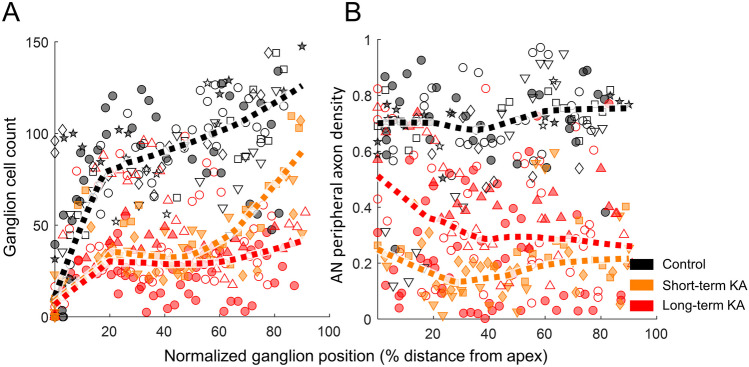
The cochlear ganglion of budgerigars was found to be shorter in length than the HC epithelium. The number of ganglion neurons was also quantified along the full-length of ganglion, where 0% represents the first occurrence of ganglion cell bodies at the apical end of each cochlea and 100% is the last occurrence of ganglion cells basally. The number of ganglion neurons was found to increase sharply from 0 to 20% locations, and then continues to increase at more basal locations (Fig. 4A).
Fig. 4.
KA exposure reduces the number of ganglion neurons (A) and AN peripheral axon density (B) along the ganglion axis (0% apex, 100% base). Colored dashed lines show smoothed data from each group. Smoothing was performed by robust locally weighted scatterplot smoothing, with a smoothing parameter of 0.5. Individual ears are presented by the same symbols as in Fig. 3
In cochlear sections obtained from KA-exposed animals, the number of ganglion neurons was significantly reduced, with apparently similar percent reduction across cochlear regions (Fig. 4A). The morphology of individual surviving ganglion neurons appeared unchanged (Fig. 2). A mixed-model analysis of log-transformed ganglion-cell count was performed with cochlear locations categorized into apical (5–35% distance from apex to base), middle (35–65%), and basal (65–95%) regions. Significant effects of cochlear location (F3,349 = 182.99, p < 0.0001), KA-status (F2,20 = 13.79, p = 0.0002), and the KA by location interaction (F6,350 = 2.20, p = 0.043) were found on log-transformed ganglion-cell count. The interaction was attributable to slightly greater consistency of KA differences in middle and basal cochlear regions (Fig. 4A). Post hoc tests revealed no significant difference between the ganglion neuron counts of short- and long-term KA-exposed ears (mean difference ± SE 0.402 ± 0.280, t19 = 1.43, p = 0.17).
To summarize, in control ears, the typical number of ganglion neurons was 79.5 ± 19.4, 93.5 ± 17.0, and 110.5 ± 22.4 (medians ± median absolute deviation [MAD]) in apical, middle, and basal regions, respectively. When pooling short- and long-term KA-exposed sections, the number of ganglion neurons in KA-exposed ears was 34.0 ± 16.8, 32.0 ± 13.9, and 45.2 ± 18, in these same regions (median ± MAD). These results indicate an average neural loss of 57.2%, 65.8%, and 59.1% in apical, middle, and basal ganglion regions, respectively.
The AN peripheral axons connect the HC epithelium and ganglion cell bodies, and could feasibly degenerate prior to neural soma following kainic acid exposure. We quantified the axon density as the proportion of pixels in the AN peripheral axon region (see example region circled by white dashed line in Fig. 1B) for which MYO7A fluorescent intensity passed a threshold defined based on the fluorescent intensity of the HC epithelium. The axon density along the full-length of ganglion was found to be similar (Fig. 4B). A mixed-model analysis showed no significant effect of cochlear location on log-transformed fiber density (F3,290 = 2.44, p = 0.064). The peripheral axon density was 0.71 ± 0.11 (median ± MAD) in control ears and 0.25 ± 0.16 (median ± MAD) in KA-exposed ears, consistent with 65% loss of AN peripheral axons after KA-exposure. Similar to the analysis of ganglion neurons, the mixed-model analysis of log-transformed peripheral axon density showed a significant effect of KA (F2,21 = 11.49 p = 0.0004) and the KA by location interaction (F6,291 = 5.80 p < 0.0001), with no significant difference found between short- and long-term KA exposures (− 0.493 ± 0.340, t20 = − 1.45, p = 0.16). Once again, the KA by location interaction was driven by greater consistency of KA differences in middle and basal regions of the ganglion (Fig. 4B).
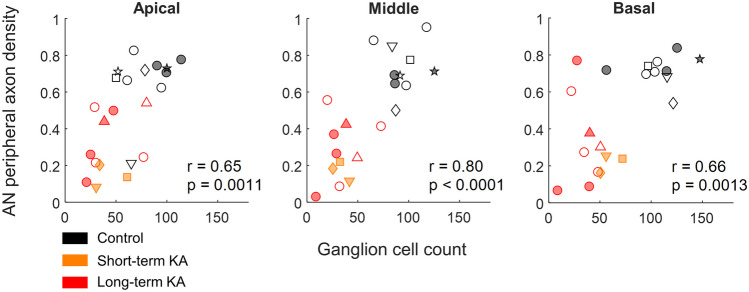
Finally, we evaluated correlations between median ganglion cell count and fiber density within each of the three regions. Significant correlations were observed in all cases, with the strongest relationship observed in the middle region of the ganglion (Fig. 5).
Fig. 5.
Correlations between the median number of ganglion neurons and median AN peripheral axon density in three regions of the budgerigar cochlear ganglion (apical: 5–35%; middle: 35–65%; basal: 65–95%). Each dot represents the median value within one of the three regions in a single ear. Individual ears are presented by the same symbols as in Fig. 3
Compound Action Potentials (CAPs) or the Auditory Nerve
CAPs were recorded in in 9 animals (control ears: n = 6, KA-exposed ears: n = 4) in response to clicks (Fig. 6A) and 10-ms tone pips (0.5, 1, 2, 3, and 4 kHz) presented over a range of levels. In KA-exposed ears, CAP measurements were taken before KA infusion and several months later, immediately prior to cochlear dissection. Post-KA survival time for short-term KA-exposed animal was 59 to 63 days, and for long-term KA-exposed animal was 497 to 1829 days. Both CAP and histological results were obtained from 2 control ears and 4 KA-exposed ears; the same symbols are used to represent these ears in both sets of results.
Fig. 6.
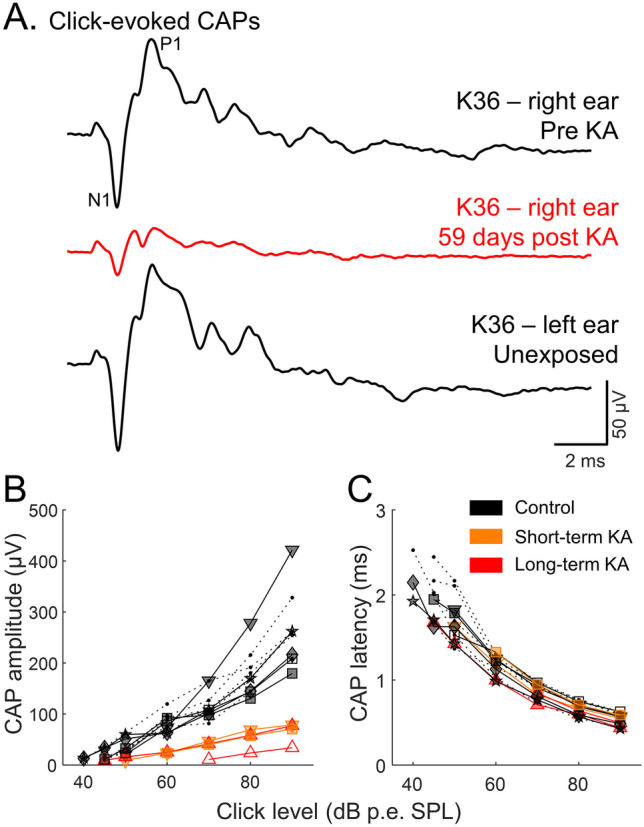
Representative click-evoked compound action potential (CAP) waveforms (A) recorded before and 59 days post KA. The CAP waveform of the unexposed (left) ear is also shown. CAP amplitude was calculated as P1 – N1. KA exposure reduces click-evoked CAP amplitude (B) without affecting CAP latency (C). Data from animals that had both histological and physiological quantifications are presented by symbols other than filled circles with dashed lines: up-pointing triangle (△) bird K25; down-pointing triangle (▽) bird K24; square (□) bird K36; diamond (◇) bird K33; star (☆) bird K35
In control ears, the amplitude and latency (relative to stimulus arrival at the ear canal) of click-evoked CAPs obtained with a p.e. SPL of 90 dB were 257.88 ± 46.83 μV and 1.32 ± 0.06 ms (median ± MAD), respectively (Fig. 6B, C). KA-exposed ears showed a significant decrease in click-CAP amplitude at 90 dB p.e. SPL (73.73 ± 15.53 μV), suggesting an average reduction of 71.4%. The latency (1.27 ± 0.05 ms) of the click-CAP at 90 dB p.e. SPL in KA-exposed ears remained similar. CAP amplitudes increased and latencies decreased for higher sound levels (Fig. 6). KA-exposure (pooled across short- and long-term KA-exposed ears) had a significant effect on click-CAP amplitude (F1,49 = 71.42, p < 0.001), but not latency (F1,52 = 1.53, p = 0.22).
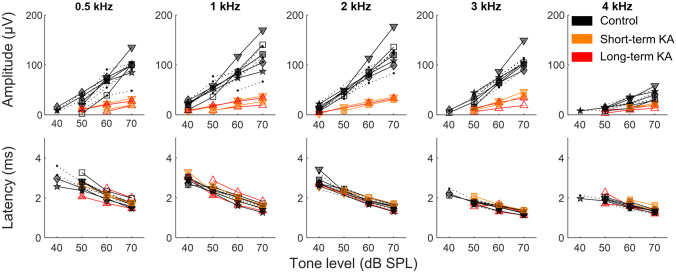
The amplitude and latency of tone-evoked CAPs in budgerigars varied across test frequencies (Fig. 7). In control ears, greater tone-CAP amplitudes were evoked by 1- and 2-kHz tones (1 kHz: 114.72 ± 20.65 µV; 2 kHz: 123.61 ± 16.32 µV, at 70 dB SPL), slightly lower amplitudes were found at 0.5 and 3 kHz (0.5 kHz: 99.75 ± 13.71 µV; 3 kHz: 105.06 ± 10.34 µV, at 70 dB SPL), and the lowest amplitude was observed at 4 kHz (40.22 ± 9.40 µV at 70 dB SPL). Tone-CAP latencies were shorter at higher frequencies (3 kHz: 2.07 ± 0.07 ms; 4 kHz: 2.10 ± 0.05 ms at 70 dB SPL) compared with lower frequencies (0.5 kHz: 2.47 ± 0.11 ms, 1 kHz: 2.33 ± 0.09 ms, 2 kHz: 2.33 ± 0.09 ms, at 70 dB SPL). Similar to the click-CAP results described above, mixed-model analyses showed a significant effect of KA exposure on tone-CAP amplitude (F1,73 = 192.95, p < 0.001) but not latency (F1,178 = 0.0001, p = 0.99).
Fig. 7.
KA exposure reduces tone-evoked CAP amplitude (upper panels) without affecting CAP latency (bottom panels). Stimulus frequency is indicated at the top of each column. Symbols represent the same individual ears as in Fig. 6
Click- and tone-evoked CAP results were similar to those obtained for ABR wave I in a previous study [15], but with larger amplitude due to the closer proximity of the CAP recording electrode to the cochlear ganglion. The relationship between CAPs and ABRs is further evaluated in the following section.
Correlations Between Histological and Physiological Results
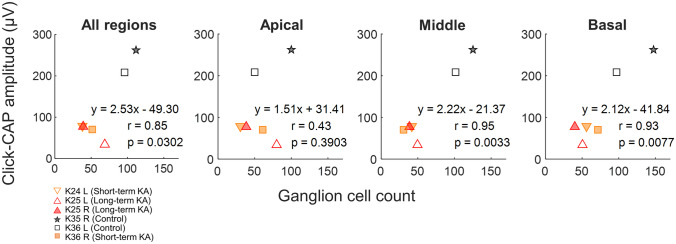
To assess the potential for AN CAPs to serve as a physiological indicator of AN status in budgerigars, we investigated the correlation of click- and tone-evoked CAP amplitudes with the number of surviving cochlear ganglion neurons in the same ears. For click CAPs (Fig. 8), response amplitude was correlated with the number of ganglion neurons in middle and basal regions (middle: r = 0.95, p = 0.0033; basal: r = 0.93, p = 0.0077). In contrast, the correlation was weaker between click-CAP amplitude and the median ganglion neuron counts across all regions, and not significant between click-CAP amplitude and median ganglion count in the apical third of the ganglion.
Fig. 8.
Correlations between click-evoked CAP amplitude and ganglion cell count at different locations along the cochlea (marked at the top of each panel). Click-evoked CAP amplitudes were measured at 90 dB p.e. SPL. Post-KA measurements were made immediately before cochlear dissection
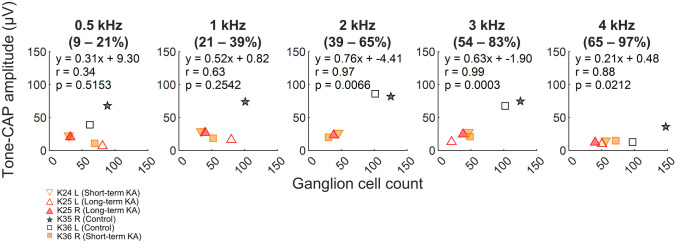
While detailed tonotopic mapping of the budgerigar HC epithelium and ganglion remains unknown, a rough approximation has been proposed for the HC epithelium based on the frequency limits of the behavioral audiogram and physiological data from other bird species [35]. This mapping was used in the present study to approximate regions of the ganglion with CFs spanning octave-wide bands log-centered on 0.5, 1, 2, 3, and 4 kHz, from which median cell counts were calculated (see panel titles in Fig. 9). For tone-CAPs, amplitude was correlated with ganglion-neuron counts for a subset of locations/test frequencies based on their approximated CFs (Fig. 9). Significant correlations were found for 2, 3, and 4 kHz, with the highest correlation coefficient observed at 3 kHz. These findings suggest that CAPs can provide a reasonable estimate of AN survival at mid- to high-frequency regions (2–4 kHz) of the budgerigar cochlear ganglion.
Fig. 9.
Correlations between tone-evoked CAP amplitude and ganglion cell count at corresponding cochlear locations with characteristic frequencies within an approximately 1-octave band centered on the tone frequency. The region of the cochlear ganglion considered is indicated below each tone frequency (top). Tone-evoked CAP amplitudes were measured at 70 dB SPL. Post-KA measurements were made immediately before cochlear dissection
To further evaluate the ability of AN potentials to signal cochlear injury across a larger sample of histologically characterized ears, we combined the click-CAP amplitudes from the present experiments with click-ABR wave I amplitudes from several previous KA studies in our lab [32, 33]. To ensure comparability, we first used a linear mixed-effects model to evaluate the relationship between click-evoked CAP amplitude and ABR wave I amplitude across a sample of six ears for which both measures were available, including one ear tested before and after KA exposure (Fig. 10). Click level ranged from 60 to 90 dB p.e. SPL. The overall relationship was strong (F1,24 = 379.35, p < 0.0001), with even stronger relationships apparent in individual ears, suggesting considerable overlap in neural generation for these two different methods of quantifying AN onset activity. Based on the fitted mixed-effects model, average ABR wave I amplitude was 15% that of the CAP.
Fig. 10.
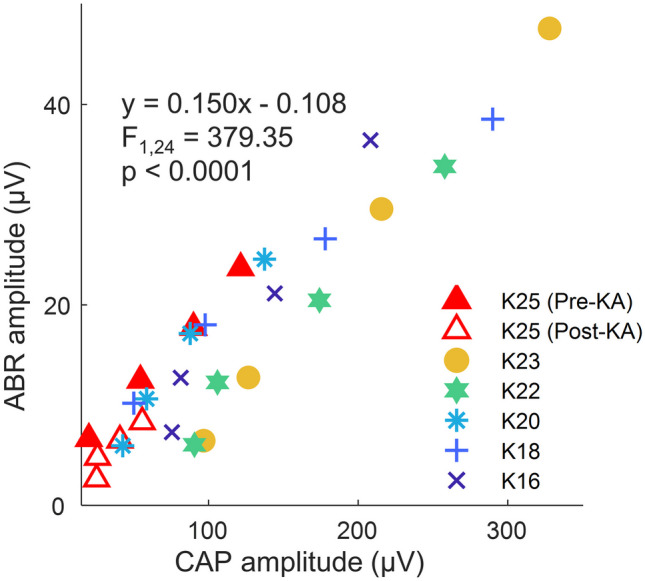
Correlations between the amplitude of auditory brainstem response (ABR) wave I amplitude with CAP amplitude in the same ears. Responses were recorded using click stimuli at 60, 70, 80, and 90 dB p.e. SPL. The equation displayed is the fit of a linear mixed-effects model with a random effect of individual ears. Data from one ear (K25; triangles) were obtained both before and after KA exposure
For the subsequent analysis, post-KA CAP and ABR amplitudes were first normalized by the pre-KA amplitude of the same ear, whereas control amplitudes were set equal to 1. All ears were evaluated histologically. The correlation between the CAP/ABR amplitude and the number of ganglion neurons was examined for median cell counts in apical, middle, and basal regions of the cochlear ganglion as well as for the median cell count across all regions (Fig. 11). Significant correlations were found in all cases, with the strongest correlations observed between ganglion cell count and physiological measurements in the middle and basal ganglion regions. Similar but typically weaker correlations were found between normalized CAP/ABR amplitude and AN fiber density (all regions: r = 0.73, p = 0.0008; apical: r = 0.57, p = 0.016; middle: r = 0.74, p = 0.0008; base: r = 0.53, p = 0.034; compare to values in Fig. 11).
Fig. 11.
Correlations of normalized click-ABR wave I (from [32]; left-pointing triangles ◁) or click-CAP amplitude (right-pointing triangles ▷) with ganglion cell count at different cochlear locations. Both ABR and CAP measurements were made at 80 dB p.e. SPL. Ganglion cell counts were made in all ears. Control amplitudes were fixed at 1, and control ears with histological measurements only are represented by crosses (✕). For KA-exposed ears, post-KA amplitude is normalized by the pre-KA amplitude of the same ear
Finally, note that reduction of normalized CAP and ABR wave I amplitudes in our dataset was approximately proportional to neural loss in the same ears, such that a given percent reduction of the neural gross potential was associated with similar percent loss of neurons. For example, for data pooled across all regions (Fig. 11, left panel), the slope of the relationship between normalized CAP/ABR amplitude and ganglion cell count was 83.1 cells/normalized unit and the model intercept was 3.94 cells. These values are quite close to the theoretical slope of 85.25 cells per normalized unit (i.e., the average cell count in controls) and model intercept of zero, respectively, predicted for a strictly proportional relationship between ABR/CAP loss and neural loss. Overall, these findings demonstrate that both click-ABR wave I and CAP amplitude can be used to estimate auditory nerve loss in kainic acid-exposed budgerigars.
Discussion
We found that intracochlear infusion of KA in budgerigars reduces the number of cochlear ganglion neurons and density of distal AN fibers throughout the full-length of the cochlea. In contrast, HCs and the morphology of the HC epithelium were unaffected by KA. Physiological measurements of CAP amplitude and of ABR wave I were also dramatically reduced, to an extent that was well correlated with and roughly proportional to the degree of ganglion cell loss. Maximal correlations between physiological and histological measurements were found at middle and basal cochlear locations putatively tuned to frequencies above ~ 2 kHz.
The avian cochlea is functionally homologous but anatomically somewhat different from the mammalian cochlea [37, 38]. The cochlear duct in birds is uncoiled and shorter than in mammals, but shares the same tonotopic arrangement of the HC epithelium observed in mammals [39–41]. The HC epithelium of budgerigars is 2.148 ± 0.201 (mean ± SD) mm in length after fixation, with an estimated length of 2.5 mm in length in the living animal [42]. The maximum width is 197 µm with an average of 31 cells/section across, at the widest point [42]. Apical sections in the present study typically showed a slightly greater papilla width of 250–350 µm, likely due to our frozen sectioning technique for which the plane of section was not perfectly perpendicular to the longitudinal cochlear axis at all cochlear regions due to mounting variation and slight curvature of the papilla toward the base. Manley and colleagues [42] used a whole-mount technique better suited to quantifying papillar morphology.
The cochlear ganglion of budgerigars did not span the full-length of the cochlea, similar to previous results in other avian species. In quail, ganglion cells first occur at approximately 10% of the length and disappear at 75–80% length from the apical end of the cochlea [43]. AN afferent terminals in other avian species are tonotopically arranged along the cochlea with an approximately logarithmic CF-location relationship [41, 44–46]. In chickens, AN terminals located at 30.1–74.4% of the length from the apical end of the cochlea have CFs increasing from 353 to 3145 Hz, in an orderly manner [45]. To reduce the variation of the cochlear location for different ears, we aligned samples based on their percent distance from the apical to the basal end of the ganglion. Note, however, that the extent to which tonotopy of AN afferent terminals is reflected in the organization of the ganglion remains unknown. Nonetheless, as a first step toward correlating frequency-specific anatomical and physiological measures, a Greenwood function derived from the behavioral audiogram of the budgerigar was fit to the longitudinal axis of the ganglion to obtain CF estimations for each location. While some degree of agreement was observed between tone-evoked responses and histological measures, differences between our rough CF approximation and the true frequency-location map of the cochlear ganglion in budgerigars almost undoubtedly affected our findings.
KA is a potent agonist of ionotropic glutamate receptors including AMPA, NMDA, and KA receptors. Overstimulation of these receptors by KA results in a massive influx of Ca2+ , leading to excitotoxicity-related neuronal apoptosis [47]. As one of several manipulations for establishing a cochlear synaptopathy model, KA exposure of the cochlea selectively targets AN afferents, which innervate inner HCs in mammals or tall HCs in birds [17–19]. The selective damage caused by KA is comparable to that produced by ouabain [13, 14], which inhibits the alpha subunit of the Na/K ATPase [48], leading to demyelination of AN fibers and mitochondrial apoptosis of ganglion neurons [49]. Excitotoxicity has also been observed at afferent synapses following noise exposure [50]. Compared with cochlear synaptopathy models produced by controlled noise exposure [10–12], the use of neurotoxic agents such as KA can produce damage over a wider CF range, perhaps similar to age-related AN degeneration in human and animal models [1, 3, 43, 51].
The results of the present study demonstrate that intracochlear infusion of 1-mM KA in budgerigars damages ganglion neurons and AN peripheral axons, while HCs remain intact. These histological effects are consistent with findings previously reported in various animal models, including chicken [19, 20], guinea pig [17], rat [18], chinchilla [21], and mouse [22, 23]. Earlier observations using electron microscopy have shown acute and selective swelling of AN afferent synapses shortly after the intracochlear infusion of KA [17], followed after longer time periods (weeks or months) by profound ganglion neuronal loss [18, 20]. Recent studies using immunolabeling and confocal microscopy suggest that KA exposure causes a reduction of presynaptic inner HC ribbon synapses and postsynaptic GluA2 pairs [22, 23], reduction of the peripheral AN axons that innervate inner HCs [52], and substantial loss of ganglion neurons [22].
Our results showed no difference in the effect of KA infusion between budgerigars with short (8 weeks) and long-term post-KA survival times, suggesting that the degeneration of neuronal soma caused by 1–2 mM KA infusion is likely completed by 8 weeks after exposure. Longitudinal ABR measurements in budgerigars with the same KA infusion protocols and concentration from the present study suggest that AN function shows little or no further recovery after 4 weeks post-infusion [15]. Notably, the degeneration time course in budgerigars is also consistent with findings in chicken [20]. In chicken, KA exposure causes immediate swelling and breakage of AN afferent synapses. A high-dose (5 mM) KA infusion leads to irreversible damage to AN peripheral axons, with a slow and progressive but near-complete loss of ganglion neurons (12.5% remaining) over a period of 20 weeks. A lower-dose (0.3 mM) KA infusion was found to cause no permanent neuronal loss, but pathologic morphological changes were observed in 34% of ganglion neurons. CAP results in the same study suggest a partial functional recovery of the AN that is completed within 4 weeks after KA exposure.
Our histological and physiological results were also consistent with previously reported physiological measurements in budgerigars. A similar 40–75% amount of AN reduction has been estimated based on ABR wave I amplitudes at moderate to high sound levels post-KA [15]. On the other hand, no impairment of ABR thresholds, cochlear microphonic, or DPOAEs was found [15, 32, 33], suggesting intact HC function. Here, we extend the results by showing that survival of ganglion neurons is correlated with CAP and ABR wave I amplitude measured with clicks at moderate to high sound levels in the same ears. These findings show that these two physiological measurements are comparable, and can provide a reliable indicator of AN status in the budgerigar. ABR wave I amplitude was approximately 15% that of the CAP.
We found that the click-CAP amplitudes were more correlated with number of ganglion neurons in middle and basal cochlear regions than the cochlear apex. Higher correlation for tone-CAP amplitudes was observed with 3–4 kHz tones as well. Although CAP and ABR wave I are known to arise from the summed activity of AN fibers [53, 54], the contributions of the AN fibers to the measured amplitudes may differ based on their response features, such as CF or spontaneous rate [55, 56]. Lee et al. [56] investigated the spatial origins of AN CAP responses for moderate- to high-level sound by sequentially blocking AN potentials from the apex to the base of the cochlea, corresponding to low to high CFs. The study used low-level stimuli to identify CF regions responsible for tone-frequency responses from 2 to 16 kHz. For higher-level tones, they found that the CF region responsible for the response expanded considerably, while also shifting basally for low-frequency tones and apically for high-frequency tones. Little or no CF shift was observed for mid-frequencies from 8 to 10 kHz, at which Guinea pigs exhibit greatest sensitivity of the audiogram. These results suggest that the CF region responsible for tone-response generation shifts toward the most sensitive CF of the auditory system at high sound levels. A similar phenomenon could also occur in budgerigars, which have the greatest auditory sensitivity from 2 to 4 kHz [57]. On the other hand, the cochlear origins of high-level tone-burst responses could differ based on findings in other bird species that AN fiber tuning curves generally lack low-frequency “tail” regions and show less increase in bandwidth at high sound levels than occurs in mammals [40, 46]. Further study is needed to better understand the origins of gross AN potentials in budgerigars and other birds.
In conclusion, histological analyses of the budgerigar cochlea revealed a profound loss of ganglion cells and distal AN fibers after KA exposure. In contrast, the HCs and HC epithelium were unaffected. These histological findings are comparable with prior physiological measurements in the same species, and further highlight the effectiveness of using the intracochlear infusion of KA as a neuropathic manipulation for establishing a cochlear synaptopathy model. Future studies should examine the effects of KA in greater detail, for example, by staining pre- and post-synaptic components of HC ribbon synapses [58, 59]. The survival of ganglion neurons was highly correlated with CAP and ABR wave I amplitudes, supporting the use of both measurements as reliable indicators of AN status. CAP and ABR wave I amplitude were most strongly correlated to ganglion survival at cochlear locations likely tuned from 2 to 3 kHz. Hence, these physiological metrics can estimate neural survival in the most sensitive and behavioral relevant frequency region of the budgerigar’s hearing range.
Acknowledgements
Robert Dirksen provided use of his cryostat for frozen sectioning of cochlear samples.
Funding
This research was supported by grant R01-DC017519.
Data Availability
Data in the manuscript are available by request from the corresponding author.
Declarations
Competing Interests
The authors declare no competing interests.
Footnotes
Publisher's Note
Springer Nature remains neutral with regard to jurisdictional claims in published maps and institutional affiliations.
References
- 1.Makary CA, Shin J, Kujawa SG, Liberman MC, Merchant SN. Age-related primary cochlear neuronal degeneration in human temporal bones. J Assoc Res Otolaryngol. 2011;12(6):711–717. doi: 10.1007/s10162-011-0283-2. [DOI] [PMC free article] [PubMed] [Google Scholar]
- 2.Viana LM, O'Malley JT, Burgess BJ, Jones DD, Oliveira CA, Santos F, Merchant SN, Liberman LD, Liberman MC. Cochlear neuropathy in human presbycusis: confocal analysis of hidden hearing loss in post-mortem tissue. Hear Res. 2015;327:78–88. doi: 10.1016/j.heares.2015.04.014. [DOI] [PMC free article] [PubMed] [Google Scholar]
- 3.Wu PZ, Liberman LD, Bennett K, de Gruttola V, O'Malley JT, Liberman MC. Primary neural degeneration in the human cochlea: evidence for hidden hearing loss in the aging ear. Neuroscience. 2019;407:8–20. doi: 10.1016/j.neuroscience.2018.07.053. [DOI] [PMC free article] [PubMed] [Google Scholar]
- 4.Liberman MC, Epstein MJ, Cleveland SS, Wang H, Maison SF. Toward a differential diagnosis of hidden hearing loss in humans. PLoS ONE. 2016;11(9):e0162726. doi: 10.1371/journal.pone.0162726. [DOI] [PMC free article] [PubMed] [Google Scholar]
- 5.Grant KJ, Mepani AM, Wu PZ, Hancock KE, de Gruttola V, Liberman MC, Maison SF. Electrophysiological markers of cochlear function correlate with hearing-in-noise performance among audiometrically normal subjects. J Neurophysiol. 2020;124(2):418–431. doi: 10.1152/jn.00016.2020. [DOI] [PMC free article] [PubMed] [Google Scholar]
- 6.Grose JH, Buss E, Hall JW., 3rd Loud music exposure and cochlear synaptopathy in young adults: isolated auditory brainstem response effects but no perceptual consequences. Trends Hear. 2017;21:2331216517737417. doi: 10.1177/2331216517737417. [DOI] [PMC free article] [PubMed] [Google Scholar]
- 7.Prendergast G, Millman RE, Guest H, Munro KJ, Kluk K, Dewey RS, Hall DA, Heinz MG, Plack CJ. Effects of noise exposure on young adults with normal audiograms II: behavioral measures. Hear Res. 2017;356:74–86. doi: 10.1016/j.heares.2017.10.007. [DOI] [PMC free article] [PubMed] [Google Scholar]
- 8.Guest H, Munro KJ, Prendergast G, Plack CJ. Reliability and interrelations of seven proxy measures of cochlear synaptopathy. Hear Res. 2019;375:34–43. doi: 10.1016/j.heares.2019.01.018. [DOI] [PMC free article] [PubMed] [Google Scholar]
- 9.Henry KS. Animal models of hidden hearing loss: does auditory-nerve-fiber loss cause real-world listening difficulties? Mol Cell Neurosci. 2022;118:103692. doi: 10.1016/j.mcn.2021.103692. [DOI] [PMC free article] [PubMed] [Google Scholar]
- 10.Hickox AE, Larsen E, Heinz MG, Shinobu L, Whitton JP. Translational issues in cochlear synaptopathy. Hear Res. 2017;349:164–171. doi: 10.1016/j.heares.2016.12.010. [DOI] [PMC free article] [PubMed] [Google Scholar]
- 11.Kujawa SG, Liberman MC. Adding insult to injury: cochlear nerve degeneration after "temporary" noise-induced hearing loss. J Neurosci. 2009;29(45):14077–14085. doi: 10.1523/JNEUROSCI.2845-09.2009. [DOI] [PMC free article] [PubMed] [Google Scholar]
- 12.Lin HW, Furman AC, Kujawa SG, Liberman MC. Primary neural degeneration in the Guinea pig cochlea after reversible noise-induced threshold shift. J Assoc Res Otolaryngol. 2011;12(5):605–616. doi: 10.1007/s10162-011-0277-0. [DOI] [PMC free article] [PubMed] [Google Scholar]
- 13.Yuan Y, Shi F, Yin Y, Tong M, Lang H, Polley DB, Liberman MC, Edge AS. Ouabain-induced cochlear nerve degeneration: synaptic loss and plasticity in a mouse model of auditory neuropathy. J Assoc Res Otolaryngol. 2014;15(1):31–43. doi: 10.1007/s10162-013-0419-7. [DOI] [PMC free article] [PubMed] [Google Scholar]
- 14.Chambers AR, Resnik J, Yuan Y, Whitton JP, Edge AS, Liberman MC, Polley DB. Central gain restores auditory processing following near-complete cochlear denervation. Neuron. 2016;89(4):867–879. doi: 10.1016/j.neuron.2015.12.041. [DOI] [PMC free article] [PubMed] [Google Scholar]
- 15.Henry KS, Abrams KS. Persistent auditory nerve damage following kainic acid excitotoxicity in the budgerigar (Melopsittacus undulatus) J Assoc Res Otolaryngol. 2018;19(4):435–449. doi: 10.1007/s10162-018-0671-y. [DOI] [PMC free article] [PubMed] [Google Scholar]
- 16.McLennan H. Receptors for the excitatory amino acids in the mammalian central nervous system. Prog Neurobiol. 1983;20(3–4):251–271. doi: 10.1016/0301-0082(83)90004-7. [DOI] [PubMed] [Google Scholar]
- 17.Pujol R, Lenoir M, Robertson D, Eybalin M, Johnstone BM. Kainic acid selectively alters auditory dendrites connected with cochlear inner hair cells. Hear Res. 1985;18(2):145–151. doi: 10.1016/0378-5955(85)90006-1. [DOI] [PubMed] [Google Scholar]
- 18.Juiz JM, Rueda J, Merchan JA, Sala ML. The effects of kainic acid on the cochlear ganglion of the rat. Hear Res. 1989;40(1–2):65–74. doi: 10.1016/0378-5955(89)90100-7. [DOI] [PubMed] [Google Scholar]
- 19.Shero M, Salvi RJ, Chen L, Hashino E. Excitotoxic effect of kainic acid on chicken cochlear afferent neurons. Neurosci Lett. 1998;257(2):81–84. doi: 10.1016/s0304-3940(98)00821-0. [DOI] [PubMed] [Google Scholar]
- 20.Sun H, Hashino E, Ding DL, Salvi RJ. Reversible and irreversible damage to cochlear afferent neurons by kainic acid excitotoxicity. J Comp Neurol. 2001;430(2):172–181. doi: 10.1002/1096-9861(20010205)430:2<172::aid-cne1023>3.0.co;2-w. [DOI] [PubMed] [Google Scholar]
- 21.Zheng XY, Wang J, Salvi RJ, Henderson D. Effects of kainic acid on the cochlear potentials and distortion product otoacoustic emissions in chinchilla. Hear Res. 1996;95(1–2):161–167. doi: 10.1016/0378-5955(96)00047-0. [DOI] [PubMed] [Google Scholar]
- 22.Ding D, Qi W, Jiang H, Salvi R. Excitotoxic damage to auditory nerve afferents and spiral ganglion neurons is correlated with developmental upregulation of AMPA and KA receptors. Hear Res. 2021;411:108358. doi: 10.1016/j.heares.2021.108358. [DOI] [PubMed] [Google Scholar]
- 23.Walia A, Lee C, Hartsock J, Goodman SS, Dolle R, Salt AN, Lichtenhan JT, Rutherford MA. Reducing auditory nerve excitability by acute antagonism of Ca(2+)-permeable AMPA receptors. Front Synaptic Neurosci. 2021;13:680621. doi: 10.3389/fnsyn.2021.680621. [DOI] [PMC free article] [PubMed] [Google Scholar]
- 24.Okanoya K, Dooling RJ. Hearing in passerine and psittacine birds: a comparative study of absolute and masked auditory thresholds. J Comp Psychol. 1987;101(1):7–15. doi: 10.1037/0735-7036.101.1.7. [DOI] [PubMed] [Google Scholar]
- 25.Henry KS, Amburgey KN, Abrams KS, Carney LH. Identifying cues for tone-in-noise detection using decision variable correlation in the budgerigar (Melopsittacus undulatus) J Acoust Soc Am. 2020;147(2):984. doi: 10.1121/10.0000621. [DOI] [PMC free article] [PubMed] [Google Scholar]
- 26.Dent ML, Dooling RJ, Pierce AS. Frequency discrimination in budgerigars (Melopsittacus undulatus): effects of tone duration and tonal context. J Acoust Soc Am. 2000;107(5 Pt 1):2657–2664. doi: 10.1121/1.428651. [DOI] [PubMed] [Google Scholar]
- 27.Dooling RJ, Searcy MH. Amplitude-nodulation thresholds for the parakeet (Melopsittacus-undulatus) J Comp Physiol. 1981;143(3):383–388. doi: 10.1007/Bf00611177. [DOI] [Google Scholar]
- 28.Carney LH, Ketterer AD, Abrams KS, Schwarz DM, Idrobo F. Detection thresholds for amplitude modulations of tones in budgerigar, rabbit, and human. Adv Exp Med Biol. 2013;787:391–398. doi: 10.1007/978-1-4614-1590-9_43. [DOI] [PMC free article] [PubMed] [Google Scholar]
- 29.Henry KS, Neilans EG, Abrams KS, Idrobo F, Carney LH. Neural correlates of behavioral amplitude modulation sensitivity in the budgerigar midbrain. J Neurophysiol. 2016;115(4):1905–1916. doi: 10.1152/jn.01003.2015. [DOI] [PMC free article] [PubMed] [Google Scholar]
- 30.Henry KS, Amburgey KN, Abrams KS, Idrobo F, Carney LH. Formant-frequency discrimination of synthesized vowels in budgerigars (Melopsittacus undulatus) and humans. J Acoust Soc Am. 2017;142(4):2073. doi: 10.1121/1.5006912. [DOI] [PMC free article] [PubMed] [Google Scholar]
- 31.Henry KS, Abrams KS, Forst J, Mender MJ, Neilans EG, Idrobo F, Carney LH. Midbrain synchrony to envelope structure supports behavioral sensitivity to single-formant vowel-like sounds in noise. J Assoc Res Otolaryngol. 2017;18(1):165–181. doi: 10.1007/s10162-016-0594-4. [DOI] [PMC free article] [PubMed] [Google Scholar]
- 32.Wong SJ, Abrams KS, Amburgey KN, Wang Y, Henry KS. Effects of selective auditory-nerve damage on the behavioral audiogram and temporal integration in the budgerigar. Hear Res. 2019;374:24–34. doi: 10.1016/j.heares.2019.01.019. [DOI] [PMC free article] [PubMed] [Google Scholar]
- 33.Wilson JL, Abrams KS, Henry KS. Effects of kainic acid-induced auditory nerve damage on envelope-following responses in the budgerigar (Melopsittacus undulatus) J Assoc Res Otolaryngol. 2021;22(1):33–49. doi: 10.1007/s10162-020-00776-x. [DOI] [PMC free article] [PubMed] [Google Scholar]
- 34.Henry KS, Abrams KS. Normal tone-in-noise sensitivity in trained budgerigars despite substantial auditory-nerve injury: no evidence of hidden hearing loss. J Neurosci. 2021;41(1):118–129. doi: 10.1523/JNEUROSCI.2104-20.2020. [DOI] [PMC free article] [PubMed] [Google Scholar]
- 35.Gleich O, Fischer FP, Köppl C, Manley GA. Hearing organ evolution and specialization: archosaurs. In: Fay RR, Popper AN, editors. Evolution of the Vertebrate Auditory System. New York: Springer; 2004. pp. 224–255. [Google Scholar]
- 36.Bates D, Machler M, Bolker BM, Walker SC. Fitting linear mixed-effects models using lme4. J Stat Softw. 2015;67(1):1–48. doi: 10.18637/jss.v067.i01. [DOI] [Google Scholar]
- 37.Manley GA, Clack JA. An outline of the evolution of vertebrate hearing organs. In: Fay RR, Popper AN, editors. Evolution of the Vertebrate Auditory System. New York: Springer; 2004. pp. 1–26. [Google Scholar]
- 38.Koppl C. Birds–same thing, but different? Convergent evolution in the avian and mammalian auditory systems provides informative comparative models. Hear Res. 2011;273(1–2):65–71. doi: 10.1016/j.heares.2010.03.095. [DOI] [PubMed] [Google Scholar]
- 39.Salvi RJ, Saunders SS, Powers NL, Boettcher FA. Discharge patterns of cochlear ganglion neurons in the chicken. J Comp Physiol A. 1992;170(2):227–241. doi: 10.1007/BF00196905. [DOI] [PubMed] [Google Scholar]
- 40.Manley GA, Gleich O, Leppelsack HJ, Oeckinghaus H. Activity patterns of cochlear ganglion neurones in the starling. J Comp Physiol A. 1985;157(2):161–181. doi: 10.1007/BF01350025. [DOI] [PubMed] [Google Scholar]
- 41.Gleich O. Auditory primary afferents in the starling: correlation of function and morphology. Hear Res. 1989;37(3):255–267. doi: 10.1016/0378-5955(89)90026-9. [DOI] [PubMed] [Google Scholar]
- 42.Manley GA, Schwabedissen G, Gleich O. Morphology of the basilar papilla of the budgerigar. Melopsittacus undulatus J Morphol. 1993;218(2):153–165. doi: 10.1002/jmor.1052180205. [DOI] [PubMed] [Google Scholar]
- 43.Ryals BM, Westbrook EW. Ganglion cell and hair cell loss in Coturnix quail associated with aging. Hear Res. 1988;36(1):1–8. doi: 10.1016/0378-5955(88)90133-5. [DOI] [PubMed] [Google Scholar]
- 44.Manley GA, Brix J, Kaiser A. Developmental stability of the tonotopic organization of the chick's basilar papilla. Science. 1987;237(4815):655–656. doi: 10.1126/science.3603046. [DOI] [PubMed] [Google Scholar]
- 45.Chen L, Salvi R, Shero M. Cochlear frequency-place map in adult chickens: intracellular biocytin labeling. Hear Res. 1994;81(1–2):130–136. doi: 10.1016/0378-5955(94)90160-0. [DOI] [PubMed] [Google Scholar]
- 46.Köppl C. Frequency tuning and spontaneous activity in the auditory nerve and cochlear nucleus magnocellularis of the barn owl Tyto alba. J Neurophysiol. 1997;77(1):364–377. doi: 10.1152/jn.1997.77.1.364. [DOI] [PubMed] [Google Scholar]
- 47.Weiss S. Pharmacological properties of the N-methyl-D-aspartate receptor system coupled to the evoked release of gamma-[3H] aminobutyric acid from striatal neurons in primary culture. J Pharmacol Exp Ther. 1990;252(1):380–386. [PubMed] [Google Scholar]
- 48.Azarias G, Kruusmagi M, Connor S, Akkuratov EE, Liu XL, Lyons D, Brismar H, Broberger C, Aperia A. A specific and essential role for Na, K-ATPase alpha3 in neurons co-expressing alpha1 and alpha3. J Biol Chem. 2013;288(4):2734–2743. doi: 10.1074/jbc.M112.425785. [DOI] [PMC free article] [PubMed] [Google Scholar]
- 49.Schmiedt RA, Okamura HO, Lang H, Schulte BA. Ouabain application to the round window of the gerbil cochlea: a model of auditory neuropathy and apoptosis. J Assoc Res Otolaryngol. 2002;3(3):223–233. doi: 10.1007/s1016200220017. [DOI] [PMC free article] [PubMed] [Google Scholar]
- 50.Robertson D. Functional significance of dendritic swelling after loud sounds in the guinea pig cochlea. Hear Res. 1983;9(3):263–278. doi: 10.1016/0378-5955(83)90031-x. [DOI] [PubMed] [Google Scholar]
- 51.Keithley EM, Feldman ML. Spiral ganglion cell counts in an age-graded series of rat cochleas. J Comp Neurol. 1979;188(3):429–442. doi: 10.1002/cne.901880306. [DOI] [PubMed] [Google Scholar]
- 52.Wang Q, Green SH. Functional role of neurotrophin-3 in synapse regeneration by spiral ganglion neurons on inner hair cells after excitotoxic trauma in vitro. J Neurosci. 2011;31(21):7938–7949. doi: 10.1523/JNEUROSCI.1434-10.2011. [DOI] [PMC free article] [PubMed] [Google Scholar]
- 53.Versnel H, Prijs VF, Schoonhoven R. Single-fibre responses to clicks in relationship to the compound action potential in the guinea pig. Hear Res. 1990;46(1–2):147–160. doi: 10.1016/0378-5955(90)90145-f. [DOI] [PubMed] [Google Scholar]
- 54.Buchwald JS, Huang C. Far-field acoustic response: origins in the cat. Science. 1975;189(4200):382–384. doi: 10.1126/science.1145206. [DOI] [PubMed] [Google Scholar]
- 55.Bourien J, Tang Y, Batrel C, Huet A, Lenoir M, Ladrech S, Desmadryl G, Nouvian R, Puel JL, Wang J. Contribution of auditory nerve fibers to compound action potential of the auditory nerve. J Neurophysiol. 2014;112(5):1025–1039. doi: 10.1152/jn.00738.2013. [DOI] [PubMed] [Google Scholar]
- 56.Lee C, Guinan JJ, Jr, Rutherford MA, Kaf WA, Kennedy KM, Buchman CA, Salt AN, Lichtenhan JT. Cochlear compound action potentials from high-level tone bursts originate from wide cochlear regions that are offset toward the most sensitive cochlear region. J Neurophysiol. 2019;121(3):1018–1033. doi: 10.1152/jn.00677.2018. [DOI] [PMC free article] [PubMed] [Google Scholar]
- 57.Brittan-Powell EF, Dooling RJ, Gleich O. Auditory brainstem responses in adult budgerigars (Melopsittacus undulatus) J Acoust Soc Am. 2002;112(3 Pt 1):999–1008. doi: 10.1121/1.1494807. [DOI] [PubMed] [Google Scholar]
- 58.Caus Capdevila M, Sienknecht U, Köppl C. Developmental maturation of presynaptic ribbon numbers in chicken basilar-papilla hair cells and its perturbation by long-term overexpression of Wnt9a. Dev Neurobiol. 2021;81(6):817–832. doi: 10.1002/dneu.22845. [DOI] [PubMed] [Google Scholar]
- 59.Martinez-Dunst C, Michaels R, Fuchs P. Release sites and calcium channels in hair cells of the chick’s cochlea. J Neurosci. 1997;17(23):9133–9144. doi: 10.1523/JNEUROSCI.17-23-09133.1997. [DOI] [PMC free article] [PubMed] [Google Scholar]
Associated Data
This section collects any data citations, data availability statements, or supplementary materials included in this article.
Data Availability Statement
Data in the manuscript are available by request from the corresponding author.


