Abstract
IgA nephropathy is the most common primary glomerulonephritis worldwide and can progress to end-stage kidney disease (ESKD). The current “gold standard” for diagnosis is kidney biopsy, which is invasive and associated with morbidity. miRNAs are small, non-coding endogenous RNA that may serve as non-invasive biomarkers, and that are found in urinary exosomes. Thus far, there is a paucity of studies of the miRNA profile for the diagnosis of IgA nephropathy. Hence, we aimed to study the urinary exosomal miRNA signature of Indian patients with IgA nephropathy. Fifty biopsy-proven IgA nephropathy patients, 50 healthy controls and 25 patients with ESKD (IgA nephropathy) were recruited over 2 years (2020–2022). Urinary exosomes were isolated from which miRNA was extracted . Analysis of urinary exosomal miRNA was done using the digital multiplexed nCounter® human v3 miRNA Expression Assay which contains 799 unique miRNA barcodes. Candidate miRNAs were identified using Lasso regression and consensus clustering. The mean age of IgA nephropathy patients was 36.32 ± 3.067 years, mean creatinine was 2.26 ± 0.318 mg/dl and mean proteinuria was 2.69 ± 0.64 g/day. Compared to healthy controls, the majority (N = 150) of miRNAs were significantly downregulated. Five candidate miRNAs (hsa.miR.146b.3p, hsa.miR.599, hsa.miR.4532, hsa.miR.664b.5p and hsa.miR.221.5p) were able to differentiate between IgA nephropathy cases and controls (AUC > 0.90); the presence of all 5 was associated with 100% specificity and sensitivity for diagnosing IgA nephropathy cases. This study of Indian patients identified that there was a significant difference in the urinary exosomal miRNA profile between IgA nephropathy cases and healthy controls, suggesting that miRNAs may be valuable in the non-invasive diagnosis of IgA nephropathy.
Subject terms: Genetics, Clinical genetics, Genomics
Introduction
The most common cause of primary glomerulonephritis worldwide is IgA nephropathy1. Worldwide, it has an incidence of 2.1 per 100,000 population and commonly affects those in the second or third decades of life2.
IgA nephropathy has a progressive clinical course, often characterized by proteinuria, microhematuria and progressive loss of kidney function. Approximately 15–40% reach end-stage kidney disease [ESKD] requiring maintenance hemodialysis by 10–20 years if not diagnosed and treated early3,4.
The “gold standard” for diagnosing IgA nephropathy is kidney biopsy, a procedure that is difficult to repeat frequently given its invasive nature and potential morbidity5. Complications following kidney biopsy can be as high as 6.4% and include post-procedure bleeding (in approximately 1.2%)6–8.
miRNAs are a group of endogenous non-coding RNAs that are 20–25 nucleotides in length. The complementary base pairing of the target mRNA 3″ untranslated region is important to affect the level of gene expression translation, because of which the target mRNA can be inhibited or degraded9. They play a crucial part in the development, identification, and management of kidney diseases. miRNA offers benefits as a diagnostic tool due to its stability under challenging conditions, such as boiling, varying pH levels, prolonged storage, and numerous freeze–thaw cycles. Their resistance to endogenous RNAase is attributed to their diminutive size and enclosure within lipid or lipoprotein structures like exosomes10.
All these characteristics and the non-invasive nature make miRNAs ideal and potential biomarkers to detect or monitor various human diseases, however there are some limitations. miRNAs in urine sediments are mostly of low quality and easily degrade due to the abundance of RNase in the kidneys, bladder and urinary tract. In contrast, intact miRNAs are abundant in urinary exosomes which are resistant against degradation by RNAse. In contrast to renal biopsy, which only provides a small sample from the kidney, urinary exosomes represent the entire urinary system11,12.
Recently, the examination of miRNA levels in urinary sediment has been investigated as non-invasive indicators for kidney diseases, including IgAN13. Preliminary studies have indicated that several miRNAs in the urine undergo significant alterations in IgAN. For instance, miR-200a, miR-200b, and miR-429 have been found to be downregulated in IgAN, while miR-29b, miR-29c, and miR-93 levels have been associated with kidney function and the degree of histological damage14. Although the available data on urinary miRNA is valuable, it is fragmented and predominantly focused on a few target miRNAs across various ethnic groups; to our understanding, there's no data specific to the Indian population. It is well known that IgA nephropathy is the most common primary glomerulonephritis and has a progressive course in Asian population.
Thus, in a cross-section of Indian patients located in Bengaluru, India, the purpose of this study is to identify the urinary exosomal miRNA profile in patients with IgA nephropathy.
Materials and methods
Study design and population
This prospective clinical case–control observational study was conducted in the Department of Nephrology, Institute of Nephro-urology, Bengaluru from September 2020–2022. All methods were carried out in accordance with the Declaration of Helsinki. All experimental protocols were approved by the Institute of Nephro-urology ethical committee (INU/IEC/2020/1). Informed consent was obtained from all participants and/or their legal guardians.
The study population consisted of a total of 125 individuals from whom urine samples were collected from which to extract miRNA. The cases consisted of 50 native biopsy-proven IgA nephropathy (IGAN) patients during the study period, 50 Healthy controls (CTL) consisting of healthy volunteers between 18 and 65 years old with normal renal function and normal urinalysis without a personal or family history of nephropathy or other serious illnesses were recruited and 25 ESKD patients with biopsy-proven IgA nephropathy. The cases were identified prospectively and consecutive kidney biopsies that showed IgA nephropathy were recruited. Fresh urine sample was collected within few days of kidney biopsy report.
Healthy controls were recruited prospectively, and included adults between 18 and 60 years of age. Healthcare workers and patients care takers were screened and included as healthy volunteers.
Patients with a concomitant diagnosis of diabetes, urinary, respiratory, or gastrointestinal tract infection, chronic hepatic disease, systemic lupus erythematosus, and rheumatoid arthritis were excluded. Patients with crescentic IgA nephropathy and IgA vasculitis were also excluded from the study.
Following, written informed consent, a freshly voided urine sample was collected for exosomal miRNA extraction. The demographic and clinical data of all included IgAN patients, such as age, gender, 24-h urinary protein excretion (UPE), and serum creatinine (S.Cr) were recorded at the time of kidney biopsy. The estimated glomerular filtration rate (eGFR) was calculated using the Chronic Kidney Disease Epidemiology Collaboration equations using creatinine 202115.
RNA extraction and nanostring miRNA expression assay
Exosomal RNA was isolated from human urine samples using Norgen’s Urine Exosome RNA isolation kit (Cat#47200). 2 ml of urine from 5 subjects was pooled to obtain 10 ml of pooled urine samples for the Control group. Similarly, 5 ml of urine from 2 subjects was pooled for IgA Nephropathy (IgAN) cases. In total, 10 control and 25 IgAN case samples were included for the study. Urine samples were completely thawed and incubated for 5 min at 37 °C to dissolve any sediment. The pooling protocol was followed as per manufacturer guidelines. Following that, RNA was eluted in 0.1 ml of elution Buffer. Eluted RNA was concentrated using Zymo’s RNA Clean & concentrator-5(Cat#R1015). Exosomal RNA was eluted from Zymo column in 15 µl of Elution buffer provided in the kit. Quantitation was performed using Qubit RNA HS assay (Invitrogen, Cat # Q32855) kit and also qualitatively analyzed on Agilent 2100 bioanalyzer Pico chip.
With NanoString nCounter Human v3 miRNA Expression Assay (NS_H_miR_v3b) kit (CSO-MIR3-12), miRNA (3ul) was ligated to mir-Tag with ligation buffer and Ligase supplied with the kit. Ligated product was diluted with 15 µl of nuclease free water and denatured at 85ºC for 5 min. 5 µl of this was hybridized overnight at 65 °C with Reporter and Capture probes. Protocol followed as per Manual (nCounter miRNA Expression Assay User Manual, MAN-C0009-07)16.
Post hybridization, samples were analyzed on nanoString nCounter SPRINT machine17–19.
miRNA expression analysis
Every sample was evaluated using the nCounter Analysis System (from NanoString Technologies) and the nCounter Human v3 miRNA Expression Assay (NS_H_miR_v3b) panel, which encompasses 799 unique miRNA barcodes for endogenous miRNA20. The housekeeping genes incorporated in the panel include beta-actin (ACTB), beta-2-microglobulin (B2M), glyceraldehyde 3-phosphate dehydrogenase (GAPDH), ribosomal protein L19 (RPL19), and Ribosomal protein lateral stalk subunit P0 (RPLP0). Additionally, the panel contains SpikeIn miRNAs, such as Arabidopsis thaliana miR159a (ath-miR159a), Caenorhabditis elegans (cel)-miR-248 and miR254, and Oryza sativa (osa)-miR414 and osa-miR442, along with positive and negative controls to evaluate the overall assay efficiency and monitor the ligation efficiency. The initial miRNA data in RCC (Reporter Code Count) format underwent further analysis using the nSolver analysis software (from NanoString Technologies), version 4.0. QC metrics concerning Imaging, Binding density, positive control, limit of detection, and ligation were verified before advancing to subsequent analyses.Normalization of the raw data was performed using the geometric mean of positive controls and top 100 highly expressed miRNAs. The differential expression between the groups were calculated using the build ratio utility present within the nSolver (foldchange). The thresholds considered for a significant differentially expressed miRNA were, foldchange ≥ 1.2 or ≤ − 1.2, P-value ≤ 0.05 and either of the two groups (test/control) should have their geometric mean expression ≥ average count for negative control probes in the panel.
The ClustVis tool (http://biit.cs.ut.ee/clustvis/) was used for principal component analysis (PCA) and Heatmap generation, using the normalized expression data from the samples used in the study21.
The functional enrichment analysis was performed using miEAA 2.0 (https://ccb-compute2.cs.uni-saarland.de/mieaa2/) online server, where over-representation analysis was performed using the list of significant differentially regulated miRNAs as input22. Upregulated and downregulated lists of miRNAs were separately analyzed. The options set during the analysis were, P-value adjustment method set to FDR (Benjamini-Hochberg) adjustment, minimum required hits per sub-category set to 2 and significance level set to 0.05. The databases queried against for performing the over-representation analysis include REACTOME (mirPathdb), KEGG, MNDR database for pathway and disease association enrichment while for Gene Ontology Biological Process (BP) and Molecular Function (MF) enrichment, mirPathdb was used.
The Pearson correlation analysis of the normalized expression of miRNAs against clinical variables like Age, eGFR, Serum Creatinine, Blood Urea, 24-h urine protein (proteinuria), Mesangial expansion, Endocapillary proliferation, Sclerosis and IFTA was performed.
miRNA feature selection using Lasso regression
From the statistically significant miRNAs found during the comparison of IgAN cases against HealthyControlsby nSolver was further used for selection of optimal miRNA using Least absolute shrinkage and selection operator (LASSO) regression23.
A minimum lambda value of 0.0057 was used for calculating the coefficients of all the features. Further non-zero features were categorized as Lasso-selected miRNA features. The above steps were completed with the ‘glmnet’ R package24.
Diagnostic value analysis for Lasso selected miRNA features
Receiver operating characteristic (ROC) curve analysis was performed to evaluate the diagnostic value of selected features by Lasso regression. The current study was used as the discovery cohort for the ROC curve analysis while the GEO dataset GSE64306 was used as the validation cohort21. For the ROC curve analysis a classic logistic regression (LR) model along with Leave-one-out cross-validation (LOOCV) was utilized to classify the subject as either IgAN or Control. LOOCV was employed through the caret R package25. The AUC values were calculated and visualized using the pROC R package26.
Consensus clustering of samples using Lasso selected miRNA features
To evaluate the efficiency of selected miRNA features on clustering samples to IgAN and Controls, Consensus clustering was applied using R package ConsensusClusterPlus v.1.62.027. The Euclidean distance was used to calculate the similarity distance between samples, with a hierarchical clustering algorithm used for clustering. The parameters pItem, pFeature and innerLinkage were set to 0.80, 1 and 'ward.D2' respectively with the scheme being executed for 500 times. The best k value of 2 (optimal number of clusters) was chosen on the basis of cumulative distribution function (CDF)28.The clusters identified within the samples were visualized using the R software package pheatmap v.1.0.12.
miRNA-mRNA-pathway network
For selected miRNA features with high AUC values, experimentally validated mRNA target prediction using miRTarBase v.9.0 database was performed29,30.
Further the pathway and disease enrichment analysis for the targets of each miRNA was performed using DAVID web server (https://david.ncifcrf.gov/)31. The network of miRNAs, their target genes, related pathways and disease association was constructed using Cytoscape software (https://www.cytoscape.org/)32.
Statistical analysis
All statistical analysis was performed by using R (version 4.0.2, https://www.r-project.org/). The correlation with clinical parameters were explored by the Pearson’s rank correlation coefficient. Receiver operating characteristic (ROC) curves were constructed by standard methods. P value below 0.05 was considered statistically significant.
Results
The mean age of IgA nephropathy cases was 36.32 ± 3.067 years and 76% were males and 24% were of female sex. Mean creatinine was 2.26 ± 0.318 mg/dl, mean proteinuria was 2.69 ± 0.64 and mean eGFR was 45.46 ± 8.492 ml/min/1.73m2 in the IgA nephropathy group (Table 1).
Table 1.
Baseline characteristics of IgA nephropathy cases, healthy controls and end stage kidney disease patients.
| Characteristics | IgA nephropathy (n = 50) | Healthy controls (n = 50) | IgA nephropathy end stage kidney disease (n = 25) |
|---|---|---|---|
| Mean age (in years) | 36.32 ± 3.067 | 39.81 ± 4.13 | 33.3529 ± 4.228 |
| Male:female | 3:1 | 3:1 | 2.6:1 |
| Mean S. creatinine (mg/dl) | 2.26 ± 0.318 | 0.8 ± 0.24 | 10.2847 ± 1.663 |
| Mean eGFR (ml/mib/1.73m2) | 45.46 ± 8.492 | 133.5 ± 53.5 | 7 ± 1.664 |
| Mean proteinuria (g/day) | 2.69 ± 0.64 | ||
| M1 | 98% | ||
| E1 | 46% | ||
| S1 | 26% | ||
| T1 | 38% | ||
| T2 | 12% |
Principal component analysis (PCA) of miRNA profiles showed that IgA nephropathy samples and samples from healthy control individuals were separate from each other (Fig. 1).
Figure 1.
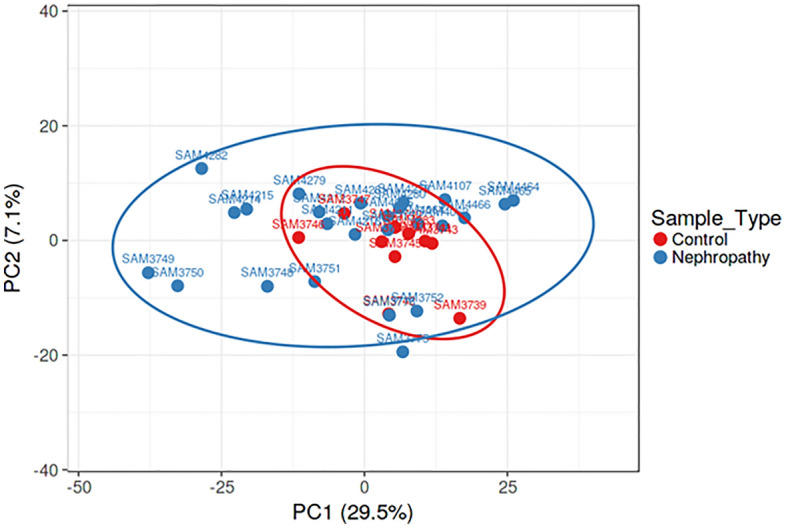
Principal component analysis dimension 1 and dimension 2 of IgA nephropathy samples (blue dots) and healthy controls (red dots).
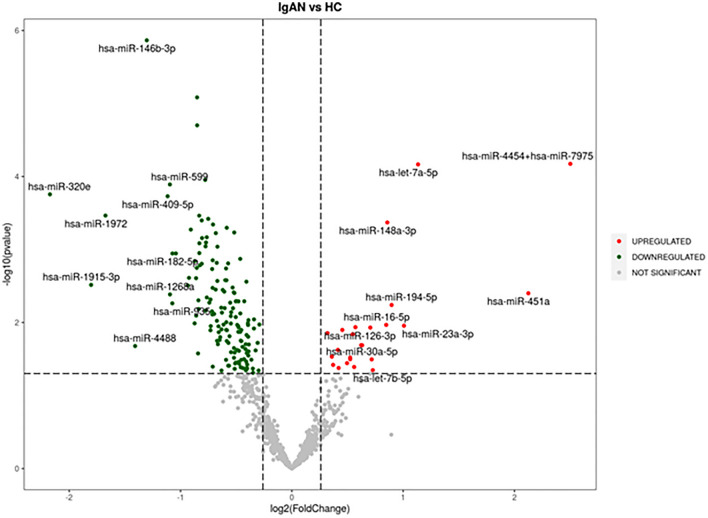
174 urinary exosomal miRNAs showed significant differential expression in IgA nephropathy cases compared to the healthy control population. Out of the 174 miRNAs, the majority (N = 150) were significantly downregulated and 24 were significantly upregulated (Fig. 2).
Figure 2.
Volcano plot: Significantly upregulated miRNA in IgA nephropathy samples compared to healthy controls are marked in red and downregulated miRNA are marked in green.
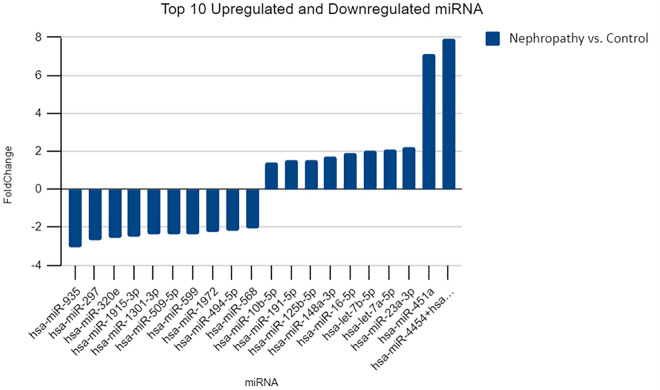
The top 10 significantly upregulated and top 10 significantly down regulated miRNAs are shown in Fig. 3.
Figure 3.
Top 10 upregulated and downregulated miRNA in IgA nephropathy cases compared to healthy controls.
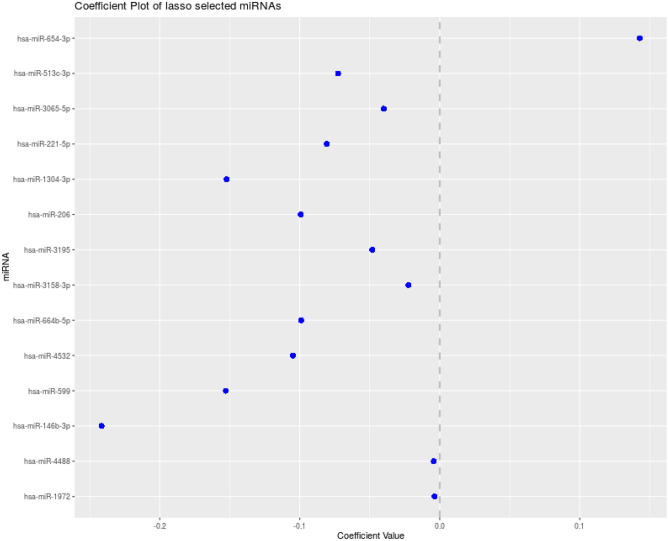
It was observed after Lasso regression that out of 174, 14 miRNAs were the most important ones (Fig. 4).
Figure 4.
Co-efficient plot of Lasso regression miRNAs.
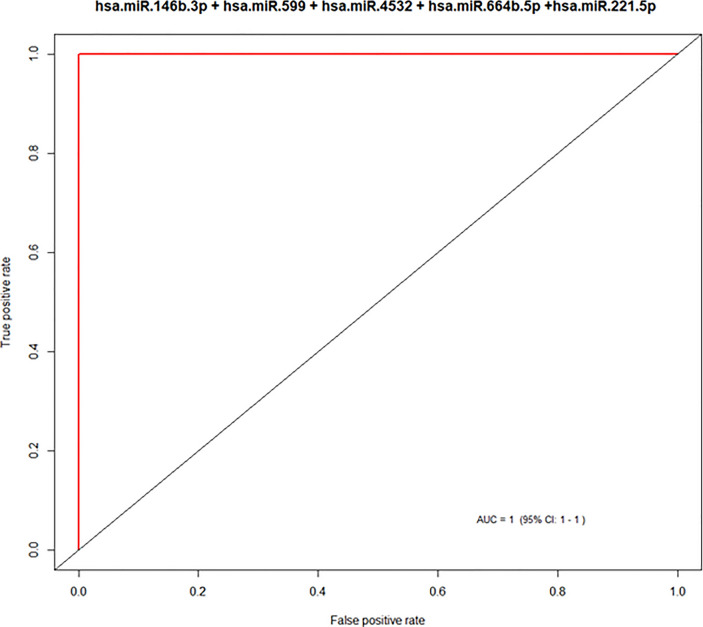
A group of 5 candidate miRNAs out of these 14 validated miRNAs had AUC values > 0.90 giving them a good probability of acting as a biomarker (Fig. 5 and Table 1).
Figure 5.
Area under the curve of > 0.9 for the group of 5 candidate miRNAs with a significant potential as biomarkers.
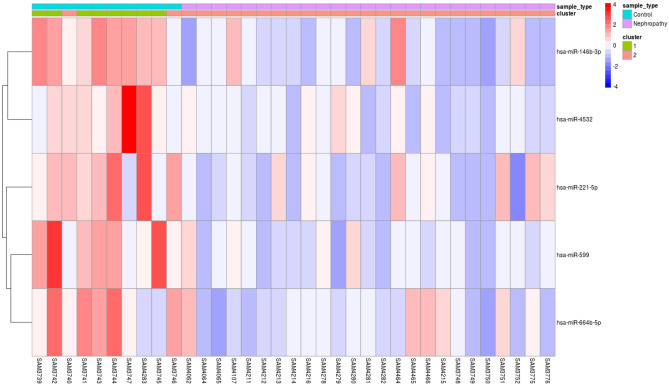
Consensus clustering was applied to check the efficiency of selected five candidate miRNA on clustering samples to IgAN and Controls. The group of these five important miRNAs which showed high AUC values > 0.90, were clustered into 2 groups. With the exception of two misclassifications among the controls, all remaining samples were correctly assigned to two different groups by the expression of selected candidate five miRNAs together with 99% efficiency. The results have been visualized as Heatmap (Figs. 6,7 and 8).
Figure 6.
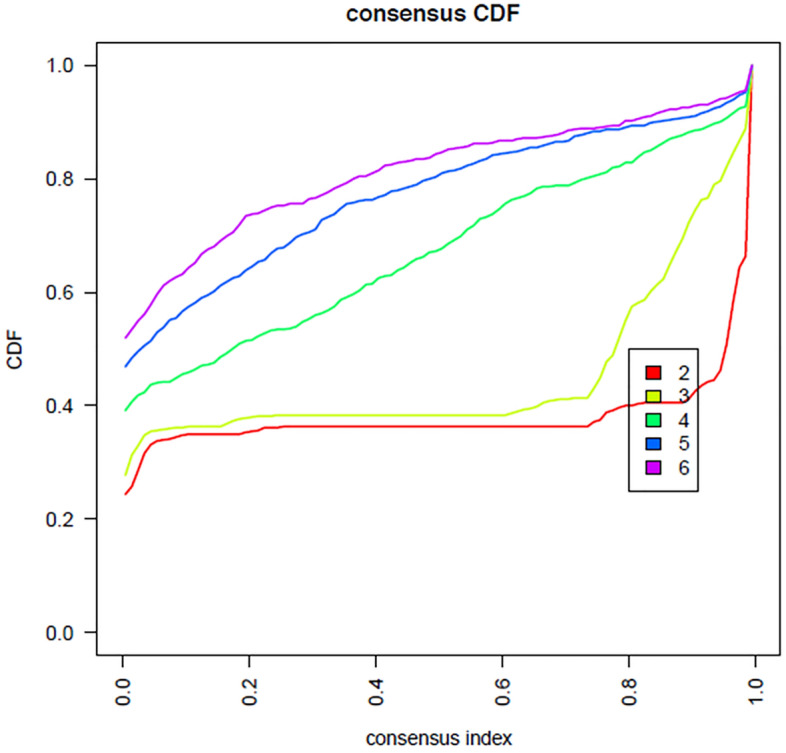
Consensus index—cumulative distribution function shows the red line with two peaks—cluster with two groups using the group of five candidate miRNAs.
Figure 7.
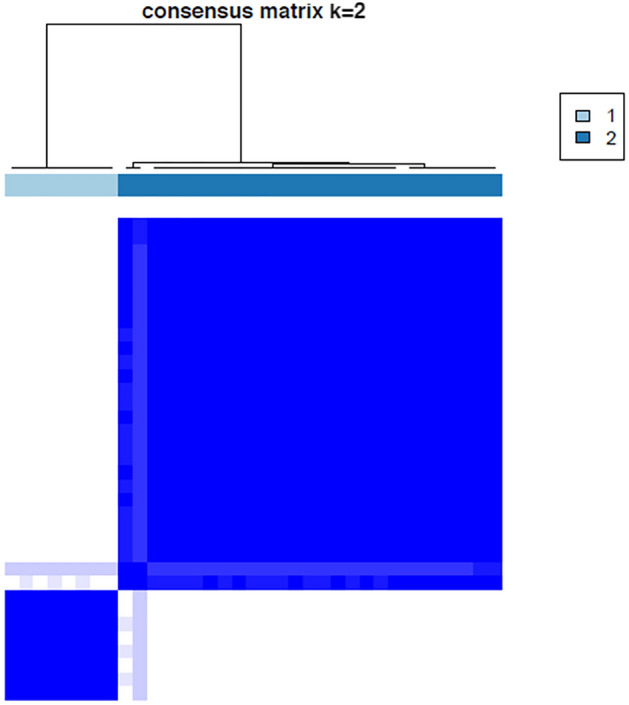
Consensus matrix shows cluster with two groups with the group of five candidate miRNAs.
Figure 8.
Heat map showing the 5 miRNAs with biomarker potential giving an accuracy of 99.
Validity of urinary exosomal miRNAs as biomarkers of IgA nephropathy
These five miRNA as a combined group were able to successfully differentiate between healthy controls and Ig A nephropathy cases with excellent sensitivity (100%), specificity (100%), positive predictive value (100%) and negative predictive value (100%) and a diagnostic efficacy of 99%. The area of the receptor-operator curve (AUC) is a measure of discrimination. The closer the value is to 1, higher accuracy of results. When the 5 miRNAs were combined, it showed excellent discrimination from healthy controls with AUC of 1.0 (95% CI 0.7–1.0, Table 2).
Table 2.
The diagnostic potential of the selected group of five significant miRNAs with biomarker potential.
| Model using all 5 miRNAs (hsa.miR.146b.3p + hsa.miR.599 + hsa.miR.4532 + hsa.miR.664b.5p + hsa.miR.221.5p) as feature | |
| Accuracy (95% CI) | 1 (0.7151, 1) |
| Sensitivity | 1 |
| Specificity | 1 |
| PosPredValue (PPV) | 1 |
| NegPredValue (NPV) | 1 |
| Prevalence | 0.1818 |
| DetectionRate | 0.1818 |
| DetectionPrevalence | 0.1818 |
| AUC | 1 |
| No. of misclassified samples | 0 |
| Wrongly classified samples | NA |
| Kappa | 1 |
Significant correlation of urinary exosomal miRNA with baseline parameters of IgA nephropathy cases are depicted in Table 3.
Table 3.
Significant correlation of urinary exosomal miRNA with baseline parameters of IgA nephropathy cases.
| Clinical parameter | miRNA | Pearson correlation | P value | Adjusted P value for age |
|---|---|---|---|---|
| Age | hsa-miR-491-3p | 0.772496182 | 6.04609E-06 | 0.043423004 |
| egfr | hsa-miR-375 | − 0.54406 | 0.004933 | |
| hsa-miR-31-5p | − 0.51072 | 0.009087 | ||
| hsa-miR-664b-5p | − 0.49217 | 0.01245 | ||
| hsa-miR-141-3p | − 0.46921 | 0.017971 | ||
| hsa-miR-200c-3p | − 0.43995 | 0.027755 | ||
| hsa-miR-379-5p | 0.412962 | 0.040198 | ||
| hsa-miR-378 h | 0.4311 | 0.031435 | ||
| hsa-miR-548n | 0.435125 | 0.029715 | ||
| hsa-miR-503-3p | 0.457449 | 0.021494 | ||
| hsa-miR-769-3p | 0.476456 | 0.016047 | ||
| hsa-miR-1288-3p | 0.490151 | 0.01287 | ||
| hsa-miR-320e | 0.495641 | 0.011752 | ||
| hsa-miR-548z + hsa-miR-548 h-3p | 0.498938 | 0.01112 | ||
| hsa-miR-877-5p | 0.502804 | 0.010415 | ||
| hsa-miR-888-5p | 0.514417 | 0.008516 | ||
| S. creatinine | hsa-miR-548q | − 0.48525 | 0.013942 | |
| hsa-miR-378 h | − 0.46509 | 0.019149 | ||
| hsa-miR-1306-3p | − 0.44899 | 0.024358 | ||
| hsa-miR-1288-3p | − 0.43612 | 0.029302 | ||
| hsa-miR-5010-5p | − 0.43251 | 0.030824 | ||
| hsa-miR-3918 | − 0.41029 | 0.041637 | ||
| hsa-miR-641 | − 0.40747 | 0.043204 | ||
| hsa-miR-200b-3p | 0.424832 | 0.034271 | ||
| hsa-miR-612 | 0.460265 | 0.020604 | ||
| hsa-miR-375 | 0.527563 | 0.006724 | ||
| 24 h urine protein | hsa-miR-22-3p | − 0.49976 | 0.010966 | |
| hsa-let-7 g-5p | − 0.45284 | 0.02302 | ||
| hsa-miR-664b-5p | − 0.44754 | 0.024878 | ||
| hsa-miR-362-3p | − 0.44636 | 0.025308 | ||
| hsa-miR-10b-5p | − 0.4404 | 0.027577 | ||
| hsa-miR-100-5p | − 0.41117 | 0.041161 | ||
| hsa-miR-31-5p | − 0.40368 | 0.045375 | ||
| hsa-miR-23a-3p | − 0.40259 | 0.046015 | ||
| hsa-miR-222-3p | − 0.40199 | 0.046375 | ||
| hsa-miR-502-5p | 0.454568 | 0.022437 | ||
| hsa-miR-1285-5p | 0.458466 | 0.021169 | ||
| hsa-miR-4284 | 0.476136 | 0.016128 | ||
| hsa-miR-206 | 0.480491 | 0.015051 | ||
| hsa-miR-888-5p | 0.492791 | 0.012322 | ||
| hsa-miR-548ar-5p | 0.506437 | 0.009787 | ||
| hsa-miR-2117 | 0.516496 | 0.008209 | ||
| hsa-miR-1972 | 0.518825 | 0.007876 | ||
| hsa-miR-664b-3p | 0.633966 | 0.000667 | ||
| hsa-miR-1286 | 0.647801 | 0.000463 | ||
| Mesangial expansion | hsa-miR-1276 | − 0.554350538 | 0.004033 | |
| hsa-miR-148b-3p | − 0.54655137 | 0.0047 | ||
| hsa-miR-4286 | − 0.50720338 | 0.009658 | ||
| hsa-miR-3161 | − 0.474829522 | 0.016464 | ||
| hsa-miR-549a | − 0.467379209 | 0.018487 | ||
| hsa-miR-2116-5p | − 0.415819383 | 0.038703 | ||
| hsa-miR-617 | 0.50912478 | 0.009342 | ||
| hsa-miR-370-3p | 0.513116038 | 0.008713 | ||
| hsa-miR-939-5p | 0.520636112 | 0.007624 | ||
| hsa-miR-95-3p | 0.533631587 | 0.00601 | ||
| hsa-miR-145-5p | 0.558133594 | 0.003739 | ||
| hsa-miR-552-3p | 0.564853874 | 0.003262 | ||
| hsa-miR-1268a | 0.567029713 | 0.003119 | ||
| hsa-miR-376b-3p | 0.601323816 | 0.001476 | ||
| hsa-miR-345-5p | 0.640731043 | 0.000559 | ||
| hsa-miR-936 | 0.660839044 | 0.000323 | ||
| Endocapillary proliferation | hsa-miR-141-3p | − 0.585538186 | 0.002104 | |
| hsa-miR-128–1-5p | − 0.552425255 | 0.00419 | ||
| hsa-miR-765 | − 0.55039623 | 0.004361 | ||
| hsa-miR-378e | − 0.520373969 | 0.00766 | ||
| hsa-miR-21-5p | − 0.515984397 | 0.008284 | ||
| hsa-miR-15a-5p | − 0.515499378 | 0.008355 | ||
| hsa-miR-204-5p | − 0.504783483 | 0.010069 | ||
| hsa-miR-1246 | − 0.501959962 | 0.010566 | ||
| hsa-miR-548q | − 0.497589026 | 0.011375 | ||
| hsa-miR-99a-5p | − 0.480267763 | 0.015105 | ||
| hsa-miR-450b-5p | 0.59814067 | 0.001588 | ||
| hsa-miR-597-5p | 0.601822556 | 0.001459 | ||
| hsa-miR-450a-1-3p | 0.615619987 | 0.001053 | ||
| hsa-miR-384 | 0.623321915 | 0.000873 | ||
| hsa-miR-523-3p | 0.633910168 | 0.000668 | ||
| hsa-miR-502-5p | 0.652513084 | 0.000408 | ||
| hsa-miR-1247-5p | 0.654903136 | 0.000382 | ||
| hsa-miR-133a-5p | 0.661072747 | 0.000321 | ||
| hsa-miR-382-5p | 0.687505183 | 0.000146 | ||
| hsa-miR-548d-3p | 0.697247218 | 0.000107 | ||
| Glomerulosclerosis | hsa-miR-3918 | − 0.440159559 | 0.02767 | |
| hsa-miR-1178-3p | − 0.428758656 | 0.032471 | ||
| hsa-miR-25-3p | 0.397451159 | 0.049134 | ||
| hsa-miR-93-5p | 0.432557742 | 0.030803 | ||
| hsa-miR-601 | 0.47677605 | 0.015966 | ||
| hsa-miR-4488 | 0.488926714 | 0.013131 | ||
| hsa-miR-423-3p | 0.50991998 | 0.009214 | ||
| Interstitial fibrosis and tubular atrophy | hsa-miR-1258 | − 0.522373537 | 0.00739 | |
| hsa-miR-548n | − 0.478327813 | 0.015578 | ||
| hsa-miR-100-5p | − 0.455529662 | 0.022119 | ||
| hsa-miR-455-5p | − 0.447259358 | 0.024981 | ||
| hsa-miR-378e | − 0.382669327 | 0.059029 | ||
| hsa-miR-627-3p | − 0.381315756 | 0.060007 | ||
| hsa-miR-1305 | − 0.379140547 | 0.061605 | ||
| hsa-miR-31-5p | − 0.362001741 | 0.075369 | ||
| hsa-miR-6511a-3p | − 0.357544996 | 0.079304 | ||
| hsa-miR-520a-5p | − 0.338430646 | 0.097972 | ||
| hsa-miR-539-5p | 0.40118042 | 0.046856 | ||
| hsa-miR-331-5p | 0.402409074 | 0.046124 | ||
| hsa-miR-548al | 0.407435901 | 0.043221 | ||
| hsa-miR-363-5p | 0.422764289 | 0.03525 | ||
| hsa-miR-6721-5p | 0.426606495 | 0.033448 | ||
| hsa-miR-199a-3p + hsa-miR-199b-3p | 0.443111451 | 0.026525 | ||
| hsa-miR-891b | 0.46766435 | 0.018406 | ||
| hsa-miR-1233-3p | 0.488245573 | 0.013278 | ||
| hsa-miR-33a-5p | 0.501372388 | 0.010672 | ||
| hsa-miR-499a-5p | 0.681817469 | 0.000174 |
IFTA interstitial fibrosis and tubular atrophy.
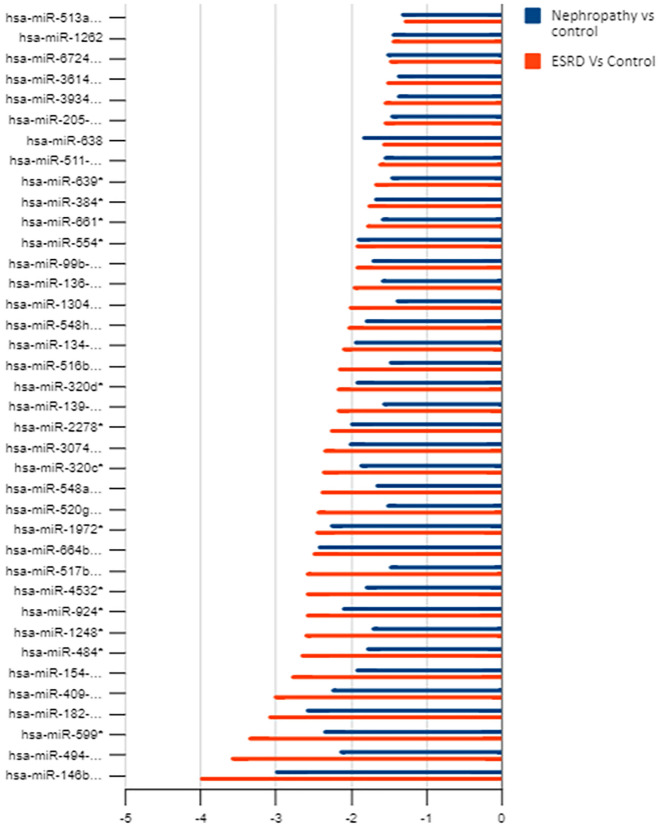
38 miRNAs were commonly downregulated in both IgA nephropathy cases and ESKD samples, it was found these miRNAs were progressively down regulated more in ESKD samples compared to IgA nephropathy case samples (Fig. 9).
Figure 9.
Indicates that the downregulation of miRNAs is increasing in the ESKD condition when compared to IgA Nephropathy.
In order to gain insight into the biological process regulated by these 5 miRNAs, gene enrichment analysis was performed using DAVID web server (Fig. 10). The results of which are provided in Supplementary Table 1.
Figure 10.
Showing the network of five downregulated miRNA (green), Pathways enriched (in red), experimentally target messenger RNA (black) and disease association (in pink).
Discussion
Worldwide, IgA nephropathy is the most common primary glomerulonephritis1. Unfortunately, there are no biomarkers for the diagnosis of IgA nephropathy. Urinary exosomes are a stable source of miRNAs, which makes urine a potential source for the discovery of biomarkers for kidney diseases. In this study, we discovered a number of differentially expressed urinary exosomal miRNA in patients with IgA nephropathy compared to healthy control population by nanostring technology. We identified that a group of five candidate miRNAs can be used to differentiate between healthy controls and IgA nephropathy.
A handful of genome-wide association studies have been performed on kidney biopsy tissues33, peripheral blood mononuclear cells34, and urine sediments35,36, identifying differential expression of miRNA in IgA nephropathy cases compared to healthy controls. This study is unique as urinary exosomal miRNAs were studied.
174 miRNA showed significant differential expression in this study compared to the healthy control population. Out of the 174 miRNAs, the majority (150) were significantly downregulated, and 24 were significantly upregulated. These results are consistent with the study by Tan et al.33, who studied miRNA in kidney biopsy tissue of IgA nephropathy patients and identified 85 differentially expressed miRNA, with the majority (74) being significantly downregulated and 11 being upregulated.
The biological role of the 5 identified miRNA were identified in the following studies:
| hsa-mir-4532 | Dysregulated in diabetes mellitus and diabetic nephropathy | 37 |
| hsa-mir-146b family | Chronic renal insufficiency models have shown that the expression of miR-146a in the kidney and urine is significantly related to inflammatory cell infiltration and interstitial lesions | 38 |
| hsa-mir-599 | Responsible for platelet related complications in chronic kidney disease | 39 |
| hsa-mir-221-5p | Promising biomarker for lupus nephritis | 40 |
| 41 | ||
| 42 |
To the best of our knowledge, this is the first study to identify the urinary exosomal miRNA signature in IgA nephropathy patients using nanostring technology and the first study conducted entirely in an Indian population. Only one other study from China43, identified urinary exosomal miRNA in IgAN cases. They identified differential expression of miR-215-5p,miR-378i,miR-365b-3p and miR-135b-5p. The results from this study was consistent and showed a significant differential expression in three of these miRNA. i.e. hs-mir-215, hs-miR-378, and hs-miR135b. However, this study from China43 had an even smaller sample size of 18 IgA nephropathy patients and used high throughput sequencing for screening followed by the RT-PCR method to identify a select few limited miRNAs.
Nevertheless, this study has a few limitations. First, other glomerular disease controls such as diabetic nephropathy, membranous nephropathy,minimal change disease and other chronic glomerulonephritis were not included in the study. Second, follow-up studies are required to assess the prognosis of the disease.
Conclusion
This study identifies urinary exosomal miRNA signature in IgA nephropathy patients for the first time. The urinary exosomal miRNAs hsa.miR.146b.3p + hsa.miR.599 + hsa.miR.4532 + hsa.miR.664b.5p + hsa.miR.221.5p. may serve as novel biomarkers of IgA nephropathy. This study provides insights into the pathogenetic mechanisms of IgA nephropathy, which may shed light on future therapeutic options and paves the way for interesting future research on miRNA in IgA nephropathy.
Supplementary Information
Acknowledgements
We thank Theracues Innovations Pvt Ltd, Bangalore, India, a service provider for NanoString platforms, team for performing miRNA probing assays on NanoString platform and Bioinformatic analysis.
Author contributions
M.S. conceptuialised the study. M.N.S., A.S. helped in collecion of sample. All the authors reviewed the article.
Funding
The funding was provided by Rajiv Gandhi University of Health Sciences, 20MED2076.
Data availability
The datasets generated and analysed during the current study are available in the Gene Expression Omnibus repository, [GEO, https://www.ncbi.nlm.nih.gov/geo/ under the accession number GSE244625].
Competing interests
The authors declare no competing interests.
Footnotes
Publisher's note
Springer Nature remains neutral with regard to jurisdictional claims in published maps and institutional affiliations.
Supplementary Information
The online version contains supplementary material available at 10.1038/s41598-023-47751-z.
References
- 1.Donadio JV, Grande JP. IgA nephropathy. N. Engl. J. Med. 2002;347:738–748. doi: 10.1056/NEJMra020109. [DOI] [PubMed] [Google Scholar]
- 2.McGrogan A, Franssen CF, de Vries CS. The incidence of primary glomerulonephritis worldwide: A systematic review of the literature. Nephrol. Dial. Transplant. 2011;26:414–430. doi: 10.1093/ndt/gfq665. [DOI] [PubMed] [Google Scholar]
- 3.Li PK, Ho KK, Szeto CC, Yu L, Lai FM. Prognostic indicators of IgA nephropathy in the Chinese–clinical and pathological perspectives. Nephrol. Dial. Transplant. 2002;17:64–69. doi: 10.1093/ndt/17.1.64. [DOI] [PubMed] [Google Scholar]
- 4.Szeto CC, Li PK. MicroRNAs in IgA nephropathy. Nat. Rev. Nephrol. 2014;10:249–256. doi: 10.1038/nrneph.2014.50. [DOI] [PubMed] [Google Scholar]
- 5.Kloosterman WP, Plasterk RH. The diverse functions of microRNAs in animal development and disease. Dev. Cell. 2006;11:441–450. doi: 10.1016/j.devcel.2006.09.009. [DOI] [PubMed] [Google Scholar]
- 6.Corapi KM, Chen JLT, Balk EM, Gordon CE. Bleeding complications of native kidney biopsy: A systematic review and meta-analysis. Am. J. Kidney Dis. 2012;60(1):62–73. doi: 10.1053/j.ajkd.2012.02.330. [DOI] [PubMed] [Google Scholar]
- 7.Korbet SM, Volpini KC, Whittier WL. Percutaneous renal biopsy of native kidneys: A single-center experience of 1055 biopsies. Am. J. Nephrol. 2014;39(2):153–162. doi: 10.1159/000358334. [DOI] [PubMed] [Google Scholar]
- 8.Harrison KL, Nghiem HV, Coldwell DM, Davis CL. Renal dysfunction due to an arteriovenous fistula in a transplant. J. Am. Soc. Nephrol. 1994;5:1300–1306. doi: 10.1681/ASN.V561300. [DOI] [PubMed] [Google Scholar]
- 9.Chandrasekaran K, Karolina DS, Sepramaniam S, Armugam A, Wintour EM, Bertram JF, Jeyaseelan K. Role of microRNAs in kidney homeostasis and disease. Kidney Int. 2012;81:617–627. doi: 10.1038/ki.2011.448. [DOI] [PubMed] [Google Scholar]
- 10.Mitchell PS, Parkin RK, Kroh EM, et al. Circulating microRNAs as stable blood-based markers for cancer detection. Proc. Natl. Acad. Sci. U.S.A. 2008;105:10513–10518. doi: 10.1073/pnas.0804549105. [DOI] [PMC free article] [PubMed] [Google Scholar]
- 11.Sole C, Cortes-Hernandez J, Felip ML, Vidal M, Ordi-Ros J. miR-29c in urinary exosomes as predictor of early renal fibrosis in lupus nephritis. Nephrol. Dial. Transplant. 2015;30:1488–1496. doi: 10.1093/ndt/gfv128. [DOI] [PubMed] [Google Scholar]
- 12.Cheng L, Sun X, Scicluna BJ, Coleman BM, Hill AF. Characterization and deep sequencing analysis of exosomal and non-exosomal miRNA in human urine. Kidney Int. 2014;86:433–444. doi: 10.1038/ki.2013.502. [DOI] [PubMed] [Google Scholar]
- 13.Wang G, Kwan BC, Lai FM, Chow KM, Kam-Tao Li P, Szeto CC. Expression of microRNAs in the urinary sediment of patients with IgA nephropathy. Dis. Mark. 2010;28:79–86. doi: 10.1155/2010/396328. [DOI] [PMC free article] [PubMed] [Google Scholar]
- 14.Wang G, Kwan BC, Lai FM, Chow KM, Li PK, Szeto CC. Urinary miR-21, miR-29, and miR-93: Novel biomarkers of fibrosis. Am. J. Nephrol. 2012;36:412–418. doi: 10.1159/000343452. [DOI] [PubMed] [Google Scholar]
- 15.Betzler BK, Sultana R, He F, Tham YC, Lim CC, Wang YX, Nangia V, Tai ES, Rim TH, Bikbov MM, Jonas JB, Kang SW, Park KH, Cheng CY, Sabanayagam C. Impact of chronic kidney disease epidemiology collaboration (CKD-EPI) GFR estimating equations on CKD prevalence and classification among Asians. Front. Med. (Lausanne) 2022;9:957437. doi: 10.3389/fmed.2022.957437. [DOI] [PMC free article] [PubMed] [Google Scholar]
- 16.Wang G, Szeto CC. Methods of microRNA quantification in urinary sediment. Methods Mol. Biol. 2013;1024:211–220. doi: 10.1007/978-1-62703-453-1_17. [DOI] [PubMed] [Google Scholar]
- 17.NanoString Technologies, Inc. nCounter® miRNA expression assay user manual (2013).
- 18.Miranda KC, Bond DT, McKee M, et al. Nucleic acids within urinary exosomes/microvesicles are potential biomarkers for renal disease. Kidney Int. 2010;78:191–199. doi: 10.1038/ki.2010.106. [DOI] [PMC free article] [PubMed] [Google Scholar]
- 19.Tsang HF, Xue VW, Koh SP, Chiu YM, Ng LPW, Wong SCC. NanoString, a novel digital color coded barcode technology: Current and future applications in molecular diagnostics. Expert Rev. Mol. Diagn. 2017;17(1):95–103. doi: 10.1080/14737159.2017.1268533]. [DOI] [PubMed] [Google Scholar]
- 20.Hong LZ, Zhou L, Zou R, Khoo CM, Chew ALS, Chin CL, et al. Systematic evaluation of multiple qPCR platforms, NanoString and miRNA-Seq for microRNA biomarker discovery in human biofluids. Sci. Rep. 2021;11(1):1–11. doi: 10.1038/s41598-021-83365-z. [DOI] [PMC free article] [PubMed] [Google Scholar]
- 21.Metsalu T, Vilo J. ClustVis: A web tool for visualizing clustering of multivariate data using principal component analysis and heatmap. Nucleic Acids Res. 2015;43(W1):W566–W570. doi: 10.1093/nar/gkv468. [DOI] [PMC free article] [PubMed] [Google Scholar]
- 22.Kern F, Fehlmann T, Solomon J, Schwed L, Grammes N, Backes C, et al. miEAA 2.0: Integrating multi-species microRNA enrichment analysis and workflow management systems. Nucleic Acids Res. 2021;48(W1):W521–8. doi: 10.1093/nar/gkaa309. [DOI] [PMC free article] [PubMed] [Google Scholar]
- 23.Tibshirani R. Regression shrinkage and selection via the lasso. J. R. Stat. Soc. Ser. B. 1996;58(1):267–288. [Google Scholar]
- 24.Geostatistics M, Diggle PJ, 間違っている Regularization paths for generalized linear models via coordinate descent. J. Stat. Softw. 2010;33(1):1–22. [PMC free article] [PubMed] [Google Scholar]
- 25.Kuhn M. Building predictive models in R using the caret package. J. Stat. Softw. 2008;28(5):1–26. doi: 10.18637/jss.v028.i05. [DOI] [Google Scholar]
- 26.Candes E, Tao T. The Dantzig selector: Statistical estimation when p is much larger than n. Ann. Stat. 2007;35(6):2313–2351. [Google Scholar]
- 27.Wilkerson MD, Hayes DN. ConsensusClusterPlus: A class discovery tool with confidence assessments and item tracking. Bioinformatics. 2010;26(12):1572–1573. doi: 10.1093/bioinformatics/btq170. [DOI] [PMC free article] [PubMed] [Google Scholar]
- 28.Şenbabaoğlu Y, Michailidis G, Li J. A reassessment of consensus clustering for class discovery. bioRxiv. 2014 doi: 10.1101/002642. [DOI] [PMC free article] [PubMed] [Google Scholar]
- 29.Da HS, Lin FM, Wu WY, Liang C, Huang WC, Chan WL, et al. MiRTarBase: A database curates experimentally validated microRNA-target interactions. Nucleic Acids Res. 2011;39(SUPPL. 1):163–169. doi: 10.1093/nar/gkq1107. [DOI] [PMC free article] [PubMed] [Google Scholar]
- 30.Huang HY, Lin YCD, Li J, Huang KY, Shrestha S, Hong HC, et al. MiRTarBase 2020: Updates to the experimentally validated microRNA-target interaction database. Nucleic Acids Res. 2020;48(D1):D148–D154. doi: 10.1093/nar/gkz896. [DOI] [PMC free article] [PubMed] [Google Scholar]
- 31.Huang DW, Sherman BT, Lempicki RA. Systematic and integrative analysis of large gene lists using DAVID bioinformatics resources. Nat. Protoc. 2008;4(1):44–57. doi: 10.1038/nprot.2008.211. [DOI] [PubMed] [Google Scholar]
- 32.Shannon P, Markiel A, Ozier O, Baliga NS, Wang JT, Ramage D, Amin N, Schwikowski BIT. Cytoscape: A software environment for integrated models of biomolecular interaction networks. Genome Res. 2003;13(11):2498–2504. doi: 10.1101/gr.1239303. [DOI] [PMC free article] [PubMed] [Google Scholar]
- 33.Tan K, Chen J, Li W, et al. Genome-wide analysis of microRNAs expression profiling in patients with primary IgA nephropathy. Genome. 2013;56:161–169. doi: 10.1139/gen-2012-0159. [DOI] [PubMed] [Google Scholar]
- 34.Serino G, Sallustio F, Cox SN, Pesce F, Schena FP. Abnormal miR-148b expression promotes aberrant glycosylation of IgA1 in IgA nephropathy. J. Am. Soc. Nephrol. 2012;23:814–824. doi: 10.1681/ASN.2011060567. [DOI] [PMC free article] [PubMed] [Google Scholar]
- 35.Duan ZY, Cai GY, Bu R, Lu Y, Hou K, Chen XM. Selection of urinary sediment miRNAs as specific biomarkers of IgA nephropathy. Sci. Rep. 2016;6:23498. doi: 10.1038/srep23498. [DOI] [PMC free article] [PubMed] [Google Scholar]
- 36.Wang N, Bu R, Duan Z, et al. Profiling and initial validation of urinary microRNAs as biomarkers in IgA nephropathy. PeerJ. 2015;3:e990. doi: 10.7717/peerj.990. [DOI] [PMC free article] [PubMed] [Google Scholar]
- 37.Kim H, Bae YU, Jeon JS, Noh H, Park HK, Byun DW, Han DC, Ryu S, Kwon SH. The circulating exosomal microRNAs related to albuminuria in patients with diabetic nephropathy. J. Transl. Med. 2019;17(1):236. doi: 10.1186/s12967-019-1983-3. [DOI] [PMC free article] [PubMed] [Google Scholar]
- 38.Yao X, Zhai Y, An H, Gao J, Chen Y, Zhang W, Zhao Z. MicroRNAs in IgA nephropathy. Ren. Fail. 2021;43(1):1298–1310. doi: 10.1080/0886022X.2021.1977320. [DOI] [PMC free article] [PubMed] [Google Scholar]
- 39.Plé H, Maltais M, Corduan A, Rousseau G, Madore F, Provost P. Alteration of the platelet transcriptome in chronic kidney disease. Thromb. Haemost. 2012;108(4):605–615. doi: 10.1160/TH12-03-0153. [DOI] [PMC free article] [PubMed] [Google Scholar]
- 40.Miguel V. The extracellular miRNA fingerprint of kidney disease: A narrative review. ExRNA. 2022;4:12. doi: 10.21037/exrna-22-2. [DOI] [Google Scholar]
- 41.Szeto CC, Wang G, Ng JK, Kwan BC, Mac-Moune Lai F, Chow KM, Luk CC, Lai KB, Li PK. Urinary miRNA profile for the diagnosis of IgA nephropathy. BMC Nephrol. 2019;20(1):77. doi: 10.1186/s12882-019-1267-4. [DOI] [PMC free article] [PubMed] [Google Scholar]
- 42.Navarro-Quiroz E, Pacheco-Lugo L, Lorenzi H, Díaz-Olmos Y, Almendrales L, Rico E, Navarro R, España-Puccini P, Iglesias A, Egea E, Aroca G. High-throughput sequencing reveals circulating miRNAs as potential biomarkers of kidney damage in patients with systemic lupus erythematosus. PLoS One. 2016;11(11):e0166202. doi: 10.1371/journal.pone.0166202. [DOI] [PMC free article] [PubMed] [Google Scholar]
- 43.Luan R, Tian G, Ci X, Zheng Q, Wu L, Lu X. Differential expression analysis of urinary exosomal circular RNAs in patients with IgA nephropathy. Nephrology (Carlton) 2021;26(5):432–441. doi: 10.1111/nep.13855. [DOI] [PubMed] [Google Scholar]
Associated Data
This section collects any data citations, data availability statements, or supplementary materials included in this article.
Supplementary Materials
Data Availability Statement
The datasets generated and analysed during the current study are available in the Gene Expression Omnibus repository, [GEO, https://www.ncbi.nlm.nih.gov/geo/ under the accession number GSE244625].


