

Abstract
In this study, zeolite Y was synthesised using a novel method. The heat generated from the reaction of H2SO4 with metakaolin was used as a heat source instead of applying external heat for the dealuminated process. The synthesised zeolite Y produced was analysed by scanning electron microscope (SEM), X-ray diffraction (XRD), Fourier-infrared spectroscopy (FTIR), energy dispersive X-ray spectroscopy (EDS) and Brunauer–Emmett–Teller (BET). Zeolite Y synthesis was mesoporous because of its pore diameter (30.53 nm), as shown in the BET results. Surface area and pore size decrease after adsorption due to dye deposition on the adsorbent’s surface. FTIR has bonds like O–H, C–H, –CH3, and –COOH responsible for adsorption. The maximum adsorption capacity of eosin yellow (EY) and methyl orange (MO) on to zeolite Y by the Langmuir isotherm was 52.91 mg/g and 20.62 mg/g respectively, at pH 2.5 and 8 for EY and MO dye. The batch adsorption studies were conducted, and the influence of different parameters (i.e., adsorbent dose, adsorption time, initial dye concentration, pH and temperature) was investigated. Experimental data were analysed by two linear model equations (Langmuir and Freundlich isotherms), and it was found that the Langmuir isotherm model best describes the adsorption data for methyl orange and Freundlich isotherm for eosin yellow, respectively. Adsorption rate constants were determined using linear pseudo-first-order and pseudo-second-order. The results showed that MO and EY dye adsorption onto zeolite Y followed a pseudo-second-order kinetic model. Thermodynamic studies show that adsorption was an exothermic reaction (enthalpy < 0) and feasible () at various temperatures under investigation.
Subject terms: Environmental sciences, Environmental social sciences, Energy science and technology, Materials science
Introduction
Synthetic dyes are used in the textile, paper, plastic, rubber, food, pharmaceutical, and cosmetic industries, and the discharge of dye wastewater to the environment and ecosystem at large is hazardous1, 2. Dyes are visible and undesirable at very low concentrations, and they significantly impact aquatic life due to reduced light penetration3. According to4, some dyes are hazardous and even carcinogenic. Each year, roughly 12% of synthetic dyes are lost during manufacturing and processing, and 20% reach the environment via effluents created by residual industrial wastewater treatment5. The dye industry is a significant industrial source of environmental pollution since it uses large amounts of water and, as a result, discharges effluent comprising a range of synthetic pigments. This accounts for up to 20% of all worldwide generated effluent6–10. Due to their high toxicity, strong colour and degradation resistance, dyes in wastewater have attracted much attention in recent years as their wastewater has increased, causing more significant damage to water resources11–13. This industrial release might negatively impact the ecosystem wildlife and cause soil/groundwater contamination9, 14–16. Water is unfit for drinking or other uses when it is contaminated or polluted due to pollutants such as industrial waste, agriculture, clinics, organic/inorganic chemicals and domestic sources2, 17–19.
Dyes possess complex aromatic molecular structures, enabling them to attain more stability and, as such, causing them to be challenging to break down (biodegrade). Dyes are hazardous water contaminant since they can be detected in polluted wastewater from numerous sectors and creates harmful and toxic effects on receiving water, even in trace concentrations20. Each year, more than 50 billion tonnes of dyes are anticipated to be used in the dyeing process, with reactive dyes accounting for over 30% of all dyes consumed globally. However, 20% and 60% of reactive dyes are lost throughout the dyeing process21, 22. Anionic dyes such as methyl orange (MO)23–28 and eosin yellow (EY)29–33 are one of them. Dyes are divided into three types—anionic, cationic, and non-ionic (dispersed dyes). In the wool and silk industries, eosin yellow (EY) dyes provide a red colour with a yellow fluorescence34. Methyl orange (MO) is utilised in printing, food, textile and pharmaceutical sectors and scientific research. Due to its −N=N− structure and low biodegradability, it may result in numerous human health and environmental problems35, 36. Dyes negatively affect human life, play a significant role in industrial wastewater and have a low degradation rate37. According to methyl orange 2022 market analysis, methyl orange is projected to grow at a CAGR of 5.5% from 2022 to 2030. The market growth is attributed to the increasing demand for methyl orange in laboratories, industries and agricultural applications. Also, the global Eosin market size was valued at USD Million in 2022 and will reach USD Million in 2028, with a CAGR from 2022 to 2028. Consequently, there is an urgent need to address the dye industry's challenge of removing toxins from water bodies and the environment.
The discovery and fabrication of new adsorbents for purifying hazardous pollutants from consumption water is essential for accomplishing the United Nations Sustainable Development Goals 6 (clean water and sanitation)38. Fabricating rapid techniques for synthesising low-cost, effective dye removal adsorbents is essential in wastewater purification9. Researchers investigated various methods for removing colour dye from wastewater39. The methods are ozonation40, 41, nanofiltration42, calcined alunite43; cloud point extraction34, 44, chemical coagulation/flocculation and oxidation processes45, 46; and adsorption39, 47. Adsorption is an excellent and significant method for treating industrial waste effluents because of its low cost, availability, economic viability, ease of operation and effectiveness48, 49. Zeolite is a porous hydrated mineral alumina silicate with chemical and physical cation exchange, molecular sieving and catalysis, and has high adsorption capacity50. It is employed as an adsorbent because of its large surface area, low production cost and raw material availability51. Zeolite possesses high ion exchange capacity, greater selectivity and specificity, and better radiation resistance. It has also shown advantages in immobilization and final disposal compared with organic ion exchangers52. This study uses eosin (EY) and methyl orange (MO) dye as adsorbates. These dyes were chosen based on their use in food, textile, pharmaceutical, paper printing and research facilities. Mono-azo groups in MO and EY and their low biodegradability raise environmental and public health concerns53. Due to its toxicity, removing these dyes from the water body is urgently needed. Adsorbents of various types are employed for dye removal. Although activated carbon is the most widely used adsorbent for removing a wide range of dyes, it is extremely expensive and difficult to regenerate54. Therefore, there is a need to develop alternative low-cost adsorbents in order to make the adsorption process a feasible wastewater treatment method.
To the authors' awareness, synthesised zeolite Y has not been thoroughly researched for removing MO and EY dye, except rebuffed. The main objective of this current study is to investigate and test the feasibility of removing MO and EY dyes from an aqueous solution using synthesised zeolite Y. The effect of various operating parameters on the adsorption of MO and EY dye in the batch process was investigated, including adsorption time, temperature, adsorbent dose, adsorbate concentration and pH. Furthermore, adsorption isotherms, kinetic models and thermodynamics were also determined.
Material and experimental procedure
Materials
Kaolin was procured from Arobieye village in Ado-Odo, Ota, Ogun state, Nigeria. With Sodium hydroxide pellets (Sigma-Aldrich, Lobal Chemie, ≥ 98%), concentrated sulfuric acid (Sigma-Aldrich, Lobal Chemie, 98%), Methyl orange (MO) (Sigma-Aldrich, ACS reagent, 99%), Eosin yellow (EY) (Merck chemical, > 99% purity). All these chemicals were of analytical grade and were used as received without further purification. Distilled water was used for the preparation of the solution.
Synthesis of zeolite Y
Kaolin was purified using the wet beneficiation method to remove the impurities and then air dried for 2 days. The purified kaolin was calcined at 850 °C for 6 h to convert kaolin to metakaolin, as reported by Babalola et al.55. This was because Si–O or Al–O tetrahedral and octahedral structures possessed by kaolin are inactive to activation or modification, which can prevent the direct production of zeolites. As a result, kaolin must undergo thermal transformation to convert the inert phase to the active phase at higher temperatures by adding an alkali hydroxide56–58. The metakaolin was dealuminated by using concentrated sulphuric acid to reduce the composition of alumina and have the desired silica-to-alumina molar ratio required for the synthesis of zeolite Y. Dealuminated metakaolin was washed several times with distilled water to remove unreacted chemical and adjust the pH to 7. Sodium hydroxide pellets were then reacted with dealuminated kaolin at a ratio of 2.5:1 by weight and molar composition of 6SiO2:Al2O3:9Na2O:24H2O50. The gel obtained was aged 7 days at room temperature and then hydrothermally crystallised at 100 °C for 24 h.
Batch equilibrium adsorption
Analytical chemical reagents were used without further purification in this study. MO and EY dyes were the adsorbates used. The MO and EY, dye solution concentrations were determined by a spectrophotometer (Shimadzu UV-160A) at 463 and 517 nm absorbance wavelengths, respectively. 1 g of MO and EY were dissolved separately in 1 L of distilled water to prepare a stock solution, and a serial solution of 20–60 mg/L was then used in the adsorption batch process. Synthesised zeolite Y was synthesised from kaolin deposits at Ogun state, Nigeria. Kaolin was subjected to several processes to synthesise zeolite Y with a Silica/Alumina molar ratio of 3.46; the procedure was described by50. The MO and EY dye concentrations were calculated at 463 and 517 nm absorbance wavelengths, respectively. Equation (1) was used to calculate the quantity of eosin yellow and methylene blue adsorbed at equilibrium, qe (mg/g):
| 1 |
The quantity of eosin yellow and methyl orange adsorbed (qt) at a time interval (t) was estimated using Eq. (2):
| 2 |
where m = weight of adsorbent (g), V = volume of adsorbate (L), Co and Ce are the initial concentration of adsorbate and equilibrium concentration of adsorbate (mg/L). Ct = concentration of the adsorbate any time t (mg/L).
Characterisation of Zeolite Y
The Nexus 470, Thermo Nicolet FTIR spectra USA model was used to determine the type of bonds in the sample over the 4000–400 cm−1 range. Images of zeolite Y were captured using scanning electron microscopy (SEM)-EDS model JOEL-JSF7600F.
Experimental adsorption studies
Adsorptive removal of MO and EY dye from aqueous solutions by synthesised zeolite Y adsorbent was investigated to determine the influence of adsorption time, temperature, adsorbent dose and pH. The influence of adsorption time on the adsorption system was studied by adding 100 mL solution containing (20, 30, 40, 50 and 60 mg/L) of MO and EY to each 0.1 g zeolite Y sample. At various temperatures (20, 30, 40, 50 and 60 °C), the samples were shaken using a shaker (Rotaterm orbital and linear chakra). Adsorption time ranging from 2 to 90 min, and the filtrate was separated from the spent zeolite Y. The influence of pH on MO and EY was investigated by combining 0.1 g of zeolite Y with 100 mL of MO and EY dye (30 mg/L) solution separately. The pH was adjusted using a solution of 0.1 M HCl and 0.1 M NaOH, and the mixture was then stirred for 1 h at 20 °C. The influence of adsorbent dosage on removing MO and EY dye at Co = 30 mg/L was also investigated with various adsorbent weights (0.1–0.5 g). The initial methyl orange and Eosin yellow concentrations (20–60 mg/L) were varied at 293 K, while adsorbent weight was held at 0.1 g/L for the adsorption isotherm investigations. The kinetic studies were carried out at 20 °C with an initial methyl orange and eosin yellow concentration of (20, 30, 40, 50, and 60 mg/L). Samples were collected at various shaking intervals until the methyl orange and eosin yellow concentrations reached equilibrium. Finally, the effect of temperature was investigated with 100 mL dye solution, 0.1 g adsorbent dosage and an adsorption time of 1 h at various temperatures (20, 30, 40, 50, and 60 °C).
Adsorption isotherms
The capacity of an adsorbent is determined by its ability to remove the contaminant. The adsorption capacity is determined by mass per mass basis; the weight of adsorbed contaminant per adsorbent weight is the adsorption strength of the adsorbent. Although unit analysis can produce a unitless quantity, the adsorption capacity, q, is commonly expressed in mg/g units. Variations in adsorbent, pH, contaminant concentration, and temperature will affect a specific contaminant's equilibrium adsorption capacity. Variation in adsorbent quantity, equilibrium adsorption capacity remains constant. Adsorption equilibrium studies offer information on the capacity of the adsorbent. Adsorption isotherms express the adsorbent's surface properties and affinity and are defined by constant values. Isotherms can determine the comparison of adsorptive capacities of adsorbents for various pollutants. Adsorption isotherms, which serve as the foundation for designing adsorption systems, can be used to analyse equilibrium data59–61.
Langmuir isotherm
Irving Langmuir isotherm focused on gases adsorbed on the solid surface, and it was derived from a proposed kinetic mechanism of Langmuir62.
The Langmuir postulates are as follows:
The adsorbent's surface features uniformly energetic adsorption sites.
The molecules striking the adsorbent surface and adsorbed
Adsorbed molecules did not interact with each other.
The adsorption extent is less than one complete mono-molecular layer on the surface i.e., monolayer coverage.
Each adsorbed complex has the same structure because they have the same mechanism.
The Langmuir isotherm is given by59:
| 3 |
Equation (3) is then linearised as shown below:
| 4 |
where b and represent Langmuir constant (L/mg) and adsorption maximum capacity (mg/g). and qe denote the amount of aqueous solution at equilibrium (mg/L) and the amount of aqueous solution absorbed by an adsorbent at equilibrium (mg/g). A plot of versus was used to calculate , and b.
Freundlich isotherm model
Adsorption on heterogeneous surfaces in dilute liquids is simulated using the Freundlich empirically derived model63. Freundlich was the first to develop a mathematical model for adsorption onto solid surfaces, and his equation is still one of the most frequently cited adsorption isotherms today. The isotherm is given by64.
| 5 |
where and n is the Freundlich adsorption constant and adsorption intensity (an empirical constant). The isotherm can be linearised to linear forms as shown below:
| 6 |
The adsorption constant was determined by a plotted graph of versus , which gives the value of and n. A straight-line graph was obtained with a slope of 1/n and the intercept on axis equal to .
Results and discussion
Zeolite Y characterization
The SEM microphotographs of the zeolite Y samples are shown in Fig. 1a–c. Figure 1a shows the SEM before adsorption, and Fig. 1b,c highlights the SEM image after methyl orange and eosin yellow dye adsorption. The image has pores of various sizes that allow the dyes methyl orange and eosin yellow to adhere to its surface, as shown in Fig. 1a. Figure 1a shows the bright spots and the adsorbent's rough, porous surface, which enhances adsorption capacity. Figure 1b,c shows that the dye covered the adsorbent's pores, caves and surfaces. Figure 1d–f shows the EDX analysis before and after methyl orange and eosin yellow adsorption unto zeolite Y. As seen in Fig. 1d–f, EDX results show that the main components of zeolite Y are Si, Al, O, and Na65–67. The Aluminium in the zeolite Y in Fig. 1d shifted from 8.55 to 10.21 and 10.41 in Fig. 1e,f, meaning the silicon quantity has reduced. The surface area was estimated using Brunauer–Emmett–Teller (BET). Accordingly, the surface area, pore size, and pore volume of Zeolite Y before adsorption (445.36 m2/g, 30.53 Å, 0.60 cm3/g) and after adsorption for methyl orange (438.25 m2/g, 23.79 Å, 0.60 cm3/g) and eosin yellow (442.67 m2/g, 25.53 Å, 0.60 cm3/g), respectively. The surface area of the adsorbent was reduced after adsorption because the dyes were adsorbed on the surface of the adsorbent. Table 1 depicts the BET results before and after loading. The FT-IR spectra of the zeolite Y adsorbent before and after loading are shown in Fig. 2. The bands at 3480.72, 1710.18, 1550.31, 1318.25, 780.13 cm−1 corresponding to O–H, C–H, –CH3, –COOH, –OH are present in zeolite Y. The peak at 3480.72 cm−1 is stretching vibrations of a hydroxyl group (O–H), 1710.18 cm−1 is C–H stretching vibration, and 1550.31 cm−1 is CH3 asymmetric deformation of the connection of the CH2 group68. The bands at 1318.25 and 780.13 cm−1 are COOH asymmetric stretching vibrations in the carboxyl group and OH` bending vibration of the carboxylic functional group. The band around 1100.28 cm−1 is likely attributed to the presence of asymmetrical stretch vibration of Si–O–Si and Si–O–Al stretching vibrations and at 571.46 cm−1 attributed to the presence of Si–O and Al–O bending vibration modes, as shown in Fig. 3 for zeolite Y before adsorption (B-ZEO). There is a significant difference in the FTIR before and after the adsorption of MO (A-ZEO-MO) and eosin yellow dye (A-ZEO-EYD), as shown in Fig. 3. The band at 1710.18 cm−1 (B-ZEO) shifted to 1742.30 cm−1 (A-ZEO-MO) and is attributed to C–H stretching vibration. The band at 780.13 cm−1 shifted to 800.15 cm−1 due to the carboxylic functional group's OH– bending vibration. Additionally, the band at 3480.72 cm−1 (B-ZEO) shifted to 3448.50 cm−1 (A-ZEO-EYD) due to O–H stretching vibrations of Silicon (Si–OH) and hydrogen bonding with other silicon or water molecules. The band at 571.46 cm−1 (B-ZEO) shifted to 550.15 cm−1 (A-ZEO-EYD) due to Si–O–Si symmetric stretching vibrations of bridge bonds and O–Si–O bending vibrations. Within the spectrum of the zeolite Y after adsorption, the band at 1318.28 cm−1 (B-ZEO) shifted to 1498.55 cm−1 (A-ZEO-MO), suggesting that the carboxylic acid functional group on MO was linked to an amino group in the zeolite Y69, 70.
Figure 1.

(a) SEM before adsorption, (b) SEM after adsorption of methyl orange, (c) SEM after adsorption of eosin yellow, (d) EDX before adsorption, (e) EDX after adsorption of methyl orange, (f) EDX after adsorption of eosin yellow.
Table 1.
BET results before and after adsorption.
| Sample | Surface area (m2/g) | Pore size (Å) | Pore volume (cm3/g) | Average pore diameter (nm) |
|---|---|---|---|---|
| Zeolite Y | 445.36 | 30.53 | 0.60 | 30.53 |
| Zeolite Y with eosin | 442.67 | 19.34 | 0.60 | 30.53 |
| Zeolite Y with MO | 442.61 | 25.53 | 0.60 | 30.53 |
Figure 2.

Spectra FTIR features of zeolite Y before and after adsorption with methyl orange and eosin yellow dye.
Figure 3.

(a) Effect of contact time on the amount adsorbed of eosin yellow, (b) effect of contact time on the amount adsorbed of methyl orange at (temperature = 303 K, agitation speed = 100 rpm, volume = 100 mL, weight = 0.1 g).
Effects of operational parameters on methyl orange and eosin yellow dye Adsorption
Contact time
Figure 3a,b demonstrate the effect of contact time on the quantity of dyes adsorbed. It was observed that the amount of MO and EY uptake is increased with increasing contact time at all initial dye concentrations. Furthermore, the amount of dye adsorbed increases with the initial dye concentration. The adsorption uptake for the first 30 min was rapid, then proceeded slower. As time proceeds, the dye concentration is reduced due to the accumulation of dye particles in the vacant sites, leading to decreased adsorption. At 60 min, the percentage removal of MO and EY onto zeolite Y was 63%, 61%, 59%, 53, and 59% for MO and 51%, 48%, 54.30%, 49.50%, and 56.40% for EY at concentrations of 20, 30, 40, 50, and 60 mg/L, respectively. At 90 min, the percentage removal of MO and EY onto zeolite Y was 80%, 67%, 65%, 61%, and 62% for MO and 60%, 51.20%, 64.70%, 65.60%, and 61% for EY at concentrations of 20, 30, 40, 50, and 60 mg/L, respectively. The large percentage removal at low concentrations is due to the availability of more active adsorption sites on the zeolite with less MO and EY molecules to occupy, so the limited available MO and EY molecules were adsorbed rapidly71, 72.
pH value
Figure 4a,b show the effect of pH on removing eosin yellow and methyl orange dyes from aqueous solutions at various pH levels. When the pH was varied from 2.5 to 10.0, eosin yellow and methyl orange had the greatest adsorption capability at pH 2.5 and 8. The maximum adsorption was observed at pH 2.5 with 95.70% for eosin yellow and pH 8 with 87.90% for methyl orange. These findings could be explained by the differences in surface charge and dye ionisation between the dyes (eosin yellow and methyl orange) and zeolite Y. The lower pH increases H+ ion concentration in an acidic medium, and the zeolite Y surface becomes more positively charged.
Figure 4.

Influence of pH on the removal of (a) eosin yellow dye, (b) methyl orange on zeolite Y (adsorbent dose = 0.1 g, initial concentration of both adsorbates = 50 mg/L, contact time = 60 min, agitation speed = 150 rpm, temperature = 303 K).
In contrast, in an alkaline medium, the higher pH OH− ion concentration and the zeolite Y surface become more negatively charged. The strong electrostatic attraction between the anionic methyl orange molecule and the positively charged adsorption site results in the high adsorption of methyl orange dye. Also, the strong electrostatic attraction between the cationic eosin yellow molecule and the negatively charged adsorption site results in high adsorption of eosin yellow dye73.
Adsorbent dosage
The adsorbent dose is also a significant criterion in adsorption studies because it involves effective adsorbate removal while saving money. Figure 5 describes the effect of adsorbent weight (zeolite Y), M, on equilibrium adsorption capacity (Qe). Figure 5a,b shows that as the adsorbent dosage is increased, the adsorption capacity decreases. This is due to the active sites being exposed to a small quantity of adsorbent while a few fractions were exposed to a higher dose of the zeolite Y72, 74. This will influence the increase in the percentage removal of the dyes (methyl orange and eosin yellow). An increase in adsorbent mass leads to increased active sites75.
Figure 5.

(a) Adsorbent dosage on eosin yellow dye adsorption by zeolite Y, (b) adsorbent dosage on methyl orange dye adsorption by Zeolite Y (Co = 30 mg/L, temperature = 303 K, time = 60 min, V = 100 mL).
Temperature effect
The influence of temperature on eosin yellow and methyl orange adsorption using zeolite Y as an adsorbent was studied. The adsorption capacity for the dyes is illustrated in Fig. 6a,b. The zeolite Y's adsorption capacity decreases as the temperature rises from 293 to 333 K. The amount adsorbed decreases from 16.35 to 10.66 mg/g at 20 mg/L, 20.39 to 14.99 mg/g at 30 mg/L, 21.57 to 14.19 mg/g at 40 mg/L, 26.08 to 16.32 mg/g at 50 mg/L and 29.39 to 18.27 mg/g at 60 mg/L for eosin yellow. Likewise for methyl orange, the amount adsorbed decreases from 7.20 to 3.58 mg/g at 20 mg/L, 14.37 to 7.56 mg/g at 30 mg/L, 19.24 to 8.35 mg/g at 40 mg/L, 26.61 to 11.19 mg/g at 50 mg/L, and 26.61 to 11.19 mg/g at 60 mg/L, respectively. These obvious trends support the notion that adsorption is advantageous at low and detrimental at high temperatures. This also implied an exothermic reaction corresponding to the estimated thermodynamic parameters71, 72. The amount of EY and MO adsorbed reduced as the temperature increased, which has a negative effect on eosin yellow and methyl orange adsorption on zeolite Y, demonstrating an inverse link between temperature and percentage removal and adsorption capacity of the adsorption system76.
Figure 6.

Effect of temperature on the (a) eosin yellow, (b) methyl orange on zeolite Y (adsorbent dose = 0.1 g, initial concentration of adsorbate = 100 mg/L, contact time = 60 min, agitation speed = 100 rpm).
Adsorption isotherm studies
Adsorption process design and optimisation require the development of an appropriate isotherm model. The adsorption isotherms parameter of eosin yellow and methyl orange dye onto zeolite Y were studied with the following model as shown in Figs. 7a,b and 8a,b. The results of the isotherm are presented in Tables 2 and 3. The adsorption system is better fitted in the Langmuir isotherm for methyl orange and best fitted with Freundlich isotherm for eosin yellow compared to the coefficient regression (R2). This implies that the adsorption system is monolayer and homogeneous for methyl orange and multilayer and heterogenous for eosin yellow, with maximum adsorption capacities for eosin yellow and methyl orange being 52.91 and 20.62 mg/g, respectively. Due to its ionic properties, eosin yellow dye has a higher uptake capacity than methyl orange dye; eosin yellow has a higher adsorption capacity, indicating that it is more attainable towards the porous adsorbent structure, as suggested by its lowest hydrated radii value. The RL value is within the 0 < RL < 1 range, implying that the adsorption process is favourable. In addition, the isotherm model was further justified with lower values of the sum of absolute error (EABS), the sum of square error (SSE), and chi-square (χ2) obtained, which also obeyed Langmuir isotherm for methyl orange and Freundlich isotherm for eosin yellow.
Figure 7.

Graphs for (a) Langmuir (b) Freundlich isotherm for the adsorption of eosin yellow (agitation speed = 140 rpm; pH 2.5; reaction time = 60 min; adsorbent weight = 0.1 g, tempt = 293 K).
Figure 8.

Graphs for (a) Langmuir (b) Freundlich isotherm for the adsorption of methyl orange (agitation speed = 140 rpm; pH 8; reaction time = 60 min; adsorbent = 0.1 g).
Table 2.
Isothermal constants of different isotherms for the adsorption system of eosin yellow dye onto zeolite Y.
| Isotherms | Parameters | 293 K | 303 K | 313 K | 323 K | 333 K |
|---|---|---|---|---|---|---|
| Langmuir | Qo (mg/g) | 2.60 | 52.91 | 47.17 | 28.49 | 21.23 |
| B (L/mg) | 6.38 | 30.75 | 22.02 | 14.61 | 9.02 | |
| R2 | 0.81 | 0.91 | 0.98 | 0.77 | 0.96 | |
| RL | 0.008 | 0.002 | 0.002 | 0.003 | 0.006 | |
| x2 | 0.42 | 34.59 | 31.33 | 9.31 | 6.65 | |
| SSE (%) | 0.29 | 11.86 | 10.66 | 2.58 | 1.85 | |
| EABS | 1.05 | 42.77 | 38.44 | 16.22 | 11.89 | |
| Freundlich | KF | 0.004 | 3.28 | 5.76 | 5.91 | 7.31 |
| 1/n | 2.53 | 0.47 | 0.43 | 0.45 | 0.45 | |
| R2 | 0.88 | 0.92 | 0.94 | 0.75 | 0.94 | |
| x2 | 3697.50 | 14.32 | 1.53 | 6.85 | 0.56 | |
| SSE (%) | 1.01 | 1.90 | 0.82 | 1.76 | 0.16 | |
| EABS | 3.65 | 6.86 | 2.97 | 6.36 | 2.03 |
Table 3.
Isothermal constants of different isotherms for the adsorption system of methyl orange dye onto zeolite Y.
| Isotherms | Parameters | 293 K | 303 K | 313 K | 323 K | 333 K |
|---|---|---|---|---|---|---|
| Langmuir | Qo (mg/g) | 12.06 | 12.36 | 11.96 | 18.59 | 20.62 |
| B (L/mg) | -0.46 | 0.15 | 0.50 | 0.33 | 0.02 | |
| R2 | 0.95 | 0.95 | 0.99 | 1.00 | 0.96 | |
| RL | 0.12 | 0.26 | 0.09 | 0.13 | 0.69 | |
| x2 | 0.05 | 0.002 | 0.05 | 7.85 | 0.86 | |
| SSE (%) | 0.20 | 0.07 | 0.21 | 3.35 | 1.16 | |
| EABS | 0.74 | 0.26 | 0.76 | 12.08 | 4.20 | |
| Freundlich | KF | 3.41 | 0.25 | 1.93 | 8.79 | 0.15 |
| 1/n | 0.63 | 1.32 | 0.89 | 0.21 | 1.19 | |
| R2 | 0.87 | 0.91 | 0.92 | 0.80 | 0.93 | |
| x2 | 4.22 | 615.65 | 44.40 | 0.59 | 1797.70 | |
| SSE (%) | 1.05 | 3.43 | 2.57 | 0.63 | 4.51 | |
| EABS | 3.79 | 12.37 | 9.27 | 2.28 | 16.27 |
Adsorption kinetic studies
The adsorption kinetic investigation for the eosin yellow system was carried out by altering the adsorption time between 30 and 90 min. The adsorption kinetic model parameters of eosin yellow and methyl orange dye onto zeolite Y were studied with the following model as shown in Figs. 9a,b and 10a,b. The first-order, second-order pseudo and the error analysis results are presented in Tables 4 and 5. According to their regression coefficient (R2) and possible chemical interaction, results showed that the second-order pseudo model was best fitted when compared to the first-order pseudo models for both dyes, as the adsorption capacity of the experimental () was relatively close to the calculated () in second-order pseudo than first-order pseudo. In addition, the model was further justified with lower values of the sum of absolute error (EABS), the sum of square error (SSE), and chi-square (χ2) obtained, which also obeyed the second pseudo-second order.
Figure 9.

Graphs for (a) Pseudo-first order (b) Pseudo-second order for adsorption of eosin yellow (pH 2.5; agitation speed = 100 rpm; adsorbent dose = 0.1 g, temperature = 293 K).
Figure 10.

Plots for (a) Pseudo-first order and (b) Pseudo-second order for adsorption of methyl orange (pH 8; agitation speed = 100 rpm; adsorbent dose = 0.1 g, temperature = 293 K).
Table 4.
Show the kinetics model parameters for the adsorption of eosin yellow dye onto zeolite Y.
| Kinetic model | Parameters | |||||
|---|---|---|---|---|---|---|
| 293 K | ||||||
| Co (mg/L) | 20 mg/L | 30 mg/L | 40 mg/L | 50 mg/L | 60 mg/L | |
| Pseudo-first order | qoexpt (mg/g) | 3.65 | 9.61 | 18.43 | 23.92 | 37.60 |
| R2 | 0.94 | 0.96 | 0.77 | 0.89 | 0.93 | |
| qecal (mg/g) | 2.46 | 8.70 | 9.99 | 13.68 | 34.11 | |
| K1 | 0.08 | 0.07 | 0.04 | 0.10 | 0.09 | |
| x2 | 0.58 | 0.10 | 7.13 | 7.67 | 0.36 | |
| SSE (%) | 0.33 | 0.25 | 2.34 | 2.84 | 0.97 | |
| EABS | 1.19 | 0.91 | 8.44 | 10.24 | 3.49 | |
| Pseudo-second order | R2 | 1.00 | 0.93 | 1.00 | 1.00 | 0.99 |
| qecal(mg/g) | 4.03 | 13.95 | 19.53 | 26.32 | 42.02 | |
| qoexp(mg/g) | 3.65 | 9.61 | 18.43 | 23.92 | 37.60 | |
| K2 | 0.05 | 0.005 | 0.01 | 0.01 | 0.004 | |
| X2 | 0.04 | 1.35 | 0.06 | 0.22 | 0.46 | |
| SSE (%) | 0.11 | 1.20 | 0.31 | 0.67 | 0.13 | |
| EABS | 0.38 | 4.34 | 1.10 | 2.40 | 4.42 | |
Table 5.
Show the kinetic model parameters for the adsorption of methyl orange dye onto zeolite Y.
| Kinetic model | Parameters | |||||
|---|---|---|---|---|---|---|
| 293 K | ||||||
| Co (mg/L) | 20 mg/L | 30 mg/L | 40 mg/L | 50 mg/L | 60 mg/L | |
| Pseudo-first order | qoexpt (mg/g) | 12.80 | 15.63 | 20.76 | 24.39 | 32.53 |
| R2 | 0.96 | 0.80 | 0.93 | 0.61 | 0.74 | |
| qecal (mg/g) | 11.83 | 7.20 | 10.15 | 7.69 | 9.82 | |
| K1 | 0.09 | 0.04 | 0.07 | 0.05 | 0.08 | |
| x2n | 0.08 | 9.87 | 11.09 | 36.33 | 52.55 | |
| SSE (%) | 0.27 | 2.34 | 2.94 | 4.63 | 6.30 | |
| EABS | 0.97 | 8.43 | 10.61 | 16.70 | 22.71 | |
| Pseudo-second order | R2 | 0.98 | 0.99 | 1.00 | 1.00 | 1.00 |
| qecal (mg/g) | 15.17 | 17.39 | 21.79 | 25.84 | 33.90 | |
| qoexp (mg/g) | 12.80 | 15.63 | 20.76 | 24.39 | 32.53 | |
| K2 | 0.007 | 0.01 | 0.02 | 0.02 | 0.02 | |
| x2 | 0.37 | 0.18 | 0.05 | 0.08 | 0.06 | |
| SSE (%) | 0.66 | 0.49 | 0.28 | 0.40 | 0.38 | |
| EABS | 2.37 | 1.76 | 1.03 | 1.45 | 1.37 | |
Thermodynamic studies
The change in the value of the thermodynamic equilibrium constant , with temperature, can be used to estimate the enthalpy (), Gibb’s free energy () and entropy (). The thermodynamic equilibrium constant,, was determined using the relation:
| 7 |
The change in Gibb’s free energy was thus calculated using:
| 8 |
However,
| 9 |
The temperature dependence of the Gibbs free energy change can be written as:
| 10 |
As a result, substituting Eq. (9) into Eq. (10) yields Eq. (11), equilibrium constant can be described as temperature-dependent adsorption enthalpy change.
| 11 |
From Eq. (9).
| 12 |
Figure 11 and 12 show the plots of Against 1/T for eosin and methyl orange, respectively. The slopes and intercept of the linear plot are used to determine the values of and (Table 6).
Figure 11.
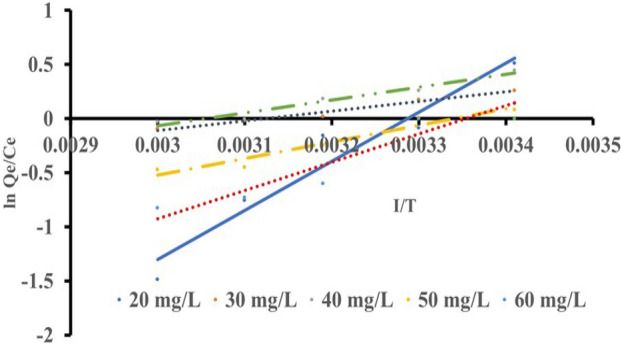
A plotted graph of against for eosin yellow.
Figure 12.
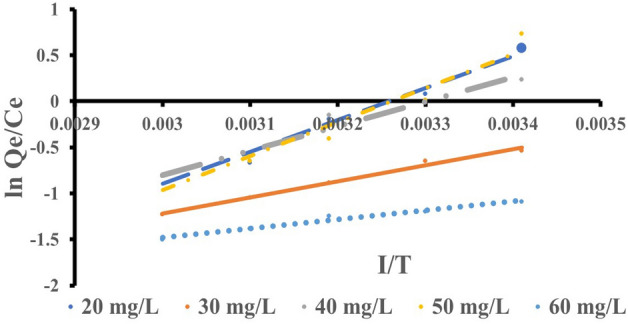
A plotted graph of against for methyl orange.
Table 6.
Thermodynamic parameters for removing eosin yellow and methyl orange from aqueous solution by zeolite Y.
| Parameter | Adsorbate | |
|---|---|---|
| Eosin yellow | Methyl orange | |
| (KJ/mol) | − 11,049.22 | − 8430.52 |
| (J/mol K) | − 123.95 | − 93.74 |
| (KJ/mol) at 293 K | − 11,012 | − 8403.06 |
| R2 | 0.94 | 0.98 |
The , , and Values denote exothermic reaction, decrease in liquid–solid interfaces and spontaneous77–79. The negative values of ΔG° indicated the feasibility and spontaneity of the adsorption process without an induction period80.
Adsorption mechanism
The adsorption mechanisms of MO and EY are presented in Fig. 13. The mechanisms of adsorption are described in terms of electrostatic interaction, functional group, π–π electron–donor–acceptor (EDA)/π–π interaction, adsorbent textural, crystalline properties, structure, Van der Waals force, hydrogen bond interaction, and methyl orange and eosin yellow properties in aqueous solution. The interaction between the positively charged on the surface of zeolite Y and the negatively charged of the MO and EY increased the adsorption capability of zeolite Y to MO and EY81, 82. When proton acceptor and proton donor groups are engaged, carboxylic and hydroxyl groups on the surface of zeolite Y interact with MO and EY via hydrogen bonding82–84. MO and EY could possibly adsorb on the zeolite Y’s outer layer by π–π stacking85. The surface area and total pore size of the BET of zeolite Y before MB and EY dye adsorption were 445.36 m2/g and 30.5342 Å, respectively, while after adsorption they were 442.67 m2/g and 19.3421 Å for EY and 442.607 m2/g and 25.5342 Å for MO. The reduction in surface area and pore size following MB and EY dye adsorption suggests pore filling due to dye molecule occupation after adsorption.
Figure 13.

Adsorption mechanism of MO and EY onto zeolite Y.
Conclusion
The current research involved using zeolite Y as an adsorbent to remove MO and EY dye from an aqueous solution. This research showed the potential of zeolite Y as an efficient adsorption performance. The well-developed zeolite Y porous structure, with BET surface area and total pore volume of 445.36 m2/g and 0.603567cm3/g, respectively, improves adsorption. Equilibrium studies showed that Langmuir isotherm best fits with methyl orange, while Freundlich isotherm was best described as the adsorption isotherm of eosin yellow. The pseudo-second-order kinetic model exhibited the best correlation for the experimental data. Thermodynamic studies show that adsorption was an exothermic reaction (enthalpy < 0) and feasible () at the temperature under investigation. Finally, due to its high surface area, large adsorption capacity, and cost-effectiveness, zeolite Y prepared from kaolin seems to be an effective and efficient adsorbent for the removal of eosin yellow and methyl orange dye from aqueous solution as its raw material (kaolin) is readily available in different parts of the country (Nigeria). Further study should be done on the re-usability of zeolite Y and the continuous adsorption process.
Acknowledgements
The authors thank Curtin University Malaysia for providing Curtin Malaysia Postgraduate Scholarship (CMPRS) for the first author and financial support from Curtin Malaysia Collaborative Research Scheme (CMCR) 2022 research Grant.
Author contributions
J.B.A.: conceptualization, methodology, visualization, writing—original draft, validation, data curation and interpretation, funding acquisition, supervision, D.O.B.: methodology, data curation, funding acquisition, O.J.E.: methodology, data, curation funding acquisition, P.N.E.: methodology, data interpretation. Y.H.T. and N.M.M.: review and editing the manuscript.
Data availability
Data is available on request from the corresponding authors.
Competing interests
The authors declare no competing interests.
Footnotes
Publisher's note
Springer Nature remains neutral with regard to jurisdictional claims in published maps and institutional affiliations.
Contributor Information
John Busayo Adeoye, Email: johnadeoye@postgrad.curtin.edu.my.
Yie Hua Tan, Email: tanyiehua@curtin.edu.my.
Nabisab Mujawar Mubarak, Email: mubarak.yaseen@gmail.com.
References
- 1.Syafalni S, Singh S, Zawawi M. Sorption of dye wastewater by using natural zeolite, anionic–cationic surfactant modified zeolite and cationic surfactant modified zeolite. World Appl. Sci. J. 2014;32(5):818–824. [Google Scholar]
- 2.Oladoye PO, Ajiboye TO, Omotola EO, Oyewola OJ. Methylene blue dye: Toxicity and potential technologies for elimination from (waste) water. Results Eng. 2022;20:100678. doi: 10.1016/j.rineng.2022.100678. [DOI] [Google Scholar]
- 3.Ahamad T, et al. Effective and fast adsorptive removal of toxic cationic dye (MB) from aqueous medium using amino-functionalised magnetic multiwall carbon nanotubes. J. Mol. Liq. 2019;282:154–161. doi: 10.1016/j.molliq.2019.02.128. [DOI] [Google Scholar]
- 4.Fungaro DA, Bruno M, Grosche LC. Adsorption and kinetic studies of methylene blue on zeolite synthesised from fly ash. Desalin. Water Treat. 2009;2(1–3):231–239. doi: 10.5004/dwt.2009.305. [DOI] [Google Scholar]
- 5.Weber EJ, Stickney VC. Hydrolysis kinetics of reactive blue 19-vinyl sulfone. Water Res. 1993;27(1):63–67. doi: 10.1016/0043-1354(93)90195-N. [DOI] [Google Scholar]
- 6.Saha B, Debnath A, Saha B. Fabrication of PANI@ Fe–Mn–Zr hybrid material and assessments in sono-assisted adsorption of methyl red dye: Uptake performance and response surface optimisation. J. Indian Chem. Soc. 2022;99(9):100635. doi: 10.1016/j.jics.2022.100635. [DOI] [Google Scholar]
- 7.Das P, Debnath A. Reactive orange 12 dye adsorption onto magnetically separable CaFe2O4 nanoparticles synthesised by simple chemical route: Kinetic, isotherm and neural network modeling. Water Pract. Technol. 2021;16(4):1141–1158. doi: 10.2166/wpt.2021.064. [DOI] [Google Scholar]
- 8.Jawad AH, Abdulhameed AS, Reghioua A, Yaseen ZM. Zwitterion composite chitosan-epichlorohydrin/zeolite for adsorption of methylene blue and reactive red 120 dyes. Int. J. Biol. Macromol. 2020;163:756–765. doi: 10.1016/j.ijbiomac.2020.07.014. [DOI] [PubMed] [Google Scholar]
- 9.Raval NP, et al. Statistical physics modeling and evaluation of adsorption properties of chitosan-zinc oxide nanocomposites for the removal of an anionic dye. J. Environ. Chem. Eng. 2022;10(6):108873. doi: 10.1016/j.jece.2022.108873. [DOI] [Google Scholar]
- 10.Ramírez-Rodríguez LC, Mendoza-Castillo DI, Bonilla-Petriciolet A, Jiménez-Junca C. Comparison of adsorption performance of nanocomposite materials of whey protein nanofibrils, polycaprolactone and activated carbon for mercury removal. Environ. Nanotechnol. Monit. Manage. 2023;20:100826. [Google Scholar]
- 11.Ke P, et al. Preparation of quaternary ammonium salt-modified chitosan microspheres and their application in dyeing wastewater treatment. ACS Omega. 2020;5(38):24700–24707. doi: 10.1021/acsomega.0c03274. [DOI] [PMC free article] [PubMed] [Google Scholar]
- 12.Cai H, et al. Algal toxicity induced by effluents from textile-dyeing wastewater treatment plants. J. Environ. Sci. 2020;91:199–208. doi: 10.1016/j.jes.2020.01.004. [DOI] [PubMed] [Google Scholar]
- 13.Hui M, et al. A highly efficient magnetic chitosan “fluid” adsorbent with a high capacity and fast adsorption kinetics for dyeing wastewater purification. Chem. Eng. J. 2018;345:556–565. doi: 10.1016/j.cej.2018.03.115. [DOI] [Google Scholar]
- 14.Reghioua A, et al. Parametric optimisation by Box-Behnken design for synthesis of magnetic chitosan-benzil/ZnO/Fe3O4 nanocomposite and textile dye removal. J. Environ. Chem. Eng. 2021;9(3):105166. doi: 10.1016/j.jece.2021.105166. [DOI] [Google Scholar]
- 15.Reghioua A, et al. Magnetic chitosan-glutaraldehyde/zinc oxide/Fe3O4 nanocomposite: Optimisation and adsorptive mechanism of remazol brilliant blue R dye removal. J. Polym. Environ. 2021;29(12):3932–3947. doi: 10.1007/s10924-021-02160-z. [DOI] [Google Scholar]
- 16.Jawad AH, et al. Magnetic crosslinked chitosan-tripolyphosphate/MgO/Fe3O4 nanocomposite for reactive blue 19 dye removal: Optimisation using desirability function approach. Surf. Interfaces. 2022;28:101698. doi: 10.1016/j.surfin.2021.101698. [DOI] [Google Scholar]
- 17.Ali H, Khan E, Ilahi I. Environmental chemistry and ecotoxicology of hazardous heavy metals: Environmental persistence, toxicity, and bioaccumulation. J. Chem. 2019;20:19. [Google Scholar]
- 18.Oladoye PO, Adegboyega SA, Giwa A-RA. Remediation potentials of composite metal-organic frameworks (MOFs) for dyes as water contaminants: A comprehensive review of recent literatures. Environ. Nanotechnol. Monit. Manage. 2021;16:100568. [Google Scholar]
- 19.Ajiboye TO, Oladoye PO, Olanrewaju CA, Akinsola GO. Organophosphorus pesticides: Impacts, detection and removal strategies. Environ. Nanotechnol. Monit. Manage. 2022;17:100655. [Google Scholar]
- 20.Mousavi SR, Asghari M, Mahmoodi NM. Chitosan-wrapped multiwalled carbon nanotube as filler within PEBA thin film nanocomposite (TFN) membrane to improve dye removal. Carbohyd. Polym. 2020;237:116128. doi: 10.1016/j.carbpol.2020.116128. [DOI] [PubMed] [Google Scholar]
- 21.Tkaczyk A, Mitrowska K, Posyniak A. Synthetic organic dyes as contaminants of the aquatic environment and their implications for ecosystems: A review. Sci. Total Environ. 2020;717:137222. doi: 10.1016/j.scitotenv.2020.137222. [DOI] [PubMed] [Google Scholar]
- 22.Meng R, et al. Synthesis, spectroscopic characteristics, DFT study and dyeing performance of bischlorotriazine based water-soluble reactive dyes. Chemistryselect. 2022;7(20):e202200993. doi: 10.1002/slct.202200993. [DOI] [Google Scholar]
- 23.Azam K, et al. Development of recoverable magnetic mesoporous carbon adsorbent for removal of methyl blue and methyl orange from wastewater. J. Environ. Chem. Eng. 2020;8(5):104220. doi: 10.1016/j.jece.2020.104220. [DOI] [Google Scholar]
- 24.El Amri A, et al. Investigation of Typha Latifolia (TL) as potential biosorbent for removal of the methyl orange anionic dye in the aqueous solution. Kinetic and DFT approaches. J. Mol. Struct. 2023;1272:134098. doi: 10.1016/j.molstruc.2022.134098. [DOI] [Google Scholar]
- 25.Wu X, et al. Adsorption mechanism study of multinuclear metal coordination cluster Zn5 for anionic dyes congo red and methyl orange: Experiment and molecular simulation. Appl. Surf. Sci. 2022;586:152745. doi: 10.1016/j.apsusc.2022.152745. [DOI] [Google Scholar]
- 26.Bensalah J, et al. Investigation of the cationic resin Amberlite® IRC-50 as a potential adsorbent to remove the anionic dye methyl orange. Desalin. Water Treat. 2022;246:280–290. doi: 10.5004/dwt.2022.27984. [DOI] [Google Scholar]
- 27.Al-Odayni A-B, Alsubaie FS, Saeed WS. Nitrogen-rich polyaniline-based activated carbon for water treatment: Adsorption kinetics of anionic dye methyl orange. Polymers. 2023;15(4):806. doi: 10.3390/polym15040806. [DOI] [PMC free article] [PubMed] [Google Scholar]
- 28.Huang Z, et al. Preparation of pyridine-modified cotton fibers for anionic dye treatment. React. Funct. Polym. 2022;172:105155. doi: 10.1016/j.reactfunctpolym.2021.105155. [DOI] [Google Scholar]
- 29.Yadav SK, Dhakate S, Singh BP. Carbon nanotube incorporated eucalyptus derived activated carbon-based novel adsorbent for efficient removal of methylene blue and eosin yellow dyes. Bioresour. Technol. 2022;344:126231. doi: 10.1016/j.biortech.2021.126231. [DOI] [PubMed] [Google Scholar]
- 30.Wen Z, et al. Three-dimensional porous adsorbent based on chitosan-alginate-cellulose sponge for selective and efficient removal of anionic dyes. J. Environ. Chem. Eng. 2023;11(5):110831. doi: 10.1016/j.jece.2023.110831. [DOI] [Google Scholar]
- 31.Zhang W, et al. High flux and high selectivity thin-film composite membranes based on ultrathin polyethylene porous substrates for continuous removal of anionic dyes. J. Environ. Chem. Eng. 2022;10(2):107202. doi: 10.1016/j.jece.2022.107202. [DOI] [Google Scholar]
- 32.Papoola SA, et al. Organophilic clays for efficient removal of eosin Y dye properties. J. Saudi Chem. Soc. 2023;27(5):101723. doi: 10.1016/j.jscs.2023.101723. [DOI] [Google Scholar]
- 33.Islam A, Fatima S. Zirconium-2-imidazolidinethione functionalized reduced graphene oxide aerogel for efficient removal of fluoride ions and anionic dyes from aqueous solutions: Multivariate process optimization. CLEAN Soil Air Water. 2023;51(5):2200193. doi: 10.1002/clen.202200193. [DOI] [Google Scholar]
- 34.Purkait M, DasGupta S, De S. Adsorption of eosin dye on activated carbon and its surfactant based desorption. J. Environ. Manage. 2005;76(2):135–142. doi: 10.1016/j.jenvman.2005.01.012. [DOI] [PubMed] [Google Scholar]
- 35.Ghosh G, et al. Removal of methyl orange dye from aqueous solution by a low-cost activated carbon prepared from Mahagoni (Swietenia mahagoni) bark. Pollution. 2020;6(1):171–184. [Google Scholar]
- 36.Liu S, et al. Methyl orange adsorption from aqueous solutions on 3D hierarchical PbS/ZnO microspheres. J. Colloid Interface Sci. 2020;574:410–420. doi: 10.1016/j.jcis.2020.04.057. [DOI] [PubMed] [Google Scholar]
- 37.Mathur N, Bhatnagar P, Sharma P. Review of the mutagenicity of textile dye products. Univ. J. Environ. Res. Technol. 2012;2:2. [Google Scholar]
- 38.Bullen JC, Saleesongsom S, Gallagher K, Weiss DJ. A revised pseudo-second-order kinetic model for adsorption, sensitive to changes in adsorbate and adsorbent concentrations. Langmuir. 2021;37(10):3189–3201. doi: 10.1021/acs.langmuir.1c00142. [DOI] [PubMed] [Google Scholar]
- 39.Samsami S, et al. Recent advances in the treatment of dye-containing wastewater from textile industries: Overview and perspectives. Process Saf. Environ. Protect. 2020;143:138–163. doi: 10.1016/j.psep.2020.05.034. [DOI] [Google Scholar]
- 40.Wang C, et al. ozonation of an azo dye CI Remazol Black 5 and toxicological assessment of its oxidation products. Chemosphere. 2003;52(7):1225–1232. doi: 10.1016/S0045-6535(03)00331-X. [DOI] [PubMed] [Google Scholar]
- 41.Barredo-Damas S, et al. Study of preozonation influence on the physical-chemical treatment of textile wastewater. Desalination. 2005;182(1–3):267–274. doi: 10.1016/j.desal.2005.04.017. [DOI] [Google Scholar]
- 42.Dasgupta J, et al. Remediation of textile effluents by membrane based treatment techniques: A state of the art review. J. Environ. Manage. 2015;147:55–72. doi: 10.1016/j.jenvman.2014.08.008. [DOI] [PubMed] [Google Scholar]
- 43.Özacar M, Şengil İA. Equilibrium data and process design for adsorption of disperse dyes onto alunite. Environ. Geol. 2004;45:762–768. doi: 10.1007/s00254-003-0936-5. [DOI] [Google Scholar]
- 44.Purkait M, et al. Cloud point extraction of toxic eosin dye using Triton X-100 as non-ionic surfactant. Water Res. 2005;39(16):3885–3890. doi: 10.1016/j.watres.2005.07.034. [DOI] [PubMed] [Google Scholar]
- 45.Zaharia C, et al. Textile wastewater treatment by homogenous oxidation with hydrogen peroxide. Environ. Eng. Manage. J. 2009;8(6):1359–1369. doi: 10.30638/eemj.2009.199. [DOI] [Google Scholar]
- 46.Bouznif S, Bali M. Coupling of the coagulation/flocculation and the anodic oxidation processes for the treatment of textile wastewater. J. Water Supply Res. Technol. Aqua. 2021;70(4):587–599. doi: 10.2166/aqua.2021.166. [DOI] [Google Scholar]
- 47.Salleh MAM, Mahmoud DK, Karim WAWA, Idris A. Cationic and anionic dye adsorption by agricultural solid wastes: A comprehensive review. Desalination. 2011;280(1–3):1–13. doi: 10.1016/j.desal.2011.07.019. [DOI] [Google Scholar]
- 48.Ayob S, et al. A review on adsorption of heavy metals from wood-industrial wastewater by oil palm waste. J. Ecol. Eng. 2021;22:3. doi: 10.12911/22998993/132854. [DOI] [Google Scholar]
- 49.Abdullah N, et al. Recent trends of heavy metal removal from water/wastewater by membrane technologies. J. Ind. Eng. Chem. 2019;76:17–38. doi: 10.1016/j.jiec.2019.03.029. [DOI] [Google Scholar]
- 50.Adeoye J, Omoleye J, Ojewumi M, Babalola R. Synthesis of zeolite Y from kaolin using novel method of dealumination. Int. J. Appl. Eng. Res. 2017;12(5):755–760. [Google Scholar]
- 51.Samarghandi MR, Al-Musawi TJ, Mohseni-Bandpi A, Zarrabi M. Adsorption of cephalexin from aqueous solution using natural zeolite and zeolite coated with manganese oxide nanoparticles. J. Mol. Liq. 2015;211:431–441. doi: 10.1016/j.molliq.2015.06.067. [DOI] [Google Scholar]
- 52.El-Kamash A. Evaluation of zeolite A for the sorptive removal of Cs+ and Sr2+ ions from aqueous solutions using batch and fixed bed column operations. J. Hazard. Mater. 2008;151(2–3):432–445. doi: 10.1016/j.jhazmat.2007.06.009. [DOI] [PubMed] [Google Scholar]
- 53.Shah SS, Sharma T, Dar BA, Bamezai RK. Adsorptive removal of methyl orange dye from aqueous solution using populous leaves: Insights from kinetics, thermodynamics and computational studies. Environ. Chem. Ecotoxicol. 2021;3:172–181. doi: 10.1016/j.enceco.2021.05.002. [DOI] [Google Scholar]
- 54.Yagub MT, Sen TK, Afroze S, Ang HM. Dye and its removal from aqueous solution by adsorption: A review. Adv. Colloid Interface Sci. 2014;209:172–184. doi: 10.1016/j.cis.2014.04.002. [DOI] [PubMed] [Google Scholar]
- 55.Babalola, R., et al. Comparative analysis of zeolite Y from Nigerian clay and standard grade. In Proceeding International Conference on African Development Issues (2015).
- 56.Maciver VP, Dagde KK, Konne JL. Synthesis of zeolite X from locally sourced kaolin clay from Kono-Boue and Chokocho, Rivers state, Nigeria. Adv. Chem. Eng. Sci. 2020;10(4):399–407. doi: 10.4236/aces.2020.104025. [DOI] [Google Scholar]
- 57.Warzybok, M. & Warchoł, J. Synthesis of kaolin-based zeolite Y and its application for adsorption of two carbonyl compound gases. Czasopismo Inżynierii Lądowej, Środowiska i Architektury (2018).
- 58.Bahgaat AK, Hassan HE-S, Melegy AA, Abdel Karim A. Synthesis and characterisation of Zeolite-Y from natural clay of Wadi Hagul, Egypt. Egypt. J. Chem. 2020;63(10):3791–3800. [Google Scholar]
- 59.Dash S, Murthy PN, Nath L, Chowdhury P. Kinetic modeling on drug release from controlled drug delivery systems. Acta Pol. Pharm. 2010;67(3):217–223. [PubMed] [Google Scholar]
- 60.Uddin MT, Rahman MA, Rukanuzzaman M, Islam MA. A potential low cost adsorbent for the removal of cationic dyes from aqueous solutions. Appl. Water Sci. 2017;7:2831–2842. doi: 10.1007/s13201-017-0542-4. [DOI] [Google Scholar]
- 61.Parvin S, et al. Study on adsorption of Congo red onto chemically modified egg shell membrane. Chemosphere. 2019;236:124326. doi: 10.1016/j.chemosphere.2019.07.057. [DOI] [PubMed] [Google Scholar]
- 62.Langmuir I. The adsorption of gases on plane surfaces of glass, mica and platinum. J. Am. Chem. Soc. 1918;40(9):1361–1403. doi: 10.1021/ja02242a004. [DOI] [Google Scholar]
- 63.Freundlich H. Über die adsorption in lösungen. Z. Phys. Chem. 1907;57(1):385–470. doi: 10.1515/zpch-1907-5723. [DOI] [Google Scholar]
- 64.De Onis M, et al. The WHO Multicentre Growth Reference Study: Planning, study design, and methodology. Food Nutr. Bull. 2004;25(1_suppl_1):S15–S26. doi: 10.1177/15648265040251S104. [DOI] [PubMed] [Google Scholar]
- 65.Sivalingam S, Sen S. Optimisation of synthesis parameters and characterisation of coal fly ash derived microporous zeolite X. Appl. Surf. Sci. 2018;455:903–910. doi: 10.1016/j.apsusc.2018.05.222. [DOI] [Google Scholar]
- 66.Kouznetsova T, et al. Sorption and mechanism studies of Cu2+, Sr2+ and Pb2+ ions on mesoporous aluminosilicates/zeolite composite sorbents. Water Sci. Technol. 2020;82(5):984–997. doi: 10.2166/wst.2020.407. [DOI] [PubMed] [Google Scholar]
- 67.Safitri L, et al. Synthesis zeolite y from Kaolin Bangka Belitung: Activation of metakaolin with various concentration of sulfuric acid. J. Phys. Conf. Ser. 2020;20:25. [Google Scholar]
- 68.Queiroz MF, et al. Does the use of chitosan contribute to oxalate kidney stone formation? Mar. Drugs. 2014;13(1):141–158. doi: 10.3390/md13010141. [DOI] [PMC free article] [PubMed] [Google Scholar]
- 69.Zhao Y-W, Wang Y, Zhang X-M. Homochiral MOF as circular dichroism sensor for enantioselective recognition on nature and chirality of unmodified amino acids. ACS Appl. Mater. Interfaces. 2017;9(24):20991–20999. doi: 10.1021/acsami.7b04640. [DOI] [PubMed] [Google Scholar]
- 70.Bello V, Olafadehan O. Comparative investigation of RSM and ANN for multi-response modeling and optimisation studies of derived chitosan from Archachatina marginata shell. Alex. Eng. J. 2021;60(4):3869–3899. doi: 10.1016/j.aej.2021.02.047. [DOI] [Google Scholar]
- 71.Edet UA, Ifelebuegu AO. Kinetics, isotherms, and thermodynamic modeling of the adsorption of phosphates from model wastewater using recycled brick waste. Processes. 2020;8(6):665. doi: 10.3390/pr8060665. [DOI] [Google Scholar]
- 72.Olafadehan OA, Bello VE, Amoo KO, Bello AM. Isotherms, kinetic and thermodynamic studies of methylene blue adsorption on chitosan flakes derived from African giant snail shell. Afr. J. Environ. Sci. Technol. 2022;16(1):37–70. doi: 10.5897/AJEST2021.3065. [DOI] [Google Scholar]
- 73.Lafi R, Hafiane A. Removal of methyl orange (MO) from aqueous solution using cationic surfactants modified coffee waste (MCWs) J. Taiwan Inst. Chem. Eng. 2016;58:424–433. doi: 10.1016/j.jtice.2015.06.035. [DOI] [Google Scholar]
- 74.Alghamdi AA, et al. Efficient adsorption of lead (II) from aqueous phase solutions using polypyrrole-based activated carbon. Materials. 2019;12(12):2020. doi: 10.3390/ma12122020. [DOI] [PMC free article] [PubMed] [Google Scholar]
- 75.Benzaoui T, Selatnia A, Djabali D. Adsorption of copper (II) ions from aqueous solution using bottom ash of expired drugs incineration. Adsorp. Sci. Technol. 2018;36(1–2):114–129. doi: 10.1177/0263617416685099. [DOI] [Google Scholar]
- 76.Adeoye, J., et al. Adsorptive removal of cadmium (II) and Asensic (III) ion from aqueous solution using zeolite Y synthesised from Kaolin. In 2023 International Conference on Science, Engineering and Business for Sustainable Development Goals (SEB-SDG) (IEEE, 2023).
- 77.Bonetto L, et al. Removal of methyl violet 2B dye from aqueous solution using a magnetic composite as an adsorbent. J. Water Process Eng. 2015;6:11–20. doi: 10.1016/j.jwpe.2015.02.006. [DOI] [Google Scholar]
- 78.Miyah Y, et al. Assessment of adsorption kinetics for removal potential of Crystal Violet dye from aqueous solutions using Moroccan pyrophyllite. J. Assoc. Arab Univ. Basic Appl. Sci. 2017;23:20–28. [Google Scholar]
- 79.Al-Kadhi NS. The kinetic and thermodynamic study of the adsorption Lissamine Green B dye by micro-particle of wild plants from aqueous solutions. Egypt. J. Aquat. Res. 2019;45(3):231–238. doi: 10.1016/j.ejar.2019.05.004. [DOI] [Google Scholar]
- 80.Kkihrsomdhane D, et al. Adsorption, modeling, thermodynamic, and kinetic studies of methyl red removal from textile-polluted water using natural and purified organic matter rich clays as low-cost adsorbent. J. Chem. 2020;2020:1–17. [Google Scholar]
- 81.Wang Y, et al. Novel environmental-friendly nano-composite magnetic attapulgite functionalised by chitosan and EDTA for cadmium (II) removal. J. Alloys Compd. 2020;817:153286. doi: 10.1016/j.jallcom.2019.153286. [DOI] [Google Scholar]
- 82.Liu Z, et al. Preparation of a GO/MIL-101 (Fe) composite for the removal of methyl orange from aqueous solution. ACS Omega. 2021;6(7):4597–4608. doi: 10.1021/acsomega.0c05091. [DOI] [PMC free article] [PubMed] [Google Scholar]
- 83.Tourinho PS, Kočí V, Loureiro S, van Gestel CA. Partitioning of chemical contaminants to microplastics: Sorption mechanisms, environmental distribution and effects on toxicity and bioaccumulation. Environ. Pollut. 2019;252:1246–1256. doi: 10.1016/j.envpol.2019.06.030. [DOI] [PubMed] [Google Scholar]
- 84.Wang F, et al. Sorption behavior and mechanisms of organic contaminants to nano and microplastics. Molecules. 2020;25(8):1827. doi: 10.3390/molecules25081827. [DOI] [PMC free article] [PubMed] [Google Scholar]
- 85.Tian J, Wu S, Yin X, Wu W. Novel preparation of hydrophilic graphene/graphene oxide nanosheets for supercapacitor electrode. Appl. Surf. Sci. 2019;496:143696. doi: 10.1016/j.apsusc.2019.143696. [DOI] [Google Scholar]
Associated Data
This section collects any data citations, data availability statements, or supplementary materials included in this article.
Data Availability Statement
Data is available on request from the corresponding authors.