

Abstract
This study investigated the effect of mechanical damage of different impact energies (0.074 J, 0.160 J, 0.273 J) generated by a pendulum impactor and evaluated the bruise intensity and quality changes of bananas after 12 days of storage at 5, 13, and 22 °C. The bruise area (BA) and bruise susceptibility (BS) in the banana fruit were significantly increased as impact damage increased. The results of weight loss % and electrolyte leakage (EL%) were highly dependent on all studied factors; in the order of storage temperature > storage days > impact level. Storage temperature and impact damage accelerated the incidence of transpiration rate (TRm) during storage. Regarding color measurements, the results of image processing emphasized that storage at 13 °C exhibited the ideal color change in bruised fruit, which revealed a slow increment in lightness (L*) and yellowness (b*) until the last day of storage. The ethylene production rate (EPR) was recorded at its maximum peak on days 2 and 12 with values of 3.85 × 10⁻³ and 3.08 × 10⁻³ mg kg−1h−1 in banana fruit bruised by high-impact (0.273 J) and stored at 22 °C. Regardless of impact level, all size measurements reduction % including, surface area (As), geometric mean diameter (Dg), and fruit volume (Vf) of bruised bananas were higher at ambient storage conditions than those stored at 5 and 13 °C. The results of regression analysis can confirm the possibility of bruise susceptibility (BS) to estimate the quality changes of bruised fruit during storage.
Keywords: Fruit susceptibility, Image analysis, Pendulum technique, Electrolyte leakage, Size measurements
Graphical abstract
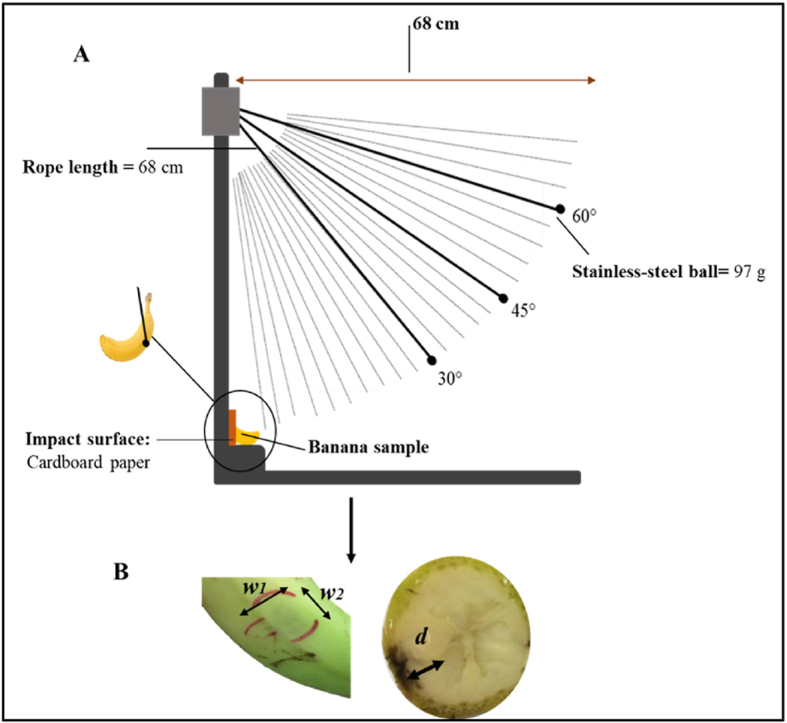
Pendulum device (A). Major (w1), minor (w2) dimeter, and depth (d) of the bruise.
Highlights
-
•
The bruise susceptibility was significantly higher at a higher impact level.
-
•
High-impact bruised bananas stored at 22 °C reduced weight loss by 19.55%.
-
•
The lightness was raised by 40.79% for a high-impact bruised banana stored at 13 °C.
-
•
Low-impact bruised bananas recorded a minimum respiration rate of 8.10 × 10⁻⁵ mg kg−1h1.
-
•
Storge at 5 °C and low impact showed the least decline in geometric mean diameter.
1. Introduction
Banana fruit are the largest crop in terms of trade volume and planting area worldwide. Bananas are highly grown in tropical and sub-tropical countries including, China, India, Brazil, the Philippines, and Ecuador, and provide one of the most important sources of income for farmers (Guo et al., 2022). Banana is one of the most consumed and preferred fresh fruit by many people. Bananas are the cheapest, a rich source of energy, and the most nourishing fruit contributing to food security in several countries. Bananas are essential as a cash crop, providing the key source of income to different rural populations (Siddiq et al., 2020). Bananas are susceptible to impact damage generated by unsuitable conditions during postharvest handling including transportation, distribution, packaging, etc (Pathare and Al-Dairi, 2022). Impacts produce irreversible damage to the internal and external properties of banana fruit. Bruising is the most common form of mechanical damage in bananas and other fresh produce (Opara and Pathare, 2014).
Mechanical damage resulting from impact damage is the most severe compared to other types of damage like compression and vibration. Impact damage occurs when the fresh produce fall with sufficient force against a particular surface or other fresh produce during packaging. The presence of bruising and other forms of mechanical damage (puncture, abrasion, and cuts) in fresh fruit and vegetables can cause enormous economic losses by decreasing the quality of horticultural products and displaying serious food safety concerns (Al-Dairi et al., 2022b). Besides, extreme bruise damages have been a big challenge in the process of developing mechanized production for fresh produce (Fu et al., 2023). Mechanical damages and the applied impact and load influence the physical, rheological, and chemical structure and properties of the fruit (Rashvand et al., 2022).
Impact damage increased the bruise occurrence in apples (Fu et al., 2023), pears (Pathare and Al-Dairi, 2021b; Stropek and Gołacki, 2020), pomegranates (Hussein et al., 2019), potatoes (Hendricks et al., 2022), bananas (Pathare and Al-Dairi, 2022), etc. Quality degradation due to mechanical damages during postharvest supply chain operations has become a major issue in the fresh fruit and vegetables industry. Increasing drop height and impact energy level increased the release of respiration and ethylene production rate of fruit (Celik et al., 2021). Bruising alters the color, falvor, textural properties that highly affect the acceptance of the consumers of fresh produce (Nguyen et al., 2022). The noticeable indication of bruise damage is the resultant reverse changes in fruit like acidity, sugar content, pH, (Pathare et al., 2022) lycopene, carotenoids contents (Pathare and Al-Dairi, 2021a), water loss, and firmness, which eventually decline the shelf-life and decrease the commercial value of fresh fruit (Dong et al., 2022). When the quality standards of processors and retailers are not met because of the bruises, fresh produce can be either rejected or purchased by the suppliers or retailers at a discount (Hendricks et al., 2022). Knowledge of mechanical damage occurrence in horticultural products is significant to reduce fruit and vegetables quality losses (Stropek and Gołacki, 2022) and to develop strategies for preventing this problem. This knowledge was found by reproducing bruise impact damage on the laboratory scale. Fresh produce susceptibility to mechanical damage has been investigated using several impact methods, including pendulum impactor and drop test (Lin et al., 2022).
Storage of fresh fruit and vegetables can extend the period of processing and help in their availability (Al-Dairi et al., 2021). Storage temperature is an essential environmental factor that influences the deterioration of harvested commodities (Al-Dairi and Pathare, 2021). Generally, low temperature decreases metabolic activities, water loss, and the activity of insects and also lessens the incidence of postharvest disease and slows ripening, while storage at higher temperatures accelerates all these damages (Al-Dairi et al., 2022b). Storage at a temperature below 10 °C can produce chilling injuries in banana fruit, whose symptoms include a dull, grey peel color, poor ripening, poor transformation of starch to sugar, poor flavor development, and high susceptibility to decay (Hailu et al., 2013). Opara et al. (2012) stated that storage between 11 and 12 °C can preserve the quality of bananas by maintaining the weight and extending the shelf life of the fruit. Storage at this range can decrease the respiration rate and enzymatic activities, thus, maintaining the quality of the produce and delaying the ripening process. Besides, storage at 13 °C reduces the occurrence of bruising and delays the alteration in physical, chemical, and physiological properties of bananas after short-term storage (Pathare and Al-Dairi, 2022). In other fruit like pomegranate, the bruise volume and bruise susceptibility occurrence were highly affected by the storage temperature (Hussein et al., 2019).
There are many studies explaining the mechanical damage in many fruit and vegetables. However, the effect of mechanical damage by pendulum test (as a simulated handling practice) was not studied earlier on a banana by considering three main factors including impact level (low, medium, and high), storage temperature (5, 13, and 22 °C), and storage duration (12 days). The effect of all of the above factors was studied on different parameters of banana fruit like weight reduction %, firmness, color parameters, electrolyte leakage, bruise intensity, and size measurements.
2. Materials and methods
2.1. Development of a pendulum-type impact device and absorbed energy calculations
In this study, a pendulum system was designed and developed to generate bruise damage in bananas that simulates the actual bruise produced during postharvest handling (Pathare et al., 2022). The pendulum impact test setup is shown in Fig. 1A. Compared to other types of impact tests, the pendulum approach permits better control of the falling weight during the experimental testing (Opara et al., 2007). The pendulum arm (rope) length is 0.68 m and was used to swing a 0.097 kg stainless-steel ball to hit the banana fruit once from different angles (heights). The surface material used under the banana samples is a piece of cardboard box which is the recommended package material used for banana fruit during the postharvest supply chain (Fernando et al., 2020).
Fig. 1.

Pendulum device (A). Major (w1), minor (w2) dimeter, and depth (d) of (B) the bruise.
The 0.097 m stainless-steel ball of the pendulum system was caught by hand to avoid multiple impact damage. After each impact, the fruit absorbed the energy (Equation (1)) of the dropped ball. The calculations done by Opara et al. (2007) and Polat et al. (2012) were followed to determine the actual energy absorbed (Ea) by the banana fruit that results in the measured bruise damage. Thus, it is necessary to estimate the equivalent rebound height (h2) at the maximum rebound which has been used to determine the rebound energy (Er) (Equation (2)). For these calculations, the actual rebound angle is required, which was recorded by using the graduated scale drawn on the whiteboard of the pendulum setup shown in Fig. 1A. To take accurate readings of the exact rebound angle, a camera (Model: EOS FF0D, Canon Inc., Tokyo, Japan) was utilized. By using Equation (3), the absorbed energy (Ea) was determined.
| (Eq. 1) |
| (Eq. 2) |
| (Eq. 3) |
where Ei is the impact energy, Er is the rebound energy, Ea is the absorbed energy, m is the mass of the stainless steel ball (97 g), g is the gravitational constant (9.81 ms−2), h1 is the equivalent drop height, h2 is the equivalent rebound height.
2.2. Sample preparation
Banana fruit cv. Malindi (phase 3) were obtained from The Central Fruit and Vegetables Market, Muscat, Oman (23°35′28.1″N latitudes and 58°13′28.3″E longitudes). The fruit were handled carefully and packed in cardboard paper boxes to prevent any mechanical damages and directly transported to Postharvest Technology Laboratory, Sultan Qaboos University, Oman (23°35′25.1″N latitudes and 58°10′07.9″E longitudes). The banana fruit were sorted and graded for further analysis based on the absence of pathogens, and physical defects as well as uniformity of size (length = 116.69 ± 0.91 mm, width = 31.37 ± 1.29 mm, thickness = 29.09 ± 0.16 mm), color (lightness = 44.53 ± 1.65, redness and greenness = −16.50 ± 1.50, yellowness and blueness = 41.10 ± 1.83), weight (65.35 ± 6.22 g), and firmness (80.23 ± 1.64 N) and then washed with distilled water and cleaned with a dry tissue to remove any dust or moist.
2.3. Experimental design
After grading, a total of 219 banana fruit were selected for the experiment. For this study, the pendulum arm was released from 3 different angles of 30°, 45°, and 60°, which can generate different levels of damage in banana samples that were defined as low (0.074 J), medium (0.160 J), and high (0.273 J) impact levels, respectively. Each group includes 72 (n = 72) banana samples. To recognize the bruised area of the fruit, a marker was used. Later, each group was divided into 3 subgroups for storage at 5, 13, and 22 °C. The overall experimental design and treatment applied for this study are shown in Table 1. The total number of treatments applied for the study was 9. For each treatment, 3 replications were utilized per day. A total of 3 replications were used for day 0 analysis. Many analyses were conducted including bruise measurements, weight, firmness, color, electrical leakage, size measurements, respiration rate, transpiration rate, and ethylene production rate after 2, 4, 6, 8, 10, and 12 days of impact and storage at 2-day intervals.
Table 1.
The overall experimental design of the study.
| Treatment No. | Released angle | Impact level | Absorbed energy (Ea-J) | Storage Temperature (°C) |
|---|---|---|---|---|
| 1 | 30° | Low | 0.074 ± 0.003 | 5 |
| 2 | 30° | Low | 0.074 ± 0.003 | 13 |
| 3 | 30° | Low | 0.074 ± 0.003 | 22 |
| 4 | 45° | Medium | 0.160 ± 0.008 | 5 |
| 5 | 45° | Medium | 0.160 ± 0.008 | 13 |
| 6 | 45° | Medium | 0.160 ± 0.008 | 22 |
| 7 | 60° | High | 0.273 ± 0.016 | 5 |
| 8 | 60° | High | 0.273 ± 0.016 | 13 |
| 9 | 60° | High | 0.273 ± 0.016 | 22 |
2.4. Bruise size measurements
The bruise size of the damaged banana fruit is shown in Fig. 1B. Major (w1) and minor (w2) diameters and bruise depth (d) of the elliptical bruise shape in bruised bananas were identified using a digital calliper (Model: Mitutoyo, Mitutoyo Corp., Japan). The bruise depth was identified by slicing the center of the bruised region of each fruit. The bruise size measurements of banana fruit are presented in terms of bruise area (BA), bruise volume (BV), bruise susceptibility (BS), and specific bruise susceptibility (SBS) which are calculated by following (Eq. 4), (Eq. 5), (Eq. 6), (Eq. 7)), respectively (Pathare et al., 2022).
| (Eq. 4) |
| (Eq. 5) |
| (Eq. 6) |
| (Eq. 7) |
where mf is the banana fruit mass.
2.5. Fruit quality assessment
2.5.1. Weight loss %
A total of 3 banana fruit per treatment per day were weighed individually during 12 days of storage at 2-day intervals. An electronic weight balance (Model: GX-4000, A & D Company, Tokyo, Japan) was used to conduct the measurement of weight measurement and the results were presented in % (Equation (8)).
| (Eq. 8) |
where Wi is the initial weight of individual banana on day 0 and Wt is the recorded fruit weight after storage day.
2.5.2. Electrolyte leakage
The electrolyte leakage experiment followed the method described by Maia et al. (2014). Briefly, a piece of 1 cm diameter of damaged fruit peel was removed then washed and dried using distilled water and absorbent paper, respectively. Then, the samples were incubated for 2 h at ambient temperature in capped test tubes including 18 mL distilled water. Later, the electronic conductivity meter probe (Model: 4510 conductivity meter, Jenway, Australia) was used to measure the initial conductivity. Subsequently, the capped test tubes containing the samples were autoclaved for 30 min at 121 °C and the readings of electric conductivity were recorded. The resulting data were expressed as the ratio between the first and second values multiplied by 100. For each day, a total of 3 electrolyte leakage measurements were taken per treatment.
2.5.3. Firmness
To measure the force required to puncture two positions of banana fruit, a digital fruit firmness tester (Model: FHP-803, L.L.C., Franklin, ME, USA) was used at two-day intervals. A total of 6 readings were taken for each treatment per day.
2.5.4. Transpiration, respiration, and ethylene production rate
The transpiration rate (TRm) was determined per unit of initial banana fruit mass by following the calculations in Equation (9) as described by Al-Dairi et al. (2022a). To measure the respiration rate (RR-CO2 and O2) and ethylene production rate (EPR-C2H4), the method explained by Pathare and Al-Dairi (2021c) was conducted. For each treatment, two plastic containers (2.3 L) containing 3 bananas as replications were used. An ethylene detector (Model: SCS 56, Fricaval89, Valencia, Spain) and O2/CO2 analyzer (Model:90 2D, Quantek Instruments, Inc., Grafton, Australia) were used to measure ethylene production rate and respiration rate, respectively. The calculations done by Dadzie and Orchard (1997) were followed to determine the values of both rates during the storage of all treatments.
| (Eq. 9) |
where mi is the initial mass of banana fruit (kg), and mt is the banana fruit mass time t (s).
2.5.5. Image process for color identification
A total of 135 color readings were taken per day (15 per treatment) for banana fruit skin by using image processing as explained by Al-Dairi et al. (2021). Images of all banana samples were acquired by the computer vision system. The camera (Model: EOS FF0D, Canon Inc., Tokyo, Japan) used by this system obtained the image in terms of Red, Green, and, Blue values (RBG). By using the ImageJ software (v. 1.53, National Institute of Health, MD), the RGB color values were converted to CIEL*a*b* color space. Lightness (L*), redness/greenness (a*), and yellowness/blueness (b*) of the non-bruise area of the fruit were recorded. Besides, chroma* (Equation (10)), hue* (Equation (11)), total color change (TCD) (Equation (12)), and yellowness value (YV) (Equation (13)) were calculated.
| (Eq. 10) |
| (Eq. 11) |
| (Eq. 12) |
| (Eq. 13) |
2.5.6. Size measurements (geometric mean diameter, surface area, and volume)
The most common size measurements including, length (L) (longitudinal perimeter), width (W), and thickness (T) (equatorial perimeter)) were determined by using a digital calliper (Model: Mitutoyo, Mitutoyo Corp., Japan). These measurements were used to calculate geometric mean diameter (Dg), surface area (As), and fruit volume (Vf) as follows ((Eq. 14), (Eq. 15), (Eq. 16))) (Dagdelen and Aday, 2021). All data were presented in reduction percentages.
| (Eq. 14) |
| (Eq. 15) |
| (Eq. 16) |
2.6. Statistical analysis
The resulting data of the study were converted to graphs using GraphPad Prism Software version 9.5.0 (GraphPad Software, Inc. San Diego, USA). Main effects (Factor A: impact level; factor B: storage temperature; factor C: storage duration) and their interactions on bruise magnitude and quality attributes of banana fruit were evaluated using Pareto analysis at 95% confidence interval by applying Minitab statistical software 21.2 (State College, Pennsylvania, USA). The data were expressed in mean ± standard deviation (S.D). The relationship between bruise susceptibility and quality attributes was assessed by using the coefficient of determination (R2) of the regression analysis.
3. Results and discussions
3.1. Bruise measurements
The mean ± SD of the bruise area (BA) bruise volume (BV) of low-impact (30°; 0.074 J), medium (45°; 0.160 J), and high-impact (60°; 0.273 J) bruised fruit over 12 days of storage at 5, 13, and 22 °C are presented in Table 2. There were statistically significant differences between the BA and the main three factors of the study (impact level, storage temperature, and storage duration). Impact level showed the highest influence on BA compared with storage temperature and storage duration. The BA values were in the range of 3.10–80 mm2. With storage time, the BA increased with the increment in both impact level and storage temperature. The mechanically damaged banana fruit by high-impact level (0.273 J) and medium-impact level (45°; 0.160 J) stored at 22 °C recorded the highest BA with values of 80.90 mm2 and 79.83 mm2, respectively. Followed by those bruised from high-impact levels and stored at 5 °C (45.02 mm2) after 12 days of storage. For BV, storage temperature displayed a higher statistical effect (P = 0.003182) followed by impact level (P = 0.007906) (Table 2). The differences in BV between storage days were not significant (P = 0.068739). The effect of impact damage and storage temperature in BV followed a similar trend of BA for high-impact level bruised bananas stored at ambient temperature (22 °C), where the BV on day 12 of storage was 2.09 × 104 mm3. In most cases, the damage from the angle of 30° (low impact) and storage at 13 °C showed the least damage on banana fruit with no high changes in the recorded values in BA and BV during the experiment.
Table 2.
Bruise area (BA), bruise volume (BV), and specific bruise susceptibility (SBS) of low-impact (30°; 0.074 J), medium (45°; 0.160 J), and high-impact (60°; 0.273 J) bruised fruit over 12 days of storage at 5, 13, and 22 °C. Error bars represent the SD of the mean values of 3 readings per treatment. Numerical values of A, B, and C are P-values. All P-values with * symbol are statistically significant. IL; impact level, ST, storage temperature; SD; storage duration.
| Days | Impact level | Storage temp. (°C) | BA (mm2) | BV (mm3) | SBS (mm3 J−1 g−1) |
|---|---|---|---|---|---|
| 2 | Low | 5 | 3.91 ± 0.003 | 2.60 × 10° ±50 × 10−3 | 0.56 ± 0.50 |
| 13 | 3.10 ± 0.86 | 1.48 × 101±2.10 × 101 | 5.90 ± 0.82 | ||
| 22 | 16.45 ± 1.32 | 3.96 × 10²±6.87 × 10² | 129.61 ± 151.64 | ||
| Medium | 5 | 17.61 ± 4.06 | 6.04 × 10²±2.54 × 10² | 34.12 ± 13.15 | |
| 13 | 14.80 ± 3.31 | 4.10 × 10²±1.78 × 10² | 40.35 ± 19.08 | ||
| 22 | 19.05 ± 9.16 | 9.84 × 10²±7.49 × 10² | 169.94 ± 64.58 | ||
| High | 5 | 18.20 ± 2.70 | 5.92 × 10²±1.43 × 10² | 35.73 ± 5.17 | |
| 13 | 10.13 ± 5.90 | 5.12 × 10²±7.42 × 101 | 27.57 ± 9.35 | ||
| 22 | 42.48 ± 6.05 | 3.50 × 10³±1.01 × 10² | 233.12 ± 84.55 | ||
| 4 | Low | 5 | 6.48 ± 0.67 | 4.14 × 10°±5.01 × 10⁻² | 0.90 ± 0.07 |
| 13 | 6.59 ± 1.90 | 3.69 × 10²±2.2 × 101 | 8.07 ± 5.94 | ||
| 22 | 22.96 ± 5.30 | 1.38 × 10³±2.23 × 10² | 190.67 ± 86.83 | ||
| Medium | 5 | 17.25 ± 0.36 | 5.69 × 10²±7.7 × 101 | 35.75 ± 13.68 | |
| 13 | 12.65 ± 0.011 | 2.89 × 10²±2.40 × 10 | 42.50 ± 3.53 | ||
| 22 | 14.03 ± 12.31 | 1.05 × 10³±1.62 × 10² | 214.00 ± 37.64 | ||
| High | 5 | 17.66 ± 0.56 | 5.60 × 10²±6.10 × 101 | 37.33 ± 10.25 | |
| 13 | 19.93 ± 3.27 | 1.16 × 10²±5.56 × 10² | 61.41 ± 29.58 | ||
| 22 | 42.63 ± 4.42 | 3.68 × 10³±1.05 × 10² | 259.63 ± 74.14 | ||
| 6 | Low | 5 | 7.43 ± 0.48 | 3.27 × 101±1.97 × 101 | 4.67 ± 4.77 |
| 13 | 6.66 ± 2.27 | 5.17 × 101±1.30 × 101 | 11.33 ± 10.04 | ||
| 22 | 24.97 ± 1.85 | 4.54 × 10³±2.05 × 10² | 455.94 ± 85.84 | ||
| Medium | 5 | 18.20 ± 0.20 | 6.67 × 10²±1.60 × 10² | 51.36 ± 6.05 | |
| 13 | 13.53 ± 8.67 | 7.04 × 10²±3.05 × 101 | 67.01 ± 36.60 | ||
| 22 | 23.64 ± 5.70 | 1.29 × 10³±5.31 × 101 | 511.48 ± 30.72 | ||
| High | 5 | 22.69 ± 2.34 | 7.84 × 10²±4.30 × 101 | 53.26 ± 23.41 | |
| 13 | 23.81 ± 3.49 | 1.86 × 10³±2.03 × 10² | 101.19 ± 27.59 | ||
| 22 | 50.26 ± 5.08 | 7.83 × 10³±2.76 × 10² | 555.35 ± 240.03 | ||
| 8 | Low | 5 | 7.52 ± 4.76 | 8.11 × 101±5.02 × 10 | 12.19 ± 10.80 |
| 13 | 6.98 ± 2.89 | 2.62 × 10²±2.18 × 101 | 38.14 ± 49.37 | ||
| 22 | 26.29 ± 4.23 | 3.17 × 10³±1.32 × 101 | 463.23 ± 97.19 | ||
| Medium | 5 | 19.24 ± 8.20 | 4.65 × 10²±2.42 × 10⁻¹ | 60.85 ± 11.58 | |
| 13 | 20.17 ± 7.89 | 1.08 × 10³±6.34 × 10² | 108.98 ± 70.41 | ||
| 22 | 34.73 ± 8.08 | 2.65 × 10³±1.12 × 10³ | 648.72 ± 114.14 | ||
| High | 5 | 44.18 ± 6.65 | 6.57 × 10²±1.09 × 10 | 64.33 ± 6.35 | |
| 13 | 25.39 ± 1.40 | 2.25 × 10³±3.10 × 10² | 126.06 ± 37.55 | ||
| 22 | 51.63 ± 2.48 | 8.83 × 10³±1.13 × 10³ | 810.03 ± 157.56 | ||
| 10 | Low | 5 | 8.00 ± 1.23 | 3.37 × 10²±1.86 × 101 | 25.50 ± 0.70 |
| 13 | 7.21 ± 0.00 | 1.64 × 10²±3.7 × 101 | 48.12 ± 48.50 | ||
| 22 | 27.47 ± 5.91 | 2.36 × 10³±1.26 × 10² | 526.39 ± 333.01 | ||
| Medium | 5 | 20.45 ± 3.65 | 1.78 × 10²±1.25 × 10 | 71.68 ± 2.09 | |
| 13 | 20.50 ± 0.73 | 1.07 × 10³±2.25 × 101 | 104.27 ± 18.52 | ||
| 22 | 39.13 ± 2.93 | 5.85 × 10³±9.33 × 10² | 717.68 ± 42.95 | ||
| High | 5 | 44.64 ± 0.60 | 1.27 × 10³±9.96 × 101 | 77.33 ± 17.00 | |
| 13 | 25.29 ± 0.21 | 3.20 × 10³±1.56 × 10² | 171.13 ± 64.51 | ||
| 22 | 70.35 ± 4.57 | 1.50 × 10⁴±3.28 × 10² | 1197.01 ± 311.53 | ||
| 12 | Low | 5 | 9.07 ± 0.60 | 1.40 × 10²±1.86 × 101 | 48.00 ± 2.82 |
| 13 | 7.00 ± 2.39 | 4.24 × 10²±2.94 × 10² | 99.34 ± 65.87 | ||
| 22 | 39.94 ± 6.07 | 2.16 × 10³±1.35 × 10³ | 641.87 ± 133.90 | ||
| Medium | 5 | 22.25 ± 0.39 | 8.86 × 10²±2.65 × 10² | 71.56 ± 12.61 | |
| 13 | 23.81 ± 6.51 | 1.70 × 10³±8.21 × 10² | 179.09 ± 102.29 | ||
| 22 | 79.83 ± 12.13 | 9.84 × 10³±3.23 × 10² | 1244.49 ± 342.12 | ||
| High | 5 | 45.02 ± 0.83 | 1.21 × 10³±1.03 × 10² | 81.34 ± 30.46 | |
| 13 | 27.36 ± 9.32 | 6.23 × 10³±8.88 × 10² | 363.96 ± 103.22 | ||
| 22 | 80.90 ± 16.64 | 2.09 × 10⁴±5.45 × 10² | 1609.72 ± 350.66 |
| Level of significance (P < 0.05) | |||
|---|---|---|---|
| BA | BV | SBS | |
| IL (A) | 0.000148* | 0.007906* | 0.010792* |
| ST (B) | 0.002986* | 0.003182* | 0.002186* |
| SD (C) | 0.035112* | 0.068739 | 0.175465 |
| A × B | 0.000299* | 0.001302* | 0.009494* |
| A × C | 0.001023* | 0.049119* | 0.123394 |
| B × C | <0.00001* | 0.002177* | <0.00001* |
| A × B × C | 0.100838 | <0.00001* | 0.000532* |
Fig. 2A shows the overall results of bruise susceptibility (BS) of low-impact (0.074 J), medium (0.160 J), and high-impact (0.273 J) bruised fruit over 12 days of storage at 5, 13, and 22 °C. The influences of each investigated factor, storage temperature, impact level, and storage duration and their interaction on the BS of banana fruit were explained using a standardized Pareto chart (Fig. 2B). All individual factors showed a critical effect on the BS of banana fruit (storage temperatures > impact level > storage duration). Irrespective of the applied impact levels, banana fruit stored at ambient temperature (22 °C) had higher BS than fruit stored at 5 and 13 °C. In the last two days of storage, medium and high-impact bruised banana fruit conditioned at ambient temperature had the highest BS with values of 8.37 × 10⁴ and 1.04 × 105 mm3 J−1, respectively. Table 2 presents the specific bruise susceptibility (SBS) which is the ratio of BS per fruit mass. There was a significant increase in the value of SBS as storage temperature (P = 0.002186) and impact level (P = 0.010792) increased. Storage duration had no effect on the SBS compared to other factors. The SBS of low-damaged banana fruit stored at 5 °C exhibited the lowest SBS values in the range of (0.56–48 mm3 J−1 g−1), while bananas conditioned at ambient temperature and damaged by high impact level showed the highest range (233.12–1609.72 mm3 J−1 g−1) on SBS value during the experiment.
Fig. 2.

Bruise susceptibility (BS) of low-impact (30°; 0.074 J), medium (45°; 0.160 J), and high-impact (60°; 0.273 J) bruised fruit over 12 days of storage at 5, 13, and 22 °C. The data are presented in mean ± SD of 3 readings per treatment (A). Standardised Pareto charts showing the main effects (storage temperature, impact level, and storage temperature) and their interaction on BS. The red vertical line corresponds to the 95% confidence level (P < 0.05) were all standardised main effects with bars passing over the mentioned line are statistically significant (B).
Previous studies have explained that temperature variation can affect the damaged fruit. The cell wall of the fruit can be influenced by storage temperature conditions. High storage temperature activates the enzymes resulting in cell wall degradation which is highly accelerated with the occurrence of bruising (Ahmadi, 2012; Hussein et al., 2019) that directly increases the BA, BV, BS, and SBS. The study also emphasized the statement mentioned by Opara and Pathare (2014), where elevating impact level/energy experienced higher BV of the fruit. After 28 days of storage. Pathare et al. (2022) revealed that increasing impact energy from 1.18 J to 2.29 J showed a higher intensity of damage which was highly correlated with the resulting BA of the pomegranate fruit, particularly for those stored at 22 °C. The study by Stropek and Gołacki (2020) recorded a higher bruise incidence and severity in potatoes impacted by a 30 cm drop height than in potatoes impacted by 18 and 8 cm drop heights, respectively. Also, Bugaud et al. (2014) found that reducing the temperature to 13 °C can reduce the incidence of bruising in fresh produce, which is highly observed in the values of BA and BV of damaged banana fruit of this study.
3.2. Measurements related to quality response
3.2.1. Weight loss %, electrolyte leakage (%), and firmness
The fruit weight loss % in all treatments was elevated during storage (Fig. 3A). The Pareto chart shown in Fig. 3D illustrated that the % of weight loss differed significantly with storage temperature, storage duration, and impact level. The highest loss in weight of all bruised bananas was highly noticed on the last day of storage. In this study, high and medium-impact bananas stored at ambient temperature (22 °C) exhibited 19.55% and 19.35% weight loss, respectively in bananas after 12 days of storage. The lowest reduction in weight (8.64%) was recorded in banana fruit stored at 5 °C after being impacted by the low level of damage (0.074 J). On the last day of storage at 13 °C, the minimum (10.90%) and maximum (12.26%) weight loss was also observed in high- and low-impact bruised fruit, respectively. Celik et al. (2021) found that the weight loss of the ‘Pink Lady’ apple elevated as the storage duration was prolonged, regardless of drop height. Bananas lost more weight as the impact level increased. Mechanical damage caused by inappropriate postharvest handling deteriorates the barriers to loss of water reduction leading to an increase in the water loss rate of fresh produce. Furthermore, the increment in respiration rate due to mechanical damage can lead to higher weight loss % in bruised fruit (Xia et al., 2020). Overall, bananas are highly susceptible to water loss due to the process of transpiration. The resulting transpiration rate can cause wilting and increase the incidence of bruising (Luyckx et al., 2016). The increase in weight loss observed in bananas may be due to an increase in respiration and ethylene production rate. This study verified this argument, particularly in bananas bruised with high impact levels and stored at ambient conditions. The changes in weight loss % could be attributed to the alterations in tissue damage and cell wall permeability resulting in higher moisture loss to the surrounding environment during storage (Adi et al., 2019) via the cell wall of mechanically damaged bananas. The outcomes explained here agreed with Wei et al. (2019) and Pathare and Al-Dairi (2021b). They found that prolonged storage time and mechanical damage accelerated the weight loss % in kiwifruit and pears. In another study, Pathare and Al-Dairi (2022) recorded that higher weight loss was observed when the impact damage and storage temperature (P < 0.05) increased in bananas, similar to the current study.
Fig. 3.

Weight loss % (A), electrolyte leakage (B), and firmness (C) of low-impact (30°; 0.074 J), medium (45°; 0.160 J), and high-impact (60°; 0.273 J) bruised fruit over 12 days of storage at 5, 13, and 22 °C. The data are presented in box and violin chart. The lines represent the mean value of 3 readings per treatment. Standardised Pareto charts showing the main effects (storage temperature, impact level, and storage temperature) and their interaction on weight loss % (D), electrolyte leakage (E), and firmness (F). The red vertical line corresponds to the 95% confidence level (P < 0.05) were all standardised main effects with bars passing over the mentioned line are statistically significant.
The percentage of electrolyte leakage (EL %) values among all factors are presented in Fig. 3B. From Pareto analysis (Fig. 3E), storage days (P < 0.000001), storage temperature (P = 0.000086), and impact level (P = 0.040902) had a significant impact on the EL % of banana fruit. In this study, as storage temperature increased, the EL % of bananas tended to increase. Besides, the EL % of all treatments increased with storage time (Fig. 3B). Regardless of impact level, storage at ambient temperature (22 °C) increased the EL % by 63.49%, 57.00%, and 51.61% for high, medium, and low-impact banana fruit, respectively. The EL % of bruised bananas stored at 13 °C was 44.60% (low impact), 43.50% (medium impact), and 44.29% (high impact) after 12 days of storage. For storage under cold temperatures (5 °C), the EL % of the low, medium, and high-impact bruised banana fruit elevated by 43.5%, 41.32%, and 44.85%, respectively. Electrolyte leakage percentage is highly correlated to plasma membrane integrity. The results recorded an increase in EL % which indicated the loss of plasma membrane integrity of banana fruit cells that is aligned with the ripening process (Maia et al., 2014).
The results of the EL% increment confirmed the obtained results of WL % and TRm. For instance, Adi et al. (2019) stated that the increase in WL % within storage time is because of the loss in moisture content (transpiration) via stomata cells of the banana fruit which is related to storage temperature. The mechanism of moisture loss in fresh fruit can occur due to vapour pressure differences between the produce and the storage environment resulting in vapour phase diffusion. Moisture loss during storage at higher temperatures is linked to cellular membrane degradation leading to leakage in cellular components and senescence process acceleration.
The results corroborate with the similar findings of Bugaud et al. (2014), who observed peel electrolyte leakage % increment in the banana after ripening and storage for 10 days. They found that the peel EL % appears to be one of the main parameters to develop the understanding of the differences in BS during ripening. Also, Ramírez-Sánchez et al. (2018) found that the E L% was gradually increasing to reach 40% on day 8 and to more than 60% on day 16 of storage.
After 12 days of postharvest storage, banana fruit firmness was declined across all treatments (Fig. 3C). Based on statistical data analysis, Fig. 3F demonstrates that all factors and some of their interactions statistically affected the firmness of banana fruit. The factor that experienced the largest influence was storage temperature followed by storage days and finally impact level. Accordingly, higher storage temperature and impact level contribute to high firmness reduction as storage lasts. In this study, the overall range of firmness values was 80.23 N and 18.70 N recorded on day 0 (all bananas) and day 12 (for high-impact bruised bananas stored at the ambient condition), respectively. Storage at 5 °C showed a reduction in firmness status with values of 67.03 N, 64.50 N, and 64.17 N for low, medium, and high-impact bruised banana fruit, respectively after 12 days of storage. However, firmness values were 50.06 N, 40.93 N, and 37.83 N for low, medium, and high-impacted banana fruit, respectively on the last day of the experiment. Generally, banana impacted by the low level of damage and stored at cold temperature (5 °C) was firmer than those stored at 22 °C and 13 °C after being impacted by high and medium damage level on day 12 of storage.
In terms of storage condition, Mubarok et al. (2022) recorded that the firmness of the banana ‘Lady Finger’ stored at 22 °C reduced from 40.41 N to 2.72 N from day 0 to day 14, respectively. The softness (low firmness status) observed in bananas after the experimental storage period, particularly in the highly damaged fruit stored at 22 °C, is attributed to the damage of cell wall compounds (pectin and structural polysaccharides), starch reduction, and sugar content increment (Nsumpi et al., 2020). Also, Li and Thomas (2014) reported that mechanical damage is one of the key parameters resulting in the reduction in the firmness of fruit due to the increase in polysaccharide activity. The results obtained agree with the research from Pathare and Al-Dairi (2021b), in which storage temperature, storage duration, and impact level significantly influenced the firmness of pear fruit. In their study, increasing temperature from 10 to 22 °C and impact from 0.215 J to 0.647 J increased the softness of the fruit by 92.70% after 14 days of storage.
3.2.2. Transpiration rate, respiration rate, and ethylene production rate
The transpiration rate (TRm) in all of the investigated bananas was increased during 12 days of postharvest storage as shown in Fig. 4A. The results from this study indicated that the TRm of the studied banana fruit was statistically dependent on storage duration, storage temperature, and the applied impact level. From the Pareto analysis presented in Fig. 4B, storage time or duration had a larger effect on the TRm. Generally, the TRm increases with the period of storage, temperature condition, and damage level. High-impact levels and storage at elevated temperatures showed the highest TRm over time. The TRm was in the range of 0.07–2.03 mg kg−1s−1. The TRm of high-impact bruised banana fruit stored at ambient temperature was 2 times higher than those impacted from low-impact bruised bananas stored at 5 and 13 °C after 12 days of storage. These results can confirm that transpiration rate increment is one of the key reasons for weight loss in bananas in this study. Adi et al. (2019) and Khanal et al. (2022) confirmed that banana fruit is highly correlated with storage temperature. Murmu and Mishra (2016) studied the effect of the three storage conditions (10, 20, and 30 °C) on the TR of three banana cultivars and found that the TR of bananas increased with the rise in temperature across all cultivars. Increasing damage led to reducing the strength of the cell wall of the fruit which could probably increase the rate of moisture loss and TR over time.
Fig. 4.

Transpiration rate (TRm) of low-impact (30°; 0.074 J), medium (45°; 0.160 J), and high-impact (60°; 0.273 J) bruised fruit over 12 days of storage at 5, 13, and 22 °C. The data are presented in box and violin chart. The lines represent the mean value of 3 readings per treatment (A). Standardised Pareto charts showing the main effects (storage temperature, impact level, and storage temperature) and their interaction on BS. The red vertical line corresponds to the 95% confidence level (P < 0.05) were all standardised main effects with bars passing over the mentioned line are statistically significant (B).
The results in Table 4 show that the respiration rate (RR) (CO2- mg kg−1h1) of bananas did not vary with impact level, however, the RR varied significantly with storage temperature and storage duration. The analysis revealed that storage temperature had a larger effect on the cellular respiration of bruised banana fruit during storage. At the same impact level, fruit respired faster when stored at 22 °C than those stored at 13 and 5 °C. The maximum RR value (14.02 mg kg−1h1) was obtained in high-impact bruised banana fruit on day 2 of storage at ambient temperature. While low-impact bruised bananas recorded the minimum value of RR with a value of 8.10 × 10⁻⁵ mg kg−1h1. In terms of impact level, the respiration rate of bananas fluctuated. Due to advanced ripening and storage time which lead to a microbial infestation of the fruit, the bruised bananas from the high-impact level and stored at ambient temperature were not acceptable for further measurements for day 12.
Table 4.
a* (redness), hue*, and chroma* of low-impact (30°; 0.074 J), medium (45°; 0.160 J), and high-impact (60°;0.273 J) bruised fruit over 12 days of storage at 5, 13, and 22 °C. Error bars represent the SD of the mean values of 15 readings per treatment. Numerical values of A, B, and C are P-values. All P-values with * symbol are statistically significant. IL; impact level, ST, storage temperature; SD; storage duration.
| Color attributes | Impact level | Storage temp. (°C) | Storage Days |
||||||
|---|---|---|---|---|---|---|---|---|---|
| 0 | 2 | 4 | 6 | 8 | 10 | 12 | |||
| a* | Low | 5 | −16.50 ± 1.50 | −13.91 ± 1.07 | −9.60 ± 0.67 | −1.54 ± 1.17 | 3.09 ± 0.89 | 4.75 ± 0.87 | – |
| 13 | −15.78 ± 1.02 | −13.92 ± 1.03 | −9.24 ± 1.83 | −3.98 ± 1.57 | 0.84 ± 0.99 | 5.99 ± 1.24 | |||
| 22 | −11.82 ± 1.58 | −8.16 ± 1.40 | 1.39 ± 1.94 | 4.06 ± 0.98 | 6.71 ± 1.42 | – | |||
| Medium | 5 | −13.11 ± 1.01 | −8.70 ± 0.86 | −0.58 ± 1.36 | 2.79 ± 1.09 | 4.79 ± 1.18 | – | ||
| 13 | −15.23 ± 1.10 | −13.03 ± 1.04 | −8.30 ± 1.60 | −2.85 ± 1.50 | 2.61 ± 1.24 | 7.63 ± 1.15 | |||
| 22 | −11.00 ± 1.18 | −7.37 ± 1.27 | 1.32 ± 1.57 | 5.22 ± 1.26 | 7.92 ± 1.00 | – | |||
| High | 5 | −14.14 ± 1.12 | −8.92 ± 0.75 | −0.58 ± 0.90 | 2.64 ± 1.25 | 5.36 ± 1.15 | – | ||
| 13 | −15.46 ± 1.02 | −12.33 ± 1.41 | −7.40 ± 1.47 | −1.34 ± 1.64 | 4.18 ± 1.75 | 8.54 ± 2.05 | |||
| 22 | −9.25 ± 1.54 | −7.23 ± 1.56 | 1.97 ± 1.57 | 5.38 ± 1.78 | 8.14 ± 2.05 | – | |||
| Hue* | Low | 5 | −1.88 ± 0.02 | −1.12 ± 0.02 | 1.35 ± 0.01 | −1.17 ± 1.02 | 1.47 ± 0.02 | 1.39 ± 0.03 | – |
| 13 | −1.20 ± 0.03 | −1.30 ± 0.01 | −1.40 ± 0.03 | −1.49 ± 0.03 | 1.54 ± 0.02 | 1.66 ± 0.02 | |||
| 22 | −1.31 ± 0.03 | −1.40 ± 0.02 | 0.84 ± 1.35 | 1.49 ± 0.01 | 1.43 ± 0.02 | – | |||
| Medium | 5 | −1.27 ± 1.67 | −1.37 ± 0.02 | −0.58 ± 1.36 | 1.49 ± 0.03 | 1.39 ± 0.04 | – | ||
| 13 | −1.24 ± 0.02 | −1.32 ± 0.02 | −1.41 ± 0.03 | −1.51 ± 0.02 | 1.52 ± 0.02 | 1.53 ± 0.01 | |||
| 22 | −1.35 ± 0.02 | −1.43 ± 0.02 | 0.84 ± 1.36 | 1.45 ± 0.02 | 1.38 ± 0.02 | – | |||
| High | 5 | −1.27 ± 0.01 | −1.36 ± 0.01 | −0.50 ± 1.55 | 1.49 ± 0.03 | 1.36 ± 0.05 | – | ||
| 13 | −1.23 ± 0.03 | −1.31 ± 0.03 | −1.42 ± 0.02 | −0.84 ± 1.36 | 1.40 ± 0.03 | 1.42 ± 0.03 | |||
| 22 | −1.38 ± 0.03 | −1.43 ± 0.02 | 1.18 ± 1.03 | 1.45 ± 0.03 | 1.39 ± 0.03 | – | |||
| Chroma* | Low | 5 | 44.38 ± 1.82 | 46.02 ± 1.00 | 45.47 ± 0.75 | 36.10 ± 2.10 | 31.40 ± 1.99 | 26.73 ± 2.11 | – |
| 13 | 44.43 ± 3.31 | 53.29 ± 1.69 | 54.62 ± 2.24 | 54.51 ± 1.95 | 55.50 ± 1.00 | 57.12 ± 1.33 | |||
| 22 | 45.90 ± 2.72 | 49.62 ± 0.88 | 50.46 ± 0.64 | 51.86 ± 1.17 | 48.63 ± 1.10 | – | |||
| Medium | 5 | 44.92 ± 1.28 | 44.78 ± 1.63 | 42.59 ± 2.15 | 35.78 ± 3.92 | 27.07 ± 2.53 | – | ||
| 13 | 47.03 ± 1.60 | 52.66 ± 1.82 | 53.07 ± 3.31 | 53.61 ± 1.43 | 56.07 ± 1.33 | 57.31 ± 1.46 | |||
| 22 | 50.84 ± 1.71 | 53.36 ± 1.57 | 52.07 ± 2.00 | 45.09 ± 2.22 | 42.26 ± 2.26 | – | |||
| High | 5 | 48.69 ± 2.68 | 43.71 ± 1.18 | 41.46 ± 1.34 | 33.99 ± 2.58 | 27.02 ± 2.66 | – | ||
| 13 | 46.54 ± 2.21 | 47.96 ± 2.07 | 52.54 ± 1.00 | 53.19 ± 1.14 | 56.42 ± 1.67 | 57.64 ± 1.49 | |||
| 22 | 49.48 ± 1.73 | 53.02 ± 1.91 | 53.24 ± 2.39 | 48.57 ± 0.61 | 46.40 ± 2.50 | – | |||
| Level of significance (P < 0.05) | |||
|---|---|---|---|
| a* | Hue* | Chroma* | |
| IL (A) | 0.00060* | 0.802989 | 0.075471 |
| ST (B) | 0.001158* | 0.151301 | 0.017815* |
| SD (C) | <0.00001* | 0.012607* | 0.075531 |
| A × B | 0.063440 | 0.395829 | 0.477563 |
| A × C | 0.498810 | 0.261722 | 0.646268 |
| B × C | <0.00001* | <0.00001* | <0.00001* |
| A × B × C | 0.07916 | <0.00001* | <0.00001* |
As shown in Table 4, the experimental effects including storage days, impact level, and storage temperature significantly influenced the ethylene production rate (EPR) of banana fruit, respectively. In all treatments, the EPR dramatically reduced on day 4 and then increased. The highest values of EPR were observed in high-impact bruised bananas (0.273 J) stored at 22 °C on days 2 and 12 with values of 3.85 × 10⁻³ and 3.08 × 10⁻³ mg kg−1h−1, respectively. Regarding storage conditions, banana fruit stored at 13 °C showed the least changes in EPR compared with bananas stored at 5 °C. Similar to RR, the data of EPR (on day 12) of bruised bananas stored at ambient temperature were not taken due to the adverse effect of this condition on the fruit.
In the study of Pathare and Al-Dairi (2022), the RR increased as storage temperature and impact damage increased in bananas after 24 h of storage. In this study, the results showed no statistical effect of mechanical damage on bananas, however, in some cases, the mechanically damaged banana fruit showed the highest RR and EPR which can occur due to the increment in the action of some enzymes like glycosidases, βamylase, and α-amylase which accelerated the determination of sucrose and glucose that consider as respiratory substrates which can elevate the RR of bruised bananas (Maia et al., 2014). According to Rahman et al. (2021), the analysis of variance showed that the RR at ambient temperature was significantly different compared to cold temperature because, at the higher temperature, the microbial and enzymatic activity is faster than at lower temperatures.
3.2.3. Skin color
The study presented the average values of color parameters of bruised banana fruit stored at different conditions, including lightness (L*), yellowness (b*), yellowness value (YV), the total color difference (TCD) (Fig. 5A–D), redness (a*), hue*, and chroma* (Table 3). Visual changes in banana fruit from green to yellow over the 12-day storage duration were observed. The analysis of variance was applied to investigate the influence of impact level, storage temperature, storage duration, and their interaction on all color attributes. Fig. 5E illustrates the overall changes in bruised bananas. Under all storage conditions, significant changes in the L* value were observed, while no significant changes were found for bananas at all impact levels throughout the storage period. Regardless of impact level, storage at 13 °C showed a gradual increase in the L* value of banana fruit during 12 days of storage (Fig. 5A). The L* value increased by 39.26%, 39.89%, and 40.79% for low (0.074 J), medium (0.160 J), and high (0.273 J)-impact bruised banana fruit after 12 days of storage at 13 °C. Storage at low (5 °C) and ambient temperature showed a gradual reduction in the L* value of all bruised banana fruit from days 6 and 8 of storage, respectively. The reduction was highly recorded in the low, medium, and high-impact bruised fruit stored at 5 °C with values of 31.77, 28.78, and 22.68 on day 10 of storage, respectively. As shown in Table 3, the analysis of variance test results showed that storage days, impact level, and storage temperature significantly affect the redness (a*) changes of the fruit, respectively. The a* value of −16.50 was recorded to confirm the green appearance of banana fruit on day 0. The negative a* value was converted to a positive value as storage temperature, storage duration, and impact level tended to increase. The a* values were slightly increased in all bruised bananas stored at 13 °C until the last day of storage. A rapid increment in a* value was observed in bruised bananas stored at 22 °C and 5 °C, respectively. The yellowness (b*) values followed a similar scenario as the L* values over time. The increment observed in the b* value of bruised bananas indicated the changes in the peel color to yellow. However, the b* gradually declined on day 6 and day 8 for bruised fruit stored at 5 and 22 °C, respectively.
Fig. 5.

Lightness (L*) (A), yellowness (b*) (B), yellowness value (YV)(C), and total color difference (TCD) (D) of low-impact (30°; 0.074 J), medium (45°; 0.160 J), and high-impact (60°; 0.273 J) bruised fruit over 12 days of storage at 5, 13, and 22 °C. The data are presented in box and violin chart. The lines represent the mean value of 15 readings per treatment. The overall changes in bananas peel color from day 0 to day 10 (E). IL; impact level, ST, storage temperature; SD; storage duration.
Table 3.
Respiration rate (RR) and ethylene production rate (EPR) of Low-impact (30°; 0.074 J), medium (45°; 0.160 J), and high-impact (65°;0.273 J) bruised fruit over 12 days of storage at 5, 13, and 22 °C. Error bars represent the SD of the mean values of 2 readings per treatment. Numerical values of A, B, and C are P-values. All P-values with * symbol are statistically significant. IL; impact level, ST, storage temperature; SD; storage duration.
| Days | Impact level | Storage temp. (°C) | RR (CO2- mg kg−1h1) | EPR (mg kg−1h−1) |
|---|---|---|---|---|
| 2 | Low | 5 | 1.03 ± 0.11 | 6.40 × 10⁻⁴±6.40 × 10⁻⁴ |
| 13 | 3.53 ± 0.20 | 1.84 × 10⁻³±5.80 × 10⁻⁴ | ||
| 22 | 8.12 ± 1.55 | 1.93 × 10⁻³±6.40 × 10⁻⁴ | ||
| Medium | 5 | 1.79 ± 0.11 | 1.12 × 10⁻³±9.00 × 10⁻⁵ | |
| 13 | 4.50 ± 0.05 | 1.98 × 10⁻³±6.90 × 10⁻⁴ | ||
| 22 | 9.49 ± 1.79 | 1.77 × 10⁻³±7.40 × 10⁻⁴ | ||
| High | 5 | 2.43 ± 0.80 | 1.31 × 10⁻³±2.60 × 10⁻⁵ | |
| 13 | 4.26 ± 0.41 | 2.59 × 10⁻³±7.70 × 10⁻⁵ | ||
| 22 | 14.02 ± 0.13 | 3.85 × 10⁻³±7.77 × 10⁻⁴ | ||
| 4 | Low | 5 | 0.89 ± 0.10 | 6.70 × 10⁻⁴±6.70 × 10⁻⁴ |
| 13 | 3.58 ± 1.17 | 1.20 × 10⁻⁶±2.60 × 10⁻⁸ | ||
| 22 | 1.90 ± 0.88 | 1.30 × 10⁻⁶±0.00 | ||
| Medium | 5 | 1.07 ± 0.18 | 1.10 × 10⁻⁶±9.00 × 10⁻⁸ | |
| 13 | 3.91 ± 0.47 | 1.30 × 10⁻⁶±2.60 × 10⁻⁸ | ||
| 22 | 1.12 ± 0.81 | 5.10 × 10⁻⁴±5.10 × 10⁻⁴ | ||
| High | 5 | 0.41 ± 0.41 | 1.30 × 10⁻⁶±2.60 × 10⁻⁸ | |
| 13 | 5.18 ± 0.77 | 1.30 × 10⁻⁶±3.90 × 10⁻⁸ | ||
| 22 | 1.55 ± 0.31 | 1.50 × 10⁻⁶±1.54 × 10⁻³ | ||
| 6 | Low | 5 | 0.09 ± 0.09 | 6.70 × 10⁻⁴±6.70 × 10⁻⁴ |
| 13 | 3.49 ± 1.01 | 6.30 × 10⁻⁴±6.30 × 10⁻⁴ | ||
| 22 | 2.85 ± 0.52 | 1.29 × 10⁻³±6.10 × 10⁻⁴ | ||
| Medium | 5 | 0.08 ± 0.09 | 5.10 × 10⁻⁴±5.10 × 10⁻⁴ | |
| 13 | 2.35 ± 1.08 | 1.31 × 10⁻³±3.60 × 10⁻⁵ | ||
| 22 | 0.39 ± 0.01 | 1.14 × 10⁻³±1.60 × 10⁻⁴ | ||
| High | 5 | 0.23 ± 0.06 | 1.31 × 10⁻³±2.60 × 10⁻⁵ | |
| 13 | 0.99 ± 0.19 | 1.30 × 10⁻³±5.50 × 10⁻⁵ | ||
| 22 | 2.79 ± 1.63 | 7.70 × 10⁻⁴±1.09 × 10⁻³ | ||
| 8 | Low | 5 | 8.10 × 10⁻⁵±9.30 × 10⁻⁶ | 1.30 × 10⁻⁶±2.60 × 10⁻⁸ |
| 13 | 0.57 ± 0.13 | 6.00 × 10⁻⁴±8.50 × 10⁻⁴ | ||
| 22 | 2.87 ± 0.39 | 1.29 × 10⁻³±1.20 × 10⁻⁴ | ||
| Medium | 5 | 0.46 ± 0.07 | 1.12 × 10⁻³±9.00 × 10⁻⁵ | |
| 13 | 1.28 ± 0.40 | 6.40 × 10⁻⁴±9.10 × 10⁻⁴ | ||
| 22 | 2.79 ± 1.62 | 1.14 × 10⁻³±1.60 × 10⁻⁴ | ||
| High | 5 | 0.37 ± 0.15 | 1.13 × 10⁻³±2.60 × 10⁻⁵ | |
| 13 | 1.47 ± 0.15 | 6.70 × 10⁻⁴±9.40 × 10⁻⁴ | ||
| 22 | 5.82 ± 0.24 | 2.31 × 10⁻³±1.09 × 10⁻³ | ||
| 10 | Low | 5 | 0.23 ± 0.05 | 6.40 × 10⁻⁵±6.40 × 10⁻³ |
| 13 | 1.27 ± 0.28 | 6.30 × 10⁻⁴±8.90 × 10⁻⁴ | ||
| 22 | 4.32 ± 0.33 | 1.29 × 10⁻³±6.40 × 10⁻³ | ||
| Medium | 5 | 0.14 ± 0.14 | 1.12 × 10⁻³±3.10 × 10⁻¹⁰ | |
| 13 | 1.70 ± 0.82 | 6.70 × 10⁻⁴±9.40 × 10⁻⁴ | ||
| 22 | 3.39 ± 0.29 | 1.14 × 10⁻³±1.60 × 10⁻⁴ | ||
| High | 5 | 0.01 ± 0.08 | 1.31 × 10⁻³±2.60 × 10⁻⁵ | |
| 13 | 1.32 ± 0.65 | 6.30 × 10⁻⁴±8.90 × 10⁻⁴ | ||
| 22 | 2.61 ± 1.81 | 3.08 × 10⁻³±0.00 | ||
| 12 | Low | 5 | 0.13 ± 0.13 | 6.70 × 10⁻⁴±6.70 × 10⁻⁴ |
| 13 | 2.66 ± 1.89 | 1.23 × 10⁻³±3.60 × 10⁻⁵ | ||
| 22 | – | – | ||
| Medium | 5 | 0.04 ± 0.04 | 1.10 × 10⁻⁶±9.00 × 10⁻⁸ | |
| 13 | 2.01 ± 1.16 | 6.40 × 10⁻⁴±9.10 × 10⁻⁴ | ||
| 22 | – | – | ||
| High | 5 | 0.08 ± 0.01 | 1.30 × 10⁻⁶±2.60 × 10⁻⁸ | |
| 13 | 3.22 ± 1.13 | 6.30 × 10⁻⁴±8.90 × 10⁻⁴ | ||
| 22 | – | – |
| Level of significance (P < 0.05) | ||
|---|---|---|
| RR | EPR | |
| IL (A) | 0.164988 | 0.004899* |
| ST (B) | 0.029371* | 0.023303* |
| SD (C) | 0.042298* | 0.000989* |
| A × B | 0.218563 | 0.024632* |
| A × C | 0.035889* | 0.171666 |
| B × C | 0.000019* | 0.017234* |
| A × B × C | 0.001525* | 0.063935 |
Fig. 5C presents the overall results of yellowness values (YV) of bruised banana fruit stored at 5, 13, and 22 °C during 12 days of storage. Results showed that the influence of storage temperature, impact level, and storage period on the YV was significant. The YV is highly affected by the changes in both a* and b* values. The total color difference (TCD) of bruised fruit increased significantly as the impact level increased with time. The TCD was not affected by the storage temperature (Fig. 5D). The TCD observed in this study indicates the alteration of peel color from the green banana as ripening and storage day progressed. A continuous increase in TCD was reported in bruised bananas stored at 13 °C during the 12-day storage period. The high-impact bruised bananas stored at 13 °C experienced the highest TCD with a value of 35.14 after 12 days of storage. However, on day 10, the TCD was the largest (34.59) in the high-impact bruised fruit stored at 5 °C. Although the color purity (hue*) of bananas was influenced by the storage period, it was not affected by impact level and storage temperature. In the case of color saturation (chroma*), it was only influenced by impact level during the experimental period (Table 3).
The overall decline observed in L* and b* values after days 6 and 8 is due to ripening, senescence at 22 °C, and chilling injuries at 5 °C which showed patches of yellow with black dominance in banana fruit. Also, this reduction is characterized by the change of the banana from yellow to red scale and then the subsequent darkening of the fruit peel (Adi et al., 2019). Degradation of chlorophyll pigmentation is the main reason for the changes from green to yellow particularly at ambient temperature (Nsumpi et al., 2020). Fu et al. (2018) reported that the change of banana peel to yellow color is due to the accumulation of carotenoids and degradation of chlorophyll. Similar results were found by Maia et al. (2014), who obtained that the impact damage can cause higher changes in banana peel color compared to the non-damaged fruit. Besides, Pathare and Al-Dairi (2022) obtained that storage at higher temperatures and damage from high levels accelerated the changes of banana fruit color skin to yellow after 48 h of storage.
3.2.4. Size measurements
Fig. 6A–C shows the reduction percentage of banana fruit size measurements (geometric mean diameter (Dg), surface area (As), and fruit volume (Vf)) as affected by storage temperature, storage duration, and impact level. Noticeably, the size measurements significantly reduced with the increase in all investigated factors. Storage temperature and storage duration statistically affected the changes in Dg, As, and Vf of all bruised banana fruit during the experiment. Storage duration had a larger effect on the size measurements than storage temperature. However, the statistical analysis shown in Fig. 6A–C demonstrates that the changes in impact level (low, medium, and high) pronounced no significant (P > 0.05) effect in the size measurement parameters.
Fig. 6.

Reduction % in geometric mean diameter (Dg) (A), surface area (As) (B), and fruit volume (Vf) (C) of low-impact (30°; 0.074 J), medium (45°; 0.160 J), and high-impact (60°; 0.273 J) bruised fruit over 12 days of storage at 5, 13, and 22 °C. The data are presented in mean ± SD of 3 readings per treatment. IL; impact level, ST, storage temperature; SD; storage duration.
After applying the calculations of Dg, As, and Vf by using the length (L), width (W), and thickness (T) parameters, the results showed that storage temperature at ambient conditions showed the highest reduction in bruise size measurements in the bruised banana fruit. The high-impact level bruised banana fruit stored at ambient temperature rapidly reduced Dg, As, and Vf by 31.98%, 53.63%, and 66.83%, respectively after 12 days of storage. The changes in size measurements of medium bruised banana fruit were higher than low-impact bananas in the first 4 days of storage at ambient conditions. Subsequently, the Dg, As, and Vf of the low impact elevated from day 6 to day 10 compared to the medium one and then reached the same point on day 12 with an approximate reduction % of 26.60, 45.07, and 60.33, respectively. The least reduction in size parameters was observed for low-impact bruised fruit stored at 5 °C and medium-impact fruit stored at 13 °C. The overall reduction % obtained in Dg, AS, and Vf during storage for all samples is attributed to water loss found in the study. In the study of Dagdelen and Aday (2021), they found that the bruising generated by external impact damage can degrade the internal cells of the fruit, resulting in increased enzymatic activity and respiration rate which later affect other quality attributes like size measurements.
3.3. Relationship between bruise susceptibility and quality attributes
The determination coefficient (R2) for the regression of selected banana fruit quality (weight loss % (WL %), transpiration rate (TRm), firmness, total color difference (TCD), and geometric mean diameter (Dg)) on the bruise susceptibility (BS) was determined to predict the quality of bananas based on the obtained BS of banana fruit (Table 5). It was noticed that TRm, Dg reduction, and WL % of medium-impact bruised bananas stored at 13 °C could be best associated with bruise susceptibility (BS) with R2 = 0.9462, 0.9410, and 0.9399, respectively. This was followed by Dg reduction % of high-impact bruised bananas stored at 13 °C (R2 = 0.9115) and low-impact bruised fruit stored at 22 °C (R2 = 0.9064). A good association was also found between the BS value with the Dg reduction % (high-impact; 22 °C, R2 = 0.8575), (high-impact; 5 °C, R2 = 0.8482), (medium-impact; 22 °C, R2 = 0.8483). Besides, a good relationship was reported between BS and TCD of banana bruised from the medium-impact level at 13 °C (R2 = 0.8913), high-impact level (R2 = 0.8618), and low-impact level (R2 = 0.8050) stored at 5 °C. However, the TCD value of medium impact banana stored at 5 °C recorded the lowest R2 values (<0.1000) with BS. For 12 days of storage at all storage conditions, the firmness value of bruised bananas impacted at different impact levels negatively correlates with BS with a strong relationship observed in low-impact and high-impact bruised bananas stored at 22 °C and 13 °C with a determination coefficient (R2) = 0.8391 and 0.8180, respectively.
Table 5.
The relationship between the BS and quality attributes of banana fruit using the determination coefficient (R2). BS; bruise susceptibility, WL; weight loss, TRm, transpiration rate per unit of initial mass, TCD; total color difference, Dg; geometric mean diameter.
| Independent variable (x) | Dependent variables | Impact Level | Storage temp. (°C) | Equation | R2 |
|---|---|---|---|---|---|
| BS (mm3 J−1) | WL% | Low | 5 | y = 0.0016x + 1.7035 | 0.8313 |
| 13 | y = 0.0017x + 2.7508 | 0.7381 | |||
| 22 | y = 0.0003x + 2.0363 | 0.8597 | |||
| Medium | 5 | y = 0.001x + 1.7594 | 0.3048 | ||
| 13 | y = 0.0011x + 0.8161 | 0.9399 | |||
| 22 | y = 0.0003x + 2.0363 | 0.8597 | |||
| High | 5 | y = 0.0023× - 0.7361 | 0.7864 | ||
| 13 | y = 0.0005x + 2.211 | 0.8696 | |||
| 22 | y = −0.0026x + 77.615 | 0.8551 | |||
| Firmness (N) | Low | 5 | y = −0.0049x + 69.814 | 0.6412 | |
| 13 | y = −0.0008x + 59.866 | 0.6645 | |||
| 22 | y = −0.0026x + 77.897 | 0.8391 | |||
| Medium | 5 | y = −0.0047x + 71.425 | 0.6441 | ||
| 13 | y = −0.0008x + 60.76 | 0.6521 | |||
| 22 | y = −0.0012x + 77.083 | 0.2080 | |||
| High | 5 | y = −0.0034x + 80.19 | 0.7962 | ||
| 13 | y = −0.0018x + 72.002 | 0.8180 | |||
| 22 | y = −0.0004x + 53.247 | 0.5550 | |||
| TRm (mg kg−1s−1) | Low | 5 | y = 0.0002x + 0.1551 | 0.8756 | |
| 13 | y = 0.0001x + 0.298 | 0.5815 | |||
| 22 | y = 3 E-05x + 0.19 | 0.8776 | |||
| Medium | 5 | y = 9 E-05x + 0.1768 | 0.3012 | ||
| 13 | y = 0.0001x + 0.0743 | 0.9462 | |||
| 22 | y = 2 E-05x + 0.4922 | 0.7454 | |||
| High | 5 | y = 0.0002× - 0.0741 | 0.7872 | ||
| 13 | y = 5 E-05x + 0.2131 | 0.8859 | |||
| 22 | y = 2 E-05x + 0.313 | 0.8727 | |||
| TCD | Low | 5 | y = 0.0083x + 7.4923 | 0.8050 | |
| 13 | y = 0.0047x + 9.5903 | 0.6518 | |||
| 22 | y = 0.0008x + 3.5280 | 0.8324 | |||
| Medium | 5 | y = 0.001x + 11.324 | 0.0191 | ||
| 13 | y = 0.0031x + 3.8109 | 0.8618 | |||
| 22 | y = 0.0005x + 11.341 | 0.4044 | |||
| High | 5 | y = 0.0073× - 2.3994 | 0.8913 | ||
| 13 | y = 0.0014x + 7.1569 | 0.7837 | |||
| 22 | y = 0.0004x + 9.4478 | 0.5842 | |||
| Dg reduction % | Low | 5 | y = 0.0029x + 3.499 | 0.7949 | |
| 13 | y = 0.0034x + 4.8004 | 0.7051 | |||
| 22 | y = 0.0005x + 1.3123 | 0.9115 | |||
| Medium | 5 | y = 0.0021x + 2.8569 | 0.3943 | ||
| 13 | y = 0.0018× - 0.4429 | 0.9410 | |||
| 22 | y = 0.0003x + 5.3545 | 0.8483 | |||
| High | 5 | y = 0.004× - 2.2074 | 0.8482 | ||
| 13 | y = 0.0009x + 1.8147 | 0.9064 | |||
| 22 | y = 0.0003x + 3.4971 | 0.8575 |
Regardless of impact level, the relationship between BS and the quality attributes was higher when the banana was stored at 13 °C based on the recorded R2 values. The results in Table 5 can confirm the possibility of BS to predict all quality attributes including WL %, TRm, Dg reduction %, firmness, and TCD. Xia et al. (2020) found a relationship between the bruise parameter and weight loss. Pathare and Al-Dairi (2021b) reported a strong relationship between BS and quality attributes of pear, including color and firmness after 14 days of storage.
4. Conclusions
The quality changes and bruise magnitude of bananas were evaluated after being subjected to a selected impact damages and storage temperature for 12 days. The resulting data of the study revealed that bruise measurements (bruise area, bruise volume, bruise susceptibility, and specific bruise susceptibility) tended to increase as storage days, storage temperature, and impact level increased. The study reported 19.55% and 19.35% weight loss in high and medium-impact bananas stored at ambient temperature (22 °C), respectively after 12 days of storage. The firmness values were reduced in all bruised banana fruit stored at 5, 13, and 22 °C, particularly for bananas impacted by the highest level. Chilling injuries and storage at higher temperatures reduced the lightness and yellowness after days 6 and 8 of storage. Storage at 13 °C reduced the increment in the ethylene production rate and showed a gradual increase in color parameters. The size parameters of bruised bananas were affected by storage temperature and duration. The bruise susceptibility was the best predictor of WL %, TRm, and Dg reduction%. Bruise area and bruise volume can be also used to estimate the quality changes during storage. The study can be applied to check other nutritional and chemical quality changes and can be implemented to evaluate the bruising intensity of fresh produce.
CRediT authorship contribution statement
Mai Al-Dairi: Data curation, Formal analysis, Methodology, and, Writing – original draft. Pankaj B. Pathare: Conceptualization, Formal analysis, Writing – review & editing, Funding acquisition, Resources, Project administration, and, Supervision. Rashid Al-Yahyai: Supervision, Writing – review & editing. Adil Al-Mahdouri: Methodology, Formal analysis.
Declaration of competing interest
The authors declare that they have no known competing financial interests or personal relationships that could have appeared to influence the work reported in this paper.
Acknowledgements
We would like to thank Sultan Qaboos University, Oman for their financial support under the project codes: CL\SQU\QU\AGR\23\02 and IG/AGR/SWAE/19/03. The first author is thankful to the Deanship of Postgraduate Studies, Sultan Qaboos University, Oman for the scholarship, research funds and facilities for this research.
Handling editor: A.G. Marangoni
Data availability
Data will be made available on request.
References
- Adi D.D., Oduro I.N., Tortoe C. Physicochemical changes in plantain during normal storage ripening. Scientific African. 2019;6 [Google Scholar]
- Ahmadi E. Bruise susceptibilities of kiwifruit as affected by impact and fruit properties. Res. Agric. Eng. 2012;58(3):107–113. [Google Scholar]
- Al-Dairi M., Pathare P.B. Kinetic modeling of quality changes of tomato during storage. Agric. Eng. Int. CIGR J. 2021;23(1):183–193. [Google Scholar]
- Al-Dairi M., Pathare P.B., Al-Mahdouri A. The contribution of impact damage to the quality changes of stored banana fruits. Biol. Life Sci. Forum. 2022;16(1):1–8. [Google Scholar]
- Al-Dairi M., Pathare P.B., Al-Yahyai R. Effect of postharvest transport and storage on color and firmness quality of tomato. Horticulturae. 2021;7(7):163. [Google Scholar]
- Al-Dairi M., Pathare P.B., Al-Yahyai R., Opara U.L. Mechanical damage of fresh produce in postharvest transportation: current status and future prospects. Trends Food Sci. Technol. 2022;124(1):195–207. [Google Scholar]
- Bugaud C., Ocrisse G., Salmon F., Rinaldo D. Bruise susceptibility of banana peel in relation to genotype and post-climacteric storage conditions. Postharvest Biol. Technol. 2014;87:113–119. [Google Scholar]
- Celik H.K., Ustun H., Erkan M., Rennie A.E., Akinci I. Effects of bruising of ‘Pink Lady’apple under impact loading in drop test on firmness, colour and gas exchange of fruit during long term storage. Postharvest Biol. Technol. 2021;179 [Google Scholar]
- Dadzie B.K., Orchard J.E. Routine post-harvest screening of banana/plantain hybrids: criteria and methods, 2. Bioversity International. 1997 [Google Scholar]
- Dagdelen C., Aday M.S. The effect of simulated vibration frequency on the physico-mechanical and physicochemical properties of peach during transportation. LWT. 2021;137 [Google Scholar]
- Dong Y.Y., Huang Y.S., Xu B.L., Li B.C., Guo B. Bruise detection and classification in jujube using thermal imaging and DenseNet. J. Food Process. Eng. 2022;45(3) [Google Scholar]
- Fernando I., Fei J., Stanley R., Rouillard V. Evaluating packaging performance for bananas under simulated vibration. Food Packag. Shelf Life. 2020;23 [Google Scholar]
- Fu H., et al. Bruise measurement of fresh market apples caused by repeated impacts using a pendulum method. Postharvest Biol. Technol. 2023;195 [Google Scholar]
- Fu X., et al. Comparative analysis of pigments in red and yellow banana fruit. Food Chem. 2018;239:1009–1018. doi: 10.1016/j.foodchem.2017.07.046. [DOI] [PubMed] [Google Scholar]
- Guo J., Duan J., Yang Z., Karkee M. De-handing technologies for banana postharvest operations—updates and challenges. Agriculture. 2022;12(11):1821. [Google Scholar]
- Hailu M., Workneh T.S., Belew D. Review on postharvest Technology of banana fruit. Afr. J. Biotechnol. 2013;12(7):635–647. [Google Scholar]
- Hendricks R.L., Olsen N., Thornton M.K., Hatzenbuehler P. Susceptibility of potato cultivars to blackspot and shatter bruise at three impact heights. Am. J. Potato Res. 2022;99(5):358–368. [Google Scholar]
- Hussein Z., Fawole O.A., Opara U.L. Bruise damage susceptibility of pomegranates (Punica granatum, l.) and impact on fruit physiological response during short term storage. Sci. Horti. 2019;246:664–674. [Google Scholar]
- Khanal B.P., Sangroula B., Bhattarai A., Almeida G.K., Knoche M. Pathways of postharvest water loss from banana fruit. Postharvest Biol. Technol. 2022;191 [Google Scholar]
- Li Z., Thomas C. Quantitative evaluation of mechanical damage to fresh fruits. Trends Food Sci. Technol. 2014;35(2):138–150. [Google Scholar]
- Lin M., et al. Mechanical damages and packaging methods along the fresh fruit supply chain: a review. Crit. Rev. Food Sci. Nutr. 2022:1–20. doi: 10.1080/10408398.2022.2078783. [DOI] [PubMed] [Google Scholar]
- Luyckx A., Lechaudel M., Hubert O., Salmon F., Brat P. 2016. Banana Peel Physiological Post-harvest Disorders: A Review. [Google Scholar]
- Maia V.M., Salomão L.C.C., Siqueira D.L., Aspiazú I., Maia L.C.B. Physical and metabolic changes induced by mechanical damage in'Dwarf-Prata'banana fruits kept under cold storage. Aust. J. Crop. Sci. 2014;8(7):1029–1037. [Google Scholar]
- Mubarok S., Maulida Rahman I., Nuraniya Kamaluddin N., Solihin E. Impact of 1-Methylcyclopropene combined with chitosan on postharvest quality of tropical banana ‘Lady Finger’. Int. J. Food Prop. 2022;25(1):1171–1185. [Google Scholar]
- Murmu S.B., Mishra H.N. Measurement and modelling the effect of temperature, relative humidity and storage duration on the transpiration rate of three banana cultivars. Sci. Hortic. 2016;209:124–131. [Google Scholar]
- Nguyen C.-N., Van-Linh L., Le P.-H., Ho H.-T., Nguyen C.-N. Early detection of slight bruises in apples by cost-efficient near-infrared imaging. Int. J. Electr. Comput. Eng. 2022;12(1):349. [Google Scholar]
- Nsumpi A.N., Belay Z.A., Caleb O.J. Good intentions, bad outcomes: impact of mixed-fruit loading on banana fruit protein expression, physiological responses and quality. Food Packag. Shelf Life. 2020;26 [Google Scholar]
- Opara L.U., Al‐Ghafri A., Agzoun H., Al‐Issai J., Al‐Jabri F. Design and development of a new device for measuring susceptibility to impact damage of fresh produce. N. Z. J. Crop Hortic. Sci. 2007;35(2):245–251. [Google Scholar]
- Opara U.L., et al. Effect of storage conditions on physico-chemical attributes and physiological responses of ‘milk’(Musa spp., AAB group) banana during fruit ripening. Int. J. Postharvest Technol. Innovation. 2012;2(4):370–386. [Google Scholar]
- Opara U.L., Pathare P.B. Bruise damage measurement and analysis of fresh horticultural produce—a review. Postharvest Biol. Technol. 2014;91:9–24. [Google Scholar]
- Pathare P.B., Al-Dairi M. Bruise damage and quality changes in impact-bruised, stored tomatoes. horticulturae. 2021;7(5):113. [Google Scholar]
- Pathare P.B., Al-Dairi M. Bruise susceptibility and impact on quality parameters of pears during storage. Front. Sustain. Food Syst. 2021;5 [Google Scholar]
- Pathare P.B., Al-Dairi M. Effect of simulated vibration and storage on quality of tomato. Horticulturae. 2021;7(11):417. [Google Scholar]
- Pathare P.B., Al-Dairi M. Effect of mechanical damage on the quality characteristics of banana fruits during short-term storage. Discover Food. 2022;2(1) [Google Scholar]
- Pathare P.B., Al-Dairi M., Al-Yahyai R., Al-Mahdouri A. Simulated handling to investigate the effect of mechanical damage on stored pomegranate fruit. Processes. 2022;10(12):2695. [Google Scholar]
- Polat R., Aktas T., Ikinci A. Selected mechanical properties and bruise susceptibility of nectarine fruit. Int. J. Food Prop. 2012;15(6):1369–1380. [Google Scholar]
- Rahman A.N.F., Muhammad V.C., Bastian F. Effect of storage temperature on the quality of kepok banana (Musa paradisiaca formatypica) Canrea Journal: Food Technology, Nutritions, and Culinary Journal. 2021:17–47. [Google Scholar]
- Ramírez‐Sánchez M., Huber D.J., Vallejos C.E., Kelley K. Physiological, molecular and ultrastructural analyses during ripening and over‐ripening of banana (Musa spp., AAA group, Cavendish sub‐group) fruit suggest characteristics of programmed cell death. J. Sci. Food Agric. 2018;98(2):609–617. doi: 10.1002/jsfa.8505. [DOI] [PubMed] [Google Scholar]
- Rashvand M., Altieri G., Genovese F., Li Z., Di Renzo G.C. Numerical simulation as a tool for predicting mechanical damage in fresh fruit. Postharvest Biol. Technol. 2022;187 [Google Scholar]
- Siddiq M., Ahmed J., Lobo M.G. Wiley Online Library; 2020. Handbook of Banana Production, Postharvest Science, Processing Technology, and Nutrition. [Google Scholar]
- Stropek Z., Gołacki K. Bruise susceptibility and energy dissipation analysis in pears under impact loading conditions. Postharvest Biol. Technol. 2020;163 [Google Scholar]
- Stropek Z., Gołacki K. Response of apple flesh to compression under the quasi-static and impact loading conditions. Materials. 2022;15(21):7743. doi: 10.3390/ma15217743. [DOI] [PMC free article] [PubMed] [Google Scholar]
- Wei X., et al. Excess water loss induced by simulated transport vibration in postharvest kiwifruit. Sci. Hortic. (Canterb.) 2019;250:113–120. [Google Scholar]
- Xia M., et al. Impact of packaging materials on bruise damage in kiwifruit during free drop test. Acta Physiol. Plant. 2020;42(7):1–11. [Google Scholar]
Associated Data
This section collects any data citations, data availability statements, or supplementary materials included in this article.
Data Availability Statement
Data will be made available on request.