

Abstract
The lack of sufficient affordable housing in Los Angeles, California burdens many renter households with the threat of an eviction. Research has identified individual- and neighborhood-level sociodemographic correlates of eviction, but the uneven distribution of sociodemographic characteristics and housing conditions across neighborhoods likely produces broader patterns of spatial clustering in eviction prevalence across local areas. We use spatial autoregressive models to explain the spatial concentration and spillover effects for two types of formal eviction filings—court-based and no-fault Ellis Act petitions—within and across census tracts in Los Angeles. Court-based filings show greater and more persistent spatial concentration, particularly in neighborhoods with higher percentages of Black residents. We find evidence of spatial correlation for both types of eviction, however, suggesting that identifying the spatial distribution of eviction prevalence across local areas is important to understanding how location shapes eviction risk in metropolitan areas.
Keywords: eviction, housing markets, gentrification, concentrated disadvantage
Rising housing costs, stagnating incomes, and the lack of meaningful expansion of federal housing assistance have created an affordable housing crisis in the United States, particularly among poor renter households (Desmond, 2015). In Los Angeles, California, median rents increased almost twice as fast as median incomes from 2009 to 2018 (U.S. Census Bureau, 2010, 2019). More than 30% of Los Angeles rental households are severely cost burdened, dedicating more than 50% of their income to housing expenses (Joint Center for Housing Studies of Harvard University 2020). The lack of access to affordable housing increases the risk of eviction (Desmond, 2016), displacing tenants and increasing the difficultly of securing future housing, often forcing tenants to relocate outside the city or onto the streets (Collinson & Reed, 2018; Los Angeles Homeless Services Authority, 2019).
Disparities in socioeconomic disadvantage and rising rents in local neighborhoods of Los Angeles are likely to result in an uneven distribution of eviction risk across the city (Blasi, 2020; The Los Angeles Housing and Community Investment Department, 2019). Although previous studies identify individual-level causes of eviction (e.g., Desmond & Gershenson, 2017) and neighborhood correlates of eviction prevalence (Desmond & An, 2015; Desmond & Shollenberger, 2015; Lens, Nelson, Gromis, & Kuai, 2020), few assess how neighborhood conditions shape broader spatial patterns of eviction across cities. In this article, we map the spatial concentration of two types of eviction in Los Angeles and investigate how sociodemographic and housing characteristics shape eviction risk within and across neighborhoods.
We use data on the two most common types of formal evictions in Los Angeles—court-based eviction lawsuits and no-fault Ellis Act petitions filed with the City of Los Angeles Housing and Community Investment Department (HCIDLA). Although tenants can be displaced in numerous ways, these two forms of eviction represent distinct mechanisms in landlord/tenant relations that contribute to eviction-based displacement. Court-based evictions are a result of disputes between landlords and tenants, whereas Ellis Act evictions are explicitly through no fault of the tenant. Rather, these evictions arise from the landlords’ desire to exit the rental market and—most frequently—sell their property. Our analyses demonstrate how distinct forms of eviction show different spatial distributions across the city. First, we find that court-based filings and Ellis petitions demonstrate inverse trends over time, confirming that they are distinct types of evictions influenced by separate mechanisms. Second, we demonstrate that court-based filings show more consistent spatial concentration than Ellis petitions and that, despite an overall decline in court-based filings over time, filings largely remain concentrated in the same regions of the city. Third, we confirm previous findings that a higher share of Black residents is the neighborhood characteristic most associated with increased prevalence of court-based filing. We do not observe the same association for Ellis petitions, reflecting that these evictions are driven by separate processes. These findings reveal that, in addition to studying eviction’s sociodemographic and neighborhood-level correlates, researchers must also examine eviction’s larger spatial dynamics, particularly the consistency of spatial concentration over time and across communities, to better understand the geography of eviction risk.
Court-Based and No-Fault Eviction Filings
In Los Angeles, the most common type of formal eviction is an unlawful detainer lawsuit filed in the Los Angeles County Superior Court (LASC) system. In these lawsuits, landlord-plaintiffs seek restitution of rental property and/or past-due rent from tenant-defendants. Landlord-plaintiffs’ cases indicate a breach of the residential lease, and tenant-defendants must respond to these allegations by raising defenses. When landlord-plaintiffs prevail, courts issue them writs of possession, which they then deliver to the sheriff’s department who complete the eviction by locking the tenant-defendant out. We refer to these evictions as court-based evictions because the court system provides landlords with the means to legally evict tenants.
A second type of formal eviction is a no-fault eviction. No-fault evictions exist in the few jurisdictions in the United States covered by rent stabilization ordinances or just cause eviction protections, which explicitly require that landlords evict tenants for cause. Typically, these ordinances list a series of exceptions where tenants may be evicted without fault. In Los Angeles, examples of these exceptions include cases where code enforcement bureaucracies such as HCIDLA deem premises uninhabitable following unaddressed violations, when landlords or a family member wish to move into a unit, or when a landlord wishes to remove a property from the rental market entirely.1 This last type is informally referred to as an Ellis Act eviction because it is enabled by the State of California’s Ellis Act (1985), passed to circumvent local just cause eviction protections. The Ellis Act allows landlords to evict tenants legally in coordination with local housing bureaucracies, typically facilitating future condo conversion, demolition and new construction, or hotel development (Adams, 2019). We refer to these evictions as Ellis petitions because landlords in Los Angeles must petition HCIDLA to qualify and may only evict a tenant after the petition is granted. If tenants comply with the Ellis eviction notice and vacate prior to the notice’s expiration, then a legal civil case is never filed and the court system is circumvented entirely. If the tenant does not vacate by the date specified in the approved eviction notice, however, then the landlord may file a court-based eviction on the basis that the tenant has breached the HCIDLA-approved notice.
We analyze these two types of formal eviction separately because we expect their spatial dynamics will differ. First, Ellis evictions are typically enacted with an end goal of condominium or hotel conversion or demolition oriented toward development that will yield higher profit (Barragan, 2020; Economic Roundtable, 2009; Gross, 2015; Keyser Marston Associates, 2017). Most notably, media coverage surrounding Ellis evictions typically specifies that these evictions occur in neighborhoods with higher incomes in central and western neighborhoods in Los Angeles, such as Venice (Reyes, 2020) and Hollywood (Lelyveld, 2015; Reyes, 2016). For this reason, we expect that Ellis evictions will be spatially concentrated in neighborhoods with higher median incomes, home values, and rents, as well as in neighborhoods with higher concentrations of White residents. Studies analyzing court-based evictions, however, reveal that these evictions are more common in neighborhoods with high concentrations of poor and minority, particularly Black, renters (Desmond, 2012b; Lens et al., 2020; Medina, Byrne, Brewer, & Nicolosi, 2020). Whereas the literature on evictions in the United States tends to conflate distinct types of eviction within a single concept (see Weinstein, 2020), our hypotheses explicitly test the proposition that different mechanisms drive different types of eviction.
Literature Review
Most previous eviction research examines court-based eviction and its negative consequences on tenants’ mental and physical well-being (Desmond & Kimbro, 2015), familial relationships, and social networks (Desmond, 2012a; Desmond & Perkins, 2016). A dearth of comprehensive data on evictions (i.e., administrative court records) focused most early eviction studies on individual-level risk factors among tenants identified through survey research. Increasing availability of bulk electronic court records of eviction cases has expanded eviction research into analyses of neighborhood-level eviction risk (Desmond, 2012b), which may or may not reproduce individual-level risk factors. In this section, we identify demographic and housing characteristics likely to be associated with eviction prevalence and how we expect these relationships to differ for court-based filings and Ellis petitions.
Demographic Correlates of Eviction
One of the most consistent findings across individual-level studies of eviction is that tenants who are women and members of marginalized racial/ethnic groups, particularly Black women, are at increased risk of eviction (Bezdek, 1992; Lempert & Monsma, 1994). Several studies have confirmed that neighborhoods with higher percentages of Black people have increased prevalence of eviction (Desmond 2012b; Desmond, An, Winkler, & Ferriss, 2013; Lens et al., 2020). Findings for gender have been more mixed; whereas women in Black and Hispanic neighborhoods in Milwaukee, Wisconsin, were at greater individual-level risk of eviction than men (Desmond, 2012b, 2016), percentage of women residents was not a significant predictor of eviction prevalence at the neighborhood level (Desmond et al., 2013). Households with children are also at increased risk of eviction at both the individual (Desmond & Gershenson, 2017; Lundberg & Donnelly, 2019) and the neighborhood level (Desmond et al., 2013).
Eviction prevalence has also been shown to be associated with economic disadvantage. Court-based evictions were higher in neighborhoods with high poverty rates in Milwaukee (Desmond, 2012b; cf. Lens et al., 2020). Job loss has also been linked to greater risk of eviction at the individual level (Desmond & Gershenson, 2017). Furthermore, having previously experienced an eviction is associated with increased risk of a subsequent eviction (Desmond, 2016), which may result from increased economic hardship leading up to the initiation of the eviction (Humphries, Mader, Tannenbaum, & van Dijk, 2019) or the negative economic, employment, and educational outcomes associated with experiencing an eviction (Desmond & Gershenson, 2016).
Although these studies have addressed important questions about the sociodemographic risk factors associated with eviction, particularly at the individual level, they are unable to address two important dimensions: the larger role that neighborhood location may play in shaping eviction risk and how location and sociodemographic risk factors may vary by eviction type. Neighborhood-level studies primarily theorize results as the aggregation of individual-level risk, without investigating the spatial dynamics of neighborhoods in relation to each other. We build on this work by examining how court-based filings and Ellis petitions cluster across neighborhoods. Consistent with previous research, we expect that court-based filings will be concentrated in areas with higher percentages of Black residents, higher percentages of households with children, higher poverty and unemployment rates, and higher shares of the population without a high school diploma, which has been consistently linked to restricted job opportunities (e.g., Goldin & Katz, 2010). Alternatively, we expect Ellis petitions to be clustered in relatively more affluent neighborhoods. In particular, positive changes in household income, property values, educational attainment, and median rent, paired with decreases in non-White population, may indicate sociodemographic change associated with increased development (e.g., Brown-Saracino, 2010). Although previous research has not demonstrated a link between neighborhood-level gentrification and court-based eviction (Desmond & Gershenson, 2017), Ellis petitions represent a distinct type of eviction that may be more indicative of this type of neighborhood change.
Neighborhood Housing Conditions
A growing literature also examines how regional and local housing market dynamics shape eviction prevalence. On a micro-level, landlords in certain housing markets may concentrate specific classes of tenants in specific neighborhoods and types of housing through a process called reverse selection—where landlords have the market power to select tenants, rather than the tenants selecting landlords and neighborhoods (Rosen, 2014, 2020). Reverse selection may contribute to eviction’s spatial dynamics in racially segregated neighborhoods, where multiple forms of disadvantage are also spatially concentrated (Desmond, 2016), Furthermore, when landlords can count on courts as reliable and affordable debt collectors, they may be more likely to engage in serial eviction practices (when a landlord frequently initiates eviction proceedings) than are landlords in other housing markets (Garboden & Rosen, 2019; Leung, Hepburn, & Desmond, 2020). Eviction filing dynamics, therefore, may be shaped by the legal-procedural contexts in which eviction is enacted. Our research extends these studies by evaluating whether eviction filing dynamics vary between evictions initiated in the courts and those initiated in housing bureaucracies.
Other studies have found that whereas both serial and nonserial filings tend to occur disproportionately in Black neighborhoods, serial filings are more common in buildings with higher numbers of units, across neighborhood types (Immergluck, Ernsthausen, Earl, & Powell, 2019). These neighborhoods, research finds, are more likely to be dominated by institutional investors than so-called mom-and-pop landlords. Evictions are more likely in these neighborhoods and buildings not only because of enabling legal-procedural contexts, but also because corporate landlords and institutional investors are less flexible and forgiving landlords than their mom-and-pop counterparts (Raymond, Duckworth, Miller, Lucas, & Pokharel, 2018). Therefore, we expect that areas with high proportions of rental housing are more likely to be associated with court-based filings given that these neighborhoods are likely have a heterogeneous population of landlord types and rental housing stock. We must evaluate, however, whether this dynamic persists in no-fault evictions.
A larger literature evaluates claims that new housing construction can lead to displacement. The mechanism under study assumes that new construction affects localized rents and thus the likelihood that low-income tenants will be displaced. It is typically very difficult to empirically evaluate whether displacement is a result of new construction, because new construction is strongly correlated with current and predicted future rents.2 Several studies confirm, however, that increasing housing supply on a regional scale reduces or stabilizes regional housing prices (Hilber & Vermeulen, 2016; Mast, 2019; Saiz, 2010). This literature is divided, however, on the extent to which new housing eases housing cost burdens nearby (Anenberg & Kung, 2020; Asquith, Mast, & Reed, 2020; Freemark, 2019). Testing this hypothesis on two San Francisco, California block groups, Zuk and Chapple (2016, pp. 9–10) find that local housing cost burdens increased over time as more market-rate housing was built, while noting that subsidized housing construction is associated with lower rents and housing cost burdens, offsetting the economic burdens typically associated with eviction.3 Lundberg, Gold, Donnelly, Brooks-Gunn, and McLanahan (2020) find that public housing tenants are less likely to be evicted than similar tenants in unsubsidized housing are; however, other forms of assistance (chiefly Housing Choice Vouchers) did not insulate tenants from eviction. We expect, therefore, that new construction will be positively associated with Ellis petitions, whereas increased availability of subsidized housing may have a protective effect on court-based filings, resulting in lower rates in these tracts.4
Regardless of how new construction affects neighborhoods housing prices and rents, there is still limited evidence that increasing rents directly leads to the displacement of low-income renter households by eviction or other means (Dragan, Ellen, & Glied, 2019; Ellen & O’Regan, 2011; Freeman & Braconi, 2004).5 On one hand, associations between vacancy and eviction concentration could signal gentrification insofar as vacancies reflect residents not being able to afford high rents in newly constructed housing, or previous evictions occurring to make way for new types of tenants. We would expect these dynamics to occur in the case of Ellis evictions rather than court-based eviction cases (Lens et al., 2020). On the other hand, however, poor neighborhoods and neighborhoods with slack housing markets may also feature high levels of vacancy. This relationship is difficult to determine without knowledge of local housing markets (Lens et al., 2020).
A related literature posits that municipal and regional policy decisions may help shape eviction’s spatial dynamics. Sullivan (2017), for example, suggests that nearby affordable housing construction in Harris County, Texas, is a primary cause of trailer park evictions, rather than processes such as gentrification. Shelton (2018) similarly finds that evictions in Lexington, Kentucky, are concentrated in the city’s inner-ring suburbs, areas that turned into renting neighborhoods following the foreclosure crisis, rather than in the center city (see also Abood, 2018). Comparing four “displacement geographies” in Los Angeles, Sims (2016, p. 26) notes that local “growth machine” coalitions (Logan & Molotch, 1987, pp. 50–98), international investment, predatory lending, and property-based organizations work interdependently to produce hot spots of eviction in different parts of the county. This suggests that other spatially correlated characteristics may affect the distribution of court-based filings and Ellis petitions across neighborhoods beyond what can be straightforwardly measured using tract-level sociodemographic and housing characteristics. To investigate whether unmeasured, spatially correlated tract characteristics play significant roles in the spatial distribution of eviction prevalence in Los Angeles, we also investigate the presence of spatial correlation in the residual values.
Data and Methods
This study combines administrative data on two types of evictions, court based and Ellis Act, in Los Angeles to investigate how neighborhood sociodemographic and housing market characteristics shape the spatial concentration of eviction filings. We focus on the city of Los Angeles rather than Los Angeles County as HCIDLA only has jurisdiction over properties within the city of Los Angeles, not the entire county. We demonstrate the spatial concentration of court-based filings and Ellis petitions and neighborhood characteristics using global Moran’s I and Lagrange multiplier tests. We then use spatial autoregressive models to investigate how neighborhood characteristics are associated with eviction filing prevalence both within and across neighborhoods.
Court-Based Filings
We collected administrative data on court-based eviction cases and no-fault Ellis petitions filed in the city of Los Angeles from 2005 to 2015. Our data on court-based eviction cases consist of unlawful detainer (UD) lawsuits filed in Los Angeles city and compiled by American Information Research Services (AIRS), a firm that collects data on eviction-related cases filed in United States courts through a combination of web scraping and in-person data collection methods. This data set consists of point-level address data from 128,655 cases filed from 2005 to 2015.
The AIRS data do not represent all eviction cases filed in Los Angeles. There are three reasons cases may be excluded from the AIRS data. First, the data set includes only unsealed UD cases. Pursuant to California Code and Civil Procedure Section 1161.2, UD case records may be permanently sealed, rendering them inaccessible to public records requests.6 As cases had to be sealed by request with the agreement of all parties on the case during judgment,7 unsealed records may be more likely to represent cases that did not go before a judge, including default judgments in which tenants failed to file an answer to the court summons or appear at a court hearing, and cases dismissed because of a lack of prosecution. Second, AIRS typically does not collect records from dismissed cases.8 Third, the Stanley Mosk Courthouse, which covers Central Los Angeles, has limited case information in online court public access portals (necessitating in-person data collection) and rules limiting bulk collection of records. These restrictions increase the difficulty of collecting a complete set of case filings.
To validate the coverage of the AIRS data, we collected eviction case data for Los Angeles from two additional sources. First, we made Public Records Act requests for the annual number of case filings from the LASC from 2005 to 2015. The courts do not consistently record how many cases are sealed annually, so these data included only total filing volume and not volume by sealing status. Second, we web-scraped all publicly available UD court records in 2014 from the LASC website (lacourt.org). The web scraping returned 31,733 cases of the 56,519 total UD filings reported by LASC in 2014. This indicates that 56% of total cases filed were unsealed.
To determine what portion of unsealed cases should result in dismissals (and would therefore be unlikely to appear in the AIRS data), we assigned outcomes to the web-scraped case records. We used regular expressions to search through the text of case actions listed in the online record for judgment information. We selected cases from the Santa Monica Courthouse as a case study because of its high case-filing volume relative to other courts and its consistency in data availability. Default judgments and dismissals constituted 67% and 17% of case outcomes, respectively. The remaining 16% of cases resulted in a judgment at trial. This confirms that the majority (84%) of unsealed cases recorded by the Santa Monica courthouse in 2014 resulted in outcomes in which the defendant and plaintiff are less likely to appear before a judge (and request sealing of a case), as we would expect. This also suggests that we should expect roughly half of all eviction filings to appear in the AIRS data.9
In courthouses that routinely hear cases in the city of Los Angeles, an overall average of 56% of cases filed are represented in the AIRS data for the 2011–2015 period (see Figure A1 in the Appendix). This is consistent with our expectations and indicates that the AIRS data capture most unsealed, nondismissed eviction case filings in Los Angeles. Unsealed, nondismissed cases represent only about half of all cases filed, however, indicating that the court-based filing rates we calculate from these data underestimate the true volume of cases across all areas of Los Angeles. The Stanley Mosk Courthouse, which has barriers that increase the difficulty of record collection, has 45% of its filings represented in the AIRS data, which does not suggest that cases filed there are disproportionately underrepresented. Rather, the courts with the lowest average levels of coverage are outlying courthouses in Chatsworth and San Pedro, which only heard cases during the 2011–2013 period and represent only a very small volume of the total eviction case filings in the city of Los Angeles (see Figure A1).
As we are interested in the spatial distribution of residential eviction filings, we exclude court-based filings against commercial properties from the analysis. We identify commercial cases as those with property addresses with a commercial Residential Delivery Indicator according to the U.S. Postal Service.10 As less than 5% of the total cases in our data set are commercial cases, this does not substantially reduce the total number of filings in the analysis.
Ellis Act Petitions
Our second data set consists of annual no-fault eviction petitions filed with HCIDLA from 2005 to 2015. We requested and received these data directly from HCIDLA. All Ellis petitions must be filed directly with HCIDLA (rather than in local courts) and are included regardless of outcome. As a result, these data should represent the universe of Ellis petitions filed during this period (N = 7,021).
Our data for both court-based filings and Ellis petitions represent initiations of eviction actions and do not correspond to actual disruptive displacement via eviction. Court records do not contain information on whether tenants ultimately vacated the property following a case filing (with or without a judge’s order to vacate the property). Likewise, the HCIDLA Ellis data only include cases where landlords filed a petition and were approved to serve tenants with a notice of eviction. As a result, these data reveal where the threat of eviction is most acute in Los Angeles (e.g., Garboden & Rosen, 2019; Immergluck et al., 2019), rather than how many households are displaced annually by eviction actions. By exploring two types of eviction, we are able to further interrogate this distinction by looking at whether eviction risk varies spatially by eviction type. Regardless of whether an eviction actually occurred, however, any legal eviction record can negatively impact tenants’ ability to secure future housing (Kleysteuber, 2006), underscoring the importance of understanding where eviction filings are more likely to occur.
Both AIRS and HCIDLA data sets include property addresses associated with the eviction initiation. We geocoded property addresses to obtain the census tract location for each record. Although census tracts are not a perfect proxy for neighborhoods across all dimensions, they are often large enough to observe effects within local areas. We also aggregate census tracts within neighborhood boundaries defined by the Los Angeles Times’ Mapping LA Project,11 which are more intuitive and meaningful spatial units for residents and housing developers.
We used annual court-based filing and Ellis petition counts to calculate 5-year averages within census tracts in two time periods: 2005–2009 and 2011–2015. We do this for two reasons. First, partitioning years in this way allows us to make a comparison between the Great Recession years (2005–2009) and the post-Recession years (2011–2015), while smoothing over individual-year random variation in true case filing volume and small variations in AIRS data coverage. Second, we can merge the aggregated filing and petition counts with 2005–2009 and 2011–2015 waves of the American Community Survey (ACS) at the census tract level to obtain measures of neighborhood sociodemographic characteristics. Our primary time period of interest is the more recent one (2011–2015), but we use the 2005–2009 data to calculate change in eviction prevalence over time and in robustness analyses. For cross-sectional analyses, we use the 5-year filing and petition averages and ACS data, unchanged. When examining change in eviction filing prevalence and neighborhood characteristics between the two periods, we simply difference the 5-year eviction filing and petition averages and ACS covariate values.
We calculate court-based eviction filing and Ellis petition rates by dividing the 5-year average counts by the number of renter households in the census tract. For court-based filings, we specify the denominator as the total number of renter households (in 1,000s), as any rental unit can experience a court-based filing. Ellis petitions, on the other hand, would only be expected in households covered by the city’s rent stabilization ordinance: multifamily housing units that were built before October 1978 (Los Angeles Municipal Code Section 151.28). For that reason, we use the number of multifamily units built before 1980 (in 1,000s) as the denominator to calculate Ellis petition rates, which is the most time-specific variable available in ACS data.
We also collected data on several measures of neighborhood demographics and housing characteristics. From the ACS, we obtained the number of renter-occupied units, number of multifamily units constructed pre-1980, percentage of renter-occupied units, percentage of population by race and ethnicity, percentage of households with minors, percentage unemployment, percentage of the population with at least a 4-year college degree, percentage of the population with less than a high school diploma, poverty rates, median household income, median gross rent, median home value, and percentage of vacant units to assess demographics at the census tract level. These measures allow us to test associations between neighborhood sociodemographic disadvantage and demographic change that are likely to be associated with court-based filings or Ellis petitions. To assess whether eviction prevalence is affected by housing construction, we use the average count of housing units that received a certificate of occupancy during 2005–09 and 2011–15 from the Los Angeles County Assessor’s office. We also add the average numbers of different types of subsidized housing, including public housing units, Housing Choice Vouchers, and Low-Income Housing Tax Credit (LIHTC) units, over the same periods using data from the U.S. Department of Housing and Urban Development (HUD). In robustness analyses, we also examine the association between filing and petition prevalence and registered housing foreclosures, using public data obtained from the Los Angeles Open Data portal for 2014–2015. The lack of systematic availability of these records in Los Angeles prior to 2014 prevents us from including them in the primary analyses.
Analyses
To investigate the spatial concentration of court-based filings and Ellis petitions in Los Angeles, we must specify the locations of census tracts relative to one another. We define the spatial relationship between census tracts as a second-order rook contiguity spatial weights matrix with spectral normalization.12 Rook contiguity designates all census tracts that share a border as first-order neighbors and assigns a weight of 1 to these tracts in the matrix. Census tracts that do not directly border a given tract but share a border with its first-order neighbors are designated second-order neighbors and assigned a weight of 0.5.13 We use this same spatial weights matrix throughout the analyses and will refer to it as W.
We assess the spatial concentration of rates of court-based filings and Ellis petitions across census tracts within Los Angeles using Moran’s I. Moran’s I is a measure of global spatial autocorrelation, which indicates the extent to which similar values of a variable are clustered together spatially.14 If eviction filings are randomly distributed across census tracts, the value of Moran’s I would be 0. A positive Moran’s I value indicates that tracts with high eviction filling prevalence are clustered together, whereas a negative Moran’s I value indicates that high and low eviction prevalence is evenly dispersed spatially across tracts. The statistical significance of Moran’s I values is computed by comparing the observed distribution of outcomes with a null (randomly distributed) distribution with the same number of outcomes.
We also conduct Lagrange multiplier (LM) tests for spatial dependence in rates of court-based filings and Ellis petitions. These tests compare regression models that incorporate spatial dependence parameters (spatial lag and spatial error models) with nonspatial ordinary least squares (OLS) models. The null hypotheses for these tests are that the estimated coefficients for the spatial dependence terms are not significantly greater than zero. A statistically significant LM test indicates that the null hypotheses should be rejected and that spatial models provide a better fit for the data. The LM tests use the same spatial weights matrix (W) described above.
We then estimate generalized two-stage least squares spatial autoregressive (SAR) models (Kelejian & Prucha, 1998, 2010) to examine how neighborhood characteristics are associated with court-based filing and Ellis petition rates. SAR models help account for spatial dependence in the outcome by incorporating information on the spatial structure of the data (the spatial weights matrix) and allowing estimation of spatial effects, including indirect effects of covariates in neighboring spatial units and spatially lagged correlation in the outcome or model residuals (Anselin, 1988). Our SAR model takes the following form:
where the logged 5-year average of court-based filings per 1,000 rental units in census tract in time period is regressed on the sociodemographic and housing characteristics for that tract during the same period. We take the natural log of the eviction filing rate per rental units to adjust for skew and minimize heteroscedasticity. We estimate indirect effects for the vector of spatially lagged covariates from neighboring census tracts according to the spatial contiguity matrix described above. These coefficients capture the effects of neighborhood conditions in the surrounding census tracts on the eviction filing rate. In addition to the individual-level model errors , the model also includes a spatially lagged error term to measure the presence of residual spatial correlation in the errors.
We use the same SAR model to examine neighborhood correlates of Ellis petitions. Ellis petitions are rare in a census tract, even over a 5-year span.15 As discussed above, Ellis petitions can only be filed for multifamily housing units built and occupied before October 1978. Landlords may have limited economic incentive to remove rental housing from the market for private development or other reasons, and many census tracts go 5 years without such an event. For this reason, we have a substantial number of zeroes in the numerator of the Ellis petition rates, which is a particular problem when variables are logged, as justified above. Thus, we add a constant (0.1) to avoid losing hundreds of tract observations.16
The goal of these cross-sectional models is to identify the types of concurrent census tract characteristics that are associated with higher court-based filings or Ellis petitions. These models do not imply causal relationships; they only allow us to describe the associations between neighborhood conditions and eviction initiation prevalence. To examine how changes in census tract characteristics are associated with simultaneous changes in eviction filing/petition prevalence, we also estimate first-difference SAR models for court-based filings and Ellis petitions. In these models, we use the change in eviction initiation rates between the 5-year totals in t1 (2005–09) and t2 (2011–15) as the dependent outcome. The covariates are similarly differenced. These models not only allow us to observe how eviction prevalence and tract characteristics change together, but also help eliminate effects of time-invariant tract characteristics that may also be associated with eviction rates (as the values of these attributes would remain the same in both time periods and would thus be differenced out). This cannot account for effects of omitted variables that vary over time and may be associated with eviction prevalence.
Results
Aggregate Trends
We begin by looking at trends in eviction initiations over time in Los Angeles. Figure 1 shows court-based eviction filings and Ellis petitions. Court-based filings increased between 2006 and 2010, but have decreased in the years since. Ellis petitions show the opposite pattern; there was a precipitous decline in petitions from 2006 to 2008, with continued low prevalence during the recession years (2008–2012). In all years, there is a substantial difference in magnitude between court-based filings and Ellis petitions. Court-based filings are orders of magnitude more common that Ellis initiations, even as trends move in opposite directions.
Figure 1.
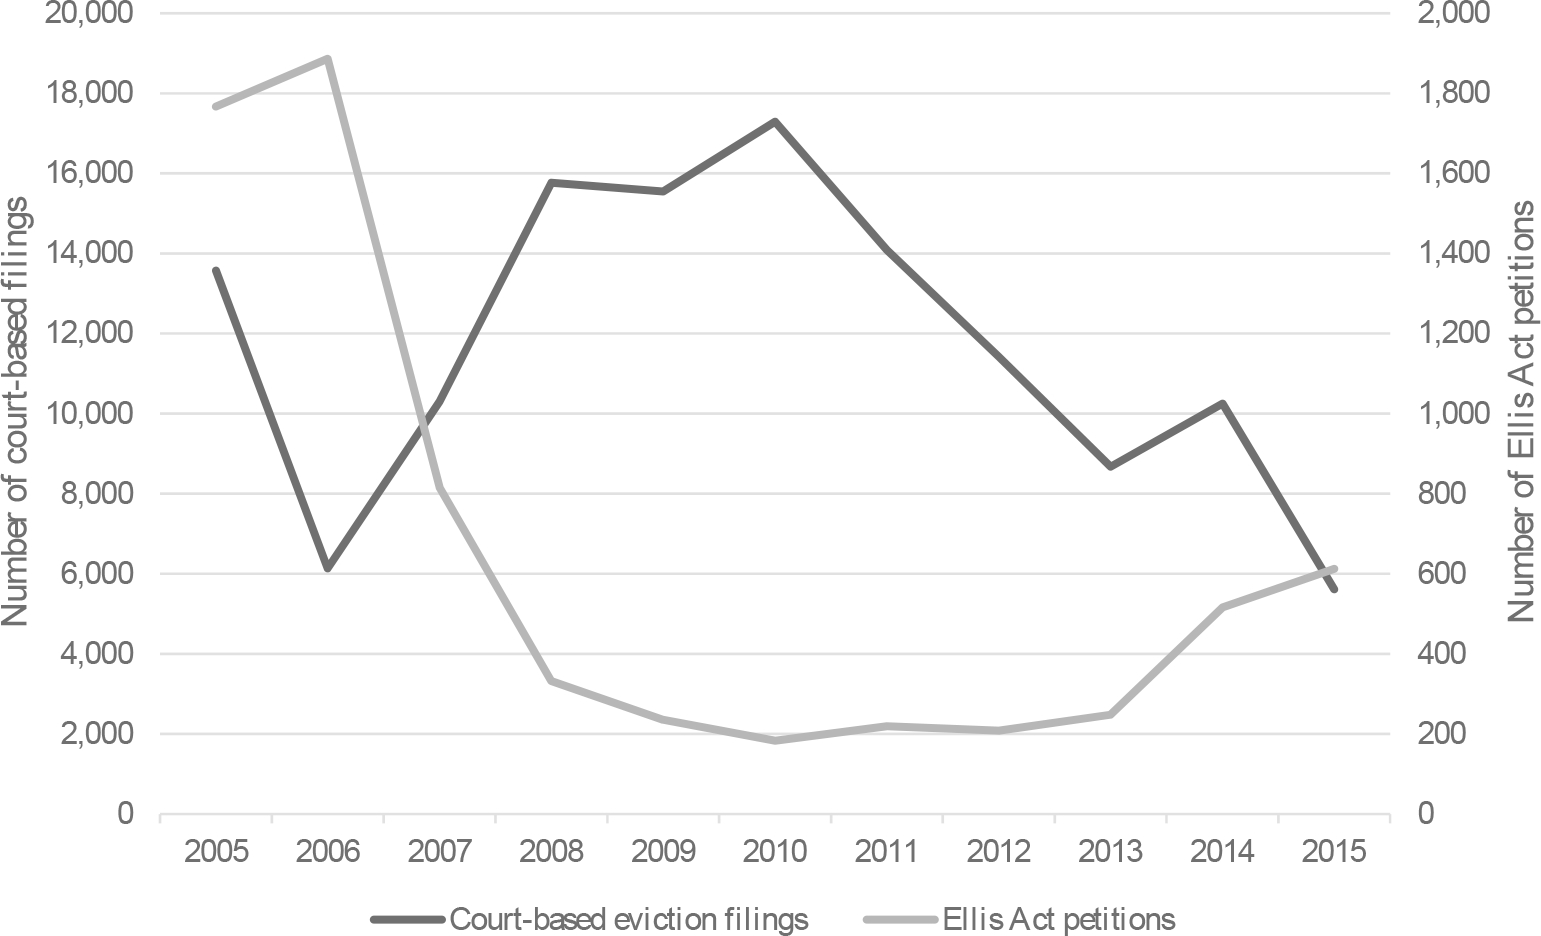
Court-based eviction filings and Ellis Act Petitions, Los Angeles, California, 2005–2015.
The inverse trends in court-based filings and Ellis petitions suggest that they are driven by different mechanisms. That court-based filings in Los Angeles peaked during the Great Recession years provides support for studies that have documented the negative effects of the foreclosure crisis on renters (Been & Glashausser, 2009; Kurwa, 2015). This research reveals that mortgage crises may negatively affect not only homeowners, but also tenants renting units in foreclosed houses and buildings.17 Alternatively, Ellis petitions are used by landlords to remove a property from the rental market, often to sell or transition the land for other types of development (e.g., condominium conversion). Thus, Ellis petitions are more likely to occur in a strong residential housing market, which was not the case during the Great Recession. We now evaluate how spatial dynamics vary between these two types of eviction.
Spatial Concentration of Eviction Filings
Table 1 shows the prevalence of court-based filings and Ellis petitions (and neighborhood demographic and housing characteristics). On average, 52.6 court-based filings occurred per census tract during the 2011–15 period. During this same period, an average census tract experienced only 1.9 Ellis petitions, again highlighting how much more frequent court filings are than Ellis petitions. For both court-based filings and Ellis petitions, there is an overall decrease in frequency of these events from the 2005–09 to 2011–15 period. This is consistent with what we observed in Figure 1.
Table 1.
Descriptive statistics, census tract level.
| 2011–15 (5-year average) |
Change (2005–09 to 2011–15) |
||||||||
|---|---|---|---|---|---|---|---|---|---|
| N | Mean | SD | Moran’s I | p value | Mean | SD | Moran’s I | p value | |
|
| |||||||||
| No. of court-based filings | 868 | 52.6 | 51.2 | 0.33 | .01 | − 1.7 | 24.6 | 0.34 | .01 |
| No. of court-based filings per 1,000 renter households | 868 | 58.3 | 39.9 | 0.36 | .01 | − 10.1 | 50.8 | 0.32 | .01 |
| No. of Ellis Act petitions | 868 | 1.9 | 3.9 | 0.23 | .01 | − 3.7 | 5.8 | 0.28 | .01 |
| No. of Ellis Act petitions per 1,000 pre-1980 multifamily units | 868 | 0.58 | 2.8 | 0.03 | .01 | − 0.9 | 4.0 | 0.20 | .01 |
| Rental units (1,000s) | 868 | 0.9 | 0.5 | 0.36 | .01 | 0.0 | 0.1 | 0.17 | .01 |
| Pre-1980 multifamily units (1,000s) | 868 | 0.4 | 0.4 | 0.44 | .01 | 0.0 | 0.1 | 0.16 | .01 |
| Household income ($1,000s) | 868 | 52.0 | 26.4 | 0.69 | .01 | 0.9 | 10.9 | 0.09 | .01 |
| % Vacant | 868 | 6.4 | 3.7 | 0.22 | .01 | 0.2 | 4.1 | − 0.03 | .07 |
| Median gross rent ($100s) | 868 | 12.9 | 4.1 | 0.65 | .01 | 1.3 | 1.8 | 0.10 | .01 |
| Median home value ($1,000s) | 868 | 495.7 | 273.5 | 0.74 | .01 | − 36.8 | 133.9 | 0.40 | .01 |
| % Renter occupied units | 868 | 66.0 | 22.6 | 0.56 | .01 | 1.3 | 6.2 | 0.02 | .19 |
| % Households with children | 868 | 34.4 | 15.3 | 0.74 | .01 | − 3.2 | 7.7 | 0.08 | .01 |
| % Black | 868 | 9.2 | 13.6 | 0.84 | .01 | − 0.4 | 4.3 | 0.11 | .01 |
| % Hispanic | 868 | 49.7 | 28.6 | 0.81 | .01 | 0.6 | 6.4 | 0.09 | .01 |
| % Asian | 868 | 11.6 | 12.0 | 0.64 | .01 | 0.0 | 4.6 | 0.00 | .48 |
| % with college degree or more | 868 | 29.7 | 21.5 | 0.84 | .01 | 1.5 | 5.5 | 0.07 | .01 |
| Poverty rate | 868 | 23.1 | 13.2 | 0.65 | .01 | 2.8 | 7.1 | 0.07 | .01 |
| % Unemployment | 868 | 5.6 | 2.1 | 0.23 | .01 | 0.6 | 2.6 | 0.05 | .01 |
| % without high school diploma | 868 | 17.1 | 10.8 | 0.78 | .01 | 0.6 | 6.4 | 0.04 | .05 |
| LIHTC units | 868 | 41.2 | 117.5 | 0.45 | .01 | 12.7 | 54.7 | 0.38 | .01 |
| Public housing units | 868 | 7.8 | 62.4 | 0.04 | .04 | − 0.1 | 15.6 | − 0.15 | .01 |
| Housing Choice Vouchers | 868 | 47.0 | 65.5 | 0.51 | .01 | 3.5 | 17.4 | 0.04 | .02 |
| Newly constructed units | 868 | 3.8 | 11.9 | 0.10 | .01 | − 5.6 | 21.8 | 0.08 | .01 |
Note. SD = standard deviation; LIHTC = Low-Income Housing Tax Credit.
We find evidence for statistically significant (using α < 0.05), positive spatial correlation among both court-based filing and Ellis petition rates (see Table 1). Again, a Moran’s I value statistically greater than zero indicates that tracts with increased eviction prevalence are spatially clustered (rather than randomly distributed across the city). Court-based filing rates (Moran’s I = 0.36) show a higher degree of spatial clustering than Ellis petition rates (Moran’s I = 0.03) do in the 2011–15 period; however, changes in court-based filing rates (Moran’s I = 0.32) and petition rates (Moran’s I = 0.20) from 2005–09 to 2011–15 show more similarity in degrees of spatial clustering. This suggests that changes over time in eviction prevalence are also spatially correlated.18
Mapping court-based filing rates in 2011–15 across neighborhoods shows that the areas with the highest prevalence are clustered in the South, Harbor, and San Fernando Valley regions of Los Angeles (see Panel A of Figure 2).19 Higher court-based filing rates were observed in these same regions in the 2005–2009 period, as well as in the Central, Northeast, and East regions (see Panel A of Figure A2). The high-income Westside region consistently experienced the lowest filing rates in both periods. Although the largest decreases in court-based filing rates between the 2005–09 and 2011–15 periods were also concentrated in the South, Central, Northeast and East regions (see Panel A of Figure A3), this is more reflective of the overall decline in court-based filings over time, rather than of large shifts in the neighborhoods where filings are most concentrated. Neighborhoods with increasing court-based filing rates were rarer and tended to be located in the San Fernando Valley, Westside, and Harbor regions. These increases may reflect neighborhoods with changing sociodemographic profiles or areas with expanding housing markets.
Figure 2.
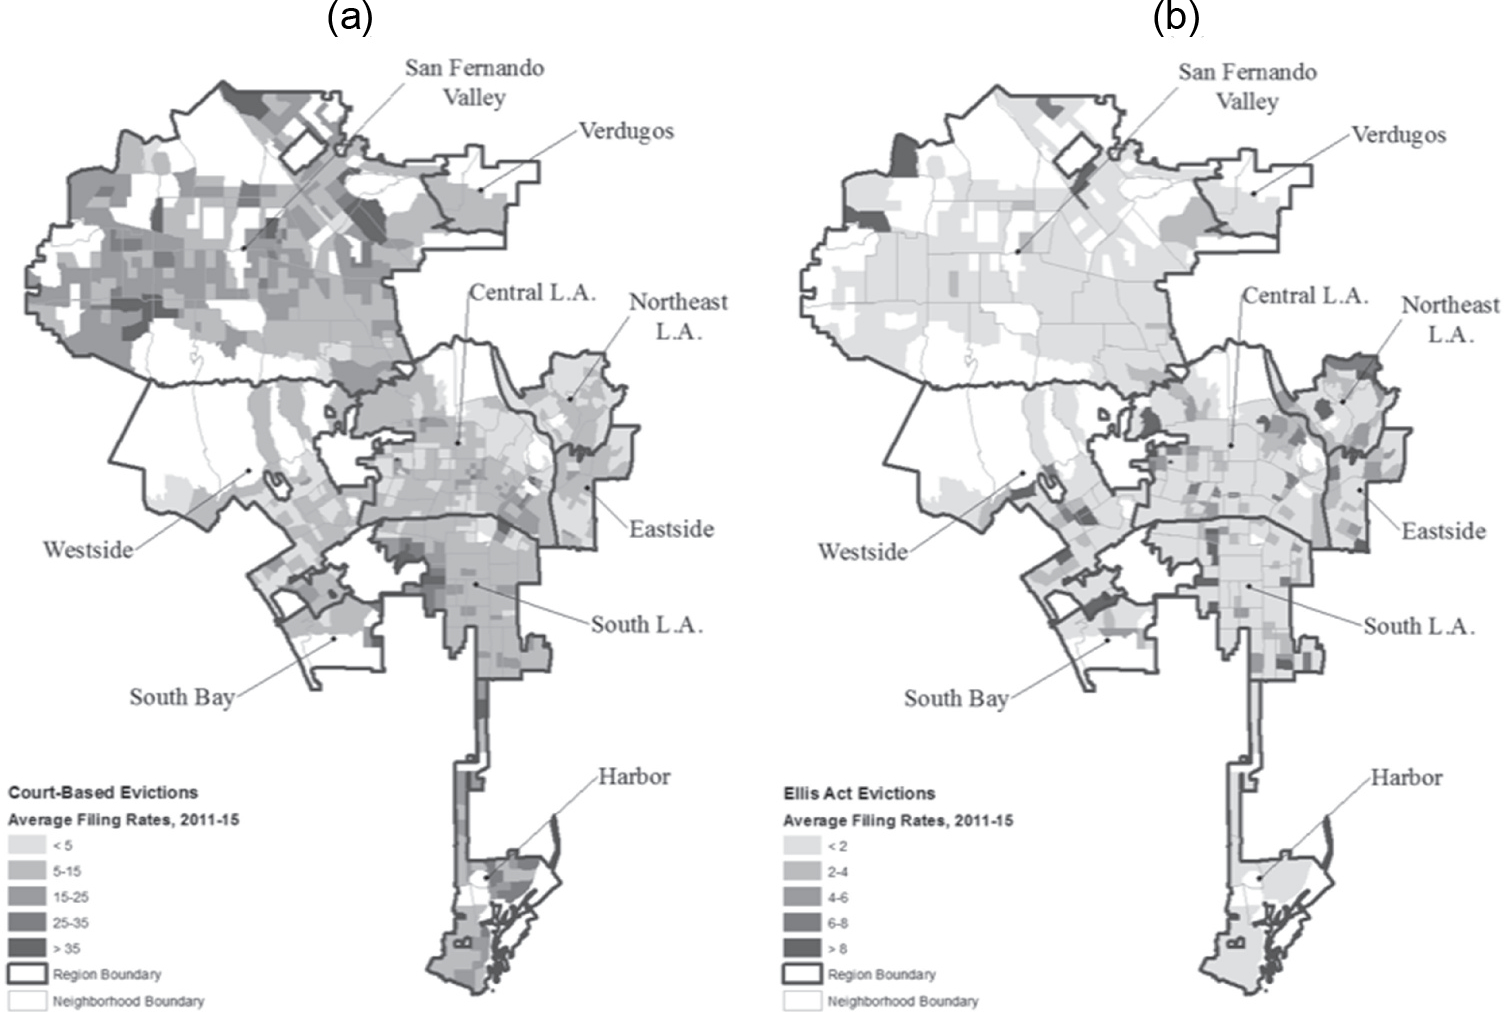
Map of (a) court-based eviction filing rates and (b) Ellis Act petition rates, by neighborhood, Los Angeles, California, 2011–15.
As we might expect from the lower magnitude of Moran’s I, tracts with higher average Ellis petition rates tended to be more isolated and less concentrated in specific regions (see Panel B of Figure 2). Ellis petition rates showed some clustering in a few neighborhoods, particularly within South Bay, South, Central, Northeast, and Eastside Los Angeles (see Panel B of Figure 2). These are generally lower income areas of Los Angeles, with the exception of parts of the South Bay and Northeast Los Angeles. Ellis petition rates were more likely to decrease, rather than increase, across most neighborhoods between 2005–09 and 2011–15, although decreases were particularly concentrated in neighborhoods in Central, Northeast, South, and the Eastside Los Angeles (see Panel B of Figure A3).
Moran’s I values for the covariates show that, as expected, many neighborhood sociodemographic and housing characteristics also exhibit spatial clustering. The spatial autocorrelation is strongest by race/ethnicity (percentage Black and Hispanic population) and education (percentage with a college degree vs. percentage without a high school diploma), and many measures show stronger spatial patterns than court-based filings or Ellis petitions. Changes in tract covariates over time also exhibit spatial clustering, although many neighborhood characteristics, including race/ethnicity and educational attainment, appear to be more stable over time than court-based filings or Ellis petition rates are.
To better understand how the spatial distribution of covariates affects court-based filings and Ellis petition rates, we present results of the cross-sectional SAR models in Table 2. The first column of Table 2 presents the direct, within-tract covariate effects for court-based filings. Higher rates of court-based filings per 1,000 rental units are located in tracts with higher percentage of Black population, household income, median gross rent, median home value, vacancy rate, number of new housing units constructed, and number of LIHTC units. The percentage of the population with at least a college degree is negatively associated with court-based filing rates. Some of these associations are consistent with previous research, including that neighborhoods with larger shares of Black population tend to experience higher eviction prevalence (Desmond, 2012b; Lens et al., 2020). The positive associations with economic indicators (household income, home value, gross rent) and construction of new housing units seem to suggest that it is not the most disadvantaged neighborhoods that have the highest court-based filing activity, but those that have more attractive housing conditions. The association with vacancy rate may reflect newly constructed units that have not yet been filled, or other types of neighborhood development.
Table 2.
Neighborhood characteristics associated with logged court-based filings and Ellis Act petition rates in 2011–15: Spatial autoregressive models.
| Court-based eviction filings |
Ellis Act petitions |
|||||||||||
|---|---|---|---|---|---|---|---|---|---|---|---|---|
| Direct effects |
Indirect effects |
Direct effects |
Indirect effects |
|||||||||
| Coeff. | Sig. | SE | Coeff. | Sig. | SE | Coeff. | Sig. | SE | Coeff. | Sig. | SE | |
|
| ||||||||||||
| Household income ($1,000s) | 0.0037 | ** | 0.0037 | 0.0200 | ** | 0.0086 | 0.0012 | 0.0055 | 0.0102 | 0.0195 | ||
| % Vacant | 0.0260 | *** | 0.0260 | − 0.0231 | 0.0258 | 0.0069 | 0.0138 | 0.1704 | *** | 0.0551 | ||
| Median gross rent ($100s) | 0.0271 | *** | 0.0271 | 0.0589 | * | 0.0344 | − 0.0251 | 0.0232 | − 0.2072 | ** | 0.0847 | |
| Median home value ($1,000s) | − 0.0003 | ** | − 0.0003 | − 0.0007 | 0.0006 | 0.0003 | 0.0004 | − 0.0002 | 0.0012 | |||
| % Renter-occupied units | − 0.0005 | − 0.0005 | 0.0221 | *** | 0.0059 | − 0.0140 | *** | 0.0045 | 0.0058 | 0.0123 | ||
| % Households with children | 0.0043 | * | 0.0043 | 0.0043 | 0.0105 | − 0.0095 | 0.0072 | − 0.0054 | * | 0.0209 | ||
| % Black | 0.0094 | *** | 0.0094 | 0.0057 | 0.0078 | 0.0091 | 0.0080 | 0.0180 | 0.0153 | |||
| % Hispanic | − 0.0011 | − 0.0011 | − 0.0065 | 0.0079 | 0.0221 | *** | 0.0076 | − 0.0234 | 0.0170 | |||
| % Asian | − 0.0041 | − 0.0041 | 0.0065 | 0.0069 | 0.0041 | 0.0081 | − 0.0085 | 0.0141 | ||||
| % with college degree or more | − 0.0109 | *** | − 0.0109 | − 0.0518 | *** | 0.0120 | 0.0219 | ** | 0.0091 | 0.0603 | ** | 0.0252 |
| Poverty rate | 0.0011 | 0.0011 | 0.0052 | 0.0121 | 0.0046 | 0.0079 | − 0.0346 | 0.0270 | ||||
| Unemployment rate | − 0.0068 | − 0.0068 | − 0.0245 | 0.0453 | − 0.0168 | 0.0257 | − 0.2106 | ** | 0.0890 | |||
| % without high school diploma | − 0.0010 | − 0.0010 | − 0.0654 | *** | 0.0204 | 0.0015 | 0.0142 | 0.1692 | *** | 0.0432 | ||
| LIHTC units | 0.0004 | ** | 0.0004 | 0.0035 | *** | 0.0009 | 0.0002 | 0.0006 | − 0.0034 | * | 0.0021 | |
| Public housing units | − 0.0004 | − 0.0004 | − 0.0035 | ** | 0.0016 | − 0.0006 | 0.0008 | 0.0125 | *** | 0.0034 | ||
| Housing Choice Vouchers | 0.0004 | 0.0004 | − 0.0032 | * | 0.0019 | 0.0004 | 0.0011 | 0.0005 | 0.0040 | |||
| Newly constructed units | 0.0065 | *** | 0.0065 | − 0.0052 | 0.0084 | 0.0071 | * | 0.0041 | − 0.0217 | 0.0189 | ||
| No. observations | 823 | 806 | ||||||||||
| SAR error term | 0.90 | *** | 0.05 | 0.49 | *** | 0.09 | ||||||
| Pseudo R2 | 0.43 | 0.26 | ||||||||||
Note. OLS = ordinary least squares; LIHTC = Low-Income Housing Tax Credit; SE = standard error.
p < .1
p < .05
p < .01.
Given the porosity of census tract boundaries and spatial correlation of tract characteristics in neighboring areas, we would expect reinforcing effects of housing and demographic variables not only within but also across census tracts. To investigate this, we present the across-tract (indirect) associations for court-based filings in the second column of Table 2. Household income, median rent, and LIHTC have significant positive direct and indirect effects, indicating that those attributes are also associated with higher eviction rates in neighboring tracts, although the indirect, spillover effect of median rent is only marginally significant (α < 0.10). Court-based filing rates are negatively associated with a more educated population both within and across tracts. No other variables show statistically significant direct and indirect associations in the same direction. The share of renter-occupied households has an indirect positive spillover effect, but no direct association with court-based filing rates within the same tract. Percentage of the population without a high school diploma and public housing units show indirect negative spillover effects, but have no direct associations with court-based filing rates. This suggests that educational attainment and public housing units in surrounding tracts can lower risk of court-based filings, net of within-tract associations with educational attainment or prevalence of subsidized housing.
Associations between tract characteristics and Ellis petitions do not follow the same patterns. Only percentage Hispanic population and percentage with at least a college degree have direct, positive associations with petition rates. Percentage of renter-occupied units is negatively associated with petitions within tracts, which may be self-reinforcing. If landlords file petitions before properties are converted into condos or other owner-occupied units, this type of eviction may be more likely in neighborhoods that already have higher percentages of owner-occupied units (or are moving in that direction). In general, Ellis petitions do not tend to be strongly associated with traditional indicators of disadvantaged neighborhoods or other sociodemographic characteristics that are commonly linked to eviction.
Several characteristics in adjacent census tracts have spillover effects on Ellis petition rates. We observe conflicting results with respect to educational attainment—there are positive spillover effects on both the population with at least a college degree (the only variable with a consistent association in direct and indirect models) and those without a high school diploma. We also observe a positive association with the vacancy rate and number of public housing units, two variables that are typically associated with softer housing markets where one might not expect to find a high number of Ellis petitions. Alternatively, the unemployment rate and median gross rent have significant indirect negative effects on petition rates.
A limitation of the cross-sectional models is that they cannot indicate how changes in neighborhood characteristics affect changes in eviction prevalence over time. The first difference models provide a better opportunity to test whether neighborhood change may affect the likelihood that households will receive either type of eviction notice. This is important when trying to document associations between evictions and neighborhood change, including shifts in sociodemographic and economic characteristics typically associated with gentrification. We present results of the first difference model in Table 3.
Table 3.
Associations between changes (△) in neighborhood characteristics and court-based eviction filing and Ellis Act petition rates, 2005–09 to 2011–15: Spatial autoregressive models.
| △ Court-based eviction filings |
△ Ellis Act petitions |
|||||||||||
|---|---|---|---|---|---|---|---|---|---|---|---|---|
| Direct effects |
Indirect effects |
Direct effects |
Indirect effects |
|||||||||
| Coeff. | Sig. | SE | Coeff. | Sig. | SE | Coeff. | Sig. | SE | Coeff. | Sig. | SE | |
|
| ||||||||||||
| Change in household income ($1,000s) | − 0.0022 | 0.0235 | 0.1505 | 0.1231 | − 0.0616 | *** | 0.0230 | − 0.0579 | 0.1018 | |||
| Change in % vacant | 0.1808 | *** | 0.0507 | 0.1537 | 0.2793 | 0.1031 | ** | 0.0490 | 0.0972 | 0.2281 | ||
| Change in median gross rent ($100s) | − 0.0148 | 0.1274 | − 1.2705 | ** | 0.5720 | − 0.2486 | ** | 0.1259 | − 1.0156 | ** | 0.4750 | |
| Change in median home value ($1,000s) | 0.0006 | 0.0017 | 0.0029 | 0.0073 | 0.0004 | 0.0017 | − 0.0015 | 0.0060 | ||||
| Change in % of renter-occupied units | − 0.3148 | *** | 0.0351 | 0.0614 | 0.1895 | − 0.0126 | 0.0338 | 0.2990 | ** | 0.1500 | ||
| Change in % of households with children | 0.0137 | 0.0289 | − 0.1534 | 0.1345 | 0.0504 | * | 0.0283 | 0.0022 | 0.1018 | |||
| Change in % Black | 0.1280 | ** | 0.0556 | 0.8060 | *** | 0.2673 | 0.0136 | 0.0542 | 0.0180 | 0.1977 | ||
| Change in % Hispanic | − 0.0028 | 0.0405 | 0.1371 | 0.2116 | − 0.0264 | 0.0393 | − 0.0829 | 0.1709 | ||||
| Change in % Asian | − 0.0421 | 0.0515 | 0.1356 | 0.2761 | 0.0145 | 0.0498 | − 0.2084 | 0.2276 | ||||
| Change in % with college degree or more | 0.0264 | 0.0429 | 0.1379 | 0.2368 | 0.0194 | 0.0415 | 0.1505 | 0.1867 | ||||
| Change in poverty rate | 0.0154 | 0.0311 | 0.0337 | 0.1528 | − 0.0150 | 0.0305 | − 0.2673 | ** | 0.1218 | |||
| Change in unemployment rate | − 0.0233 | 0.0858 | − 1.0857 | ** | 0.4458 | 0.0450 | 0.0837 | 0.1795 | 0.3515 | |||
| Change in % without high school diploma | 0.0480 | 0.0597 | − 0.4736 | 0.3193 | − 0.0542 | 0.0573 | 0.0385 | 0.2525 | ||||
| Change in LIHTC units | − 0.0061 | 0.0065 | 0.0134 | 0.0283 | 0.0001 | 0.0065 | 0.0063 | 0.0227 | ||||
| Change in public housing units | 0.0146 | 0.0158 | 0.1319 | 0.1017 | 0.0162 | 0.0143 | 0.2198 | *** | 0.0840 | |||
| Change in Housing | 0.0102 | 0.0143 | − 0.0270 | 0.0803 | − 0.0033 | 0.0136 | 0.0148 | 0.0617 | ||||
| Choice Vouchers Change in newly constructed units | 0.0164 | 0.0114 | − 0.1771 | *** | 0.0633 | − 0.0209 | * | 0.0112 | − 0.0757 | 0.0500 | ||
| No. observations | 823 | 806 | ||||||||||
| SAR error term | 0.81 | *** | 0.07 | 0.36 | *** | 0.10 | ||||||
| Pseudo R2 | 0.23 | 0.08 | ||||||||||
Note. LIHTC = Low-Income Housing Tax Credit; SAR = spatial autoregressive; SE = standard error.
p < .1
p < .05
p < .01.
There are few significant associations between changes in tract sociodemographic and housing characteristics and change in rates of court-based filings over time. Increases in the vacancy rate and percentage Black population are associated with increases in court-based filings, whereas increases in the share of units renter-occupied are associated with decreases in court-based filings. The percentage Black population in surrounding tracts also has an indirect, positive effect on court-based filing rates. Increasing median gross rents, unemployment rate, and newly constructed units all have negative, indirect effects on court-based filing rates. The findings for percentage Black population and vacancy rate are consistent with the cross-sectional associations. This reinforces one of the most consistent findings of studies of eviction prevalence—that court-based filings are higher in neighborhoods with larger shares of Black residents. Furthermore, the indirect effect of an increasing share of Black population demonstrates a reinforcing spillover effect. Increases in rates of court-based filings are felt most acutely in neighborhoods that not only have increasing shares of Black residents, but also share borders with tracts with increases in Black residents.
For Ellis petitions, increasing vacancy rates also have a positive association with increasing rates of petitions, whereas increasing household incomes and, unexpectedly, gross rents are associated with decreasing petition rates. Increases in gross rent and poverty rates in surrounding tracts are also associated with decreasing petition rates. Increases in percentage renter-occupied units and public housing units in surrounding tracts are both associated with increased petition rates. The direct positive association with vacancy rates may be the result of rental buildings being taken off the market, but the remaining direct and indirect effects do not suggest that increasing petition rates are associated with the sociodemographic changes that typically follow gentrification. Again, traditional socioeconomic measures also do not show strong direct or indirect associations with petition rates, suggesting that Ellis petitions may be generated by housing market conditions that are not well captured in the measures available for these analyses.
There are many neighborhood characteristics, including concentration of property ownership or landlord type, that we are not able to measure in these analyses. These conditions are also likely concentrated within neighborhoods and, therefore, spatially correlated across census tracts. We include spatial error terms in our regression models to help mitigate concerns that these unmeasured neighborhood conditions are inflating associations (and deflating standard errors) between measured covariates and court-based filing and Ellis petition rates. The presence of positive, significant spatial error terms in both the cross-sectional (see Table 2) and first-difference (see Table 3) models suggests that spatially correlated neighborhood characteristics remain a concern for explaining the spatial dynamics of eviction. Although the magnitude of the spatial error terms differs, it is significant across models for both court-based filings and Ellis petition rates. The magnitude of the spatial error terms neither provides a direct measurement of the strength of these unmeasured associations nor indicates what types of housing, landlord, or tenant characteristics may be responsible for the spatial correlation of the model residuals. More robust data on concentration of property ownership, landlord eviction practices, and housing market conditions would allow future research to better address the continued spatial concentration of eviction activity within neighborhoods and the strength of those associations.
Discussion and Conclusions
In this article, we examine the spatial concentration of two types of evictions—court-based eviction case filings and Ellis Act petitions—in Los Angeles. Explanations for eviction prevalence at the neighborhood level generally fall into one of two categories—either poverty and racial discrimination concentrate evictions among those unable to pay even relatively low rents, or neighborhood gentrification leads to difficulty paying quickly rising rents. We analyze court-based filings and Ellis petitions separately as we might expect court-based filings, which are typically pursued for nonpayment of rent or at-fault infractions, to be more concentrated in areas characterized by disadvantage than no-fault Ellis petitions filed by landlords seeking to convert rental housing in attractive housing markets. By using analyses that explicitly incorporate spatial autocorrelation, we shed light on broader spatial patterns of eviction initiations across the city of Los Angeles and how court-based filing and Ellis petition rates are shaped by surrounding neighborhood conditions. Consistent with previous research, the share of Black population shows the most consistent correlation with court-based filing rates, although this association is not present for Ellis petitions. Spatial distribution of Ellis petitions shows no strong connections to explanations of either concentrated disadvantage or neighborhood gentrification.
Our analyses yield four key findings regarding two types of eviction. First, we show that court-based filings and Ellis petitions differ substantially in both prevalence and temporal trends. Court-based filings are much more common than Ellis petitions in all years, even at their lowest point in 2015. Court-based filings peaked during a period of economic recession, whereas Ellis petitions showed the opposite trend. These findings suggest that these two types of evictions are distinct in their underlying mechanisms and are unlikely to be interchangeable when examining the burden of eviction in a neighborhood. Our analysis suggests that future research must account for not only how determinants of eviction prevalence vary by eviction type, but also how these determinants vary spatially and temporally.
Second, we provide evidence that spatial autocorrelation is a significant concern when examining neighborhood-level eviction prevalence. Previous neighborhood-level studies have focused on associations between within-tract characteristics and eviction prevalence, without always adjusting for the influence exerted by the sociodemographic or housing characteristics of neighboring tracts. Accounting for the porosity of neighborhood boundaries is key to assessing how neighborhood characteristics and dynamics affect eviction and other forms of displacement.
Third, we demonstrate that both court-based eviction filing and Ellis petition rates are spatially concentrated within particular neighborhoods across the city. Court-based filings show greater and more persistent concentration. This may be due to their stronger associations with sociodemographic characteristics, particularly the share of Black population, which exhibit high levels of spatial autocorrelation and stability over time. Somewhat surprisingly, other measures of socioeconomic disadvantage were not strong predictors of either contemporary court-based filing rates or the change in these rates over time. This suggests that higher eviction risk in neighborhoods with larger shares of Black residents cannot be straightforwardly attributed to socioeconomic hardship, but may instead reflect discriminatory practices in renting and other individual and institutional causes of “place stratification” (Charles, 2006, pp. 58–62).
Finally, Ellis petitions demonstrated weaker positive spatial autocorrelation than court-based filings did and were more evenly distributed across Los Angeles neighborhoods, particularly in the 2011–15 period. Ellis petition rates did not show strong associations with sociodemographic characteristics within or across neighborhoods. In particular, we did not find that Ellis petitions were consistently associated with decreasing shares of Black or Hispanic population, increasing percentage population with at least a college degree, or other measures of increasing socioeconomic status. The relative rarity of these types of evictions, particularly compared with court-based filings, and their tendency to be clustered within the same rental buildings covered by Los Angeles rent stabilization ordinances (that may or may not reflect the average neighborhood characteristics), may create less consistent predictors of where these petitions are most likely to be filed. Increased selection effects of both landlords into ownership of these buildings and tenants into renting units in these building may require more targeted analyses to uncover why some buildings are more likely to undergo Ellis conversions than others.
Limitations
In these analyses, we focus only on eviction dynamics in the city of Los Angeles, making generalization to other cities difficult. For one thing, Los Angeles is one of the most expensive rental housing markets in the country (Joint Center for Housing Studies of Harvard University 2020). Furthermore, Los Angeles is the second largest city in the country, with a population that is far more racially and ethnically diverse than that of many cities studied in the literature thus far (Lens et al., 2020). Focusing on one city, however, allows us to use consistent sources of data across the full study area, thereby avoiding findings that may reflect differences in how eviction filings are processed and recorded across jurisdictions (Gerchick, 1994; Monsma & Lempert, 1992). Many previous studies have documented the inequality in distribution of sociodemographic characteristics across neighborhoods within many American cities, suggesting that the patterns of spatial concentration identified here may be detected in future research focusing on other cities.
Our study has several limitations. First, we can only measure the initiation of an eviction action, and not displacement that might result from that action. We acknowledge that eviction filings and actual evictions are distinct outcomes with different consequences for renters. There is significant evidence to suggest that simply having an eviction case visible in the public record (regardless of case outcome) is detrimental to securing future housing (Desmond, 2016; Kleysteuber, 2006), which makes eviction filings an important measure of the burden of eviction.
Second, from the publicly available data on court-based eviction case filings, we are unable to assess how outcomes that render cases unlikely to be included in the AIRS data (i.e., cases that were dismissed or sealed) may unevenly affect the spatial distribution of observed case filings. All cases initially filed should be eligible to be collected by AIRS, although if cases in some neighborhoods are more likely to be dismissed or end in a settlement agreement in which the case record is sealed as a condition of judgment, this would disproportionately decrease the number of cases observed in these areas relative to others. Increased coverage of cases heard in the Long Beach and Pasadena courthouses in the AIRS data (see Figure A1) suggests that cases in these areas may be less likely to be either dismissed or sealed during judgment.
Third, we cannot control for the concentration of particular landlords in different neighborhoods. Desmond (2016) notes a certain degree of flexibility in mom-and-pop landlords’ decisions to evict tenants, and Raymond et al. (2018) find that corporate landlords and institutional investors tend to evict more frequently because of their adherence to protocol and procedure (see also Immergluck et al., 2019). As Abood (2018) notes, corporate landlords have become more prominent features of Southern California’s rental housing market since the Great Recession. Because of a lack of information on landlord characteristics, we are unable to examine whether accounting for landlord type would significantly alter our findings. Future research on whether landlord type helps to explain the spatial concentration of eviction across neighborhoods would aid in refining the findings presented here.
Fourth, we can only understand the results presented here as statistical associations, given the endogeneity of the mechanisms connecting neighborhood demographics, housing markets, and eviction outcomes. These neighborhood descriptions and associations, however, have empirical and policy utility as such. It is difficult to identify where the burden of eviction is most significant (and to identify possible solutions) without examining how eviction prevalence and concentration vary across neighborhoods and over time.
Policy Implications
Our study has three direct policy implications for Los Angeles and for other metropolitan areas across the United States. First, we have shown that it is difficult to predict eviction’s spatial dynamics and prevalence; concentrations fluctuate over time and their determinants vary based on the type of eviction, housing market dynamics at a given time, and broader economic trends. As a result, instituting robust tenant protections across geographic boundaries (national, state, and municipal levels) seems more sensible than targeting particular neighborhoods where these dynamics are very hard to predict within the constraints of existing data. Further, expanding tenants’ rights must be complemented by a true right to legal counsel for tenants facing eviction, and by rigorous code enforcement, ensuring that rights actually—rather than merely symbolically—benefit tenants.
That being said, our findings also support a meaningful exception to this initial proposal. Eviction prevalence rises with a neighborhood’s proportion of Black residents, irrespective of time considerations and common indicators of neighborhood disadvantage. Therefore, we advocate for consistent, targeted eviction defense and homelessness prevention initiatives in neighborhoods with high concentrations of Black residents, irrespective of neighborhoods’ socioeconomic and housing market characteristics (see also LAHSA 2018). Alongside of expanding various tenant protections, interventions targeting neighborhoods with high and increasing shares of Black residents should pay immediate dividends in mitigating the devastating effects of racially discriminatory behaviors that result in durably disproportionate representation of Black renters on eviction dockets across locations.
Third, our ability to understand eviction’s spatial dynamics is severely limited by the inaccessibility of eviction data in Los Angeles and beyond (cf. Desmond et al., 2018). Budgetary limitations and institutional mandates play key roles in court systems’ inability (or unwillingness) to provide publicly accessible data to advocates and researchers. Therefore, we recommend that state legislatures allocate funding for consistent data collection on eviction filings and outcomes, as well as a mandate that courts make anonymized, aggregate data publicly accessible. As awareness grows both locally and nationally around eviction’s centrality to the worsening housing crisis, it is essential to know where eviction takes place and its outcomes so that policymakers are able to make data-driven decisions on how, when, and where best to address the eviction crisis in Los Angeles and in other metropolitan areas across the United States.
Notes
Precise rules pertaining to no-fault evictions vary by locality, local rent control ordinances (if in effect), and whether tenants qualify for certain benefits based on housing tenure, age, or disability status.
Economic theory posits that new housing supply provides more housing options for tenants, more housing competition for landlords, and lower market prices for housing at both regional and local levels. In this way, new housing supply might relax displacement pressure. This theory notably conflicts with tenants’ rights and anti-gentrification advocates’ longstanding perspectives that new construction is instead a signal to neighboring landlords that the neighborhood is taking off and that higher rents can be obtained for existing properties. An evaluation of the historical debate between these two theoretical positions is beyond of the scope of this article.
Research is similarly mixed when it comes to the protective effects of subsidized housing construction, but notes that neighborhood context is an important determinant of the effect. For example, subsidized housing production in distressed areas, often replacing vacant buildings, can increase property values, according to Schill, Ellen, Schwartz, and Voicu (2002), whereas Baum-Snow and Marion (2009) conclude that Low-Income Housing Tax Credit (LIHTC) development reduces the overall income of neighborhoods in gentrifying areas. Similarly, Diamond and McQuade (2019) find that LIHTC development leads to increased house prices in low-income areas, but lowers prices in higher income areas.
Qualitative research by Desmond (2016) and Rosen (2020) suggests that this dynamic may differ in certain housing markets. Landlords who engage in practices of reverse selection, for example, may recruit tenants with a higher likelihood of eviction given their economic precarity. The precise measurement of eviction may also complicate these findings (Hartman & Robinson, 2003). Given the difficulty of accessing subsidized housing in Los Angeles because of extremely high demand, for example, tenants in these cases may be more likely to settle cases with terms that landlords seal their records so as to not jeopardize their Housing Choice Voucher status. We cannot explore these questions, however, since our sample includes only unsealed court-based records—as opposed to small-n qualitative studies, which include Housing Choice Voucher holders and landlords among their respondents (e.g., Rosen, 2020). Furthermore, these studies do not suggest that Housing Choice Voucher tenants are more likely than tenants living in unsubsidized rental housing to be evicted.
The literature is divided on the relationships between these variables; we choose to test this hypothesis by operationalizing gentrification in terms of change across residents’ sociodemographic characteristics and changes in housing costs. For example, our model includes variables such as percentage with a college education and percentage age 25–44, reflecting the longstanding finding that newcomers in gentrifying neighborhoods are typically younger and have higher levels of education compared with longtime neighborhood residents (see Brown-Saracino, 2010, 2017 for reviews of this literature). This literature also suggests that gentrification implies increases in a neighborhood’s median income, rents, and housing values.
The ability to seal an eviction case from the public record is central to California tenant protections. Although case sealing presents a challenge to researchers studying eviction, this practice helps shield tenants from future housing discrimination, particularly tenants who have been filed on but not actually evicted (Kleysteuber, 2006).
The California Civil Code and Procedure was amended in 2016 to automatically seal all UD eviction case records, except those in which the landlord-plaintiff prevails within 60 days of the filing. This change significantly reduced the number of UD cases available to public audiences. As our data covered the period 2005–2015, automatic case sealing was not yet in effect.
This applies to cases dismissed with or without prejudice.
We arrive at this proportion by multiplying the proportion of cases that were unsealed (0.56) by the probability that the unsealed case was not dismissed (0.84), which yields 0.47, or roughly 50%.
We obtained Residential Delivery Indicators for addresses included in the AIRS data through the Smarty Streets Application Programming Interface (https://smartystreets.com/).
Neighborhood boundaries were created by merging neighboring census tracts and revised by incorporating feedback collected from local residents in 2009. The final version of the boundaries was produced in 2010 and can be accessed at http://boundaries.latimes.com/sets/.
Spectral normalization scales the weights matrix to avoid singularities in the estimation of spatial models and to increase the interpretability of spatial correlation coefficients by bounding their range between −1 and 1 (the range of standard correlation coefficients).
In this way, tracts that do not share borders but have common vertices (queen contiguity) would almost certainly be designated as second-order neighbors. This preserves the spatial relationships between tracts while recognizing that shared borders represent greater contact area and, therefore, a greater likelihood of spatial spillover in neighborhood characteristics.
Moran’s I is one of the most commonly used measures of spatial autocorrelation. It is routinely used to assess spatial correlation of ecological and geographical features of an area as well as epidemiological outcomes. For more information see Chapter 9 in Bivand, Pebesma, and Gómez-Rubio (2013).
Descriptive statistics, including the average number of Ellis petitions in tracts over the 2011–2015 period, are included in Table 1 below.
We tested alternative values for the small constant (0.5 and 0.01) to ensure the choice of the small constant did not significantly alter the results (results from these models are available upon request). As a robustness check on the fitness of using logged Ellis petition rates as an outcome in the SAR models, we also estimate a negative binomial model where the dependent variable is the average, untransformed count of Ellis petitions with the exposure set as the number of multifamily units built before 1980. Negative binomial models are appropriate when variables are strongly skewed toward zero (Berk & MacDonald, 2008). We compare these results with a regular nonspatial OLS model using the logged rate (after adding the small constant) to ensure that modeling choice does not substantively alter associations observed in the data (see Appendix Table A1).
Limited comprehensive data on foreclosures in Los Angeles during our period of study did not allow us to include foreclosure rates as a covariate in our models. We conducted a robustness analysis that included foreclosure rates (defined as the number of foreclosure starts divided by the number of owner-occupied housing units) for 2014–2015. Foreclosure rate showed marginally significant associations with both court-based filings and Ellis petition rates at the 10% level (see Table A2 in the Appendix). More comprehensive data on foreclosures over the full period of analysis would allow more robust analyses of the relationship between foreclosures and evictions and should be addressed in future research.
Results from the LM tests confirm the Moran’s I findings. Significant spatial spillover was observed in court-based filing rates in the 2011–15 period (LMlag = 481.41, p < .01) as well as changes in court-based filing rates between 2005–09 and 2011–15 (LMlag = 376.51, p < .01). Robust specifications of these tests also showed statistically significant spatial autocorrelation. As indicated by Moran’s I, spatial autocorrelation was less pronounced among Ellis petitions, although LM tests still indicated spatial correlation in the model error terms (LMerr = 10.81, p < .01) in the 2011–15 period. LM tests of the change in petition rates between 2005–09 and 2011–15 were not significant, which may reflect increased stochasticity associated with the relatively small number of these events over time.
We identify regions rather than individual neighborhoods in the maps to increase legibility. A list of the neighborhoods located in each region is included in Table A3 in the Appendix.
Funding
This work was supported by the UCLA Institute on Inequality and Democracy.
Appendix
Table A1.
Comparison of results from negative binomial and (nonspatial) OLS regression models, Ellis Act petitions, 2011–15.
| Negative binomial (outcome: count of petitions) |
OLS (outcome: logged petition rate) |
|||||
|---|---|---|---|---|---|---|
| Coeff. | Sig. | SE | Coeff. | Sig. | SE | |
|
| ||||||
| Household income in $1,000 | − 0.0052 | 0.0077 | − 0.0001 | 0.0035 | ||
| % Vacant | 0.0315 | 0.0200 | 0.0144 | 0.0088 | ||
| Median gross rent in $100 | 0.0295 | 0.0306 | − 0.0098 | 0.0148 | ||
| Median home value in $1,000 | 0.0013 | *** | 0.0005 | 0.0006 | *** | 0.0002 |
| % Renter occupied units | − 0.0350 | *** | 0.0053 | − 0.0090 | *** | 0.0026 |
| % Households with children | − 0.0043 | 0.0090 | − 0.0056 | 0.0042 | ||
| % Black | 0.0499 | *** | 0.0078 | 0.0186 | *** | 0.0034 |
| % Hispanic | 0.0290 | *** | 0.0087 | 0.0151 | *** | 0.0038 |
| % Asian | 0.0207 | *** | 0.0074 | 0.0084 | ** | 0.0034 |
| % with college degree or more | 0.0591 | *** | 0.0113 | 0.0274 | *** | 0.0051 |
| Poverty rate | 0.0114 | 0.0099 | 0.0056 | 0.0047 | ||
| Unemployment rate | 0.0325 | 0.0357 | − 0.0045 | 0.0163 | ||
| % without a high school diploma | 0.0837 | *** | 0.0196 | 0.0271 | *** | 0.0084 |
| LIHTC units | 0.0010 | 0.0007 | − 0.0001 | 0.0004 | ||
| Public housing units | − 0.0026 | 0.0016 | − 0.0005 | 0.0005 | ||
| Housing Choice Vouchers | − 0.0035 | ** | 0.0017 | 0.0000 | 0.0007 | |
| Newly constructed units | 0.0096 | * | 0.0053 | 0.0041 | 0.0026 | |
| Constant | − 4.2437 | *** | 0.9902 | − 1.8947 | *** | 0.4240 |
| No. observations | 806 | 806 | ||||
Note. OLS = ordinary least squares; LIHTC = Low-Income Housing Tax Credit; SE = standard error.
p < .1
p < .05
p < .01.
Table A2.
Neighborhood characteristics (with foreclosure rate) associated with logged court-based filings and Ellis Act petition rates in 2011–15: Spatial autoregressive models.
| Court-based eviction filings |
Ellis Act petitions |
|||||||||||
|---|---|---|---|---|---|---|---|---|---|---|---|---|
| Direct effects |
Indirect effects |
Direct effects |
Indirect effects |
|||||||||
| Coeff. | Sig. | SE | Coeff. | Sig. | SE | Coeff. | Sig. | SE | Coeff. | Sig. | SE | |
|
| ||||||||||||
| Household income in $1,000 | 0.0037 | * | 0.0019 | 0.0190 | ** | 0.0085 | 0.0011 | 0.0055 | 0.0116 | 0.0195 | ||
| % Vacant | 0.0270 | *** | 0.0049 | − 0.0190 | 0.0257 | 0.0043 | 0.0138 | 0.1629 | *** | 0.0562 | ||
| Median gross rent in $100 | 0.0282 | *** | 0.0078 | 0.0647 | * | 0.0341 | − 0.0269 | 0.0232 | − 0.2083 | ** | 0.0843 | |
| Median home value in $1,000 | − 0.0003 | ** | 0.0001 | − 0.0006 | 0.0006 | 0.0003 | 0.0004 | − 0.0002 | 0.0012 | |||
| % Renter-occupied units | − 0.0002 | 0.0016 | 0.0227 | *** | 0.0058 | − 0.0149 | *** | 0.0046 | 0.0057 | 0.0123 | ||
| % Households with children | 0.0045 | * | 0.0025 | 0.0066 | 0.0104 | − 0.0098 | 0.0072 | − 0.0087 | * | 0.0213 | ||
| % Black | 0.0098 | *** | 0.0028 | 0.0069 | 0.0078 | 0.0080 | 0.0081 | 0.0164 | 0.0158 | |||
| % Hispanic | − 0.0012 | 0.0027 | − 0.0079 | 0.0079 | 0.0222 | *** | 0.0076 | − 0.0213 | 0.0172 | |||
| % Asian | − 0.0040 | 0.0028 | 0.0065 | 0.0067 | 0.0040 | 0.0081 | − 0.0089 | 0.0140 | ||||
| % with college degree or more | − 0.0113 | *** | 0.0032 | − 0.0540 | *** | 0.0119 | 0.0227 | ** | 0.0091 | 0.0618 | ** | 0.0251 |
| Poverty rate | 0.0016 | 0.0028 | 0.0069 | 0.0121 | 0.0037 | 0.0079 | − 0.0370 | 0.0272 | ||||
| Unemployment rate | − 0.0063 | 0.0092 | − 0.0167 | 0.0446 | − 0.0171 | 0.0256 | − 0.2205 | ** | 0.0889 | |||
| % without a high school diploma | − 0.0011 | 0.0049 | − 0.0647 | *** | 0.0202 | 0.0015 | 0.0142 | 0.1669 | *** | 0.0433 | ||
| LIHTC units | 0.0004 | * | 0.0002 | 0.0034 | *** | 0.0009 | 0.0002 | 0.0006 | − 0.0031 | * | 0.0021 | |
| Public housing units | − 0.0004 | 0.0003 | − 0.0037 | ** | 0.0016 | − 0.0006 | 0.0008 | 0.0128 | *** | 0.0035 | ||
| Housing Choice Vouchers | 0.0004 | 0.0004 | − 0.0031 | * | 0.0019 | 0.0005 | 0.0011 | 0.0005 | 0.0040 | |||
| Newly constructed units | 0.0063 | *** | 0.0015 | − 0.0062 | 0.0084 | 0.0076 | * | 0.0041 | − 0.0210 | 0.0189 | ||
| Foreclosure rate (2014–15) | − 0.0205 | * | 0.0122 | − 0.0724 | 0.0619 | 0.0600 | * | 0.0339 | 0.0436 | 0.1339 | ||
| No. observations | 823 | 806 | ||||||||||
| SAR error term | 0.89 | *** | 0.06 | 0.48 | *** | 0.09 | ||||||
| Pseudo R2 | 0.45 | 0.27 | ||||||||||
Note. LIHTC = Low-Income Housing Tax Credit; SAR = spatial autoregressive; SE = standard error.
p < .1
p < .05
p < .01.
Table A3.
List of Los Angeles, California, neighborhoods by region.
| Region | Neighborhood | |||
|---|---|---|---|---|
|
| ||||
| Central Los Angeles | Arlington Heights | Beverly Grove | Carthay | Chinatown |
| Downtown | East Hollywood | Echo Park | Elysian Park | |
| Elysian Valley | Fairfax | Hancock Park | Harvard Heights | |
| Hollywood Hills | Hollywood Hills West | Hollywood | Koreatown | |
| Larchmont | Los Feliz | Mid-City | Mid-Wilshire | |
| Pico-Union | Silver Lake | Westlake | Windsor Square | |
| Eastside | Boyle Heights | El Sereno | Lincoln Heights | |
| Harbor | Harbor City | Harbor Gateway | San Pedro | Wilmington |
| Northeast Los Angeles | Atwater Village | Cypress Park | Eagle Rock | Glassell Park |
| Highland Park | Montecito Heights | Mount Washington | ||
| San Fernando Valley | Arleta | Canoga Park | Chatsworth | Chatsworth Reservoir |
| Encino | Granada Hills | Hansen Dam | Lake Balboa | |
| Lake View Terrace | Mission Hills | North Hills | North Hollywood | |
| Northridge | Pacoima | Panorama City | Porter Ranch | |
| Reseda | Sepulveda Basin | Shadow Hills | Sherman Oaks | |
| Studio City | Sun Valley | Sylmar | Tarzana | |
| Toluca Lake | Valley Glen | Valley Village | Van Nuys | |
| West Hills | Winnetka | Woodland Hills | ||
| South Bay | Playa del Rey | Westchester | ||
| South Los Angeles | Adams-Normandie | Baldwin Hills/Crenshaw | Broadway-Manchester | Central-Alameda |
| Chesterfield Square | Exposition Park | Florence | Gramercy Park | |
| Green Meadows | Harvard Park | Historic South-Central | Hyde Park | |
| Jefferson Park | Leimert Park | Manchester Square | South Park | |
| University Park | Vermont Knolls | Vermont-Slauson | Vermont Square | |
| Vermont Vista | Watts | West Adams | ||
| Verdugos | Sunland | Tujunga | ||
| Westside | Bel-Air | Beverly Crest | Beverlywood | Brentwood |
| Century City | Cheviot Hills | Del Rey | Mar Vista | |
| Pacific Palisades | Palms | Pico-Robertson | Playa Vista | |
| Rancho Park Westwood | Sawtelle | Venice | West Los Angeles | |
Figure A1.

Percentage of case filings covered in AIRS data, by courthouse, 2011–2015.
Note. AIRS = American Information Research Services; The horizontal dashed line represents the overall average percentage of cases covered in the AIRS data for the 2011–2015 period (56%). The percentage filings covered in AIRS were calculated by dividing the number of cases appearing in the AIRS data for that courthouse by the total number of cases filed in that courthouse according to the Los Angeles Superior Court (LASC) system. LASC does not distinguish filings on properties within the City of Los Angeles from all filings within the larger Los Angeles County. For this reason, the coverage estimates presented here include all cases filed within these courts, regardless of the location of the property within Los Angeles County. To best represent data coverage within only the City of Los Angeles, we only include courthouses in this figure if they meet at least one of two criteria: (1) at least 5% of cases appearing in the courthouse represented properties located in the City of Los Angeles; (2) the courthouse represented at least 5% of total cases in the City of Los Angeles. The Stanley Mosk and Santa Monica courthouses met these criteria in all 5 years in the 2011–2015 period. The introduction of centralized filings of UD cases in Los Angeles County mid-2013 shifted inclusion of the other courthouses over time. Beverly Hills, Chatsworth, Inglewood, San Pedro, Torrance, and Van Nuys only accepted UD filings before the centralization and therefore only represent case coverage in 2011–2013. Alternatively, Pasadena and Long Beach only met the courthouse inclusion criteria in the 2013–2015 period, after cases were shifted there during the centralization process. Case coverage tended to improve over time across courthouses, which may help explain why courts that were active in the more recent years (Stanley Mosk, Long Beach, Pasadena, and Santa Monica) have higher average coverage than the courthouses active in earlier years. Although Beverly Hills, Chatsworth, and San Pedro have average coverage rates of less than 40%, these courthouses were never responsible for more than 15%, combined, of Los Angeles City cases in any year, suggesting that they are responsible for a relatively small portion of total cases.
Figure A2.
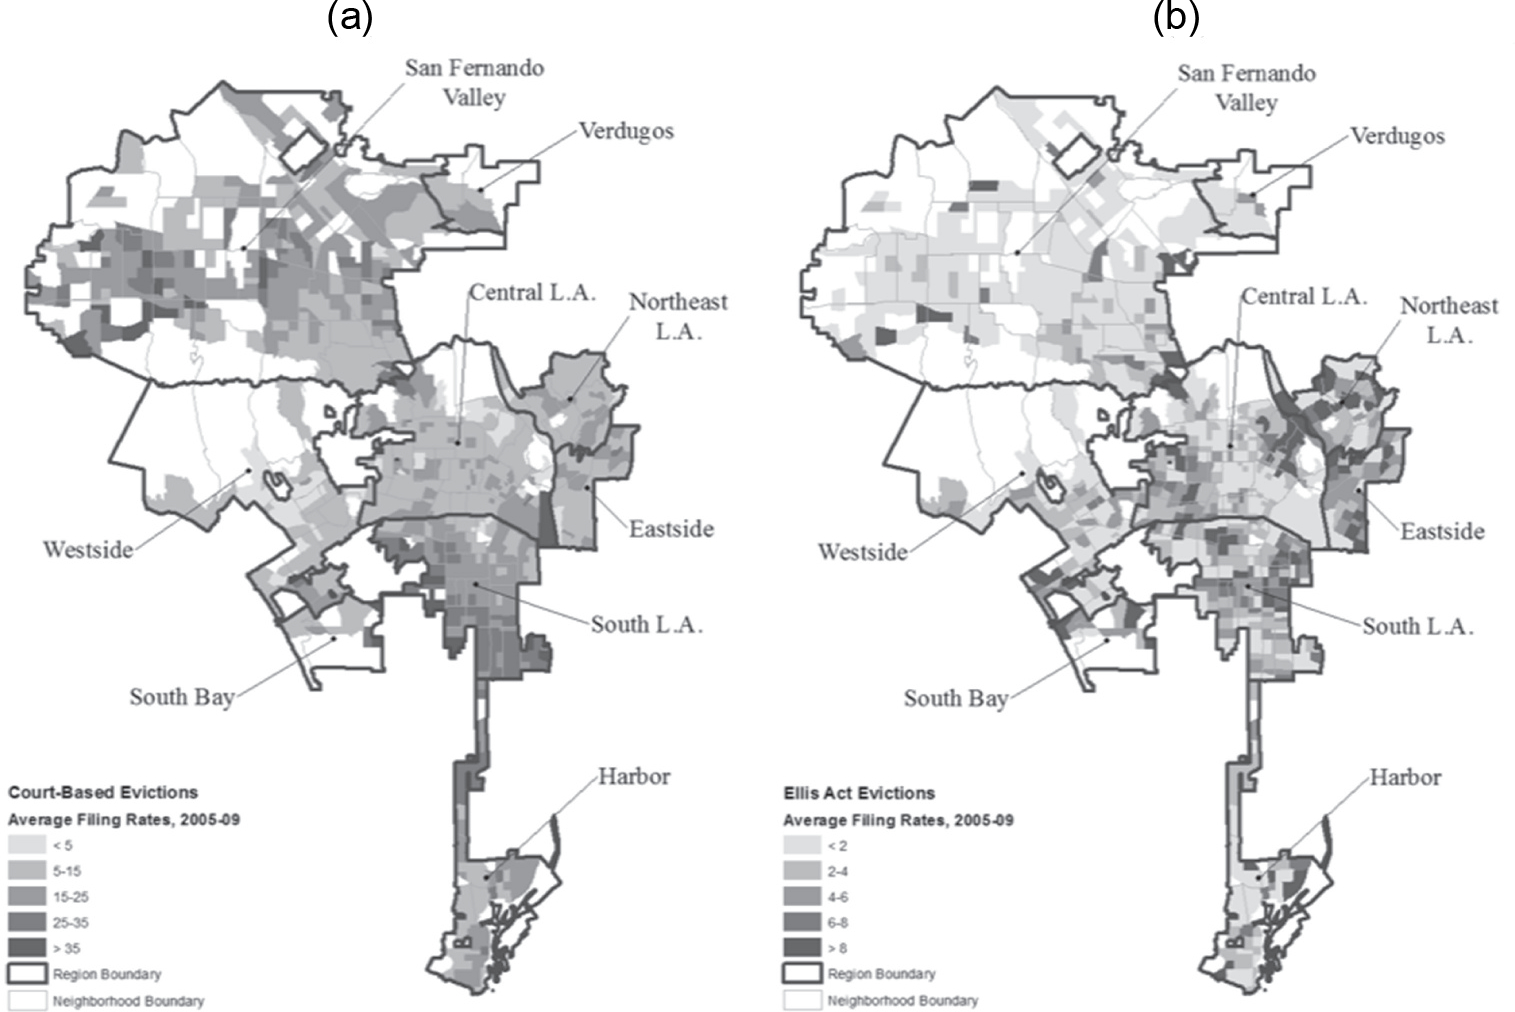
Map of court-based eviction filing (a) and Ellis Act petition (b) rates, by neighborhood, Los Angeles, California, 2005–09.
Figure A3.

Map of changes in court-based eviction filing (a) and Ellis Act petition (b) rates, by neighborhood, Los Angeles, California, between 2005–09 and 2011–15.
Footnotes
Disclosure Statement
No potential conflict of interest was reported by the authors.
Codes Cited
California Code of Civil Procedure Section 1161.2
Los Angeles Municipal Code Section 151.28
References
- Abood M (2018). Wall Street Landlords Turn American Dream into American Nightmare. ACCE Institute, Americans For Financial Reform, and Public Advocates. Retrieved from https://d3n8a8pro7vhmx.cloudfront.net/acceinstitute/pages/100/attachments/original/1516388955/WallstreetLandlordsFinalReport.pdf?1516388955 [Google Scholar]
- Adams C (2019). How no-fault evictions are contributing to LA’s homeless crisis. CBS News. Retrieved from https://www.cbsnews.com/news/no-fault-evictions-priced-out-los-angeles-hidden-homeless-cbsn-originals/ [Google Scholar]
- Anenberg E, & Kung E (2020). Can more housing supply solve the affordability crisis? Evidence from a neighborhood choice model. Regional Science and Urban Economics, 80(1), 1–12. [Google Scholar]
- Anselin L (1988). Spatial econometrics: Methods and models. New York: Springer. [Google Scholar]
- Asquith BJ, Mast E, & Reed D (2020). Supply shock versus demand shock. Policy Brief. Kalamazoo, MI: W.E. Upjohn Institute for Employment Research. doi: 10.17848/pb2020-19 [DOI] [Google Scholar]
- Barragan B (2020, June 22). 1,659 rent-controlled apartments under threat in 2019. Curbed Los Angeles. Retrieved from https://la.curbed.com/2020/2/4/21122683/ellis-act-rent-control-evictions-los-angeles [Google Scholar]
- Baum-Snow N, & Marion J (2009). The effects of low income housing tax credit developments on neighborhoods. Journal of Public Economics, 93(5–6), 654–666. [DOI] [PMC free article] [PubMed] [Google Scholar]
- Been V, & Glashausser A (2009). Tenants: Innocent victims of the foreclosure crisis. Albany Government Law Review, 2 (1), 1–28. [Google Scholar]
- Berk R, & MacDonald JM (2008). Overdispersion and poisson regression. Journal of Quantitative Criminology, 24(3), 269–284. [Google Scholar]
- Bezdek B (1992). Silence in the Court: Participation and subordination of poor tenants’ voices in legal process. Hofstra Law Review, 20(3), 553–608. [Google Scholar]
- Bivand RS, Pebesma E, & Gómez-Rubio V (2013). Applied spatial data analysis with R. New York: Springer-Verlag New York. [Google Scholar]
- Blasi G (2020, June 22). UD day: Impending evictions and homelessness in Los Angeles. Retrieved from https://challengeinequality.luskin.ucla.edu/2020/05/28/ud-day-report/ [Google Scholar]
- Brown-Saracino J (Ed.). (2010). The gentrification debates. New York: Routledge. [Google Scholar]
- Brown-Saracino J (2017). Explicating divided approaches to gentrification and growing income inequality. Annual Review of Sociology, 43, 515–539. [Google Scholar]
- Charles CZ (2006). Won’t you be my neighbor?: Race, class, and residence in Los Angeles. New York: The Russell Sage Foundation. [Google Scholar]
- Collinson R, & Reed D (2018). The effects of evictions on low-income households. Working Paper. [Google Scholar]
- Desmond M (2012a). Disposable ties and the urban poor. American Journal of Sociology, 117(5), 1295–1335. [Google Scholar]
- Desmond M (2012b). Eviction and the reproduction of urban poverty. American Journal of Sociology, 118(1), 88–133. [Google Scholar]
- Desmond M (2015). Unaffordable America: Poverty, housing, and eviction. Fast Focus: Institute for Research on Poverty, 22, 1–6. [Google Scholar]
- Desmond M (2016). Evicted: Poverty and profit in the American City. New York: Crown Books. [Google Scholar]
- Desmond M, & An W (2015). Neighborhood and network disadvantage among urban renters. Sociological Science, 2, 329–349. [Google Scholar]
- Desmond M, An W, Winkler R, & Ferriss T (2013). Evicting children. Social Forces, 92(1), 303–327. [Google Scholar]
- Desmond M, & Gershenson C (2016). Housing and employment insecurity among the working poor. Social Problems, 63(1), 46–67. [Google Scholar]
- Desmond M, & Gershenson C (2017). Who gets evicted? Assessing individual, neighborhood, and network factors. Social Science Research, 62, 362–377. [DOI] [PubMed] [Google Scholar]
- Desmond M, Gromis A, Edmonds L, Hendrickson J, Krywokulski K, Leung L, & Porton A (2018). Eviction lab methodology report: Version 1.0. Princeton: Princeton University. www.evictionlab.org/methods. [Google Scholar]
- Desmond M, & Kimbro RT (2015). Eviction’s fallout: Housing, hardship, and health. Social Forces, 94(1), 295–324. [Google Scholar]
- Desmond M, & Perkins KL (2016). Housing and household instability. Urban Affairs Review, 52(3), 421–436. [Google Scholar]
- Desmond M, & Shollenberger T (2015). Forced displacement from rental housing: Prevalence and neighborhood consequences. Demography, 52(5), 1751–1772. [DOI] [PubMed] [Google Scholar]
- Diamond R, & McQuade T (2019). Who wants affordable housing in their backyard? An equilibrium analysis of low-income property development. Journal of Political Economy, 127(3), 1063–1117. [Google Scholar]
- Dragan K, Ellen I, & Glied SA (2019). Does gentrification displace poor children? New evidence from New York City Medicaid Data. National Bureau of Economic Research Working Paper Series. Retrieved from https://www.nber.org/papers/w25809 [Google Scholar]
- Roundtable Economic. (2009). Economic study of the rent stabilization ordinance and the Los Angeles Housing Market. Retrieved from https://economicrt.org/publication/economic-study-of-the-rent-stabilization-ordinance-rso-and-the-los-angeles-housing-market/ [Google Scholar]
- Ellen IG, & O’Regan KM (2011). How low income neighborhoods change: Entry, exit, and enhancement. Regional Science and Urban Economics, 41(2), 89–97. [Google Scholar]
- Freeman L, & Braconi F (2004). Gentrification and displacement in New York City in the 1990s. Journal of the American Planning Association, 70(1), 39–52. [Google Scholar]
- Freemark Y (2019). Upzoning Chicago: Impacts of a zoning reform on property values and housing construction. Urban Affairs Review. doi: 10.1177/1078087418824672 [DOI] [Google Scholar]
- Garboden PME, & Rosen E (2019). Serial filing: How landlords use the threat of eviction. City & Community, 18(2), 638–661. [Google Scholar]
- Gerchick RG (1994). No easy way out: Making the summary eviction process a fairer and more efficient alternative to landlord self-help. UCLA Law Review, 41, 759–859. [Google Scholar]
- Goldin C, & Katz LF (2010). The race between education and technology. Cambridge, MA: Harvard University Press. [Google Scholar]
- Gross L (2015). L.A.’s eviction game. Los Angeles Times. Retrieved from https://www.latimes.com/opinion/op-ed/la-oe-0609-gross-housing-ellis-act-20150609-story.html [Google Scholar]
- Hartman C, & Robinson D (2003). Evictions: The hidden housing problem. Housing Policy Debate, 14(4), 461–501. [Google Scholar]
- Hilber CAL, & Vermeulen W (2016). The impact of supply constraints on house prices in England. The Economic Journal, 126(591), 358–405. [Google Scholar]
- Humphries JE, Mader NS, Tannenbaum DI, & van Dijk WL (2019). Does eviction cause poverty? Quasi-experimental evidence from Cook County, IL. NBER Working Paper No. 26139. [Google Scholar]
- Immergluck D, Ernsthausen J, Earl S, & Powell A (2019). Evictions, large owners, and serial filings: Findings from Atlanta. Housing Studies. doi: 10.1080/02673037.2019.1639635 [DOI] [Google Scholar]
- Joint Center for Housing Studies, Harvard University. (2020, March 9). America’s rental housing 2020. Retrieved from https://www.jchs.harvard.edu/sites/default/files/Harvard_JCHS_Americas_Rental_Housing_2020.pdf [Google Scholar]
- Kelejian HH, & Prucha I (2010). Specification and estimation of spatial autoregressive models with autoregressive and heteroskedastic disturbances. Journal of Econometrics, 157(1), 53–67. [DOI] [PMC free article] [PubMed] [Google Scholar]
- Kelejian HH, & Prucha IR (1998). A generalized spatial two-stage least squares procedure for estimating a spatial autoregressive model with autoregressive disturbances. The Journal of Real Estate Finance and Economics, 17, 99–121. [Google Scholar]
- Keyser Marston Associates. (2017). The Ellis Act and its effects on rent-stabilized housing in Santa Monica: A study of factors leading to withdrawal and possible mitigation strategies. Retrieved from https://www.google.com/url?sa=t&rct=j&q=&esrc=s&source=web&cd=&ved=2ahUKEwjX5JmaxpbqAhXfoHIEHd11AcUQFjAAegQIBRAB&url=https%3A%2F%2Fwww.smgov.net%2FuploadedFiles%2FDepartments%2FRent_Control%2FAbout_the_Rent_Control_Board%2FStaff_Reports%2F2017%2FItem%252012A%2520Ellis%2520Act%2520Report.pdf&usg=AOvVaw2sd6kCCHx34wH921mM9But [Google Scholar]
- Kleysteuber R (2006). Tenant screening thirty years later: A statutory proposal to protect public records. The Yale Law Journal, 116, 1344–1388. [Google Scholar]
- Kurwa R (2015). Deconcentration without integration: Examining the social outcomes of Housing Choice Voucher Movement in Los Angeles County. City & Community, 14(4), 364–391. [Google Scholar]
- Lelyveld N (2015). New set calls for another cast; The longtime tenants of Hollywood’s classic Villa Carlotta must move out so the building can be turned into a luxury hotel. Los Angeles Times. Retrieved from https://search.proquest.com/docview/1649040736?accountid=14512 [Google Scholar]
- Lempert R, & Monsma K (1994). Cultural differences and discrimination: Samoans before a public housing eviction board. American Sociological Review, 59(6), 890–910. [Google Scholar]
- Lens MC, Nelson K, Gromis A, & Kuai Y (2020). Neighborhood correlates of eviction in Southern California. City & Community. doi: 10.1111/cico.12487 [DOI] [Google Scholar]
- Leung L, Hepburn P, & Desmond M (2020). Serial eviction filing: Civil courts, property management, and the threat of displacement. Social Forces. doi: 10.1093/sf/soaa089 [DOI] [Google Scholar]
- Logan JR, & Molotch HL (1987). Urban fortunes: The political economy of place. Berkeley, CA: University of California Press. [Google Scholar]
- Los Angeles Homeless Services Authority. (2018). Report and recommendations of the Ad hoc Committee on Black people experiencing homelessness. Retrieved from https://www.lahsa.org/documents?id=2823-report-and-recommendations-of-the-ad-hoc-committee-on-black-people-experiencing-homelessness
- Los Angeles Homeless Services Authority. (2019). Greater Los Angeles homeless county: 2019 results. Retrieved from https://www.lahsa.org/documents?id=3437-2019-greater-los-angeles-homeless-count-presentation.pdf [Google Scholar]
- Lundberg I, & Donnelly L (2019). A research note on the prevalence of housing eviction among children born in U.S. cities. Demography, 56(1), 391–404. [DOI] [PMC free article] [PubMed] [Google Scholar]
- Lundberg I, Gold SL, Donnelly L, Brooks-Gunn J, & McLanahan SS (2020). Government assistance protects low-income families from eviction. Journal of Policy Analysis and Management. doi: 10.1002/pam.22234 [DOI] [PMC free article] [PubMed] [Google Scholar]
- Mast E (2019). The effect of new market-rate housing construction on the low-income housing market. Working Paper. [Google Scholar]
- Medina RM, Byrne K, Brewer S, & Nicolosi EA (2020). Housing inequalities: Eviction patterns in Salt Lake County, Utah. Cities, 104(9), 102804. [Google Scholar]
- Monsma K, & Lempert R (1992). The value of counsel: 20 years of representation before a public housing eviction board. Law and Society Review, 26(3), 627–668. [Google Scholar]
- Raymond E, Duckworth R, Miller B, Lucas M, & Pokharel S (2018). From foreclosure to eviction: Housing insecurity in corporate-owned single family rentals. Cityscape, 2(3), 159–188. [Google Scholar]
- Reyes EA (2016). Landlord wins hotel fight. Los Angeles Times. Retrieved from https://search.proquest.com/docview/1800413913?accountid=14512 [Google Scholar]
- Reyes EA (2020, June 22). L.A. could thwart Westside evictions under plan approved at City Hall. Los Angeles Times. Retrieved from https://www.latimes.com/california/story/2020-01-28/ellis-act-evictions-los-angeles-westside [Google Scholar]
- Rosen E (2014). Rigging the rules of the game: How landlords geographically sort low-income renters. City & Community, 13(4), 310–340. [Google Scholar]
- Rosen E (2020). The voucher promise: “Section 8” and the fate of an American neighborhood. Princeton, NJ: Princeton University Press. [Google Scholar]
- Saiz A (2010). The geographic determinants of housing supply. The Quarterly Journal of Economics, 125(3), 1253–1296. [Google Scholar]
- Schill MH, Ellen IG, Schwartz AE, & Voicu I (2002). Revitalizing inner-city neighborhoods: New York City’s Ten-Year Plan. Housing Policy Debate, 13(3), 529–566. [Google Scholar]
- Shelton T (2018). Mapping dispossession: Eviction, foreclosure and the multiple geographies of housing instability in Lexington, Kentucky. Geoforum, 97(1), 281–291. [Google Scholar]
- Sims JR (2016). More than gentrification: Geographies of capitalist displacement in Los Angeles 1994–1999. Urban Geography, 37(1), 26–56. [Google Scholar]
- Sullivan E (2017). Moving out: Mapping mobile home park closures to analyze spatial patterns of low-income residential displacement. City and Community, 16(3), 304–329. [Google Scholar]
- The Los Angeles Housing and Community Investment Department. (2019). Council transmittal: The Los Angeles Housing + Community Investment Department’s report back regarding recommendations for a City of Los Angeles eviction defense program. Retrieved from https://www.google.com/url?sa=t&rct=j&q=&esrc=s&source=web&cd=&ved=2ahUKEwiqupWP2ZbqAhWYlXIEHRHsAm0QFjAAegQIBRAB&url=http%3A%2F%2Fclkrep.lacity.org%2Fonlinedocs%2F2018%2F18-0610_rpt_MAYOR_11-01-2019.pdf&usg=AOvVaw2_XzWCsMasSmfFG-Sct9uW
- U.S. Census Bureau. (2010). 2009 American Community Survey 1-year estimates. Retrieved from https://data.census.gov/cedsci/
- U.S. Census Bureau. (2019). 2018 American Community Survey 1-year estimates. Retrieved from https://data.census.gov/cedsci/
- Weinstein L (2020). Evictions: Reconceptualizing housing insecurity from the global south. City & Community. doi: 10.1111/cico.12503 [DOI] [Google Scholar]
- Zuk M, & Chapple K (2016). Research brief: Housing production, filtering and displacement: Untangling the relationships. Institute of Governmental Studies, University of California, Berkeley. Retrieved from https://escholarship.org/content/qt7bx938fx/qt7bx938fx.pdf [Google Scholar]