

Abstract
The mechanisms for the regulation of homeotic genes are poorly understood in most organisms, including plants. We identified BASIC PENTACYSTEINE1 (BPC1) as a regulator of the homeotic Arabidopsis thaliana gene SEEDSTICK (STK), which controls ovule identity, and characterized its mechanism of action. A combination of tethered particle motion analysis and electromobility shift assays revealed that BPC1 is able to induce conformational changes by cooperative binding to purine-rich elements present in the STK regulatory sequence. Analysis of STK expression in the bpc1 mutant showed that STK is upregulated. Our results give insight into the regulation of gene expression in plants and provide the basis for further studies to understand the mechanisms that control ovule identity in Arabidopsis.
INTRODUCTION
In multicellular organisms, organ identity is controlled by homeotic genes. In plants, most of these genes belong to the MADS box gene family. In Arabidopsis thaliana, the MADS box gene family consists of 107 members, which can be divided over five subfamilies, namely MIKC, Mα, Mβ, Mγ, and Mδ (Parenicova et al., 2003). The plant MADS box genes that have shown to control organ identity at different stages of development all belong to the MIKC subfamily (Parenicova et al., 2003).
Although it is known that floral organ identity and development are controlled through temporal and spatial activation and silencing of those types of transcription factors, little is known about their regulatory mechanisms. It has been shown that the expression of the MADS box genes AGAMOUS (AG), FLOWERING LOCUS C (FLC), and PLENA (PLE) are regulated by intragenic regions (Bradley et al., 1993; Sieburth and Meyerowitz, 1997; Deyholos and Sieburth, 2000; Sheldon et al., 2002). In particular, it has been shown that BELLRINGER (BLR) and LEAFY (LFY) bind to the second intron of AG. BLR prevents ectopic AG expression in the outer two whorls of a flower as well as in the reproductive shoot apical meristem (Bao et al., 2004), and LFY activates the expression of AG (Busch et al., 1999).
Genetic and biochemical studies in organisms such as human, Saccharomyces cerevisiae, and Drosophila melanogaster have revealed that changes in expression patterns of several homeotic genes require remodeling of chromatin (Orphanides et al., 1999; Shimojima et al., 2003; Mellor and Morillon, 2004). In Drosophila, homeotic genes like Ultrabithorax and Engrailed have shown to be regulated by GAGA binding proteins (GBPs), which bind GA-rich elements (Biggin and Tjian, 1988; Soeller et al., 1993). These GBPs interact with chromatin remodeling complexes like NURF and FACT and alter gene expression through these chromatin remodeling complexes (Lehmann, 2004).
In several plants species, genes have been identified that encode a class of proteins that also bind to GA-rich elements, like GBP in soybean (Glycine max) (Sangwan and O'Brian, 2002), BARLEY B RECOMBINANT in barley (Hordeum vulgare) (Santi et al., 2003), and the BASIC PENTACYSTEIN (BPC) gene family in Arabidopsis, which includes seven members (BPC1 to BPC7; Meister et al., 2004). The widespread expression patterns of those factors and the large number of potential target sequences present in plant genomes suggest that those proteins may affect expression of a variety of genes involved in different plant processes.
Recently, MADS box genes that control ovule identity have been identified, which are SEPALLATA1 (SEP1), SEP2, SEP3, AG, SHATTERPROOF1 (SHP1), SHP2, and SEEDSTICK (STK) (Favaro et al., 2003; Pinyopich et al., 2003). Besides the control of ovule development, these genes have other functions, like floral organ development in general (SEP1/2/3) (Pelaz et al., 2000), carpel and stamen development (AG) (Bowman et al., 1989), fruit dehiscence (SHP1/2) (Liljegren et al., 2000), and development of the dehiscence zone at the funiculus (STK) (Pinyopich et al., 2003). Of these genes, only STK is expressed specifically in the septum and ovules (Rounsley et al., 1995; Pinyopich et al., 2003).
Here, we report the analysis of the regulatory region of the homeotic MADS box gene STK. We show that its ovule- and septum-specific expression is controlled by regions comprising the first intron that is located in the 5′ untranslated region (UTR). Furthermore, we show that BPC1 binds these regions at multiple purine-rich sites, and using tethered particle motion (TPM) technology (Finzi and Dunlap, 2003), we demonstrate that these multiple sites are used to induce conformational changes in the STK regulatory regions. By analyzing the expression of STK in a bpc1 mutant, we revealed that STK expression is upregulated in this mutant.
RESULTS
Analysis of the STK Regulatory Region
To identify the regions that contain the regulatory elements that control the ovule- and septum-specific expression of STK, a 2.8-kb sequence upstream of the ATG was cloned and fused to the β-glucoronidase (GUS) reporter gene. This fragment contains a region of 1.4 kb 5′ of the transcription start site and a region of 1.4 kb containing the 5′UTR and the first intron of 1.3 kb. Analysis of 20 transgenic plants transformed with this construct showed that the 2.8-kb fragment contains all the information to give specific expression in ovules and septum (Figure 1A). To test whether the 1.3-kb intron contains regulatory elements necessary for specific STK expression, we transformed Arabidopsis plants with a construct in which the intron was deleted. These transgenic plants showed GUS expression in all floral organs (Figure 1B), demonstrating the importance of the first intron for ovule- and septum-specific STK expression.
Figure 1.

GUS Expression in Arabidopsis Flowers.
(A) Flower from a plant containing the promoter of STK fused to the GUS coding sequence, showing ovule- and septum-specific GUS expression.
(B) Aspecific GUS expression throughout the entire flower from a plant containing only the 5′-flanking region without intron region in the 5′UTR of STK fused to the GUS coding sequence.
BPC1 Interacts with the Regulatory Regions of STK
To identify factors that interact with the promoter region of STK, a yeast one-hybrid screening was performed. We divided the STK regulatory region in six parts of ∼450 bp and fused these to the His and LacZ reporter genes. These constructs were integrated in the genomes of the yeast strains Y187 (His construct) and YM4271 (LacZ construct). The Y187 strain was mated with yeast strain AH109 containing a whole plant cDNA library. The plasmids extracted from the colonies that were able to grow on medium lacking His were transformed to the YM4271 strain to test the activation of the LacZ reporter gene. This experiment resulted in the identification of BPC1 (Sangwan and O'Brian, 2002), which interacted with two fragments that comprise sequences 5′ of the transcription start site, a part of the 5′ UTR and a part of the leader intron (Figure 2A, fragments a and b). The identified BPC1 cDNA clones encoded three BPC1 variants with different truncations at the N-terminal part of the protein, resulting in proteins of 145, 120, and 111 amino acids, respectively. These results indicate that the C-terminal part of the protein is sufficient for DNA binding, similar to what was previously reported for BPC2 (Meister et al., 2004).
Figure 2.

Schematic Representation of the STK Promoter.
(A) Promoter/intron region with the two regions (a and b) that were binding BPC1 in the yeast one-hybrid screen. ATG, start codon.
(B) Sequence of the region of the STK promoter that contains 12 GA-rich regions (shaded, numbered 1 to 12). The underlined sequences are the oligonucleotide sequences used in the EMSA experiments. The location of the exon is displayed in bold.
BPC1 and similar proteins of Arabidopsis, soybean, and barley have shown to bind DNA at sites that contain GA repeats (Sangwan and O'Brian, 2002; Santi et al., 2003; Meister et al., 2004). Analysis of the STK promoter sequences, to which BPC1 binds, revealed 12 regions containing at least eight nucleotides with only purines (shaded regions in Figure 2B). To test whether full-length BPC1 is able to bind to these putative binding elements, electromobility shift assays (EMSAs) were performed.
We designed double-stranded oligonucleotides of ∼30 bp, containing the putative binding sites (Figure 2B), and labeled element 4 radioactively. As shown in Figure 3A, when we added 10 ng of BPC1 protein, two shifted bands were produced. To test the specificity for element 4, unlabeled double stranded element 4 was added to compete with the labeled probe. As can be seen in Figure 3A, a 100-fold molar excess was sufficient to out compete the labeled oligonucleotide almost completely. The affinity for the other putative elements was tested by competition EMSA assays using labeled element 4. Elements 1, 7, 9, 8, 10, and 12 were able to compete with element 4 (increasing affinity), whereas elements 2, 3, 5, 6, and 11 were not (Figure 3B; data not shown).
Figure 3.

Analysis of BPC1 Binding to GA Elements.
EMSA competition assays using labeled element 4 as a probe. The molar excess of the competitor is indicated above the figures.
(A) Unlabeled element 4 is used as a competitor (lane 1 is free probe). A 100-fold excess of unlabeled element 4 out competes the labeled probe completely. Lane 7 is a control using the unrelated maltose binding protein, no band shift is observed.
(B) Competition assays using unlabeled element 4 (lanes 2 to 4), element 2 (lanes 5 to 7), element 9 (lanes 8 to 10), and element 12 (lanes 11 to 13) as a competitor, showing that elements 4, 12, and 9 are bound by BPC1, whereas element 2 is not.
(C) Competition assay using mutated element 12 (nucleotide 7, A to T) as a competitor. The affinity of BPC1 for the mutated element is completely lost because of this mutation
(D) Alignment of the different elements that were able to bind BPC1 and were not able to bind BPC1, leading to the shown consensus.
(E) Point mutations compared with the consensus, which lead to the decrease in binding capacity of BPC1. *, sequence as present in element 2 in Figure 3D; **, sequence as present in element 6 in Figure 3D.
Until now, BPC proteins have shown to bind GA repeats of 12 nucleotides long (GA)6 (Meister et al., 2004). Our experiments suggest that BPC1 also binds to sequence motifs other than a repetition of multiple GA repeats because BPC1 is able to bind elements 4, 7, and 8, which contain only a double GA repeat (Figure 3D). Furthermore, element 1 can interact with BPC1 even if it does not contain any direct GA repeat. From an alignment of BPC1 binding sites in the STK promoter, a consensus binding sequence could be predicted, consisting of nine purines: RGARAGRRA (Figure 3D). The affinity of BPC1 for the consensus was greatly reduced when one of the purines was replaced by a pyrimidine, like shown for nucleotide 7 in Figure 3C. In the case of nucleotide 6 of the consensus, even a change of G to A is sufficient to abolish the affinity because BPC1 was not able to bind to element 2 (Figure 3E).
BPC1 Induces Conformational Changes in the STK Regulatory Region
The presence of multiple binding sites for BPC1 in the STK regulatory region indicates that this protein might form a complex inducing architectural changes in the DNA.
To test this, we used a single-molecule optical microscopy technique called TPM analysis (Finzi and Dunlap, 2003). TPM allows direct observation of protein-induced significant DNA conformational changes, such as bending or looping. This is possible by observing the Brownian motion of a bead tethered to a microscope flow-chamber by a single DNA molecule. The range of the Brownian motion will change as a consequence of any alteration in the DNA end-to-end distance, such as those observed as a consequence of protein-induced architectural changes. We analyzed a STK promoter fragment of 1413 bp in which all the seven boxes that bind BPC1 are present. TPM analysis showed dynamic transitions between different DNA conformational states (Figure 4A). The experimental traces present step-like changes in the end-to-end distance of the DNA molecules. This indicates that BPC1 can induce loops of variable size in the DNA, which are in a dynamic equilibrium. A particularly stable one shortens the DNA end-to-end distance by ∼50 to 60 nm. Because BPC1-mediated interaction between boxes 4 and 12 would decrease the DNA end-to-end distance by the same amount and these boxes are those that show strong binding of BPC1, as revealed by EMSA assays, we suggest that this is the dominant interaction. To determine whether box 4 and box 12 are enough to establish the observed conformational change, we constructed a fragment in which only these two boxes are present at the same distance. The two fragments were analyzed simultaneously in the same TPM measurement by visually distinguished labeling of both fragments with beads of different sizes. This experiment showed that upon addition of BPC1, the fragment that contains only boxes 4 and 12 does not show any decrease in DNA end-to-end distance (Figure 4B), whereas for the control fragment, a shortening of ∼50 to 60 nm was observed. This result clearly indicates that cooperative binding to multiple BPC1 binding sites is necessary for the induction of conformational changes in the STK regulatory region. To show that the observed end-to-end reduction is specific to BPC1 and not caused by the presence of an unrelated protein, we also performed TPM assays with the maltose binding protein (MBP). As shown in Figure 4C, no end-to-end distance reduction was observed.
Figure 4.

TPM Analysis of BPC1 Interaction with the STK Promoter.
DNA end-to-end distance (E to E) measured in TPM experiments. The trace shows the variations in time of the DNA end-to-end distance before and after addition of the protein. The arrow indicates the time of addition of protein. The black line shows the average value of the DNA end-to-end distance before and after addition of protein.
(A) The DNA fragment used is 1413 bp long and contains BPC1 binding sites 1 through 12; the distance between box 12 and the digoxigenin label is 240 bp, whereas the distance between site 1 and the biotin label is 320 bp. The end-to-end distance after addition of BPC1 is reduced by ∼50 to 60 nm.
(B) DNA fragment used contains only boxes 4 and 12; the distance between boxes 4 and 12 is approximately like the distance in the other DNA fragment. The same holds for the distance between these boxes and the digoxigenin and biotin labels. The addition of BPC1 does not change the DNA end-to-end distance of the DNA.
(C) Control experiment using the unrelated MBP. The DNA fragment is the same as used in the experiment represented in Figure 4A. No alteration of the DNA end-to-end distance after the addition of the MBP was observed.
BPC1 in the Control of STK Expression
It has been shown by RT-PCR analysis that BPC1 is expressed throughout the Arabidopsis plant (Meister et al., 2004). To investigate the BPC1 expression in more detail during Arabidopsis flower development, we performed in situ hybridizations. This analysis revealed that BPC1 expression is visible in the floral meristem and floral organ primordia (Figure 5A). At later stages, BPC1 remains expressed in all floral organs and in particular in the ovule (Figures 5B and 5C).
Figure 5.

STK and BPC1 Expression Analysis in Wild-Type and bpc1 Mutant Arabidopsis Flowers by in Situ Hybridization.
(A) In situ hybridization on very young flowers showing BPC1 expression in the floral meristem and floral organ primordia.
(B) Expression of BPC1 in a flower showing expression in all floral organs and especially in ovules.
(C) Expression of BPC1 in ovules.
(D) In situ hybridization on a bpc1 mutant flower using the BPC1 probe, showing no expression.
(E) and (F) In situ hybridization on bpc1 mutant flowers showing STK-specific expression like in wild-type flowers.
s, septum; st, stamen; p, pistil; o, ovule. Bars in (A) and (C) = 20 μm; bars in (B) and (D) to (F) = 40 μm.
To investigate whether BPC1 regulates STK expression, we searched the Salk T-DNA collection (Alonso et al., 2003) for BPC1 insertion mutants. In this collection, we identified a line that has a T-DNA insertion in the first intron 293 bp upstream of the ATG. Homozygous mutant lines were identified by PCR and DNA gel blot analysis. Subsequent RNA gel blot analysis (data not shown) and in situ hybridization (Figure 5D) confirmed the absence of BPC1 expression in this mutant. Phenotypic analysis of homozygous bpc1 mutant plants during different stages of development revealed no alterations with respect to wild-type plants.
To analyze whether the absence of BPC1 affects STK expression, we performed real-time RT-PCR on RNA extracted from Arabidopsis flowers of wild-type and bpc1 mutant plants. This analysis showed that the STK expression in the bpc1 mutant is increased by approximately threefold with respect to the wild type (Figure 6). To understand whether there are also changes in the tissue specificity of STK expression, we performed in situ analysis on flowers of wild-type and bpc1 mutant plants using a STK-specific probe. This analysis showed that STK expression remained ovule and septum specific (Figures 5E and 5F) like what was shown for the STK expression in wild-type flowers (Figure 1A; Pinyopich et al., 2003).
Figure 6.
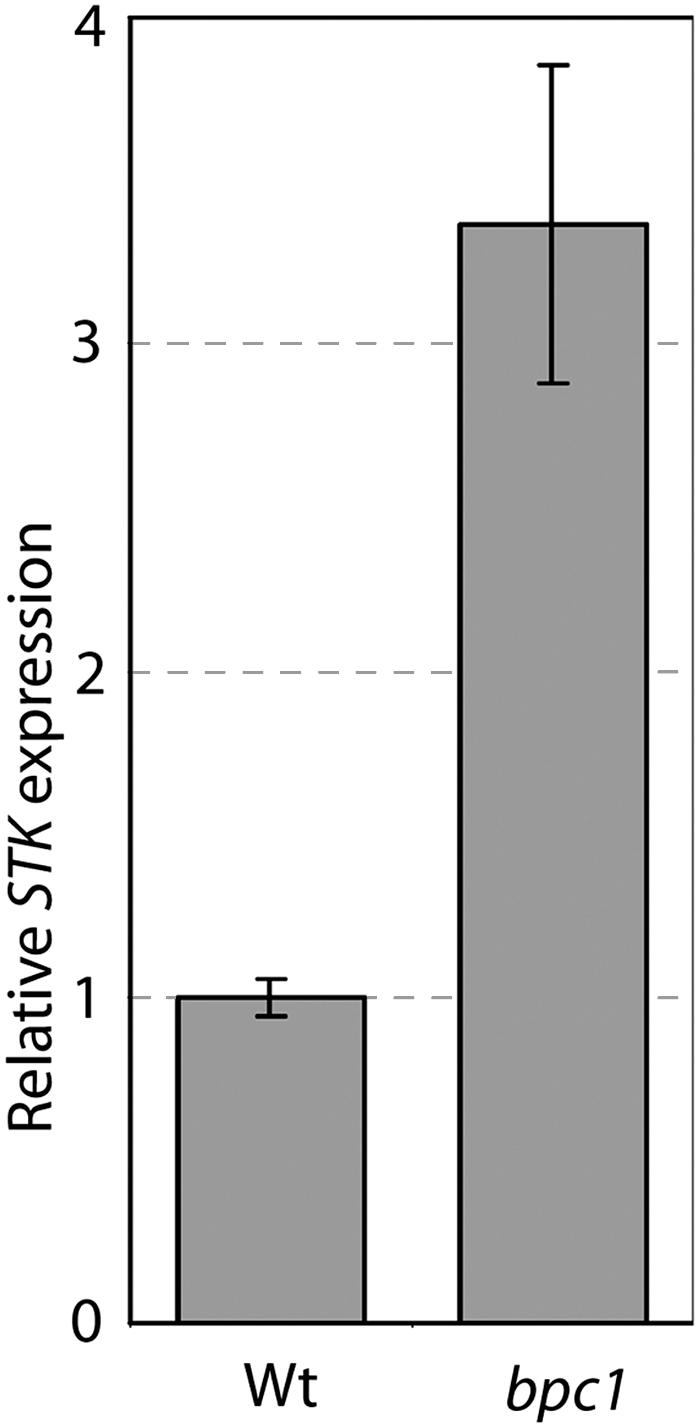
STK Expression Analysis in Wild-Type and bpc1 Mutant Arabidopsis Flowers by Real-Time RT-PCR.
Error bars represent standard deviations calculated on five different replicas. STK is approximately three times upregulated in the bpc1 mutant with respect to the wild type.
DISCUSSION
Homeotic genes control the identity of organs. In plants, the best studied homeotic genes control floral organ identity and belong to the MADS box gene family. Misexpression or defects in the timing of the expression of these genes causes homeotic transformations of floral organs and severe aberrations in flower development. Here, we report on the regulation of the ovule identity gene STK, a MADS box gene that is specifically expressed in ovules and septum.
The STK First Intron Contains Elements for Ovule-Specific Expression
To identify the region that regulates STK expression, we cloned a 2.8-kb fragment upstream of the ATG. This fragment contains the 5′UTR with a large intron and a 5′-region flanking the transcription start site. Using the GUS reporter gene, we showed that this fragment is enough to drive specific GUS expression in ovules and septum. Subsequent studies revealed that deletion of the first intron resulted in the loss of ovule-specific expression. Other MADS box genes, such as PLE, AG, and FLC, have also shown to be regulated by intron sequences (Bradley et al., 1993; Sieburth and Meyerowitz, 1997; Deyholos and Sieburth, 2000; Sheldon et al., 2002). The AG second intron has been shown to be sufficient to regulate AG-specific expression (Deyholos and Sieburth, 2000). Analysis of the AG intron combined with genetic experiments revealed that binding sites for AP2, LEUNIG, LFY, WUSHEL, and MADS box proteins are present (Drews et al., 1991; Busch et al., 1999; Hong et al., 2003). Analysis of the first STK intron sequence does not reveal a priori any transcription factor binding site.
BPC1 Binds to the STK Regulatory Region
Using the yeast one-hybrid system we identified BPC1, which binds the promoter region of STK. BPC factors have only been identified in plants and their name is due to the presence of an unusual arrangement of five Cys residues in the highly conserved C terminus. The Arabidopsis genome sequence contains seven BPC genes that can be subdivided into three classes, of which BPC1 groups together with BPC2 and BPC3 based on overall sequence homology (Meister et al., 2004).
Also, in barley, soybean, rice (Oryza sativa), potato (Solanum tuberosum), and tomato (Lycopersicon esculentum), BPC-like proteins that bind sequences rich in GA repeats have been identified based on experimental data (soybean and barley) and homology data (rice, potato, and tomato) (Sangwan and O'Brian, 2002; Santi et al., 2003; Meister et al., 2004). The experimental data published so far showed that these proteins in Arabidopsis, soybean, and barley bind to (GA)6, (GA)8, and (GA)9 repeats, respectively (Sangwan and O'Brian, 2002; Santi et al., 2003; Meister et al., 2004). In this study, we show that BPC1 is also able to bind to nondirect GA repeats, like GA-rich element 1. By aligning the sites in the STK promoter that bind and do not bind BPC1 and performing mutagenesis experiments, we could define a 9-bp DNA consensus sequence (RGARAGRRA) for BPC1 binding.
For BPC2 of Arabidopsis and the homolog from barley, it has been shown that the highly conserved C-terminal part of the protein, which contains a putative zinc-finger motif, is necessary for DNA binding (Santi et al., 2003; Meister et al., 2004). Our one-hybrid experiments confirmed these results because an N-terminal deletion reducing the protein to 111 amino acids was still able to bind the STK promoter. These 111 amino acids contain the conserved domain, including the putative zinc-finger. Further experiments will have to show if these proteins really function as zinc-finger proteins. An indication that BPC proteins contain a zinc-finger motif that might be involved in DNA binding comes from the observation that the GBPs of Drosophila (based on primary amino acid sequence, structurally unrelated to the plant BPC proteins) do contain a zinc-finger motif that has been shown by NMR studies to contact the DNA at GAGA repeats (Omichinski et al., 1997).
To investigate whether BPC1 is able to induce conformational changes in the STK regulatory region, we performed TPM analyses. This method allows the study of conformational changes at the level of single DNA molecules by measuring the Brownian motion of a micro sphere. In our study, we used two microspheres of different size, which allowed us to compare directly the behavior of two different DNA molecules before and after addition of BPC1 protein. With this method, we showed that BPC1 is able to induce conformational changes when all the GA-rich elements in the STK regulatory sequence are present. However, when only the two strong binding sites are available that seem to be involved in a major conformational change in the wild-type DNA construct, no conformational changes are observed (Figure 4B). We took this as evidence that cooperative binding to multiple BPC1 binding sites may be necessary to have a significant DNA reconfiguration by BPC1. This TPM analysis indicates that BPC1 induces conformational changes in the STK promoter by forming a multimeric complex that binds to multiple sites. This idea is strengthened by the observation that in the EMSA assays, two shifted bands are always observed that could be attributable to the formation of a higher-order complex.
The rice STK homolog OsMADS13 has an expression profile similar to that of STK (Lopez Dee et al., 1999). Analysis of sequences upstream the ATG (which also includes an intron) showed that this region contains only three GA-rich elements that correspond to the consensus binding site for BPC1. This might implicate that the regulation of these genes has not been conserved between these species or that the affinity of rice BPC1-like proteins for this consensus has slightly changed because six additional GA-rich elements are present in the regulatory region of OsMADS13 that, as a result of one mismatch, do not have affinity for BPC1.
BPC1 in the Control of STK Expression
BPC1 induces conformational changes in the STK promoter region. To understand which role BPC1 plays in STK regulation, we analyzed STK gene expression in the bpc1 T-DNA insertion mutant by real-time PCR. This analysis showed that STK is approximately three times upregulated in the bpc1 mutant, indicating that BPC1 functions as a repressor of STK. However, considering the expression data showing that BPC1 is expressed in all parts of the plant and especially in ovules, it seems not very obvious that BPC1 functions as an active repressor of STK. A more credible hypothesis might be that BPC1 induces conformational changes that allow the recruitment of a specific regulatory complex. BPC1 is probably redundant with BPC2 (and maybe also BPC3) in regulating STK and other genes (Meister et al., 2004). However, BPC1 and BPC2 are not completely identical, and the conformation of the STK promoter might be different when only BPC2 is recruited to the purine-rich boxes. They also might recruit different types of factors to the STK promoter. Therefore, it could well be that the absence of BPC1 causes this relative mild effect on STK expression as a result of architectural and/or composition changes in transcription factor complexes.
This hypothesis also fits more with the observations reported by Meister et al. (2004). They showed that BPC proteins bind to the promoter of INNER NO OUTER (INO). INO encodes a member of the YABBY family of transcription factors that regulates abaxial–adaxial patterning in Arabidopsis ovules (Villanueva et al., 1999). The regulatory region of INO contains six GA-rich elements. Deletion of BPC binding elements in the INO promoter resulted in a reduction or complete loss of expression, indicating that BPC proteins are likely not working as repressors.
From our analysis, it is also clear that the absence of BPC1 does not result in a change in expression profile because our in situ data showed that specificity of STK expression is retained in the bpc1 mutant. This is likely due to redundancy with BPC2 and maybe also BPC3. Future studies on double or triple mutants have to clarify this further.
METHODS
GUS Constructs and Assay
Promoter fragments were cloned into pBluescript SK+ containing the GUS coding sequence and a Cauliflower mosaic virus–poly(A). The promoter fragments were amplified using primers OL152 (5′-GCTCTAGATGTTGGGTATGTTCTCACTTTCTTG-3′) and OL166 (5′-TCTTCTCATGATTCCATTTTAAACATCAAAC-3′). The region 5′ of the transcription start was amplified using primers OL152 and OL167 (5′-TCTTCATGATTCAGCTTTCGGAAACTCTC-3′). The intron region was amplified using primers OL467 (5′-GCTCTAGATGAAGCAAATTCTCAGGTCTGTC-3′) and OL468 (5′-CGGGATCCTCTTCCGATCCTCATTTTAAACATC-3′). The promoter-GUS and the promoter without intron region-GUS cassettes were cloned into pCAMBIA 1300-H. Arabidopsis thaliana (ecotype Columbia) was transformed with these constructs using the Agrobacterium tumefaciens–mediated floral dip method (Koncz et al., 1984; Clough and Bent, 1998). The GUS assays were performed as described (Liljegren et al., 2000).
Yeast One-Hybrid Experiments
The STK regulatory region was divided in six overlapping fragments of ∼400 bp. The fragments to which BPC1 binds were amplified using primers OL734 (5′-GCGAATTCTACTAATACTTTATATGTGCGATTTAGC-3′) and OL735 (5′-GCGAGCTCGGTACCAATTCAGCTTTCGGAAACTCTC-3′) for fragment A and primers OL876 (5′-GGAATTCTCAGGTCTGTCTGTCATGTC-3′) and OL877 (5′-GGCTCGAGTCTAGAGAGGAAGAAGAAATACAACAG-3′) for fragment B. The amplified fragments were cloned into the pLacZi and pHISi vectors (Clontech, Palo Alto, CA), which were subsequently cut with ApaI (pLacZi) or XhoI (pHISi) and used to transform yeast strain YM4271 (pLacZi) or Y187 (pHISi). The whole plant cDNA library, which was cloned in pGADT7-rec and introduced into yeast strain AH109, was mated with Y187 as described in the Clontech user manual and selected on medium lacking His with 35 mM 3-amino 1,2,4-triazol. Plasmids were extracted from positive colonies and retransformed to YM4271 for β-galactosidase (LacZ) assays (Duttweiler, 1996).
EMSA
The BPC1 protein was produced by cloning the coding sequence, which was amplified using primers OL828 (5′-GAGGATCCATGGACGATGATGGATTTCGC-3′) and OL829 (5′-GAGTCGACTTATCTGATCGTGACAAACTTATTGG-3′), into the pMAL-c2X vector (New England Biolabs, Beverly, MA). Oligonucleotides were end-labeled with polynucleotide kinase (Roche, Monza, Italy). Ten nanograms of the BPC1-MBP fusion protein were used per experiment and incubated for 20 min with the labeled double-stranded oligonucleotides at room temperature in binding buffer (0.5 mM EDTA, 50 mM NaCl, 5 mM MgCl2, 20 mM Tris-HCl, pH 8.8, 1 mM DTT, 5% glycerol, 0.5 μg/μL BSA, and 5 ng poly dIdC). The samples were run on 8% polyacrylamide gels (37.5:1).
TPM
The TPM experiments were performed as described by Finzi and Dunlap (2003). The DNA tethers were constructed via PCR using a plasmid containing the STK promoter. The primers that were used are as follows: bio-5′-TTGGTCTTGCCGTGAACTTGG-3′ and dig-5′-AATTTTGACCCATCCCGTGTAC-3′, where “bio” means biotin and “dig” means digoxigenin. The DNA fragment was attached to the microchamber by antidigoxigenin antibodies that were coated to the glass of a microchamber. The beads that were coated with streptavidin were subsequently attached to the biotin label at the other end of the DNA (for details, see Finzi and Dunlap, 2003).
Different DNA fragments in the same microchamber were labeled with beads 0.2 and 0.4 μm in diameter, respectively. BPC1 was used at a concentration of 0.037 ng/μL. The buffer in which the experiment was performed contains 10 mM Tris-HCl, 200 mM KCL, 5% DMSO, 0.1 mM EDTA, 0.2 mM DTT, and 0.1 mg/mL α-casein.
DNA Gel Blot Analysis
The bpc1 mutant was obtained from the SALK lines (SALK_072966.43.30.x) (Alonso et al., 2003) and ordered from the Nottingham Arabidopsis Stock Centre (Scholl et al., 2000). The T-DNA insertion was confirmed by DNA gel blot analysis, using 1.5 μg of DNA, which was cut with XbaI. The DNA was loaded on a 0.8% agarose gel and run overnight at 30 V. DNA transfer to Hybond-N+ and hybridizations were performed according to the manual (Amersham Biosciences, Cologno Monzese, Italy). The probe was obtained by PCR on genomic DNA using primers AtP240 (5′-GCTTCGATGAGAAGATCGCTAG-3′) and AtP241 (5′-GAATATGAGTCCACTGGACG-3′) and subsequent purification from gel using the Nucleospin extract kit (Machery-Nagel, Düren, Germany). The probe was labeled using the random-primed DNA labeling kit from Roche.
Expression Analysis
Total RNA was extracted from Arabidopsis flowers (Verwoerd et al., 1989) and subsequently treated with DNaseI. RNA from wild-type and bpc1 mutant plants (obtained from a segregating population) was reverse transcribed using the Bio-Rad i-Script cDNA synthesis kit (Milan, Italy). For quantitative real-time PCR, the iCycler iQ real-time PCR detection system (Bio-Rad) was used. cDNA amplifications were performed using the iQ SYBR-Green Supermix (Bio-Rad). As a control for the presence of genomic DNA contamination, we performed a real-time PCR on RNA after DNase treatment. The primers used for STK are 5′-GTTCTGATAGCACCAACACTAGC-3′ and 5′-ACTCATGCTTCTTGGACCTGATC-3′. The data were normalized to actin, amplified with primers 5′-CCAATCGTGAGAAAATGACTCAG-3′ and 5′-CCAAACGCAGAATAGCATGTGG-3′. All PCR reactions were performed twice in triplicates. The standard curves were constructed using serial cDNA dilutions. The PCR efficiency was close to 100%; relative gene expression was determined using the 2-ΔΔCt method (Livak and Schmittgen, 2001).
For the in situ hybridization, Arabidopsis flowers were fixed and embedded in paraffin as described previously (Lopez-Dee et al., 1999). Digoxigenin-labeled gene-specific antisense RNA probes were generated by in vitro transcription following the instructions of the in vitro transcription kit (Roche). Hybridization and immunological detection were performed as described previously (Lopez-Dee et al., 1999).
Acknowledgments
We thank H. Sommer for assisting with the yeast one-hybrid screens; R. Mantovani for advice on EMSA; R. Favaro and B. Colombo for helping with some of the experiments. This work was supported by Ministero dell'Istruzione, dell'Università e della Ricerca 2002, 2003.
The author responsible for distribution of materials integral to the findings presented in this article in accordance with the policy described in the Instructions for Authors (www.plantcell.org) is: Lucia Colombo (lucia.colombo@unimi.it).
Article, publication date, and citation information can be found at www.plantcell.org/cgi/doi/10.1105/tpc.104.030130.
References
- Alonso, J.M., et al. (2003). Genome-wide insertional mutagenesis of Arabidopsis thaliana. Science 301, 653–657. [DOI] [PubMed] [Google Scholar]
- Bao, X., Franks, R.G., Levin, J.Z., and Liu, Z. (2004). Repression of AGAMOUS by BELLRINGER in floral and inflorescence meristems. Plant Cell 16, 1478–1489. [DOI] [PMC free article] [PubMed] [Google Scholar]
- Biggin, M.D., and Tjian, R. (1988). Transcription factors that activate the Ultrabithorax promoter in developmentally staged extracts. Cell 53, 699–711. [DOI] [PubMed] [Google Scholar]
- Bowman, J.L., Smyth, D.R., and Meyerowitz, E.M. (1989). Genes directing flower development in Arabidopsis. Plant Cell 1, 37–52. [DOI] [PMC free article] [PubMed] [Google Scholar]
- Bradley, D., Carpenter, R., Sommer, H., Hartley, N., and Coen, E. (1993). Complementary floral homeotic phenotypes result from opposite orientations of a transposon at the plena locus of Antirrhinum. Cell 72, 85–95. [DOI] [PubMed] [Google Scholar]
- Busch, M.A., Bomblies, K., and Weigel, D. (1999). Activation of a floral homeotic gene in Arabidopsis. Science 285, 585–587. [DOI] [PubMed] [Google Scholar]
- Clough, S.J., and Bent, A.F. (1998). Floral dip: A simplified method for Agrobacterium-mediated transformation of Arabidopsis thaliana. Plant J. 16, 735–743. [DOI] [PubMed] [Google Scholar]
- Deyholos, M.K., and Sieburth, L.E. (2000). Separable whorl-specific expression and negative regulation by enhancer elements within the AGAMOUS second intron. Plant Cell 12, 1799–1810. [DOI] [PMC free article] [PubMed] [Google Scholar]
- Drews, G.N., Bowman, J.L., and Meyerowitz, E.M. (1991). Negative regulation of the Arabidopsis homeotic gene AGAMOUS by the APETALA2 product. Cell 65, 991–1002. [DOI] [PubMed] [Google Scholar]
- Duttweiler, H.M. (1996). A highly sensitive and non-lethal beta-galactosidase plate assay for yeast. Trends Genet. 12, 340–341. [DOI] [PubMed] [Google Scholar]
- Finzi, L., and Dunlap, D. (2003). Single-molecule studies of DNA architectural changes induced by regulatory proteins. Methods Enzymol. 370, 369–378. [DOI] [PubMed] [Google Scholar]
- Favaro, R., Pinyopich, A., Battaglia, R., Kooiker, M., Borghi, L., Ditta, G., Yanofsky, M.F., Kater, M.M., and Colombo, L. (2003). MADS-box protein complexes control carpel and ovule development in Arabidopsis. Plant Cell 15, 2603–2611. [DOI] [PMC free article] [PubMed] [Google Scholar]
- Hong, R.L., Hamaguchi, L., Busch, M.A., and Weigel, D. (2003). Regulatory elements of the floral homeotic gene AGAMOUS identified by phylogenetic footprinting and shadowing. Plant Cell 15, 1296–1309. [DOI] [PMC free article] [PubMed] [Google Scholar]
- Koncz, C., Kreuzaler, F., Kalman, Z., and Schell, J. (1984). A simple method to transfer, integrate and study expression of foreign genes, such as chicken ovalbumin and alpha-actin in plant tumors. EMBO J. 3, 1029–1037. [DOI] [PMC free article] [PubMed] [Google Scholar]
- Lehmann, M. (2004). Anything else but GAGA: A nonhistone protein complex reshapes chromatin structure. Trends Genet. 20, 15–22. [DOI] [PubMed] [Google Scholar]
- Liljegren, S.J., Ditta, G.S., Eshed, Y., Savidge, B., Bowman, J.L., and Yanofsky, M.F. (2000). SHATTERPROOF MADS-box genes control seed dispersal in Arabidopsis. Nature 404, 766–770. [DOI] [PubMed] [Google Scholar]
- Livak, K.J., and Schmittgen, T.D. (2001). Analysis of relative gene expression data using real-time quantitative PCR and the 2(-Delta Delta C(T)) method. Methods 25, 402–408. [DOI] [PubMed] [Google Scholar]
- Lopez-Dee, Z.P., Wittich, P., Pe, E.M., Rigola, D., Del Buono, I., Gorla, M.S., Kater, M.M., and Colombo, L. (1999). OsMADS13, a novel rice MADS-box gene expressed during ovule development. Dev. Genet. 25, 237–244. [DOI] [PubMed] [Google Scholar]
- Meister, R.J., Williams, L.A., Monfared, M.M., Gallagher, T.L., Kraft, E.A., Nelson, C.G., and Gasser, C.S. (2004). Definition and interactions of a positive regulatory element of the Arabidopsis INNER NO OUTER promoter. Plant J. 37, 426–438. [DOI] [PubMed] [Google Scholar]
- Mellor, J., and Morillon, A. (2004). ISWI complexes in Saccharomyces cerevisiae. Biochim. Biophys. Acta 1677, 100–112. [DOI] [PubMed] [Google Scholar]
- Omichinski, J.G., Pedone, P.V., Felsenfeld, G., Gronenborn, A.M., and Clore, G.M. (1997). The solution structure of a specific GAGA factor-DNA complex reveals a modular binding mode. Nat. Struct. Biol. 4, 87–89. [DOI] [PubMed] [Google Scholar]
- Orphanides, G., Wu, W.H., Lane, W.S., Hampsey, M., and Reinberg, D. (1999). The chromatin-specific transcription elongation factor FACT comprises human SPT16 and SSRP1 proteins. Nature 400, 284–288. [DOI] [PubMed] [Google Scholar]
- Parenicova, L., de Folter, S., Kieffer, M., Horner, D.S., Favalli, C., Busscher, J., Cook, H.E., Ingram, R.M., Kater, M.M., Davies, B., Angenent, G.C., and Colombo, L. (2003). Molecular and phylogenetic analyses of the complete MADS-box transcription factor family in Arabidopsis: New openings to the MADS world. Plant Cell 15, 1538–1551. [DOI] [PMC free article] [PubMed] [Google Scholar]
- Pelaz, S., Ditta, G.S., Baumann, E., Wisman, E., and Yanofsky, M.F. (2000). B and C floral organ identity functions require SEPALLATA MADS-box genes. Nature 405, 200–203. [DOI] [PubMed] [Google Scholar]
- Pinyopich, A., Ditta, G.S., Savidge, B., Liljegren, S.J., Baumann, E., Wisman, E., and Yanofsky, M.F. (2003). Assessing the redundancy of MADS-box genes during carpel and ovule development. Nature 424, 85–88. [DOI] [PubMed] [Google Scholar]
- Rounsley, S.D., Ditta, G.S., and Yanofsky, M.F. (1995). Diverse roles for MADS box genes in Arabidopsis development. Plant Cell 8, 1259–1269. [DOI] [PMC free article] [PubMed] [Google Scholar]
- Sangwan, I., and O'Brian, M.R. (2002). Identification of a soybean protein that interacts with GAGA element dinucleotide repeat DNA. Plant Physiol. 129, 1788–1794. [DOI] [PMC free article] [PubMed] [Google Scholar]
- Santi, L., Wang, Y., Stile, M.R., Berendzen, K., Wanke, D., Roig, C., Pozzi, C., Muller, K., Muller, J., Rohde, W., and Salamini, F. (2003). The GA octodinucleotide repeat binding factor BBR participates in the transcriptional regulation of the homeobox gene Bkn3. Plant J. 34, 813–826. [DOI] [PubMed] [Google Scholar]
- Scholl, R.L., May, S.T., and Ware, D.H. (2000). Seed and molecular resources for Arabidopsis. Plant Physiol. 124, 1477–1480. [DOI] [PMC free article] [PubMed] [Google Scholar]
- Sheldon, C.C., Conn, A.B., Dennis, E.S., and Peacock, W.J. (2002). Different regulatory regions are required for the vernalization-induced repression of FLOWERING LOCUS C and for the epigenetic maintenance of repression. Plant Cell 14, 2527–2537. [DOI] [PMC free article] [PubMed] [Google Scholar]
- Shimojima, T., Okada, M., Nakayama, T., Ueda, H., Okawa, K., Iwamatsu, A., Handa, H., and Hirose, S. (2003). Drosophila FACT contributes to Hox gene expression through physical and functional interactions with GAGA factor. Genes Dev. 17, 1605–1616. [DOI] [PMC free article] [PubMed] [Google Scholar]
- Sieburth, L.E., and Meyerowitz, E.M. (1997). Molecular dissection of the AGAMOUS control region shows that cis elements for spatial regulation are located intragenically. Plant Cell 9, 355–365. [DOI] [PMC free article] [PubMed] [Google Scholar]
- Soeller, W.C., Oh, C.E., and Kornberg, T.B. (1993). Isolation of cDNAs encoding the Drosophila GAGA transcription factor. Mol. Cell. Biol. 13, 7961–7970. [DOI] [PMC free article] [PubMed] [Google Scholar]
- Verwoerd, T.C., Dekker, B.M.M., and Hoekema, A. (1989). A small-scale procedure for the rapid isolation of plant RNAs. Nucleic Acids Res. 17, 2362. [DOI] [PMC free article] [PubMed] [Google Scholar]
- Villanueva, J.M., Broadhvest, J., Hauser, B.A., Meister, R.J., Schneitz, K., and Gasser, C.S. (1999). INNER NO OUTER regulates abaxial-adaxial patterning in Arabidopsis ovules. Genes Dev. 13, 3160–3169. [DOI] [PMC free article] [PubMed] [Google Scholar]