

Abstract
Background:
APOE is the largest genetic risk factor for Alzheimer’s disease (AD), but there is a substantial polygenic component. Polygenic risk scores (PRS) can summarize small effects across the genome but may obscure differential risk across molecular processes and pathways that contribute to heterogeneity of disease presentation.
Objective:
We examined polygenic risk impacting specific AD-associated pathways and its relationship with clinical status and biomarkers of amyloid, tau, and neurodegeneration (A/T/N).
Methods:
We analyzed data from 1,411 participants from the Alzheimer’s Disease Neuroimaging Initiative (ADNI). We applied pathway analysis and clustering to identify AD-associated “pathway clusters” and construct pathway-specific PRSs (excluding the APOE region). We tested associations with diagnostic status, abnormal levels of amyloid and ptau, and hippocampal volume.
Results:
Thirteen pathway clusters were identified, and eight pathway-specific PRSs were significantly associated with AD diagnosis. Amyloid-positivity was associated with endocytosis and fibril formation, response misfolded protein, and regulation protein tyrosine PRSs. Ptau positivity and hippocampal volume were both related to protein localization and mitophagy PRS, and ptau-positivity was also associated with an immune signaling PRS. A global AD PRS showed stronger associations with diagnosis and all biomarkers compared to pathway PRSs.
Conclusion:
Pathway PRS may contribute to understanding separable disease processes, but do not add significant power for predictive purposes. These findings demonstrate that AD-phenotypes may be preferentially associated with risk in specific pathways, and defining genetic risk along multiple dimensions may clarify etiological heterogeneity in AD. This approach to delineate pathway-specific PRS can be used to study other complex diseases.
Keywords: Alzheimer’s disease, dementia, genetic risk score, amyloid, tau, hippocampal volume
INTRODUCTION
Alzheimer’s disease (AD) is known to be influenced by many genetically-mediated factors, with a heritability estimated to be 60–80% [1]. Although autosomal dominant forms of AD are due to mutations in the APP, PSEN1, and PSEN2 genes, sporadic or late onset AD has a more complex genetic basis. The APOE gene represents the single largest genetic risk factor [2], but over the past decade or so a number of additional AD risk genes have been discovered [3–6], with the most recent AD genome-wide association study (GWAS) identifying 75 risk loci [7]. Finding effective treatment for AD remains elusive, and there is increasing focus on its heterogenous presentation, both clinically and at the level of pathobiological mechanisms. Ultimately, identifying the sources of genetic risk for AD may not only shed light on the pathobiology of the disease but also lead to novel drug targets.
While large-scale GWAS continue to identify specific risk loci, the polygenic nature of AD suggest the possibility that informative genetic signals may fall beneath the genome-wide significance thresholds. One approach to capturing these weak associations is to construct polygenic risk scores (PRSs) by taking the sum of all putative risk variants, defined broadly, weighted by their effect size from independent GWAS, assigning each individual a score, and then testing the association of this score with diagnosis and related phenotypes [8]. For genetically complex diseases such as AD, PRSs have been shown to strengthen AD diagnostic classification beyond the use of APOE genotypes [9] and have further been shown to be associated with brain structure, amyloid-β (Aβ) and tau pathology, and cognitive decline [10–13]. AD PRSs have also been shown to be associated with increased risk for mild cognitive impairment among individuals in their 50s [14], and have even been shown to be associated with brain structure in young adults [15, 16], demonstrating their utility across multiple age ranges.
A benefit of PRSs is that they provide a global summary measure that aggregates the large and small effect sizes of different variants across the genome. However, aggregating the effects of individual loci may obscure distinct sources of risk. One approach to overcome this limitation has been to calculate PRS with the APOE region removed to demonstrate effects of the APOE gene and APOE-independent variants [17–19]. In this light, AD risk genes identified through GWAS have been associated with a number of pathways, such as immune function, cholesterol transport, mitochondrial function, protein-lipid complex, and endocytosis [4, 6, 7, 20, 21], and the APOE gene itself impacts a variety of processes [22]. Two individuals may therefore have similar scores on a global PRS with very different risk associated with the underlying pathways that are perturbed as a result. It is well documented that AD demonstrates substantial heterogeneity with respect to its clinical presentation [23–25], but also in the distribution of associated pathology and atrophy. For example, potential subtypes have been identified using AD-related biomarkers, including those associated with amyloid [26], tau [27–30], and neurodegeneration [31–35].
Breaking down global AD PRS into pathway-specific PRSs may help to better understand the etiology of AD and its heterogeneity, and previous studies have taken this approach [19, 36–42]. Several of these focused on associations of pathway PRS with AD diagnosis [36, 39, 40, 42], but there is a growing interest in characterizing individuals based on AD-related pathology involving amyloid, tau and neurodegeneration (i.e., the A/T/N classification system) [43] that are also likely to have a polygenic basis. One study examined the association of defined pathway-specific PRS with clinical diagnosis and amyloid [19], and another with tau [41]. However, it is of interest to examine clinical status and all A/T/N biomarkers together in order to assess the pattern of pathway-specific PRS associations across each. Only one previous study compared the association of pathway-specific PRS with cognitive status and multiple A/T/N biomarkers [37], but this analysis was restricted to 3 pathways calculated from 21 single nucleotide polymorphisms (SNPs) found to be significant in an earlier GWAS of AD [5, 37]. Previous studies have highlighted the importance of including larger numbers of variants, including those below the level of genome-wide significance in relevant analyses [9, 14]. In the same vein, it may be useful to consider additional pathways beyond those reaching stringent thresholds of significance to capture genetic influences on complex disease such as AD.
Here, we conducted a comprehensive examination of associations between pathway-specific PRS with dementia status and all three A/T/N biomarkers to better characterize patterns of genetic influences on each. Additionally, prior pathway PRS analyses have depended upon a priori defined pathways. We present a generalizable approach to identify clusters of trait-relevant pathways in a data-driven manner that can be used to calculate pathway-specific PRS for any trait or complex disease.
MATERIALS AND METHODS
Participants
Data used in the preparation of this article were obtained from the Alzheimer’s Disease Neuroimaging Initiative (ADNI) database (adni.loni.usc.edu). The ADNI was launched in 2003 as a public-private partnership, led by Principal Investigator Michael W. Weiner, MD. The primary goal of ADNI has been to test whether serial magnetic resonance imaging (MRI), positron emission tomography (PET), other biological markers, and clinical and neuropsychological assessment can be combined to measure the progression of mild cognitive impairment and early AD.
Our analyses included data on 1,411 participants from the ADNI-1 (n=699), ADNI-GO/2 (n=406), and ADNI-3 (n=306) cohorts of European ancestry. The individuals in these cohorts had genome-wide genotype data that underwent rigorous quality control filters. Our analyses focused on cognitively unimpaired (CU) participants, participants with mild cognitive impairment (MCI), and individuals with AD dementia according to baseline ADNI diagnosis in the cohorts. Procedures were approved by the Institutional Review Board of participating institutions and informed consent was obtained from all participants.
Genotype data processing and imputation
Individuals in the ADNI cohorts were genotyped using the following chips: Illumina Human610-Quad BeadChip (ADNI-1), Illumina HumanOmniExpress BeadChip (ADNI-GO/2), and Illumina Infinium Global Screening Array v2 (ADNI-3). Genetic data for each chip were processed and underwent quality control separately using PLINK2 [44] prior to genotype imputation. SNPs were excluded if minor allele frequency <0.05, sample missingness >5%, or showed significant deviation from Hardy-Weinberg equilibrium (p < 1×10e−06). Samples with genotype missingness >10% were excluded. Participants were restricted to those with primarily European ancestry (>80%) as determined by SNPweights [45]. Principal components were calculated from linkage disequilibrium (LD)-pruned variants in combination with 1000 Genomes data [46] for use as covariates in later analyses. Imputation was performed on the Michigan Imputation Server (https://imputationserver.sph.umich.edu/) [47] using the 1000 Genomes phase 3 EUR reference panel. Imputed data from all phases was filtered to exclude multi-allelic variants, variants with imputation quality of R2<0.3 or variants with a genotype posterior probability <90% and then merged. A total of 7,487,325 SNPs from 1,411 participants were retained following quality control and merging.
Identification of Alzheimer’s-related pathway clusters
A gene-set analysis of the IGAP2 Alzheimer’s disease GWAS summary statistics [4] was conducted with MAGMA v1.09a [48]. All SNPs included in the Kunkle et al. GWAS summary statistics were used as inputs in this analysis. SNPs were mapped to protein coding genes with a 35-kb upstream/10-kb downstream window. The SNPwise-mean model was used for the gene analysis. Gene sets from Gene Ontology (GO) [49, 50], Reactome [51] and KEGG [52] databases were downloaded from the Bader Lab website (http://baderlab.org/GeneSets). Analysis was restricted to gene sets containing 10 to 1,000 genes.
The resulting gene sets contain a high degree of redundancy, so we generated “pathway clusters” comprising gene sets with a high proportion of overlapping genes. First, the Cytoscape app EnrichmentMap v3.3 [53] was used to generate networks with gene sets as nodes and proportion of overlapping genes as edges. A gene set threshold of false discovery rate corrected (FDR) q<0.25 and overlap threshold of 0.5 were used as node and edge parameters, respectively. A permissive threshold was chosen to consider a broader set of potential risk pathways. Next, the AutoAnnotate app (http://baderlab.org/Software/AutoAnnotate) was used to cluster nodes with the MCL Cluster algorithm. Variants in genes belonging to a pathway cluster were used to calculate pathway-specific PRSs.
Pathway-specific polygenic risk scores
Pathway-specific PRSs were calculated based on summary statistic effect sizes from the [4] Alzheimer’s disease GWAS using the PRSet function in PRSice-2 v2.3.5 [54]. This GWAS was chosen because it is the most recent GWAS based only on clinically diagnosed AD (as opposed to proxy cases based on familial history of dementia). Although some of the ADNI participants were included in this GWAS, a study by Leonenko et al. [19] estimated that this overlap did not result in substantial bias of PRS associations. Each pathway PRS was calculated from SNPs mapped to genes contained in each pathway cluster with a 35-kb upstream/10-kb downstream window. A global PRS considering all SNPs contained in the summary statistics was also calculated. Prior to scoring, SNPs with minor allele frequency <0.01 and imputation quality R2<0.5 were excluded from the analysis. Linkage disequilibrium (LD) clumping (r2 threshold of 0.2 in a 500 kb window) based on LD patterns in the 1000 Genomes EUR cohort was used to restrict scoring to independent loci. To determine the effect of PRSs independent of APOE, the region surrounding the APOE genes was removed (chr19:45,116,911 – 46,318,605 according to GRCh37). No p-value thresholding was used when constructing global or pathway-specific PRS. That is, after filtering SNPs for the criteria described above, all remaining SNPs were used to calculate the score.
Measures of amyloid, tau, and neurodegeneration
We explored associations between pathway-specific PRS and cerebro-spinal fluid (CSF) and PET measures of amyloid and tau. We considered the results of CSF and PET measures as both are indicative of the presence of pathology, so we combined classifications from each to maximize the sample size for our analyses. Individuals were classified as Aβ- and tau-positive based on having abnormal levels from at least one CSF or PET measure at a given data collection timepoint (e.g., a classification of Aβ+ could be based on abnormal levels of amyloid from either a CSF or PET assessment, or both).
Aβ and p-tau CSF samples were collected on cohort participants and processed as previously described [55]. CSF Aβ42 and phosphorylated tau (p-tau) were measured with the fully automated Elecsys immunoassay (Roche Diagnostics) by the ADNI biomarker core (University of Pennsylvania). Established cutoffs designed to maximize sensitivity in the ADNI study population were used to classify biomarker positivity [Aβ+: Aβ42<977 pg/mL; p-tau+: p-tau>21.8 pg/mL] (http://adni.loni.usc.edu/methods) [56].
Aβ and tau PET data were processed according to previously published methods (http://adni.loni.usc.edu/methods) [57, 58]. For Aβ, mean standardized uptake value ratios (SUVR) were created from a set of regions including frontal, temporal, parietal and cingulate cortices using whole cerebellum (florbetapir) or cerebellar gray matter (PIB) as a reference region. We used established cutoffs to determine Aβ-positivity for PIB-PET (SUVR>1.44), florbetapir-PET (SUVR>1.11), and florbetaben-PET (SUVR>1.08) [57, 59]. Partial-volume corrected flortaucipir (AV-1451) tau PET SUVRs were created from a meta-temporal region of interest that included amygdala, entorhinal cortex, fusiform gyrus, inferior temporal gyrus, and middle temporal gyrus regions using inferior cerebellar gray matter as a reference region. A cut-off of SUVR>1.78 was used to define tau-PET positivity [60].
Neurodegeneration was indexed by the ratio of hippocampal volume to intracranial volume. As there is no established cut-off for abnormal hippocampal volume, this was used as a continuous measure in all analyses.
Statistical analysis
All analyses were conducted with R v4.2.1 [61]. Differences in demographic variables were tested with t-tests for continuous variables and chi-squared tests for categorical variables. Associations with baseline diagnostic status restricted to cognitively unimpaired (CU) participants and those with dementia at their baseline visit and were tested using logistic regressions with diagnosis (CU vs dementia) as outcome. Associations with A/T/N biomarkers included participants of all diagnostic categories and used the first timepoint at which biomarker measures from all three categories were available. For amyloid and tau, our logistic regression models took biomarker abnormality status (positive vs negative) as the dependent or outcome measure of interest. For hippocampal volume, linear regression used the ratio of hippocampal volume to intracranial volume (ICV) as the outcome. Magnet field strength was also included as a covariate in analyses of hippocampal volume. Separate models were run with each PRS as predictor. The effect of APOE was assessed by including number of APOE-ε4 alleles (0, 1, or 2) as a separate variable. Models additionally included age, gender, and the first three principal components of the ADNI cohort genetic relationship matrix to control for any cryptic population stratification [62]. Several post-hoc analyses were run to provide additional context to the PRS effect. Participants were stratified by APOE-ε4 into carriers and non-carriers, and PRS effects were tested separately in each group. Differences between these groups were directly tested with an interaction between APOE-ε4 carrier status and pathway PRS. To determine whether pathway-specific PRS in aggregate would increase predictive power, we fit models for each outcome (i.e., clinical status and biomarker abnormality) that included all pathway-specific PRS in the same model. The fit of these models were compared to models that included only the global PRS using Vuong’s likelihood ratio test [63]. We corrected for multiple comparisons using Benjamini-Hochberg FDR-adjustment [64].
RESULTS
Pathway analysis
The results of MAGMA analysis of the Alzheimer’s GWAS summary statistics suggested that several pathways were significantly enriched among associated variants – all surviving FDR correction for multiple comparisons (Supplementary Table S1). These included negative regulation of amyloid precursor protein catabolic process (GO:1902992), regulation of aspartic-type peptidase activity (GO:1905245), negative regulation of cellular component organization (GO:0051129), negative regulation of amyloid-beta formation (GO:1902430), and regulation of humoral immune response mediated by circulating immunoglobulin (GO:0002923). A number of other genesets were nominally significant (p<0.05, uncorrected) and those with FDR q<0.25 were included in clustering (Supplementary Table S1). Clustering yielded 13 pathway clusters: protein localization (including regulation of amyloid-beta and tau protein kinase activity), cholesterol transport, amyloid protein processing, immune signaling, inflammatory response (including microglial activation), endocytosis and fibril regulation, humoral immune response (including regulation of complement activation), receptor metabolic process, responses to misfolded protein, phototransduction, regulation of cell junction assembly, regulation of protein tyrosine, and mitophagy. Variants in the enriched pathways were used to construct the pathway-specific PRS.
Table 3 lists the number of SNPs used to calculate each PRS and Supplementary Table S2 lists the gene sets included in each of the pathway clusters. Although the majority of genes contributed to only one pathway cluster, some contributed to 2 or more clusters (Figure 1A). Genes that contributed to a relatively high number of pathways included CLU (n=7), CAV1 (n=6), IL1B (n=5), SNCA (n=5), SRC (n=5), THY1 (n=5), TNF (n=5), and TREM2 (n=5). Supplementary Table S3 lists the number of pathways each gene was associated with. Similarly, the vast majority of SNPs were used in the calculation of only one pathway-specific PRS, but some SNPs did contribute to multiple scores (Figure 1B). Correlations between the PRS ranged from −0.04 to 0.49 but, in general, the correlations were fairly small (mean r = 0.01; Figure 1C).
Table 3.
Number of SNPs used to calculate each polygenic risk score.
| PRS | n SNPs |
|---|---|
| global | 351,203 |
| protein localization | 16,776 |
| cholesterol transport | 1,428 |
| amyloid protein processing | 896 |
| immune signalling | 9,062 |
| inflammatory response | 603 |
| endocytosis and fibril regulation | 11,063 |
| humoral immune response | 227 |
| receptor metabolic process | 1,757 |
| response misfolded protein | 321 |
| phototransduction | 606 |
| regulation cell junction | 4,821 |
| regulation protein tyrosine | 1,446 |
| mitophagy | 159 |
Figure 1. Contributions of genes and SNPs to one or more pathways.
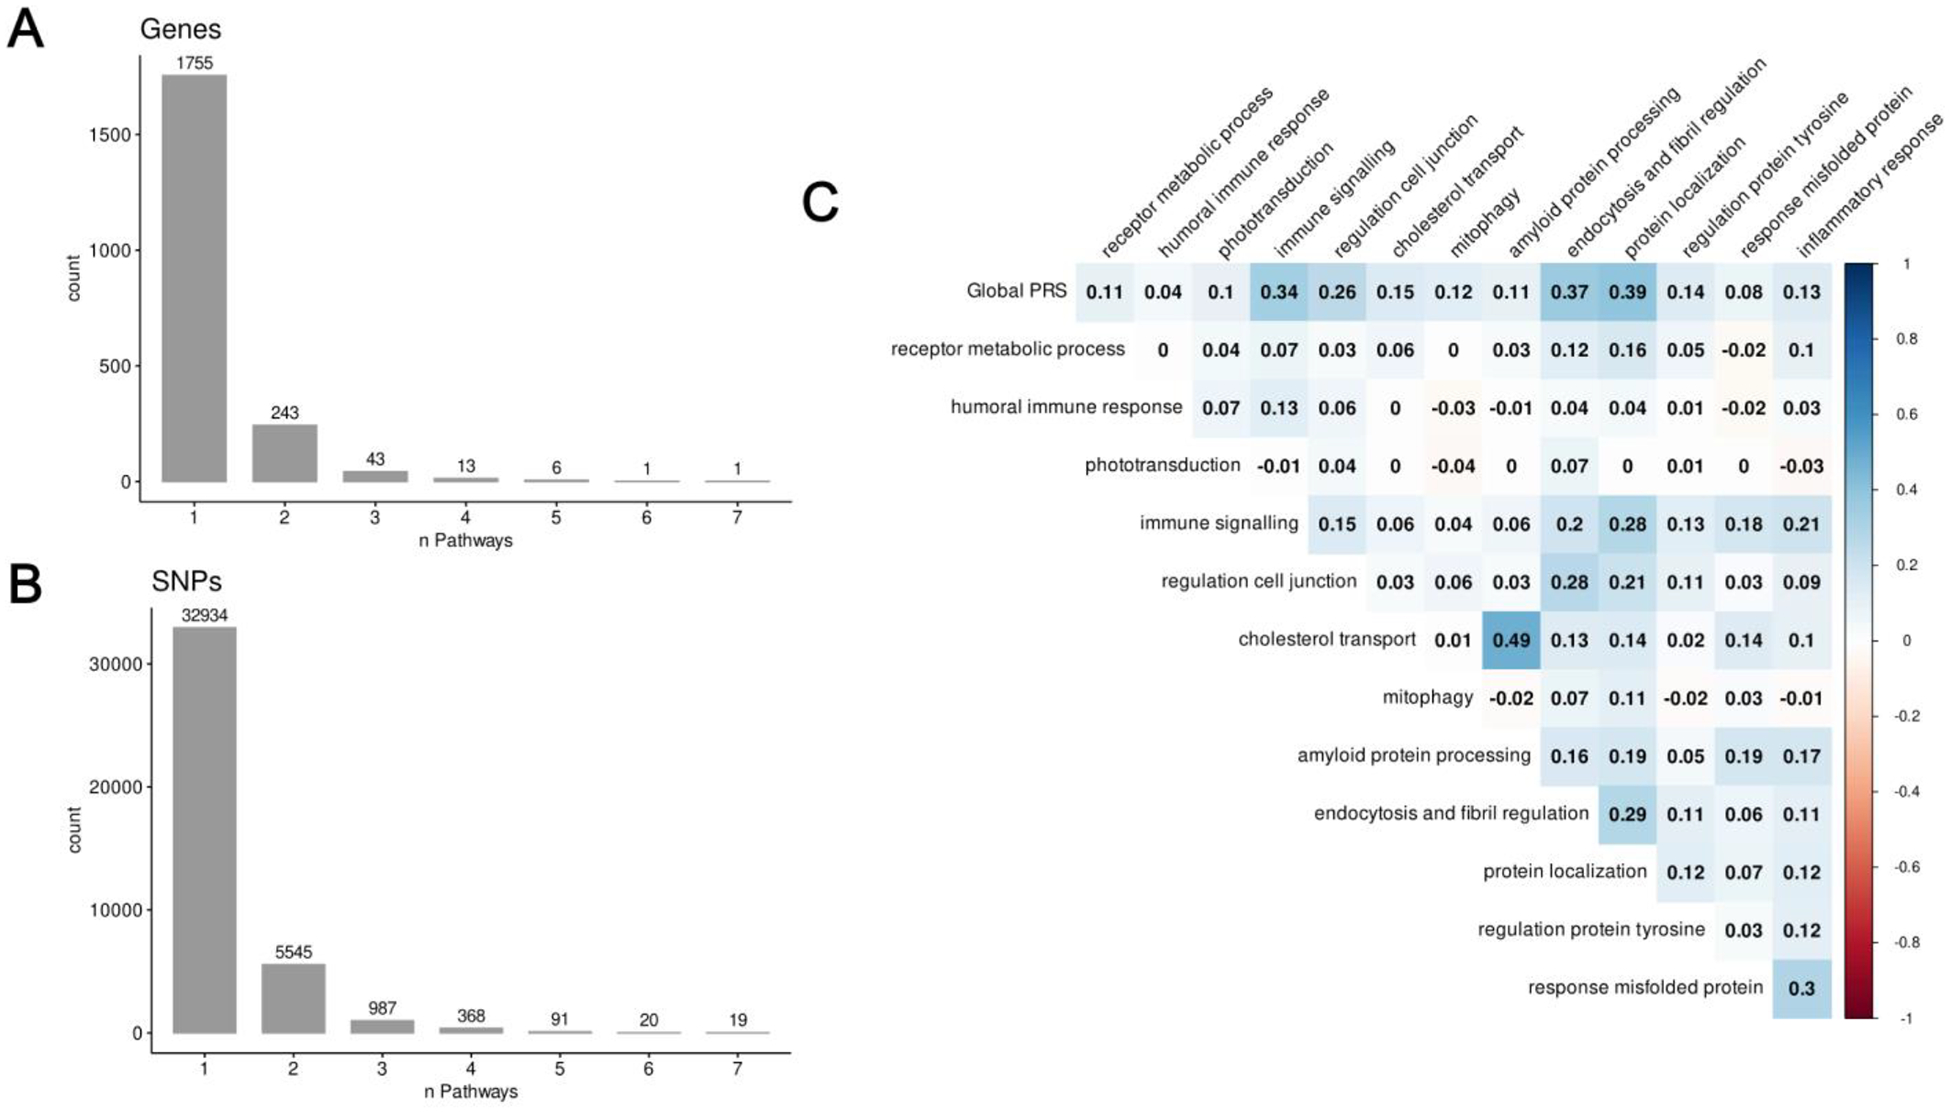
A) The frequency with which genes were members of one or more pathway clusters for genes that were mapped to at least one pathway. B) The frequency with which SNPs contributed to the calculation of one or more pathway-PRS for SNPs that were mapped to at least one pathway. C) Correlation matrix of global and pathway-specific PRS.
Associations with diagnostic status
Sample characteristics of participants included in the analysis of diagnostic status are listed in Table 1, and full results are shown in Figure 1 and Supplementary Table S3. In models including PRS and APOE-ε4 status, a higher global PRS (β=1.91, t-value=11.01, p<0.001) and number of APOE-ε4 alleles (β=0.94, t-value=8.60, p<0.001) were significantly associated with an Alzheimer’s dementia diagnosis. Eight of the 13 pathway PRSs were significantly associated with diagnostic status after correction for multiple comparisons. These included: protein localization, cholesterol transport, amyloid protein processing, immune signaling, endocytosis and fibril regulation, regulation cell junction, regulation protein tyrosine, and mitophagy. When examining APOE-ε4 non-carriers only, results were similar except that cholesterol transport and regulation protein tyrosine were no longer significant whereas the receptor metabolic process PRS went from non-significant to significant. In APOE-ε4 carriers, only the global, regulation cell junction, and regulation protein tyrosine PRSs were significant. The effects of the global PRS (β=−0.54, t-value=−2.10, p=0.035) and protein localization PRS (β=−0.45, t-value=−2.41, p=0.016) were significantly weaker in APOE-ε4 carriers than non-carriers, whereas the phototransduction PRS was stronger in APOE-ε4 carriers (β=0.39, t-value=2.17, p=0.030). However, these did not survive correction for multiple comparisons.
Table 1.
Characteristics of sample used to test associations with diagnostic status.
| Cognitively Unimpaired | Dementia | |
|---|---|---|
| n | 536 | 214 |
| Gender (Male), n (%) | 258 (48.1) | 122 (57.0) |
| Age, mean (SD) | 73.49 (5.98) | 75.46 (8.11) |
| Years of education, mean (SD) | 16.56 (2.50) | 15.11 (2.96) |
| APOE-ε4 carrier, n (%) | 161 (30.0) | 143 (66.8) |
Associations with amyloid positivity
Sample characteristics of participants included in the analysis of biomarkers are listed in Table 2, and full results of the associations with amyloid positivity are shown in Figure 2 and Supplementary Table S4. In models including PRS and APOE-ε4 status, a higher global PRS (β=0.45, t-value=4.21, p<0.001) and number of APOE-ε4 alleles (β=1.14, t-value=9.18, p<0.001) were significantly associated with amyloid positivity. Three of the 13 pathway PRSs were significantly associated with amyloid status after correction for multiple comparisons. These included: endocytosis and fibril regulation, response misfolded protein, and regulation protein tyrosine. When examining APOE-ε4 non-carriers only, the global PRS as well as the endocytosis and fibril regulation PRS were significant. In APOE-ε4 carriers, only the global and regulation protein tyrosine PRSs were significant. The effect of the regulation protein tyrosine PRS was significantly stronger in APOE-ε4 carriers than non-carriers (β=0.52, t-value=2.55, p=0.010), but this did not survive correction for multiple comparisons.
Table 2.
Characteristics of sample used to test associations with biomarker measures. CU = cognitively unimpaired, MCI = mild cognitive impairment. Hippocampal volume ratio was calculated as (Hippocampal volume / Intracranial volume)*100.
| Biomarker sample | |
|---|---|
| n | 674 |
| Gender, n Male (%) | 387 (57.4) |
| Age, mean (SD) | 73.77 (7.36) |
| Years of education, mean (SD) | 15.97 (2.76) |
| APOE-ε4 carrier, n (%) | 300 (44.5) |
| Diagnosis, n (5) | |
| CU | 200 (29.7) |
| MCI | 373 (55.3) |
| Dementia | 101 (15.0) |
| Amyloid positive, n (%) | 430 (63.8) |
| Ptau positive, n (%) | 382 (56.7) |
| Hippocampal volume ratio, mean (SD) | 0.44 (0.08) |
Figure 2. Associations of polygenic risk scores with diagnostic status.
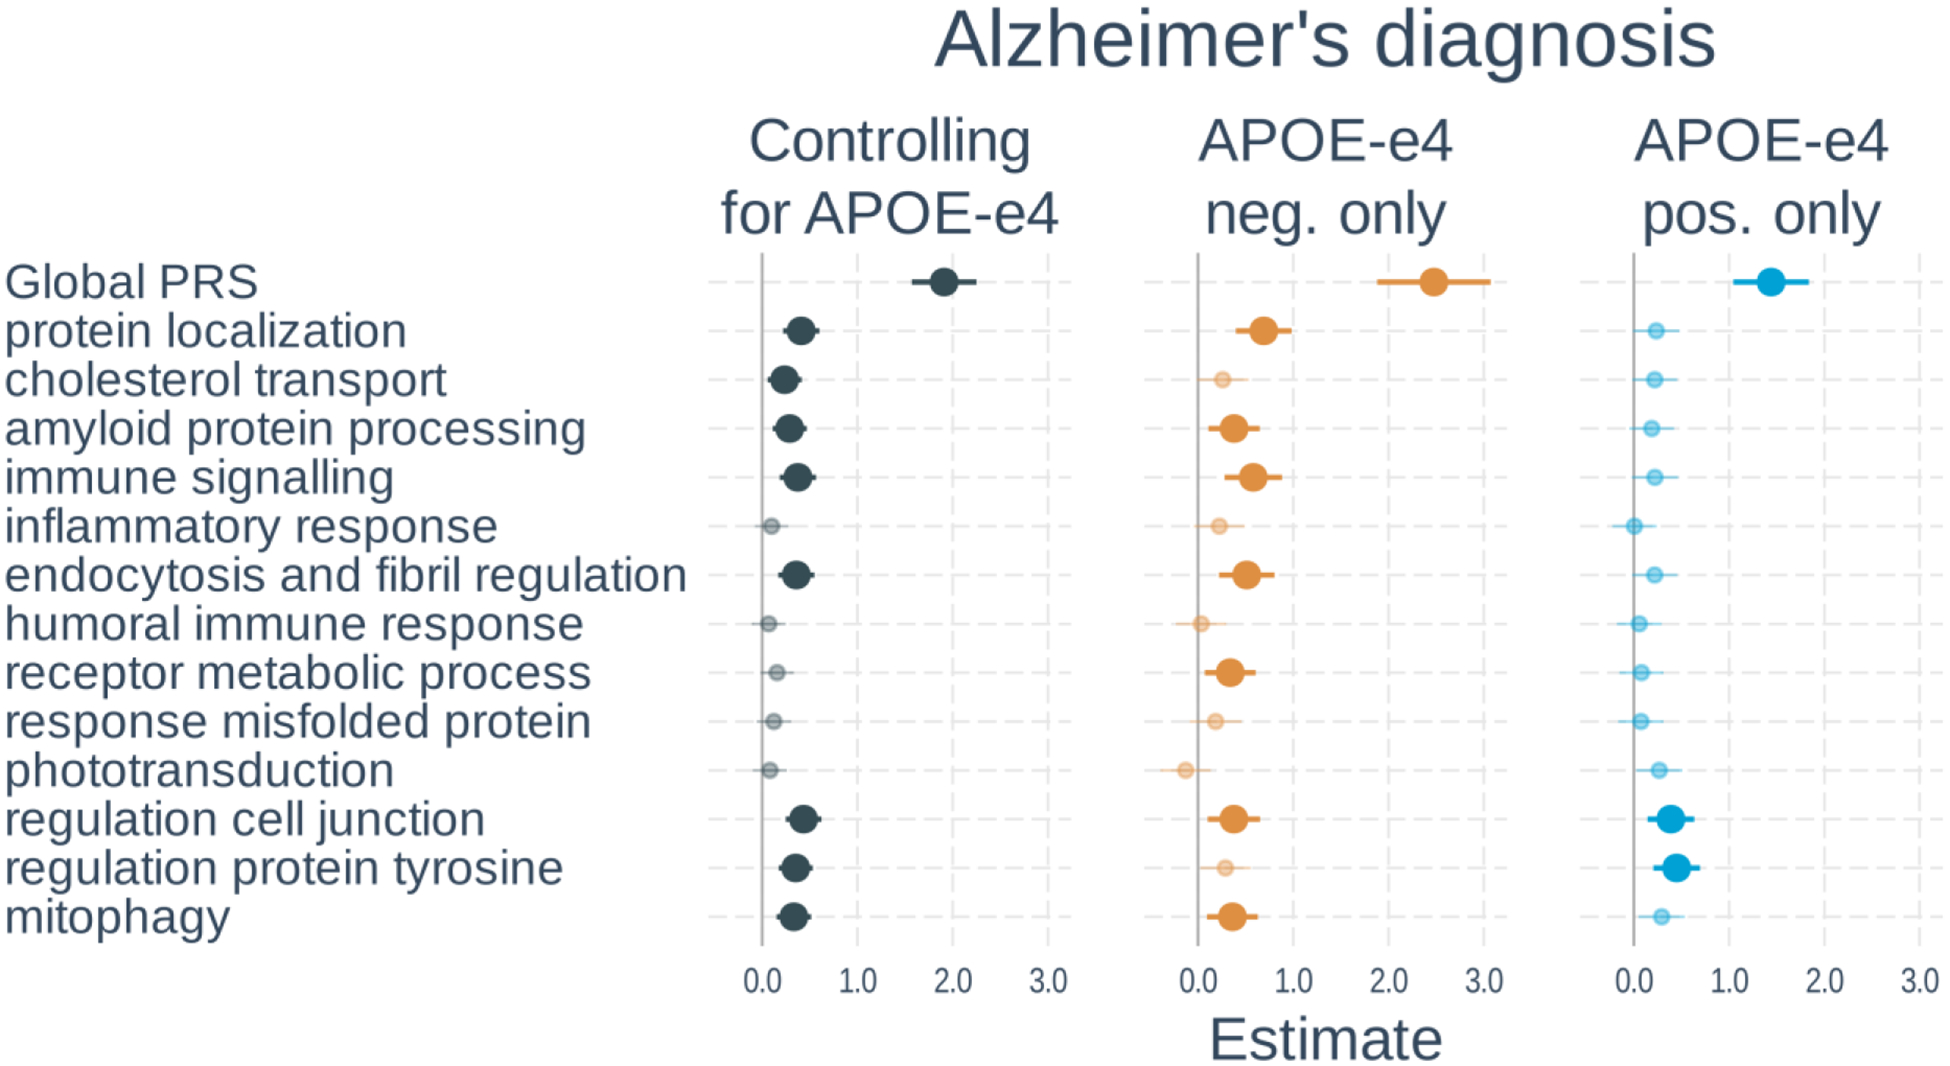
Logistic regressions were used with diagnostic status (cognitively unimpaired vs dementia) as the outcome. Separate models used each PRS as predictor. Models either 1) included number of APOE-ε4 alleles as a separate variable, 2) tested only APOE-ε4 non-carriers, or 3) tested only APOE-ε4 carriers. All models adjusted for age, gender, and the first 3 genetic principal components. Plots show standardized regression coefficients (log-odds) and standard errors. Associations that survived FDR correction are bolded.
Associations with tau positivity
Full results of the associations with tau positivity are shown in Figure 3 and Supplementary Table S5. In models including PRS and APOE-ε4 status, a higher global PRS (β=0.43, t-value=4.25, p<0.001) and number of APOE-ε4 alleles (β=0.62, t-value=6.63, p<0.001) were significantly associated with tau positivity. Three of the 13 pathway PRSs were significantly associated with tau status after correction for multiple comparisons. These included: protein localization, immune signaling, and mitophagy. When examining APOE-ε4 non-carriers only, results were similar except that the mitophagy PRS was no longer significant, whereas the inflammatory response PRS became significant. In APOE-ε4 carriers, neither the global PRS nor any of the pathway PRSs were significant. The effect of the immune signaling PRS was significantly weaker in APOE-ε4 carriers than non-carriers (β=−0.66, t-value=−3.72, p<0.001), but this did not survive correction for multiple comparisons.
Figure 3. Associations of polygenic risk scores with amyloid positivity.
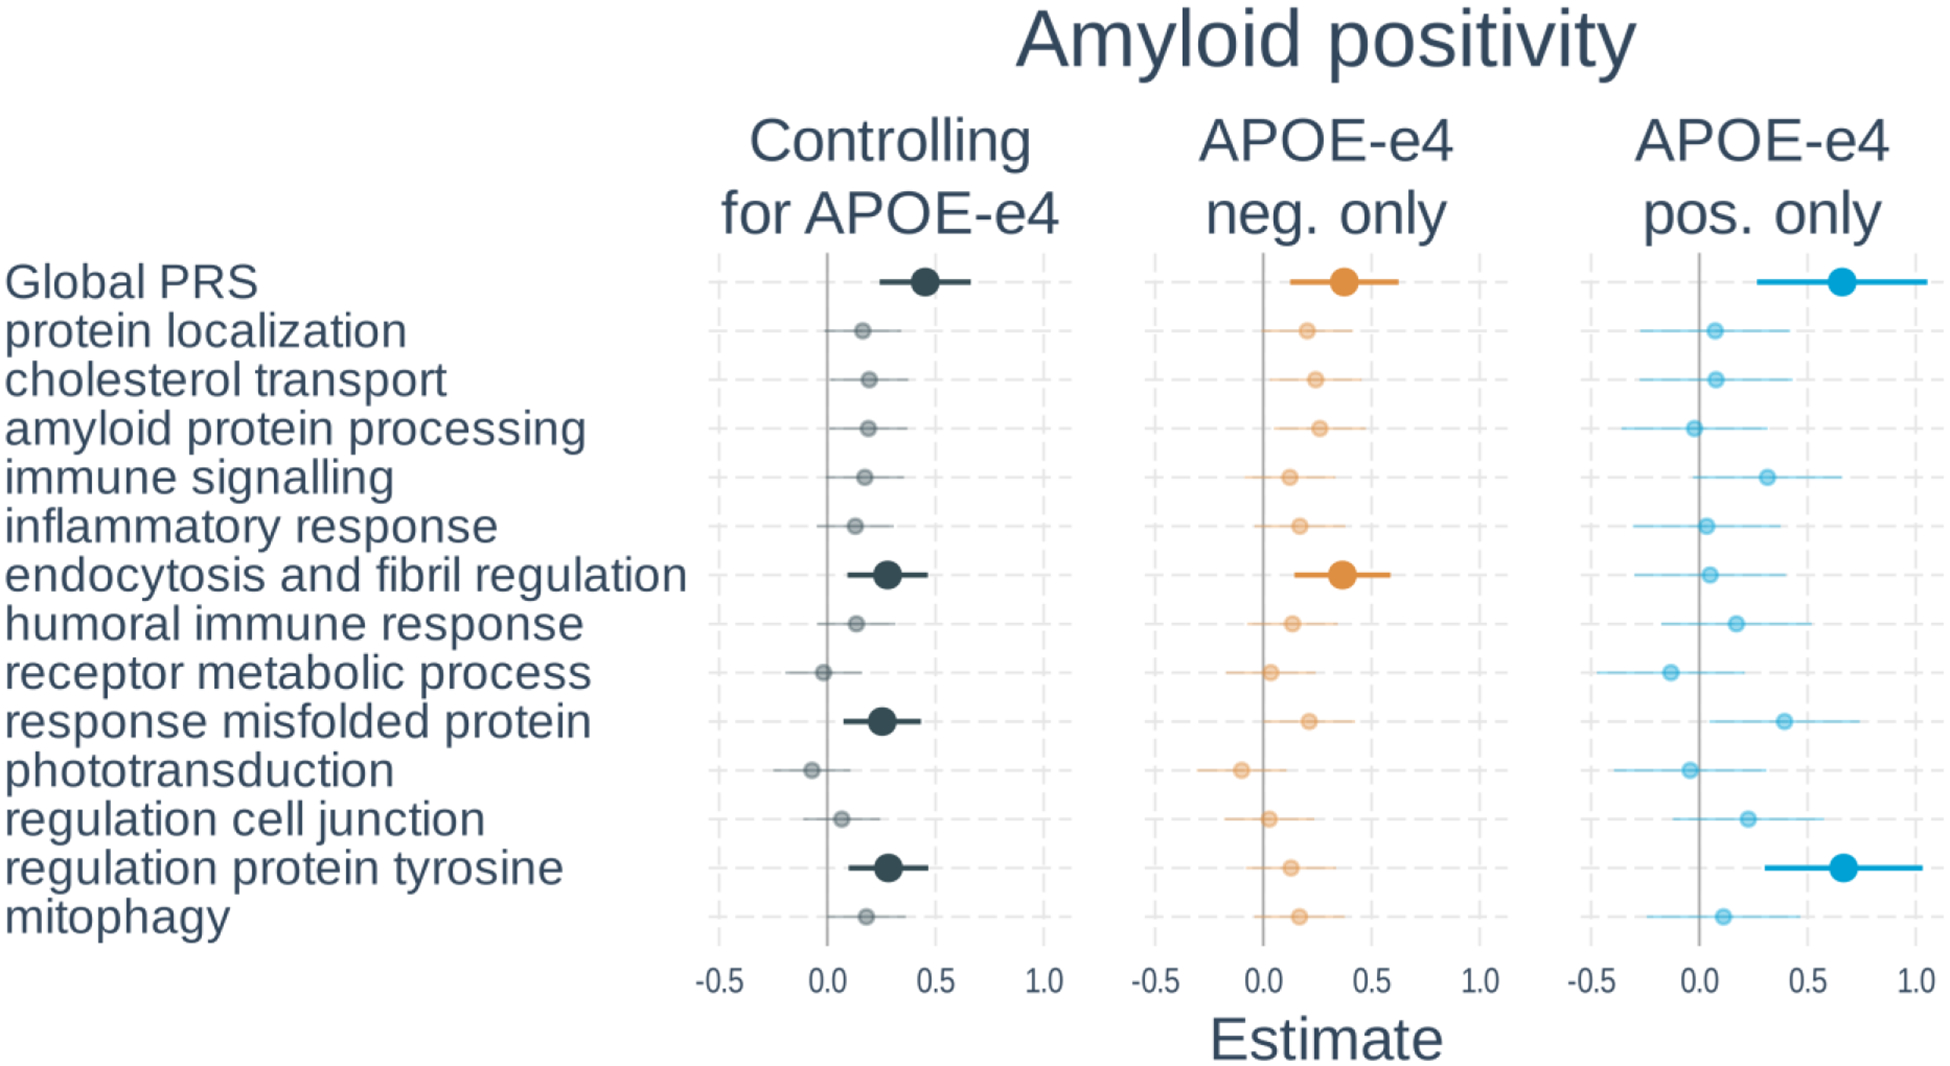
Logistic regressions were used with amyloid status (positive vs negative) as the outcome. Separate models used each PRS as predictor. Models either 1) included number of APOE-ε4 alleles as a separate variable, 2) tested only APOE-ε4 non-carriers, or 3) tested only APOE-ε4 carriers. All models adjusted for age, gender, and the first 3 genetic principal components. Plots show standardized regression coefficients (log-odds) and standard errors. Associations that survived FDR correction are bolded.
Associations with hippocampal volume
Full results of the associations with hippocampal volume are shown in Figure 4 and Supplementary Table S6. In models including PRS and APOE-ε4 status, a higher global PRS (β=−0.26, t-value=−6.88, p<0.001) and number of APOE-ε4 alleles (β=−0.24, t-value=−6.98, p<0.001) were significantly associated with smaller hippocampal volume. Two of the 13 pathway PRSs were significantly associated with tau status after correction for multiple comparisons. These included: protein localization and mitophagy. When examining APOE-ε4 non-carriers only, the global PRS and mitophagy PRS were significant. In APOE-ε4 carriers, only the global PRS was significant. The PRS effects were not significantly different between APOE-ε4 carrier and non-carriers.
Figure 4. Associations of polygenic risk scores with ptau positivity.
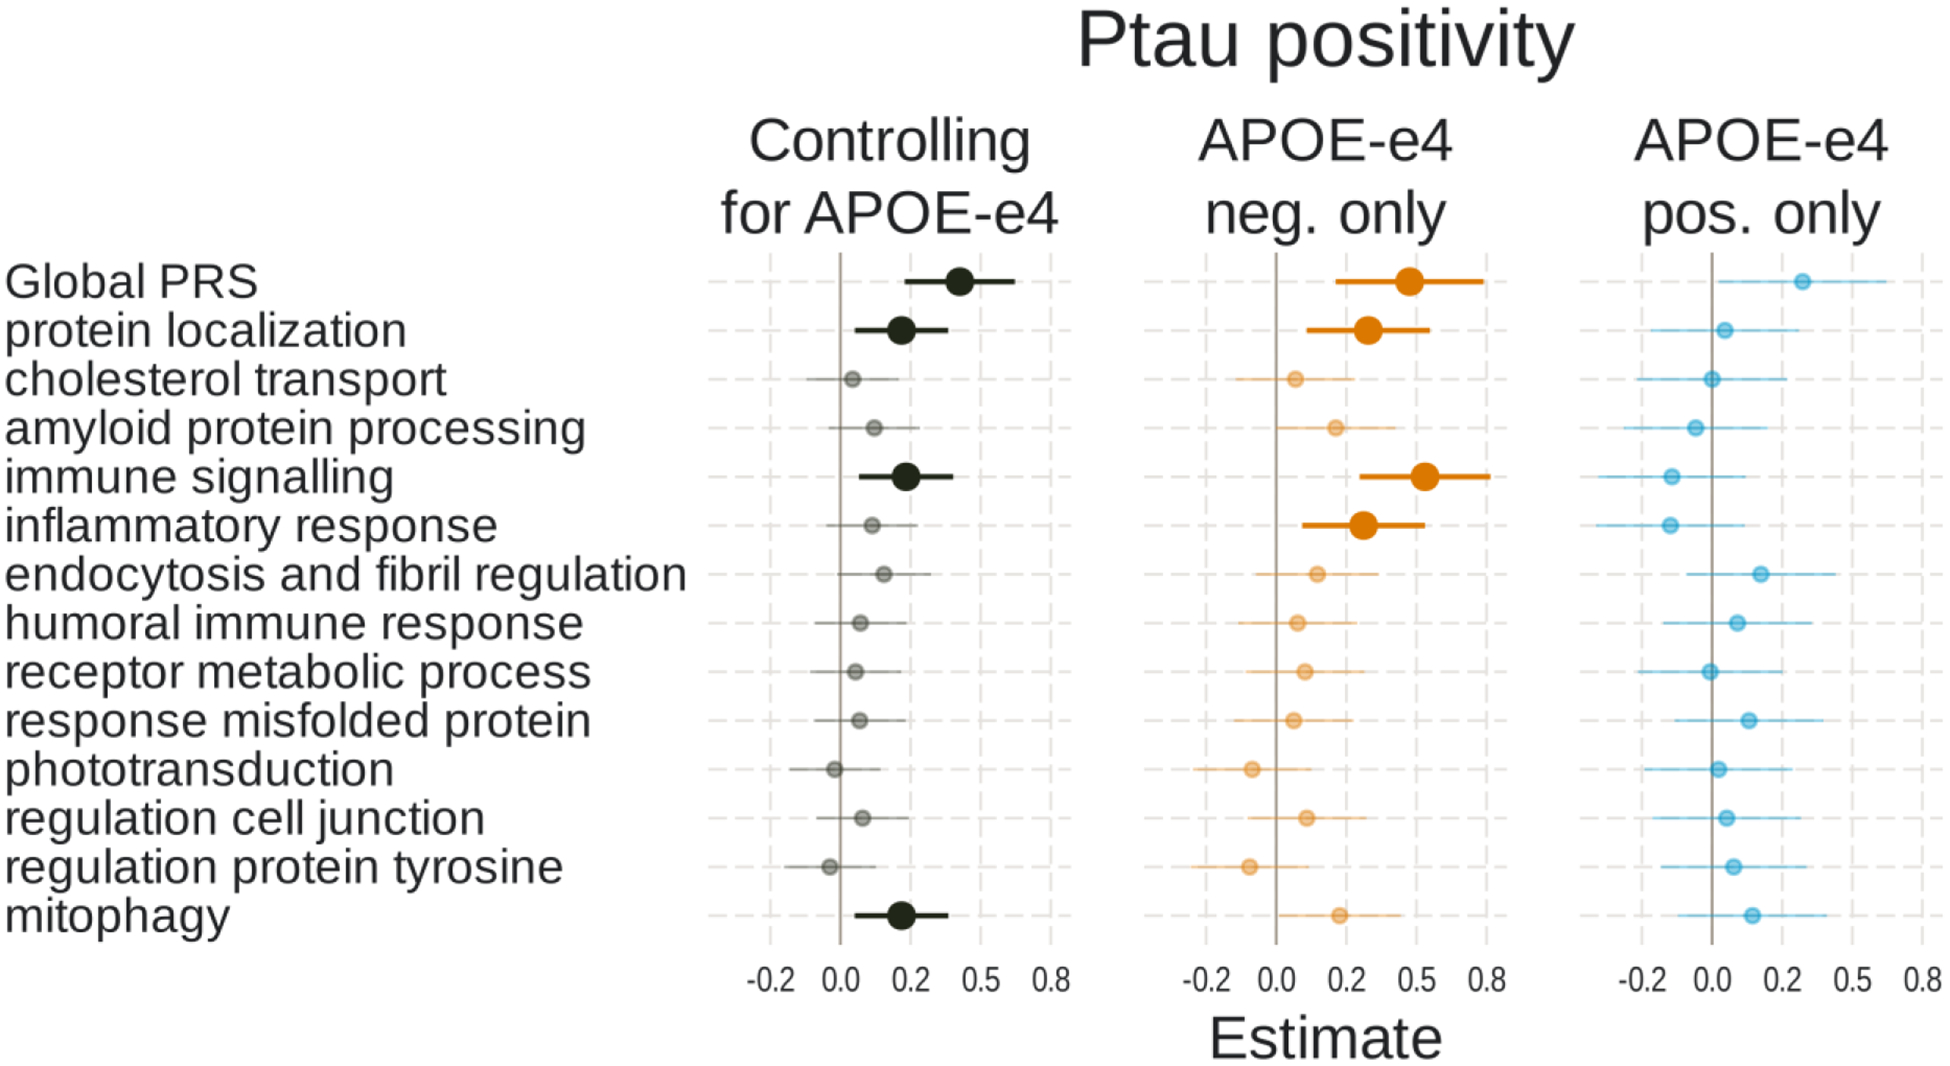
Logistic regressions were used with ptau status (positive vs negative) as the outcome. Separate models used each PRS as predictor. Models either 1) included number of APOE-ε4 alleles as a separate variable, 2) tested only APOE-ε4 non-carriers, or 3) tested only APOE-ε4 carriers. All models adjusted for age, gender, and the first 3 genetic principal components. Plots show standardized regression coefficients (log-odds) and standard errors. Associations that survived FDR correction are bolded.
DISCUSSION
The current results support and extend previous work disentangling the biological pathways contributing to Alzheimer’s disease risk and pathogenesis. Consistent with previous findings, we found that a global AD PRS was significantly associated with diagnostic status, amyloid and tau positivity, and hippocampal volume [9–13, 15, 17]. The global AD PRS captures the combined effects of multiple separable influences on disease risk and therefore is not useful for teasing apart genetically-mediated etiological differences among individuals. Several studies have examined the relationship of AD diagnosis or AD-related biomarkers with pathway-specific PRS calculated from GWAS-significant SNPs [36, 37, 39]. Here, we generated pathway-specific PRSs from clusters of gene sets and SNPs with association strength p-values falling below the threshold of GWAS significance. Breaking down the global effects of polygenic factors into more refined genetic pathway-associated subset of polygenes has been shown to provide useful information above-and-beyond variants with more pronounced effects arising from GWAS for certain conditions, including AD and MCI [8, 9, 14].
As expected, most of the pathway PRSs associated with AD diagnostic status in the current study correspond to pathways that have consistently been uncovered in previous GWAS. These pathways include amyloid precursor processing, immune and microglial response, endocytosis, cholesterol transport, lipid-protein complex and amyloid clearance [4, 6, 7, 21]. Several pathways of focus in our study, however, had less support from other GWAS, but have nonetheless been linked to AD in yet other studies. For example, the regulation cell junction and regulation protein tyrosine pathway-specific PRS we considered may capture effects of genes involved in synaptic functioning and cell signaling, consistent with studies suggesting this pathway is involved in AD-related cognitive decline [65, 66]. In addition, mitochondrial function has been proposed as playing a key role in the development of AD [67, 68], and mitophagy in particular may have widespread impacts on age-related disease, including Alzheimer’s disease [69]. Our results are also consistent with studies that have examined the association of pathway-specific PRS with AD diagnosis, including Aβ clearance, cholesterol transport, immune response, and endocytosis [19, 36, 37, 39, 40]
Amyloid positivity was significantly associated with pathway-specific PRS for endocytosis and fibril regulation, response to misfolded proteins, and regulation of protein tyrosine. The pathways associated with these PRSs are involved in the production, trafficking and clearance of Aβ peptides, as well as their aggregation into fibrils, which has biological plausibility. The endocytic pathway plays a key role in the amyloidogenic processing of APP as it is internalized to the intracellular space followed by cleavage into Aβ in the early endosome [70, 71]. Tyrosine kinases may be involved in both the trafficking of APP and upregulating BACE activity [72, 73]. In addition, genes encompassed by the response misfolded protein PRS that we find associated with AD pathology, include molecular chaperones (e.g., CLU) and the ubiquitin-proteasome system, which mediate degradation of abnormal and misfolded proteins [74–76]. A previous study examining pathway-PRS found that PRS related to Aβ clearance and cholesterol metabolism were also related to CSF and PET measures of amyloid; however, these scores only included GWAS-significant variants and the effects were primarily driven by APOE [37].
We also found that tau positivity was significantly associated with pathway PRSs for protein localization, immune signaling, and mitophagy. The protein localization pathway includes tau protein kinase activity, which may relate to abnormal hyperphosphorylation of tau [77]. Sun et al. [41] also found that a PRS reflecting the tau kinase activity was associated with CSF and PET measures of tau. Tau binds to microtubules to provide stabilization, but detaches when phosphorylated which can reduce axonal integrity and disrupt protein transport along the cytoskeleton [78]. Additionally, this unbound phosphorylated tau can aggregate into neurofibrillary tangles [79]. Regarding the PRS reflecting immune signaling, although inflammation can be secondary to abnormal tau, there is also evidence for an upstream role of glial activation and neuroinflammation in driving the accumulation and spread of tau [80, 81]. This is consistent with a previous finding that a PRS constructed from only GWAS significant variants related to immune response was associated with CSF tau [37]. As with inflammation, disruptions to mitophagy may be secondary to disease processes, but there is evidence for upstream roles of mitochondrial function, including mitophagy, in the development of AD pathology [68, 82]. Hippocampal volume was also associated with pathway PRSs for protein localization and mitophagy. Shared pathways with tau positivity and may reflect the tighter linkage between neurodegeneration and tau compared to amyloid [83, 84].
Our results are generally consistent with those of a recent GWAS on CSF measures of amyloid and tau [85]. The authors found little overlap in the loci associated with amyloid and tau aside from APOE. In contrast, there was overlap between loci associated with tau and ventricular volume, which can be used as an indicator of neurodegeneration. The authors also examined associations of AD-associated variants with CSF amyloid and tau, and a cluster analysis pursued by them identified patterns that were broadly similar to our own. For example, variants associated with CSF amyloid were associated with amyloid processing, endocytosis, and tyrosine kinase, whereas variants associated with CSF tau were linked to the immune system. Deriving PRSs based on GWAS of AD biomarkers represents a promising approach to index risk in specific pathways, but sample sizes for such studies are relatively small. PRSs based on pathway analysis of diagnosis-based GWAS are therefore a useful alternative that can leverage large case-control datasets to provide converging information.
Although we focused on APOE-independent sources of AD risk, it is important to note that the number of APOE-ε4 alleles had a comparable or even stronger (in the case of amyloid) effect on the outcomes as the polygenic component indexed with a PRS. APOE belonged to gene sets that were part of several cluster, including endocytosis and fibril regulation, protein localization, cholesterol transport, and amyloid protein processing. The variants falling within the APOE region were excluded from our PRSs, but this does suggest APOE can exert an impact through multiple routes. Stratifying based on APOE-ε4 carrier status suggested stronger effects of pathway PRSs on tau positivity in non-carriers. It may be that smaller polygenic effects are obscured in the presence of a larger APOE-related signal. Alternatively, APOE-ε4 may be sufficient to increase risk for tau pathology whereas those lacking this risk allele require additional sources of risk to develop abnormal levels of tau.
There are several additional items worth mentioning to put our analyses into context. First, we find evidence that the effect size of the global PRS is much larger than any pathway-specific PRS effect sizes in our analyses. While pathway-specific PRSs may be beneficial for understanding disease etiology, they do not appear to add predictive power when considered in the aggregate over-and-above the global PRS. Second, we mapped SNPs to genes using the standard position-based approach available in MAGMA. However, many GWAS SNPs are located in non-coding regions and may be associated with disease risk through their gene regulatory effects [86]. Thus, approaches that make use of information such as chromatin interactions [87] or expression quantitative trait loci [88] to determine which gene a variant present in a non-coding region affects may prove useful in developing pathway-specific PRS. Third, although the vast majority of genes/SNPs were associated with only one pathway, others were part of multiple pathway clusters, so the pathway PRSs are not entirely independent with each other. Fourth, we added interactions with diagnosis to all biomarker models to determine whether PRS associations differed by group. However, no interaction terms were significant after correcting for multiple comparisons and there did not appear to be a consistent pattern among the few interactions that reached nominal significant. Fifth, this analysis was restricted to those of European ancestry and results may not generalize to other ancestry groups. This is of particular importance because prior findings suggest that genetic effects on pathology and dementia risk may differ across ancestry groups [89–91]. There is also likely to be a complex interplay between pathway-specific genetic risk and environmental risk factors, and exposure to risk may be unequally distributed across ancestry groups due to partial overlap with systemic inequities associated with race and ethnicity. Finally, this analysis required choices of parameters at various steps, such as the p-value thresholds used to filter variants and gene sets, method used to construct PRS, and even which gene sets were used. We believe our choices represent a reasonable attempt to capture the broad sources of polygenic influence on AD risk while minimizing unrelated signal. However, alternative approaches may be equally valid and should be determined by the context of a given analysis.
Ultimately, we find evidence that some pathway-specific PRSs are associated with AD diagnostic status and A/T/N biomarkers. Our findings indicate that genetic risk for AD may exist along multiple dimensions, and the distribution of risk across pathways may influence phenotypic manifestations of the disease. Although a global PRS appears to provide superior predictive power overall, pathway-specific PRS analysis may help clarify aspects of the heterogeneity of AD pathogenesis. More broadly, the approach presented here can be applied to delineate pathway clusters for any trait for which a GWAS has been performed. Resulting pathway-specific scores may then be used to better understand the etiological heterogeneity of other complex diseases as well.
Supplementary Material
Figure 5. Associations of polygenic risk scores with hippocampal volume.
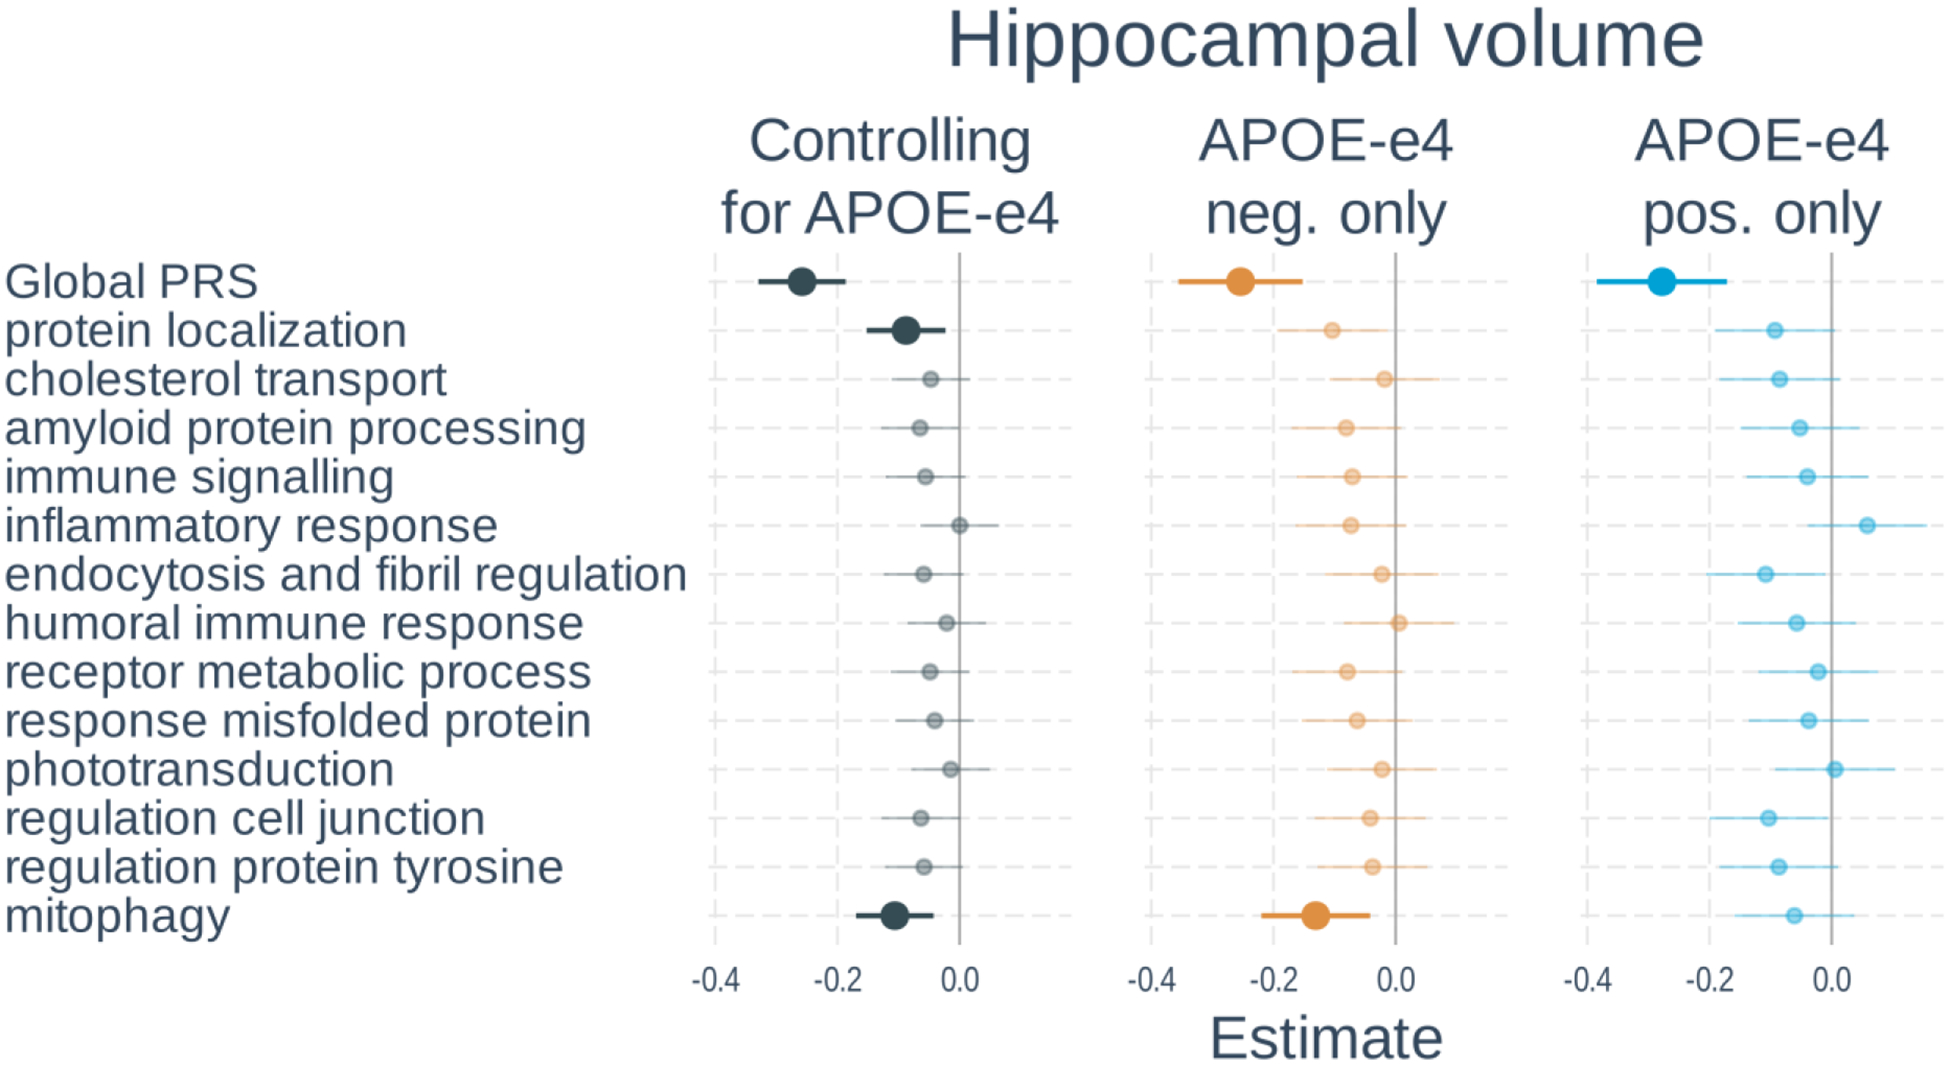
Linear regressions were used with hippocampal volume normalized by intracranial volume as the outcome. Separate models used each PRS as predictor. Models either 1) included number of APOE-ε4 alleles as a separate variable, 2) tested only APOE-ε4 non-carriers, or 3) tested only APOE-ε4 carriers. All models adjusted for age, gender, scanner field strength and the first 3 genetic principal components. Plots show standardized regression coefficients and standard errors. Associations that survived FDR correction are bolded.
Acknowledgements
Data collection and sharing for this project was funded by the Alzheimer’s Disease Neuroimaging Initiative (ADNI) (National Institutes of Health Grant U01 AG024904) and DOD ADNI (Department of Defense award number W81XWH-12-2-0012). ADNI is funded by the National Institute on Aging, the National Institute of Biomedical Imaging and Bioengineering, and through generous contributions from the following: AbbVie, Alzheimer’s Association; Alzheimer’s Drug Discovery Foundation; Araclon Biotech; BioClinica, Inc.; Biogen; Bristol-Myers Squibb Company; CereSpir, Inc.; Cogstate; Eisai Inc.; Elan Pharmaceuticals, Inc.; Eli Lilly and Company; EuroImmun; F. Hoffmann-La Roche Ltd and its affiliated company Genentech, Inc.; Fujirebio; GE Healthcare; IXICO Ltd.; Janssen Alzheimer Immunotherapy Research & Development, LLC.; Johnson & Johnson Pharmaceutical Research & Development LLC.; Lumosity; Lundbeck; Merck & Co., Inc.; Meso Scale Diagnostics, LLC.; NeuroRx Research; Neurotrack Technologies; Novartis Pharmaceuticals Corporation; Pfizer Inc.; Piramal Imaging; Servier; Takeda Pharmaceutical Company; and Transition Therapeutics. The Canadian Institutes of Health Research is providing funds to support ADNI clinical sites in Canada. Private sector contributions are facilitated by the Foundation for the National Institutes of Health (www.fnih.org). The grantee organization is the Northern California Institute for Research and Education, and the study is coordinated by the Alzheimer’s Therapeutic Research Institute at the University of Southern California. ADNI data are disseminated by the Laboratory for Neuro Imaging at the University of Southern California.
The funding agencies had no role in the design and conduct of the study; collection, management, analysis, and interpretation of the data; preparation, review, or approval of the manuscript; and decision to submit the manuscript for publication.
Funding
This work was supported by National Institute on Aging grants: K01 AG063805 (JAE), UH3-AG064706 (NJS), U19 AG023122 (NJS), U19 AG065169 (NJS) and U24 AG078753 (NJS).
Footnotes
Conflict of Interest
The authors have no conflict of interest to report.
Data Availability
Data used in this article can be downloaded from the Alzheimer’s Disease Neuroimaging Initiative (ADNI) database at adni.loni.usc.edu. Code used in these analyses is available at https://github.com/jelman/pathwayPRS_paper.git.
REFERENCES
- [1].Gatz M, Reynolds CA, Fratiglioni L, Johansson B, Mortimer JA, Berg S, Fiske A, Pedersen NL (2006) Role of genes and environments for explaining Alzheimer disease. Arch Gen Psychiatry 63, 168–174. [DOI] [PubMed] [Google Scholar]
- [2].Corder EH, Saunders AM, Strittmatter WJ, Schmechel DE, Gaskell PC, Small GW, Roses AD, Haines JL, Pericak-Vance MA (1993) Gene dose of apolipoprotein E type 4 allele and the risk of Alzheimer’s disease in late onset families. Science 261, 921–923. [DOI] [PubMed] [Google Scholar]
- [3].Harold D, Abraham R, Hollingworth P, Sims R, Gerrish A, Hamshere ML, Pahwa JS, Moskvina V, Dowzell K, Williams A, Jones N, Thomas C, Stretton A, Morgan AR, Lovestone S, Powell J, Proitsi P, Lupton MK, Brayne C, Rubinsztein DC, Gill M, Lawlor B, Lynch A, Morgan K, Brown KS, Passmore PA, Craig D, McGuinness B, Todd S, Holmes C, Mann D, Smith AD, Love S, Kehoe PG, Hardy J, Mead S, Fox N, Rossor M, Collinge J, Maier W, Jessen F, Schurmann B, Heun R, van den Bussche H, Heuser I, Kornhuber J, Wiltfang J, Dichgans M, Frolich L, Hampel H, Hull M, Rujescu D, Goate AM, Kauwe JS, Cruchaga C, Nowotny P, Morris JC, Mayo K, Sleegers K, Bettens K, Engelborghs S, De Deyn PP, Van Broeckhoven C, Livingston G, Bass NJ, Gurling H, McQuillin A, Gwilliam R, Deloukas P, Al-Chalabi A, Shaw CE, Tsolaki M, Singleton AB, Guerreiro R, Muhleisen TW, Nothen MM, Moebus S, Jockel KH, Klopp N, Wichmann HE, Carrasquillo MM, Pankratz VS, Younkin SG, Holmans PA, O’Donovan M, Owen MJ, Williams J (2009) Genome-wide association study identifies variants at CLU and PICALM associated with Alzheimer’s disease. Nat Genet 41, 1088–1093. [DOI] [PMC free article] [PubMed] [Google Scholar]
- [4].Kunkle BW, Grenier-Boley B, Sims R, Bis JC, Damotte V, Naj AC, Boland A, Vronskaya M, van der Lee SJ, Amlie-Wolf A, Bellenguez C, Frizatti A, Chouraki V, Martin ER, Sleegers K, Badarinarayan N, Jakobsdottir J, Hamilton-Nelson KL, Moreno-Grau S, Olaso R, Raybould R, Chen Y, Kuzma AB, Hiltunen M, Morgan T, Ahmad S, Vardarajan BN, Epelbaum J, Hoffmann P, Boada M, Beecham GW, Garnier JG, Harold D, Fitzpatrick AL, Valladares O, Moutet ML, Gerrish A, Smith AV, Qu L, Bacq D, Denning N, Jian X, Zhao Y, Del Zompo M, Fox NC, Choi SH, Mateo I, Hughes JT, Adams HH, Malamon J, Sanchez-Garcia F, Patel Y, Brody JA, Dombroski BA, Naranjo MCD, Daniilidou M, Eiriksdottir G, Mukherjee S, Wallon D, Uphill J, Aspelund T, Cantwell LB, Garzia F, Galimberti D, Hofer E, Butkiewicz M, Fin B, Scarpini E, Sarnowski C, Bush WS, Meslage S, Kornhuber J, White CC, Song Y, Barber RC, Engelborghs S, Sordon S, Voijnovic D, Adams PM, Vandenberghe R, Mayhaus M, Cupples LA, Albert MS, De Deyn PP, Gu W, Himali JJ, Beekly D, Squassina A, Hartmann AM, Orellana A, Blacker D, Rodriguez-Rodriguez E, Lovestone S, Garcia ME, Doody RS, Munoz-Fernadez C, Sussams R, Lin H, Fairchild TJ, Benito YA, Holmes C, Karamujic-Comic H, Frosch MP, Thonberg H, Maier W, Roshchupkin G, Ghetti B, Giedraitis V, Kawalia A, Li S, Huebinger RM, Kilander L, Moebus S, Hernandez I, Kamboh MI, Brundin R, Turton J, Yang Q, Katz MJ, Concari L, Lord J, Beiser AS, Keene CD, Helisalmi S, Kloszewska I, Kukull WA, Koivisto AM, Lynch A, Tarraga L, Larson EB, Haapasalo A, Lawlor B, Mosley TH, Lipton RB, Solfrizzi V, Gill M, Longstreth WT Jr., Montine TJ, Frisardi V, Diez-Fairen M, Rivadeneira F, Petersen RC, Deramecourt V, Alvarez I, Salani F, Ciaramella A, Boerwinkle E, Reiman EM, Fievet N, Rotter JI, Reisch JS, Hanon O, Cupidi C, Andre Uitterlinden AG, Royall DR, Dufouil C, Maletta RG, de Rojas I, Sano M, Brice A, Cecchetti R, George-Hyslop PS, Ritchie K, Tsolaki M, Tsuang DW, Dubois B, Craig D, Wu CK, Soininen H, Avramidou D, Albin RL, Fratiglioni L, Germanou A, Apostolova LG, Keller L, Koutroumani M, Arnold SE, Panza F, Gkatzima O, Asthana S, Hannequin D, Whitehead P, Atwood CS, Caffarra P, Hampel H, Quintela I, Carracedo A, Lannfelt L, Rubinsztein DC, Barnes LL, Pasquier F, Frolich L, Barral S, McGuinness B, Beach TG, Johnston JA, Becker JT, Passmore P, Bigio EH, Schott JM, Bird TD, Warren JD, Boeve BF, Lupton MK, Bowen JD, Proitsi P, Boxer A, Powell JF, Burke JR Jr., Kauwe JSK, Burns JM, Mancuso M, Buxbaum JD, Bonuccelli U, Cairns NJ, McQuillin A, Cao C, Livingston G, Carlson CS, Bass NJ, Carlsson CM, Hardy J, Carney RM, Bras J, Carrasquillo MM, Guerreiro R, Allen M, Chui HC, Fisher E, Masullo C, Crocco EA, DeCarli C, Bisceglio G, Dick M, Ma L, Duara R, Graff-Radford NR, Evans DA, Hodges A, Faber KM, Scherer M, Fallon KB, Riemenschneider M, Fardo DW, Heun R, Farlow MR, Kolsch H, Ferris S, Leber M, Foroud TM, Heuser I, Galasko DR, Giegling I, Gearing M, Hull M, Geschwind DH, Gilbert JR, Morris J, Green RC, Mayo K, Growdon JH, Feulner T, Hamilton RL, Harrell LE, Drichel D, Honig LS, Cushion TD, Huentelman MJ, Hollingworth P, Hulette CM, Hyman BT, Marshall R, Jarvik GP, Meggy A, Abner E, Menzies GE, Jin LW, Leonenko G, Real LM, Jun GR, Baldwin CT, Grozeva D, Karydas A, Russo G, Kaye JA, Kim R, Jessen F, Kowall NW, Vellas B, Kramer JH, Vardy E, LaFerla FM, Jockel KH, Lah JJ, Dichgans M, Leverenz JB, Mann D, Levey AI, Pickering-Brown S, Lieberman AP, Klopp N, Lunetta KL, Wichmann HE, Lyketsos CG, Morgan K, Marson DC, Brown K, Martiniuk F, Medway C, Mash DC, Nothen MM, Masliah E, Hooper NM, McCormick WC, Daniele A, McCurry SM, Bayer A, McDavid AN, Gallacher J, McKee AC, van den Bussche H, Mesulam M, Brayne C, Miller BL, Riedel-Heller S, Miller CA, Miller JW, Al-Chalabi A, Morris JC, Shaw CE, Myers AJ, Wiltfang J, O’Bryant S, Olichney JM, Alvarez V, Parisi JE, Singleton AB, Paulson HL, Collinge J, Perry WR, Mead S, Peskind E, Cribbs DH, Rossor M, Pierce A, Ryan NS, Poon WW, Nacmias B, Potter H, Sorbi S, Quinn JF, Sacchinelli E, Raj A, Spalletta G, Raskind M, Caltagirone C, Bossu P, Orfei MD, Reisberg B, Clarke R, Reitz C, Smith AD, Ringman JM, Warden D, Roberson ED, Wilcock G, Rogaeva E, Bruni AC, Rosen HJ, Gallo M, Rosenberg RN, Ben-Shlomo Y, Sager MA, Mecocci P, Saykin AJ, Pastor P, Cuccaro ML, Vance JM, Schneider JA, Schneider LS, Slifer S, Seeley WW, Smith AG, Sonnen JA, Spina S, Stern RA, Swerdlow RH, Tang M, Tanzi RE, Trojanowski JQ, Troncoso JC, Van Deerlin VM, Van Eldik LJ, Vinters HV, Vonsattel JP, Weintraub S, Welsh-Bohmer KA, Wilhelmsen KC, Williamson J, Wingo TS, Woltjer RL, Wright CB, Yu CE, Yu L, Saba Y, Pilotto A, Bullido MJ, Peters O, Crane PK, Bennett D, Bosco P, Coto E, Boccardi V, De Jager PL, Lleo A, Warner N, Lopez OL, Ingelsson M, Deloukas P, Cruchaga C, Graff C, Gwilliam R, Fornage M, Goate AM, Sanchez-Juan P, Kehoe PG, Amin N, Ertekin-Taner N, Berr C, Debette S, Love S, Launer LJ, Younkin SG, Dartigues JF, Corcoran C, Ikram MA, Dickson DW, Nicolas G, Campion D, Tschanz J, Schmidt H, Hakonarson H, Clarimon J, Munger R, Schmidt R, Farrer LA, Van Broeckhoven C, COD M, DeStefano AL, Jones L, Haines JL, Deleuze JF, Owen MJ, Gudnason V, Mayeux R, Escott-Price V, Psaty BM, Ramirez A, Wang LS, Ruiz A, van Duijn CM, Holmans PA, Seshadri S, Williams J, Amouyel P, Schellenberg GD, Lambert JC, Pericak-Vance MA, Alzheimer Disease Genetics C, European Alzheimer’s Disease I, Cohorts for H, Aging Research in Genomic Epidemiology C, Genetic, Environmental Risk in Ad/Defining Genetic P, Environmental Risk for Alzheimer’s Disease C (2019) Genetic meta-analysis of diagnosed Alzheimer’s disease identifies new risk loci and implicates Abeta, tau, immunity and lipid processing. Nat Genet 51, 414–430. [DOI] [PMC free article] [PubMed] [Google Scholar]
- [5].Lambert JC, Ibrahim-Verbaas CA, Harold D, Naj AC, Sims R, Bellenguez C, DeStafano AL, Bis JC, Beecham GW, Grenier-Boley B, Russo G, Thorton-Wells TA, Jones N, Smith AV, Chouraki V, Thomas C, Ikram MA, Zelenika D, Vardarajan BN, Kamatani Y, Lin CF, Gerrish A, Schmidt H, Kunkle B, Dunstan ML, Ruiz A, Bihoreau MT, Choi SH, Reitz C, Pasquier F, Cruchaga C, Craig D, Amin N, Berr C, Lopez OL, De Jager PL, Deramecourt V, Johnston JA, Evans D, Lovestone S, Letenneur L, Moron FJ, Rubinsztein DC, Eiriksdottir G, Sleegers K, Goate AM, Fievet N, Huentelman MW, Gill M, Brown K, Kamboh MI, Keller L, Barberger-Gateau P, McGuiness B, Larson EB, Green R, Myers AJ, Dufouil C, Todd S, Wallon D, Love S, Rogaeva E, Gallacher J, St George-Hyslop P, Clarimon J, Lleo A, Bayer A, Tsuang DW, Yu L, Tsolaki M, Bossu P, Spalletta G, Proitsi P, Collinge J, Sorbi S, Sanchez-Garcia F, Fox NC, Hardy J, Deniz Naranjo MC, Bosco P, Clarke R, Brayne C, Galimberti D, Mancuso M, Matthews F, European Alzheimer’s Disease I, Genetic, Environmental Risk in Alzheimer’s D, Alzheimer’s Disease Genetic C, Cohorts for H, Aging Research in Genomic E, Moebus S, Mecocci P, Del Zompo M, Maier W, Hampel H, Pilotto A, Bullido M, Panza F, Caffarra P, Nacmias B, Gilbert JR, Mayhaus M, Lannefelt L, Hakonarson H, Pichler S, Carrasquillo MM, Ingelsson M, Beekly D, Alvarez V, Zou F, Valladares O, Younkin SG, Coto E, Hamilton-Nelson KL, Gu W, Razquin C, Pastor P, Mateo I, Owen MJ, Faber KM, Jonsson PV, Combarros O, O’Donovan MC, Cantwell LB, Soininen H, Blacker D, Mead S, Mosley TH Jr., Bennett DA, Harris TB, Fratiglioni L, Holmes C, de Bruijn RF, Passmore P, Montine TJ, Bettens K, Rotter JI, Brice A, Morgan K, Foroud TM, Kukull WA, Hannequin D, Powell JF, Nalls MA, Ritchie K, Lunetta KL, Kauwe JS, Boerwinkle E, Riemenschneider M, Boada M, Hiltuenen M, Martin ER, Schmidt R, Rujescu D, Wang LS, Dartigues JF, Mayeux R, Tzourio C, Hofman A, Nothen MM, Graff C, Psaty BM, Jones L, Haines JL, Holmans PA, Lathrop M, Pericak-Vance MA, Launer LJ, Farrer LA, van Duijn CM, Van Broeckhoven C, Moskvina V, Seshadri S, Williams J, Schellenberg GD, Amouyel P (2013) Meta-analysis of 74,046 individuals identifies 11 new susceptibility loci for Alzheimer’s disease. Nat Genet 45, 1452–1458. [DOI] [PMC free article] [PubMed] [Google Scholar]
- [6].Jansen IE, Savage JE, Watanabe K, Bryois J, Williams DM, Steinberg S, Sealock J, Karlsson IK, Hagg S, Athanasiu L, Voyle N, Proitsi P, Witoelar A, Stringer S, Aarsland D, Almdahl IS, Andersen F, Bergh S, Bettella F, Bjornsson S, Braekhus A, Brathen G, de Leeuw C, Desikan RS, Djurovic S, Dumitrescu L, Fladby T, Hohman TJ, Jonsson PV, Kiddle SJ, Rongve A, Saltvedt I, Sando SB, Selbaek G, Shoai M, Skene NG, Snaedal J, Stordal E, Ulstein ID, Wang Y, White LR, Hardy J, Hjerling-Leffler J, Sullivan PF, van der Flier WM, Dobson R, Davis LK, Stefansson H, Stefansson K, Pedersen NL, Ripke S, Andreassen OA, Posthuma D (2019) Genome-wide meta-analysis identifies new loci and functional pathways influencing Alzheimer’s disease risk. Nat Genet. [DOI] [PMC free article] [PubMed] [Google Scholar]
- [7].Bellenguez C, Küçükali F, Jansen IE, Kleineidam L, Moreno-Grau S, Amin N, Naj AC, Campos-Martin R, Grenier-Boley B, Andrade V, Holmans PA, Boland A, Damotte V, van der Lee SJ, Costa MR, Kuulasmaa T, Yang Q, de Rojas I, Bis JC, Yaqub A, Prokic I, Chapuis J, Ahmad S, Giedraitis V, Aarsland D, Garcia-Gonzalez P, Abdelnour C, Alarcón-Martín E, Alcolea D, Alegret M, Alvarez I, Álvarez V, Armstrong NJ, Tsolaki A, Antúnez C, Appollonio I, Arcaro M, Archetti S, Pastor AA, Arosio B, Athanasiu L, Bailly H, Banaj N, Baquero M, Barral S, Beiser A, Pastor AB, Below JE, Benchek P, Benussi L, Berr C, Besse C, Bessi V, Binetti G, Bizarro A, Blesa R, Boada M, Boerwinkle E, Borroni B, Boschi S, Bossù P, Bråthen G, Bressler J, Bresner C, Brodaty H, Brookes KJ, Brusco LI, Buiza-Rueda D, Bûrger K, Burholt V, Bush WS, Calero M, Cantwell LB, Chene G, Chung J, Cuccaro ML, Carracedo Á, Cecchetti R, Cervera-Carles L, Charbonnier C, Chen H-H, Chillotti C, Ciccone S, Claassen JAHR, Clark C, Conti E, Corma-Gómez A, Costantini E, Custodero C, Daian D, Dalmasso MC, Daniele A, Dardiotis E, Dartigues J-F, de Deyn PP, de Paiva Lopes K, de Witte LD, Debette S, Deckert J, del Ser T, Denning N, DeStefano A, Dichgans M, Diehl-Schmid J, Diez-Fairen M, Rossi PD, Djurovic S, Duron E, Düzel E, Dufouil C, Eiriksdottir G, Engelborghs S, Escott-Price V, Espinosa A, Ewers M, Faber KM, Fabrizio T, Nielsen SF, Fardo DW, Farotti L, Fenoglio C, Fernández-Fuertes M, Ferrari R, Ferreira CB, Ferri E, Fin B, Fischer P, Fladby T, Fließbach K, Fongang B, Fornage M, Fortea J, Foroud TM, Fostinelli S, Fox NC, Franco-Macías E, Bullido MJ, Frank-García A, Froelich L, Fulton-Howard B, Galimberti D, García-Alberca JM, García-González P, Garcia-Madrona S, Garcia-Ribas G, Ghidoni R, Giegling I, Giorgio G, Goate AM, Goldhardt O, Gomez-Fonseca D, González-Pérez A, Graff C, Grande G, Green E, Grimmer T, Grünblatt E, Grunin M, Gudnason V, Guetta-Baranes T, Haapasalo A, Hadjigeorgiou G, Haines JL, Hamilton-Nelson KL, Hampel H, Hanon O, Hardy J, Hartmann AM, Hausner L, Harwood J, Heilmann-Heimbach S, Helisalmi S, Heneka MT, Hernández I, Herrmann MJ, Hoffmann P, Holmes C, Holstege H, Vilas RH, Hulsman M, Humphrey J, Biessels GJ, Jian X, Johansson C, Jun GR, Kastumata Y, Kauwe J, Kehoe PG, Kilander L, Ståhlbom AK, Kivipelto M, Koivisto A, Kornhuber J, Kosmidis MH, Kukull WA, Kuksa PP, Kunkle BW, Kuzma AB, Lage C, Laukka EJ, Launer L, Lauria A, Lee C-Y, Lehtisalo J, Lerch O, Lleó A, Longstreth W, Lopez O, de Munain AL, Love S, Löwemark M, Luckcuck L, Lunetta KL, Ma Y, Macías J, MacLeod CA, Maier W, Mangialasche F, Spallazzi M, Marquié M, Marshall R, Martin ER, Montes AM, Rodríguez CM, Masullo C, Mayeux R, Mead S, Mecocci P, Medina M, Meggy A, Mehrabian S, Mendoza S, Menéndez-González M, Mir P, Moebus S, Mol M, Molina-Porcel L, Montrreal L, Morelli L, Moreno F, Morgan K, Mosley T, Nöthen MM, Muchnik C, Mukherjee S, Nacmias B, Ngandu T, Nicolas G, Nordestgaard BG, Olaso R, Orellana A, Orsini M, Ortega G, Padovani A, Paolo C, Papenberg G, Parnetti L, Pasquier F, Pastor P, Peloso G, Pérez-Cordón A, Pérez-Tur J, Pericard P, Peters O, Pijnenburg YAL, Pineda JA, Piñol-Ripoll G, Pisanu C, Polak T, Popp J, Posthuma D, Priller J, Puerta R, Quenez O, Quintela I, Thomassen JQ, Rábano A, Rainero I, Rajabli F, Ramakers I, Real LM, Reinders MJT, Reitz C, Reyes-Dumeyer D, Ridge P, Riedel-Heller S, Riederer P, Roberto N, Rodriguez-Rodriguez E, Rongve A, Allende IR, Rosende-Roca M, Royo JL, Rubino E, Rujescu D, Sáez ME, Sakka P, Saltvedt I, Sanabria Á, Sánchez-Arjona MB (2022) New insights into the genetic etiology of Alzheimer’s disease and related dementias. Nature Genetics. [DOI] [PMC free article] [PubMed] [Google Scholar]
- [8].International Schizophrenia C, Purcell SM, Wray NR, Stone JL, Visscher PM, O’Donovan MC, Sullivan PF, Sklar P (2009) Common polygenic variation contributes to risk of schizophrenia and bipolar disorder. Nature 460, 748–752. [DOI] [PMC free article] [PubMed] [Google Scholar]
- [9].Escott-Price V, Sims R, Bannister C, Harold D, Vronskaya M, Majounie E, Badarinarayan N, Gerad/Perades, consortia I, Morgan K, Passmore P, Holmes C, Powell J, Brayne C, Gill M, Mead S, Goate A, Cruchaga C, Lambert JC, van Duijn C, Maier W, Ramirez A, Holmans P, Jones L, Hardy J, Seshadri S, Schellenberg GD, Amouyel P, Williams J (2015) Common polygenic variation enhances risk prediction for Alzheimer’s disease. Brain 138, 3673–3684. [DOI] [PMC free article] [PubMed] [Google Scholar]
- [10].Louwersheimer E, Wolfsgruber S, Espinosa A, Lacour A, Heilmann-Heimbach S, Alegret M, Hernandez I, Rosende-Roca M, Tarraga L, Boada M, Kornhuber J, Peters O, Frolich L, Hull M, Ruther E, Wiltfang J, Scherer M, Riedel-Heller S, Jessen F, Nothen MM, Maier W, Koene T, Scheltens P, Holstege H, Wagner M, Ruiz A, van der Flier WM, Becker T, Ramirez A (2016) Alzheimer’s disease risk variants modulate endophenotypes in mild cognitive impairment. Alzheimers Dement 12, 872–881. [DOI] [PubMed] [Google Scholar]
- [11].Da X, Toledo JB, Zee J, Wolk DA, Xie SX, Ou Y, Shacklett A, Parmpi P, Shaw L, Trojanowski JQ, Davatzikos C, Alzheimer’s Neuroimaging I (2014) Integration and relative value of biomarkers for prediction of MCI to AD progression: spatial patterns of brain atrophy, cognitive scores, APOE genotype and CSF biomarkers. Neuroimage Clin 4, 164–173. [DOI] [PMC free article] [PubMed] [Google Scholar]
- [12].Kauppi K, Ronnlund M, Nordin Adolfsson A, Pudas S, Adolfsson R (2020) Effects of polygenic risk for Alzheimer’s disease on rate of cognitive decline in normal aging. Transl Psychiatry 10, 250. [DOI] [PMC free article] [PubMed] [Google Scholar]
- [13].Hannon E, Shireby GL, Brookes K, Attems J, Sims R, Cairns NJ, Love S, Thomas AJ, Morgan K, Francis PT, Mill J (2020) Genetic risk for Alzheimer’s disease influences neuropathology via multiple biological pathways. Brain Communications 2. [DOI] [PMC free article] [PubMed] [Google Scholar]
- [14].Logue MW, Panizzon MS, Elman JA, Gillespie NA, Hatton SN, Gustavson DE, Andreassen OA, Dale AM, Franz CE, Lyons MJ, Neale MC, Reynolds CA, Tu X, Kremen WS (2019) Use of an Alzheimer’s disease polygenic risk score to identify mild cognitive impairment in adults in their 50s. Mol Psychiatry 24, 421–430. [DOI] [PMC free article] [PubMed] [Google Scholar]
- [15].Mormino EC, Sperling RA, Holmes AJ, Buckner RL, De Jager PL, Smoller JW, Sabuncu MR, Initi AsDN (2016) Polygenic risk of Alzheimer disease is associated with early- and late-life processes. Neurology 87, 481–488. [DOI] [PMC free article] [PubMed] [Google Scholar]
- [16].Walhovd KB, Fjell AM, Sørensen Ø, Mowinckel AM, Reinbold CS, Idland A-V, Watne LO, Franke A, Dobricic V, Kilpert F, Bertram L, Wang Y (2020) Genetic risk for Alzheimer disease predicts hippocampal volume through the human lifespan. Neurology Genetics 6, e506. [DOI] [PMC free article] [PubMed] [Google Scholar]
- [17].Ge T, Sabuncu MR, Smoller JW, Sperling RA, Mormino EC, Alzheimer’s Disease Neuroimaging I (2018) Dissociable influences of APOE epsilon4 and polygenic risk of AD dementia on amyloid and cognition. Neurology 90, e1605–e1612. [DOI] [PMC free article] [PubMed] [Google Scholar]
- [18].Mattsson N, Eriksson O, Lindberg O, Schöll M, Lampinen B, Nilsson M, Insel PS, Lautner R, Strandberg O, van Westen D, Zetterberg H, Blennow K, Palmqvist S, Stomrud E, Hansson O (2018) Effects of APOE ε4 on neuroimaging, cerebrospinal fluid biomarkers, and cognition in prodromal Alzheimer’s disease. Neurobiology of Aging 71, 81–90. [DOI] [PubMed] [Google Scholar]
- [19].Leonenko G, Shoai M, Bellou E, Sims R, Williams J, Hardy J, Escott-Price V, Alzheimer’s Disease Neuroimaging I (2019) Genetic risk for Alzheimer’s disease is distinct from genetic risk for amyloid deposition. Ann Neurol 0. [DOI] [PMC free article] [PubMed] [Google Scholar]
- [20].Seto M, Weiner RL, Dumitrescu L, Hohman TJ (2021) Protective genes and pathways in Alzheimer’s disease: moving towards precision interventions. Mol Neurodegener 16, 29. [DOI] [PMC free article] [PubMed] [Google Scholar]
- [21].Sims R, Hill M, Williams J (2020) The multiplex model of the genetics of Alzheimer’s disease. Nat Neurosci 23, 311–322. [DOI] [PubMed] [Google Scholar]
- [22].Fernandez-Calle R, Konings SC, Frontinan-Rubio J, Garcia-Revilla J, Camprubi-Ferrer L, Svensson M, Martinson I, Boza-Serrano A, Venero JL, Nielsen HM, Gouras GK, Deierborg T (2022) APOE in the bullseye of neurodegenerative diseases: impact of the APOE genotype in Alzheimer’s disease pathology and brain diseases. Mol Neurodegener 17, 62. [DOI] [PMC free article] [PubMed] [Google Scholar]
- [23].Scheltens NME, Tijms BM, Koene T, Barkhof F, Teunissen CE, Wolfsgruber S, Wagner M, Kornhuber J, Peters O, Cohn-Sheehy BI, Rabinovici GD, Miller BL, Kramer JH, Scheltens P, van der Flier WM, Alzheimer’s Disease Neuroimaging I, German Dementia Competence N, University of California San Francisco M, Aging C, Amsterdam Dementia C (2017) Cognitive subtypes of probable Alzheimer’s disease robustly identified in four cohorts. Alzheimers Dement. [DOI] [PMC free article] [PubMed] [Google Scholar]
- [24].Graff-Radford J, Yong KXX, Apostolova LG, Bouwman FH, Carrillo M, Dickerson BC, Rabinovici GD, Schott JM, Jones DT, Murray ME (2021) New insights into atypical Alzheimer’s disease in the era of biomarkers. The Lancet Neurology 20, 222–234. [DOI] [PMC free article] [PubMed] [Google Scholar]
- [25].Dubois B, Feldman HH, Jacova C, Hampel H, Molinuevo JL, Blennow K, DeKosky ST, Gauthier S, Selkoe D, Bateman R, Cappa S, Crutch S, Engelborghs S, Frisoni GB, Fox NC, Galasko D, Habert MO, Jicha GA, Nordberg A, Pasquier F, Rabinovici G, Robert P, Rowe C, Salloway S, Sarazin M, Epelbaum S, de Souza LC, Vellas B, Visser PJ, Schneider L, Stern Y, Scheltens P, Cummings JL (2014) Advancing research diagnostic criteria for Alzheimer’s disease: the IWG-2 criteria. Lancet Neurol 13, 614–629. [DOI] [PubMed] [Google Scholar]
- [26].Collij LE, Salvado G, Wottschel V, Mastenbroek SE, Schoenmakers P, Heeman F, Aksman L, Wink AM, Berckel BNM, van de Flier WM, Scheltens P, Visser PJ, Barkhof F, Haller S, Gispert JD, Lopes Alves I, Alzheimer’s Disease Neuroimaging I, for the As (2022) Spatial-Temporal Patterns of beta-Amyloid Accumulation: A Subtype and Stage Inference Model Analysis. Neurology 98, e1692–e1703. [DOI] [PMC free article] [PubMed] [Google Scholar]
- [27].Vogel JW, Young AL, Oxtoby NP, Smith R, Ossenkoppele R, Strandberg OT, La Joie R, Aksman LM, Grothe MJ, Iturria-Medina Y, Pontecorvo MJ, Devous MD, Rabinovici GD, Alexander DC, Lyoo CH, Evans AC, Hansson O (2021) Four distinct trajectories of tau deposition identified in Alzheimer’s disease. Nature Medicine. [DOI] [PMC free article] [PubMed] [Google Scholar]
- [28].Ossenkoppele R, Schonhaut DR, Scholl M, Lockhart SN, Ayakta N, Baker SL, O’Neil JP, Janabi M, Lazaris A, Cantwell A, Vogel J, Santos M, Miller ZA, Bettcher BM, Vossel KA, Kramer JH, Gorno-Tempini ML, Miller BL, Jagust WJ, Rabinovici GD (2016) Tau PET patterns mirror clinical and neuroanatomical variability in Alzheimer’s disease. Brain 139, 1551–1567. [DOI] [PMC free article] [PubMed] [Google Scholar]
- [29].Young CB, Winer JR, Younes K, Cody KA, Betthauser TJ, Johnson SC, Schultz A, Sperling RA, Greicius MD, Cobos I, Poston KL, Mormino EC, Alzheimer’s Disease Neuroimaging I, the Harvard Aging Brain S (2022) Divergent Cortical Tau Positron Emission Tomography Patterns Among Patients With Preclinical Alzheimer Disease. JAMA Neurol. [DOI] [PMC free article] [PubMed] [Google Scholar]
- [30].Murray ME, Graff-Radford NR, Ross OA, Petersen RC, Duara R, Dickson DW (2011) Neuropathologically defined subtypes of Alzheimer’s disease with distinct clinical characteristics: a retrospective study. Lancet Neurol 10, 785–796. [DOI] [PMC free article] [PubMed] [Google Scholar]
- [31].Ossenkoppele R, Cohn-Sheehy BI, La Joie R, Vogel JW, Moller C, Lehmann M, van Berckel BN, Seeley WW, Pijnenburg YA, Gorno-Tempini ML, Kramer JH, Barkhof F, Rosen HJ, van der Flier WM, Jagust WJ, Miller BL, Scheltens P, Rabinovici GD (2015) Atrophy patterns in early clinical stages across distinct phenotypes of Alzheimer’s disease. Hum Brain Mapp 36, 4421–4437. [DOI] [PMC free article] [PubMed] [Google Scholar]
- [32].Ferreira D, Nordberg A, Westman E (2020) Biological subtypes of Alzheimer disease: A systematic review and meta-analysis. Neurology 94, 436–448. [DOI] [PMC free article] [PubMed] [Google Scholar]
- [33].Ferreira D, Verhagen C, Hernandez-Cabrera JA, Cavallin L, Guo CJ, Ekman U, Muehlboeck JS, Simmons A, Barroso J, Wahlund LO, Westman E (2017) Distinct subtypes of Alzheimer’s disease based on patterns of brain atrophy: longitudinal trajectories and clinical applications. Sci Rep 7, 46263. [DOI] [PMC free article] [PubMed] [Google Scholar]
- [34].Ten Kate M, Dicks E, Visser PJ, van der Flier WM, Teunissen CE, Barkhof F, Scheltens P, Tijms BM, Alzheimer’s Disease Neuroimaging I (2018) Atrophy subtypes in prodromal Alzheimer’s disease are associated with cognitive decline. Brain 141, 3443–3456. [DOI] [PMC free article] [PubMed] [Google Scholar]
- [35].Young AL, Marinescu RV, Oxtoby NP, Bocchetta M, Yong K, Firth NC, Cash DM, Thomas DL, Dick KM, Cardoso J, van Swieten J, Borroni B, Galimberti D, Masellis M, Tartaglia MC, Rowe JB, Graff C, Tagliavini F, Frisoni GB, Laforce R Jr., Finger E, de Mendonca A, Sorbi S, Warren JD, Crutch S, Fox NC, Ourselin S, Schott JM, Rohrer JD, Alexander DC, Genetic FTDI, Alzheimer’s Disease Neuroimaging I (2018) Uncovering the heterogeneity and temporal complexity of neurodegenerative diseases with Subtype and Stage Inference. Nat Commun 9, 4273. [DOI] [PMC free article] [PubMed] [Google Scholar]
- [36].Ahmad S, Bannister C, van der Lee SJ, Vojinovic D, Adams HHH, Ramirez A, Escott-Price V, Sims R, Baker E, Williams J, Holmans P, Vernooij MW, Ikram MA, Amin N, van Duijn CM (2018) Disentangling the biological pathways involved in early features of Alzheimer’s disease in the Rotterdam Study. Alzheimers Dement. [DOI] [PubMed] [Google Scholar]
- [37].Darst BF, Koscik RL, Racine AM, Oh JM, Krause RA, Carlsson CM, Zetterberg H, Blennow K, Christian BT, Bendlin BB, Okonkwo OC, Hogan KJ, Hermann BP, Sager MA, Asthana S, Johnson SC, Engelman CD (2017) Pathway-Specific Polygenic Risk Scores as Predictors of Amyloid-beta Deposition and Cognitive Function in a Sample at Increased Risk for Alzheimer’s Disease. J Alzheimers Dis 55, 473–484. [DOI] [PMC free article] [PubMed] [Google Scholar]
- [38].Morgan AR, Touchard S, O’Hagan C, Sims R, Majounie E, Escott-Price V, Jones L, Williams J, Morgan BP (2017) The Correlation between Inflammatory Biomarkers and Polygenic Risk Score in Alzheimer’s Disease. J Alzheimers Dis 56, 25–36. [DOI] [PubMed] [Google Scholar]
- [39].Tesi N, van der Lee SJ, Hulsman M, Jansen IE, Stringa N, van Schoor NM, Scheltens P, van der Flier WM, Huisman M, Reinders MJT, Holstege H (2020) Immune response and endocytosis pathways are associated with the resilience against Alzheimer’s disease. Transl Psychiatry 10, 332. [DOI] [PMC free article] [PubMed] [Google Scholar]
- [40].Bellou E, Baker E, Leonenko G, Bracher-Smith M, Daunt P, Menzies G, Williams J, Escott-Price V (2020) Age-dependent effect of APOE and polygenic component on Alzheimer’s disease. Neurobiology of Aging. [DOI] [PMC free article] [PubMed] [Google Scholar]
- [41].Sun Y, Wang M, Zhao Y, Hu K, Liu Y, Liu B, Alzheimer’s Disease Neuroimaging I (2022) A Pathway-Specific Polygenic Risk Score Is Associated with Tau Pathology and Cognitive Decline. J Alzheimers Dis 85, 1745–1754. [DOI] [PubMed] [Google Scholar]
- [42].Paliwal D, McInerney TW, Pa J, Swerdlow RH, Easteal S, Andrews SJ, Alzheimer’s Disease Neuroimaging I (2021) Mitochondrial pathway polygenic risk scores are associated with Alzheimer’s Disease. Neurobiol Aging 108, 213–222. [DOI] [PubMed] [Google Scholar]
- [43].Jack CR Jr., Bennett DA, Blennow K, Carrillo MC, Dunn B, Haeberlein SB, Holtzman DM, Jagust W, Jessen F, Karlawish J, Liu E, Molinuevo JL, Montine T, Phelps C, Rankin KP, Rowe CC, Scheltens P, Siemers E, Snyder HM, Sperling R, Contributors (2018) NIA-AA Research Framework: Toward a biological definition of Alzheimer’s disease. Alzheimers Dement 14, 535–562. [DOI] [PMC free article] [PubMed] [Google Scholar]
- [44].Chang CC, Chow CC, Tellier LC, Vattikuti S, Purcell SM, Lee JJ (2015) Second-generation PLINK: rising to the challenge of larger and richer datasets. Gigascience 4, 7. [DOI] [PMC free article] [PubMed] [Google Scholar]
- [45].Chen CY, Pollack S, Hunter DJ, Hirschhorn JN, Kraft P, Price AL (2013) Improved ancestry inference using weights from external reference panels. Bioinformatics 29, 1399–1406. [DOI] [PMC free article] [PubMed] [Google Scholar]
- [46].The 1000 Genomes Project Consortium (2015) A global reference for human genetic variation. Nature 526, 68–74. [DOI] [PMC free article] [PubMed] [Google Scholar]
- [47].Das S, Forer L, Schonherr S, Sidore C, Locke AE, Kwong A, Vrieze SI, Chew EY, Levy S, McGue M, Schlessinger D, Stambolian D, Loh PR, Iacono WG, Swaroop A, Scott LJ, Cucca F, Kronenberg F, Boehnke M, Abecasis GR, Fuchsberger C (2016) Next-generation genotype imputation service and methods. Nat Genet 48, 1284–1287. [DOI] [PMC free article] [PubMed] [Google Scholar]
- [48].de Leeuw CA, Mooij JM, Heskes T, Posthuma D (2015) MAGMA: generalized gene-set analysis of GWAS data. PLoS Comput Biol 11, e1004219. [DOI] [PMC free article] [PubMed] [Google Scholar]
- [49].Ashburner M, Ball CA, Blake JA, Botstein D, Butler H, Cherry JM, Davis AP, Dolinski K, Dwight SS, Eppig JT, Harris MA, Hill DP, Issel-Tarver L, Kasarskis A, Lewis S, Matese JC, Richardson JE, Ringwald M, Rubin GM, Sherlock G (2000) Gene ontology: tool for the unification of biology. The Gene Ontology Consortium. Nat Genet 25, 25–29. [DOI] [PMC free article] [PubMed] [Google Scholar]
- [50].Gene Ontology Consortium (2021) The Gene Ontology resource: enriching a GOld mine. Nucleic Acids Res 49, D325–D334. [DOI] [PMC free article] [PubMed] [Google Scholar]
- [51].Croft D, O’Kelly G, Wu G, Haw R, Gillespie M, Matthews L, Caudy M, Garapati P, Gopinath G, Jassal B, Jupe S, Kalatskaya I, Mahajan S, May B, Ndegwa N, Schmidt E, Shamovsky V, Yung C, Birney E, Hermjakob H, D’Eustachio P, Stein L (2011) Reactome: a database of reactions, pathways and biological processes. Nucleic Acids Res 39, D691–697. [DOI] [PMC free article] [PubMed] [Google Scholar]
- [52].Kanehisa M, Goto S, Sato Y, Furumichi M, Tanabe M (2012) KEGG for integration and interpretation of large-scale molecular data sets. Nucleic Acids Res 40, D109–114. [DOI] [PMC free article] [PubMed] [Google Scholar]
- [53].Merico D, Isserlin R, Stueker O, Emili A, Bader GD (2010) Enrichment map: a network-based method for gene-set enrichment visualization and interpretation. PLoS One 5, e13984. [DOI] [PMC free article] [PubMed] [Google Scholar]
- [54].Choi SW, O’Reilly PF (2019) PRSice-2: Polygenic Risk Score software for biobank-scale data. Gigascience 8. [DOI] [PMC free article] [PubMed] [Google Scholar]
- [55].Shaw LM, Vanderstichele H, Knapik-Czajka M, Clark CM, Aisen PS, Petersen RC, Blennow K, Soares H, Simon A, Lewczuk P, Dean R, Siemers E, Potter W, Lee VM, Trojanowski JQ, Alzheimer’s Disease Neuroimaging I (2009) Cerebrospinal fluid biomarker signature in Alzheimer’s disease neuroimaging initiative subjects. Ann Neurol 65, 403–413. [DOI] [PMC free article] [PubMed] [Google Scholar]
- [56].Hansson O, Seibyl J, Stomrud E, Zetterberg H, Trojanowski JQ, Bittner T, Lifke V, Corradini V, Eichenlaub U, Batrla R, Buck K, Zink K, Rabe C, Blennow K, Shaw LM, Swedish Bio Fsg, Alzheimer’s Disease Neuroimaging I (2018) CSF biomarkers of Alzheimer’s disease concord with amyloid-beta PET and predict clinical progression: A study of fully automated immunoassays in BioFINDER and ADNI cohorts. Alzheimers Dement. [DOI] [PMC free article] [PubMed] [Google Scholar]
- [57].Landau SM, Breault C, Joshi AD, Pontecorvo M, Mathis CA, Jagust WJ, Mintun MA, Alzheimer’s Disease Neuroimaging I (2013) Amyloid-beta imaging with Pittsburgh compound B and florbetapir: comparing radiotracers and quantification methods. J Nucl Med 54, 70–77. [DOI] [PMC free article] [PubMed] [Google Scholar]
- [58].Landau SM, Marks SM, Mormino EC, Rabinovici GD, Oh H, O’Neil JP, Wilson RS, Jagust WJ (2012) Association of lifetime cognitive engagement and low β-amyloid deposition. Archives of Neurology 69, 623–629. [DOI] [PMC free article] [PubMed] [Google Scholar]
- [59].Royse SK, Minhas DS, Lopresti BJ, Murphy A, Ward T, Koeppe RA, Bullich S, DeSanti S, Jagust WJ, Landau SM, Alzheimer’s Disease Neuroimaging I (2021) Validation of amyloid PET positivity thresholds in centiloids: a multisite PET study approach. Alzheimers Res Ther 13, 99. [DOI] [PMC free article] [PubMed] [Google Scholar]
- [60].Weigand AJ, Maass A, Eglit GL, Bondi MW (2022) What’s the cut-point?: a systematic investigation of tau PET thresholding methods. Alzheimers Res Ther 14, 49. [DOI] [PMC free article] [PubMed] [Google Scholar]
- [61].R Core Team (2017) R Foundation for Statistical Computing, Vienna, Austria. [Google Scholar]
- [62].Price AL, Patterson NJ, Plenge RM, Weinblatt ME, Shadick NA, Reich D (2006) Principal components analysis corrects for stratification in genome-wide association studies. Nat Genet 38, 904–909. [DOI] [PubMed] [Google Scholar]
- [63].Vuong QH (1989) Likelihood ratio tests for model selection and non-nested hypotheses. Econometrica: Journal of the Econometric Society, 307–333. [Google Scholar]
- [64].Benjamini Y, Hochberg Y (1995) Controlling the False Discovery Rate - a Practical and Powerful Approach to Multiple Testing. Journal of the Royal Statistical Society Series B-Statistical Methodology 57, 289–300. [Google Scholar]
- [65].Dourlen P, Kilinc D, Malmanche N, Chapuis J, Lambert JC (2019) The new genetic landscape of Alzheimer’s disease: from amyloid cascade to genetically driven synaptic failure hypothesis? Acta Neuropathol 138, 221–236. [DOI] [PMC free article] [PubMed] [Google Scholar]
- [66].Engin AB, Engin A (2021) Alzheimer’s Disease and Protein Kinases Springer International Publishing, pp. 285–321. [Google Scholar]
- [67].Swerdlow RH (2018) Mitochondria and Mitochondrial Cascades in Alzheimer’s Disease. J Alzheimers Dis 62, 1403–1416. [DOI] [PMC free article] [PubMed] [Google Scholar]
- [68].Swerdlow RH, Burns JM, Khan SM (2014) The Alzheimer’s disease mitochondrial cascade hypothesis: progress and perspectives. Biochim Biophys Acta 1842, 1219–1231. [DOI] [PMC free article] [PubMed] [Google Scholar]
- [69].Chen G, Kroemer G, Kepp O (2020) Mitophagy: An Emerging Role in Aging and Age-Associated Diseases. Front Cell Dev Biol 8, 200. [DOI] [PMC free article] [PubMed] [Google Scholar]
- [70].Rajendran L, Honsho M, Zahn TR, Keller P, Geiger KD, Verkade P, Simons K (2006) Alzheimer’s disease beta-amyloid peptides are released in association with exosomes. Proc Natl Acad Sci U S A 103, 11172–11177. [DOI] [PMC free article] [PubMed] [Google Scholar]
- [71].Cirrito JR, Kang JE, Lee J, Stewart FR, Verges DK, Silverio LM, Bu G, Mennerick S, Holtzman DM (2008) Endocytosis is required for synaptic activity-dependent release of amyloid-beta in vivo. Neuron 58, 42–51. [DOI] [PMC free article] [PubMed] [Google Scholar]
- [72].Zou L, Wang Z, Shen L, Bao GB, Wang T, Kang JH, Pei G (2007) Receptor tyrosine kinases positively regulate BACE activity and Amyloid-beta production through enhancing BACE internalization. Cell Res 17, 389–401. [DOI] [PubMed] [Google Scholar]
- [73].Poulsen ET, Iannuzzi F, Rasmussen HF, Maier TJ, Enghild JJ, Jorgensen AL, Matrone C (2017) An Aberrant Phosphorylation of Amyloid Precursor Protein Tyrosine Regulates Its Trafficking and the Binding to the Clathrin Endocytic Complex in Neural Stem Cells of Alzheimer’s Disease Patients. Front Mol Neurosci 10, 59. [DOI] [PMC free article] [PubMed] [Google Scholar] [Retracted]
- [74].DeMattos RB, O’Dell MA, Parsadanian M, Taylor JW, Harmony JA, Bales KR, Paul SM, Aronow BJ, Holtzman DM (2002) Clusterin promotes amyloid plaque formation and is critical for neuritic toxicity in a mouse model of Alzheimer’s disease. Proc Natl Acad Sci U S A 99, 10843–10848. [DOI] [PMC free article] [PubMed] [Google Scholar]
- [75].Gadhave K, Bolshette N, Ahire A, Pardeshi R, Thakur K, Trandafir C, Istrate A, Ahmed S, Lahkar M, Muresanu DF, Balea M (2016) The ubiquitin proteasomal system: a potential target for the management of Alzheimer’s disease. J Cell Mol Med 20, 1392–1407. [DOI] [PMC free article] [PubMed] [Google Scholar]
- [76].Zarouchlioti C, Parfitt DA, Li W, Gittings LM, Cheetham ME (2018) DNAJ Proteins in neurodegeneration: essential and protective factors. Philos Trans R Soc Lond B Biol Sci 373. [DOI] [PMC free article] [PubMed] [Google Scholar]
- [77].Martin L, Latypova X, Wilson CM, Magnaudeix A, Perrin ML, Yardin C, Terro F (2013) Tau protein kinases: involvement in Alzheimer’s disease. Ageing Res Rev 12, 289–309. [DOI] [PubMed] [Google Scholar]
- [78].Kowall NW, Kosik KS (1987) Axonal disruption and aberrant localization of tau protein characterize the neuropil pathology of Alzheimer’s disease. Ann Neurol 22, 639–643. [DOI] [PubMed] [Google Scholar]
- [79].Iqbal K, Liu F, Gong CX, Grundke-Iqbal I (2010) Tau in Alzheimer disease and related tauopathies. Curr Alzheimer Res 7, 656–664. [DOI] [PMC free article] [PubMed] [Google Scholar]
- [80].Leyns CEG, Holtzman DM (2017) Glial contributions to neurodegeneration in tauopathies. Mol Neurodegener 12, 50. [DOI] [PMC free article] [PubMed] [Google Scholar]
- [81].Laurent C, Buee L, Blum D (2018) Tau and neuroinflammation: What impact for Alzheimer’s Disease and Tauopathies? Biomed J 41, 21–33. [DOI] [PMC free article] [PubMed] [Google Scholar]
- [82].Fang EF, Hou Y, Palikaras K, Adriaanse BA, Kerr JS, Yang B, Lautrup S, Hasan-Olive MM, Caponio D, Dan X, Rocktaschel P, Croteau DL, Akbari M, Greig NH, Fladby T, Nilsen H, Cader MZ, Mattson MP, Tavernarakis N, Bohr VA (2019) Mitophagy inhibits amyloid-beta and tau pathology and reverses cognitive deficits in models of Alzheimer’s disease. Nat Neurosci 22, 401–412. [DOI] [PMC free article] [PubMed] [Google Scholar]
- [83].Rapoport M, Dawson HN, Binder LI, Vitek MP, Ferreira A (2002) Tau is essential to beta -amyloid-induced neurotoxicity. Proc Natl Acad Sci U S A 99, 6364–6369. [DOI] [PMC free article] [PubMed] [Google Scholar]
- [84].La Joie R, Visani AV, Baker SL, Brown JA, Bourakova V, Cha J, Chaudhary K, Edwards L, Iaccarino L, Janabi M, Lesman-Segev OH, Miller ZA, Perry DC, O’Neil JP, Pham J, Rojas JC, Rosen HJ, Seeley WW, Tsai RM, Miller BL, Jagust WJ, Rabinovici GD (2020) Prospective longitudinal atrophy in Alzheimer’s disease correlates with the intensity and topography of baseline tau-PET. Sci Transl Med 12, eaau5732. [DOI] [PMC free article] [PubMed] [Google Scholar]
- [85].Jansen IE, van der Lee SJ, Gomez-Fonseca D, de Rojas I, Dalmasso MC, Grenier-Boley B, Zettergren A, Mishra A, Ali M, Andrade V, Bellenguez C, Kleineidam L, Kucukali F, Sung YJ, Tesi N, Vromen EM, Wightman DP, Alcolea D, Alegret M, Alvarez I, Amouyel P, Athanasiu L, Bahrami S, Bailly H, Belbin O, Bergh S, Bertram L, Biessels GJ, Blennow K, Blesa R, Boada M, Boland A, Buerger K, Carracedo A, Cervera-Carles L, Chene G, Claassen J, Debette S, Deleuze JF, de Deyn PP, Diehl-Schmid J, Djurovic S, Dols-Icardo O, Dufouil C, Duron E, Duzel E, consortium E, Fladby T, Fortea J, Frolich L, Garcia-Gonzalez P, Garcia-Martinez M, Giegling I, Goldhardt O, Gobom J, Grimmer T, Haapasalo A, Hampel H, Hanon O, Hausner L, Heilmann-Heimbach S, Helisalmi S, Heneka MT, Hernandez I, Herukka SK, Holstege H, Jarholm J, Kern S, Knapskog AB, Koivisto AM, Kornhuber J, Kuulasmaa T, Lage C, Laske C, Leinonen V, Lewczuk P, Lleo A, de Munain AL, Lopez-Garcia S, Maier W, Marquie M, Mol MO, Montrreal L, Moreno F, Moreno-Grau S, Nicolas G, Nothen MM, Orellana A, Palhaugen L, Papma JM, Pasquier F, Perneczky R, Peters O, Pijnenburg YAL, Popp J, Posthuma D, Pozueta A, Priller J, Puerta R, Quintela I, Ramakers I, Rodriguez-Rodriguez E, Rujescu D, Saltvedt I, Sanchez-Juan P, Scheltens P, Scherbaum N, Schmid M, Schneider A, Selbaek G, Selnes P, Shadrin A, Skoog I, Soininen H, Tarraga L, Teipel S, group GAs, Tijms B, Tsolaki M, Van Broeckhoven C, Van Dongen J, van Swieten JC, Vandenberghe R, Vidal JS, Visser PJ, Vogelgsang J, Waern M, Wagner M, Wiltfang J, Wittens MMJ, Zetterberg H, Zulaica M, van Duijn CM, Bjerke M, Engelborghs S, Jessen F, Teunissen CE, Pastor P, Hiltunen M, Ingelsson M, Andreassen OA, Clarimon J, Sleegers K, Ruiz A, Ramirez A, Cruchaga C, Lambert JC, van der Flier W (2022) Genome-wide meta-analysis for Alzheimer’s disease cerebrospinal fluid biomarkers. Acta Neuropathol. [DOI] [PMC free article] [PubMed] [Google Scholar]
- [86].Watanabe K, Stringer S, Frei O, Umicevic Mirkov M, de Leeuw C, Polderman TJC, van der Sluis S, Andreassen OA, Neale BM, Posthuma D (2019) A global overview of pleiotropy and genetic architecture in complex traits. Nat Genet. [DOI] [PubMed] [Google Scholar]
- [87].Sey NYA, Hu B, Mah W, Fauni H, McAfee JC, Rajarajan P, Brennand KJ, Akbarian S, Won H (2020) A computational tool (H-MAGMA) for improved prediction of brain-disorder risk genes by incorporating brain chromatin interaction profiles. Nat Neurosci 23, 583–593. [DOI] [PMC free article] [PubMed] [Google Scholar]
- [88].Gerring ZF, Mina-Vargas A, Gamazon ER, Derks EM (2021) E-MAGMA: an eQTL-informed method to identify risk genes using genome-wide association study summary statistics. Bioinformatics 37, 2245–2249. [DOI] [PMC free article] [PubMed] [Google Scholar]
- [89].Le Guen Y, Raulin AC, Logue MW, Sherva R, Belloy ME, Eger SJ, Chen A, Kennedy G, Kuchenbecker L, O’Leary JP, Zhang R, Merritt VC, Panizzon MS, Hauger RL, Gaziano JM, Bu G, Thornton TA, Farrer LA, Napolioni V, He Z, Greicius MD (2023) Association of African Ancestry-Specific APOE Missense Variant R145C With Risk of Alzheimer Disease. JAMA 329, 551–560. [DOI] [PMC free article] [PubMed] [Google Scholar]
- [90].Naslavsky MS, Suemoto CK, Brito LA, Scliar MO, Ferretti-Rebustini RE, Rodriguez RD, Leite REP, Araujo NM, Borda V, Tarazona-Santos E, Jacob-Filho W, Pasqualucci C, Nitrini R, Yaffe K, Zatz M, Grinberg LT (2022) Global and local ancestry modulate APOE association with Alzheimer’s neuropathology and cognitive outcomes in an admixed sample. Mol Psychiatry. [DOI] [PMC free article] [PubMed] [Google Scholar]
- [91].Lake J, Warly Solsberg C, Kim JJ, Acosta-Uribe J, Makarious MB, Li Z, Levine K, Heutink P, Alvarado CX, Vitale D, Kang S, Gim J, Lee KH, Pina-Escudero SD, Ferrucci L, Singleton AB, Blauwendraat C, Nalls MA, Yokoyama JS, Leonard HL (2023) Multi-ancestry meta-analysis and fine-mapping in Alzheimer’s disease. Mol Psychiatry. [DOI] [PMC free article] [PubMed] [Google Scholar]
Associated Data
This section collects any data citations, data availability statements, or supplementary materials included in this article.
Supplementary Materials
Data Availability Statement
Data used in this article can be downloaded from the Alzheimer’s Disease Neuroimaging Initiative (ADNI) database at adni.loni.usc.edu. Code used in these analyses is available at https://github.com/jelman/pathwayPRS_paper.git.