

Abstract
PURPOSE:
Central subfoveal thickness measurement is used in a large number of clinical trials to monitor the progression and treatment response of diabetic macular edema (DME) in patients of diabetic retinopathy (DR). Several studies have been carried out to investigate various factors affecting the central subfoveal thickness in order to minimize errors in the testing. We planned a study to investigate the effect of meals on central macular thickness (CMT) in patients with DME and compare that with nondiabetic patients.
METHODS:
In this observational study, 50 patients of diabetes with DME and 50 normal controls were included. Macular thickness was measured after overnight fasting and 2 h postprandial for both the groups. Any changes in morphology and CMT were evaluated.
RESULTS:
Each group had 22 females and 28 males with a mean age of 60.6 ± 6.6 in the diabetic group and of 49.66 ± 11.13 in the control group. Reduction in the CMT was noticed after the meals (mean: −9.78 ± 12.77 μm; P < 0.001) in those with DME as compared to the control group. This was more prominent in those who had intraretinal cystic spaces (17.14 ± 10.33 μm) and neurosensory detachment (66 µ). Patients with high blood sugar levels had higher CMT and a greater reduction in thickness was noticed in them postprandially (r = 0.414; P = 0.0028).
CONCLUSION:
The CMT values in patients with DME are significantly affected by meals. Hence, an attempt should be made to measure CMT during the fasting state for more accurate results.
Keywords: Central macular thickness, diabetic macular edema, diabetic retinopathy, fasting, meals, optical coherence tomography, postprandial
Introduction
Diabetes mellitus is a cause of major concern involving the world as a pandemic, with India and China having maximum cases.[1,2] Diabetic macular edema (DME), which can occur anytime during the course of diabetic retinopathy (DR), is one of the most common complications causing significant vision loss, poor quality of life, and stress to the patient. About 5% of the patients suffering from type II diabetes already have DME at the time of diagnosis.[3]
Central macular thickness (CMT)/retinal thickness is a variable which can be measured by optical coherence tomography (OCT) to monitor DME progression and take decision regarding the treatment. Anti-vascular endothelial growth factors (anti-VEGFs) and steroids are the mainstays of treatment for DME. In various clinical treatment trials done on DME to study the efficacy of a particular anti-VEGF or for comparing different anti-VEGFs for treatment, CMT has been used as the endpoint criterion.[4,5]
CMT measurements by OCT are liable to errors as they are affected by various factors.[6,7] A significant variation in retinal thickness measurement was noticed by the time of the day.[8] A maximum number of studies have been carried out on the effects of diurnal variation on retinal thickness measurements. There are studies which show that acute rise in blood sugar levels leads to increased retinal blood flow.[9,10]
Considering the importance of retinal thickness measurements in the treatment and the monitoring of progression of DME, accurate measurements should be obtained and all factors affecting these measurements should be known and kept in mind while doing OCT macula in DME patients.
Hence, we assessed the effect of meals on the retinal thickness measured by OCT in DME patients and also compared them with that of nondiabetic, normal individuals with normal eyes.
Methods
In this observational study, 50 patients of type II diabetes (noninsulin-dependent diabetes mellitus) with DME and 50 normal controls in the age group of 30 years and above were included. This was done at a tertiary eye care center between September 2017 and February 2019. The study was performed with informed patient consent, and was conducted under a protocol approved by the local ethics committee in conformity with the principles expressed in the Declaration of Helsinki.
Inclusion criteria for DME patients were defined by CMT >250 µ. The exclusion criteria consisted of patients with media opacities hindering OCT examination, any history of intraocular surgeries, retinal photocoagulation in the previous 6 months, any known diseases other than diabetes which are known to cause macular edema, any other macular pathologies, and myopia >6 diopters.
They underwent comprehensive ophthalmological evaluation.
Baseline demography features, age, sex, and other comorbidities for all 100 patients were noted. For diabetic patients, onset, duration, and treatment for diabetes were also considered. Best-corrected visual acuity was assessed using the Early Treatment Diabetic Retinopathy Study Chart. Comprehensive eye examination was done. Pupils were examined for reaction to light (both direct and consensual) and presence of neo-vascularisation of iris. Intraocular pressures were taken. Slit-lamp biomicroscopy after pupillary dilatation using +90 diopter (+90 D) lens to clinically assess macular edema, followed by indirect ophthalmoscopy evaluation of the entire retina, was done.
OCT was performed by Cirrus HD OCT (Carl Zeiss) instrument (software version 6.0) using macular cube 512 mm × 128 mm protocol, between 7:30 and 8:30 AM after 8 h of fasting, and then repeated 2 h after breakfast (standardized meal of −400 calories was given to all subjects) as decided by a dietician. All the OCT examinations were performed by a single trained examiner. Scans with signal strength >7 were included in the study. Various morphological features of the macula on OCT were also noted in each patient.
Both fasting and postprandial blood samples of all the individuals were also taken to measure the blood sugar levels at the time of OCT. Difference in values of the preprandial and postprandial levels was also noted.
Statistical analysis
The data collected were analyzed SSPS-21.0, IBM, Chicago, Illinois, USA. Normality of data was tested by Kolmogorov–Smirnov test. If the normality was rejected, then nonparametric test was used. Mean, standard deviation, median, and interquartile range were obtained for all study variables. Wilcoxon signed rank test was performed to evaluate the differences in CMT between fasting and after meal measurements in diabetic patients with DME and nondiabetic patients (control group). Quantitative variables were compared using Mann–Whitney test. Kruskal–Wallis test was used to compare the CMT changes post meals in various morphological subgroups of DME patients. The correlation between the changes in CMT measurements and blood sugar level fasting and postprandial was evaluated by Spearman rank correlation. The qualitative variables such as gender were compared between two groups using Chi-square test and the presence of comorbidities, using Fisher's exact test.
Results
A total of 100 eyes of 100 subjects were studied based on inclusion and exclusion criteria – 50 eyes of diabetic patients with DME and 50 healthy eyes of nondiabetic patients. There were 22 females and 28 males in each group with a mean age of 60.6 ± 6.6 in the DME group and 49.66 ± 11.13 in the nondiabetic group. The two groups differed in disease state, associated comorbidities, and study eye characteristics [Table 1].
Table 1.
Baseline demographic characteristics
| DME | Nondiabetic patients | P | ||
|---|---|---|---|---|
| Age (years) | ||||
| Sample size | 50 | 50 | <0.0001 | |
| Mean±SD | 60.6±6.6 | 49.66±11.13 | ||
| Median | 61 | 53.5 | ||
| Minimum–maximum | 42–71 | 31–73 | ||
| IQR | 56–65 | 38–58 | ||
| BCVA LogMAR | ||||
| Sample size | 50 | 50 | <0.0001 | |
| Mean±SD | 0.34±0.16 | 0.02±0.08 | ||
| Median | 0.3 | 0 | ||
| Minimum–maximum | 0.18–1 | 0–0.48 | ||
| IQR | 0.176–0.477 | 0–0 | ||
|
| ||||
| Gender | DME | Nondiabetic | Total | P |
|
| ||||
| Female | 22 (44.00) | 22 (44.00) | 44 (44.00) | 1.000 |
| Male | 28 (56.00) | 28 (56.00) | 56 (56.00) | |
|
| ||||
| Comorbidities | Group |
Total | P | |
| DME | Nondiabetic | |||
|
| ||||
| Hypertension | ||||
| No | 27 (54.00) | 50 (100.00) | 77 (77.00) | <0.0001 |
| Yes | 23 (46.00) | 0 | 23 (23.00) | |
| Total | 50 (100.00) | 50 (100.00) | 100 (100.00) | |
| Coronary artery disease | ||||
| No | 48 (96.00) | 50 (100.00) | 98 (98.00) | 0.495 |
| Yes | 2 (4.00) | 0 | 2 (2.00) | |
| Total | 50 (100.00) | 50 (100.00) | 100 (100.00) | |
| Dyslipidemia | ||||
| No | 47 (94.00) | 50 (100.00) | 97 (97.00) | 0.242 |
| Yes | 3 (6.00) | 0 | 3 (3.00) | |
| Total | 50 (100.00) | 50 (100.00) | 100 (100.00) | |
LogMAR: Logarithm of the minimum angle of resolution, DME: Diabetic macular edema, SD: Standard deviation, IQR: Interquartile range, BCVA: Best visual acuity
While the baseline mean CMT of DME patients at 8-h fasting was 346.62 µ which had decreased to 336.84 µ 2-h postprandial state, the baseline CMT of nondiabetic patients at 8-h fasting was 237.8 µ and at 2 h postprandial was 237.56 µ not demonstrating much difference [Figure 1]. The mean blood sugar levels in DME patients at 8 h of fasting was 109.96 and that of 2 h postprandial was 175.14 mg/dL and that of nondiabetic patients at 8 h of fasting was 81.66 mg/dL and at 2 h postprandial 102.22 mg/dL [Table 2 and Figure 2].
Figure 1.

Mean central macular thickness values of diabetic macular edema patients and controls. CMT: Central macular thickness
Table 2.
Mean central macular thickness and blood sugar levels in both groups (pre and post meals)
| Mean |
||
|---|---|---|
| Diabetic patient | Nondiabetic patient | |
| Blood sugar: Fasting (mg %) | 109.96 | 81.66 |
| Blood sugar: Postprandial (mg %) | 175.14 | 102.22 |
| CMT at 8-h fasting; pre meal | 346.62 | 237.8 |
| CMT at 2 h post meal | 336.84 | 237.56 |
CMT: Central macular thickness
Figure 2.

Mean blood sugar levels in both groups (pre and post meal levels)
A significant reduction in mean CMT was noticed after the meals (mean of − 9.78 ± 12.77 μm, P < 0.001, in those with DME. A decrease >14 µ was found in 17 eyes (34%). The healthy eyes of nondiabetic patients showed no significant change (−0.24 ± 2.35) [Table 3 and Figure 3].
Table 3.
Decrease in central macular thickness measurements after meals in both groups
| Decrease in CMT | DME | Nondiabetic | P |
|---|---|---|---|
| Sample size | 50 | 50 | <0.0001 |
| Mean±SD | 9.78±12.77 | 0.24±2.35 | |
| Median | 5 | 0 | |
| Minimum–maximum | −6–66 | −4–5 | |
| IQR | 0–17 | −2–2 |
SD: Standard deviation, IQR: Interquartile range, CMT: Central macular thickness, DME: Diabetic macular edema
Figure 3.

Post meal mean reduction in central macular thickness in diabetic macular edema patients and Controls. CMT: Central macular thickness
Maximum decrease in CMT was found in eyes with intraretinal cystic spaces and subretinal fluid in OCT (17.14 ± 10.33 µ) and (66 µ) whereas the eyes with epiretinal membrane revealed no change in CMT values [Table 4 and Figure 4].
Table 4.
Central macular thickness changes according to optical coherence tomography morphology
| ERM with cystic space | Cystic spaces | Cystic spaces + SRF | Spongiform edema | SRF | P | |
|---|---|---|---|---|---|---|
| CMT at 2 h post meal | ||||||
| Sample size | 2 | 23 | 7 | 17 | 1 | 0.006 |
| Mean±SD | 295.5±12.02 | 321.65±61.08 | 532.71±191.23 | 279.41±21.54 | 374±0 | |
| Median | 295.5 | 300 | 618 | 277 | 374 | |
| Minimum–maximum | 287–304 | 248–466 | 267–712 | 247–317 | 374–374 | |
| IQR | 287–304 | 275.25–361 | 354–698 | 263.75–297.25 | 374–374 | |
| CMT at 8-h fasting | ||||||
| Sample size | 2 | 23 | 7 | 17 | 1 | 0.003 |
| Mean±SD | 295.5±12.02 | 332.7±66.83 | 549.86±199.72 | 282.29±20.15 | 440±0 | |
| Median | 295.5 | 310 | 629 | 283 | 440 | |
| Minimum–maximum | 287–304 | 251–498 | 275–741 | 253–312 | 440–440 | |
| IQR | 287–304 | 281.750–375 | 365.500–725.500 | 263.750–299.500 | 440–440 | |
| Difference in CMT | ||||||
| Sample size | 2 | 23 | 7 | 17 | 1 | 0.002 |
| Mean±SD | 0±0 | 11.04±10.1 | 17.14±10.33 | 2.88±5.74 | 66±0 | |
| Median | 0 | 9 | 14 | 1 | 66 | |
| Minimum–maximum | 0–0 | −1–32 | 4–29 | −6–21 | 66–66 | |
| IQR | 0–0 | 2.250–17.750 | 8.750–27.500 | 0–5.250 | 66–66 | |
SD: Standard deviation, IQR: Interquartile range, CMT: Central macular thickness, ERM: Epiretinal membrane, SRF: Subretinal fluid
Figure 4.
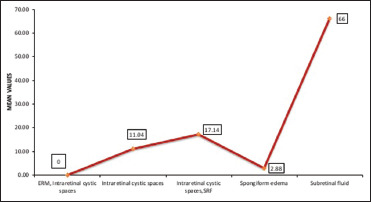
Post meal central macular thickness changes according to optical coherence tomography morphology
Correlation of blood sugar levels and central macular thickness in DME patients
There was a correlation found between level of fasting blood sugar and CMT measurements (r = 0.414; P = 0.0028). DME patients with higher fasting blood sugar levels had higher CMT and also a greater decrease in their CMT postprandially [Table 5 and Figure 5].
Table 5.
Correlation between blood sugar levels and central macular thickness in diabetic macular edema patients
| Blood sugar: Fasting (mg %) | Blood sugar: Postprandial (mg %) | |
|---|---|---|
| CMT at 8-h fasting | ||
| Correlation coefficient | 0.414 | 0.366 |
| P | 0.0028 | 0.0089 |
| n | 50 | 50 |
| CMT at 2 h postprandial | ||
| Correlation coefficient | 0.372 | 0.38 |
| P | 0.0078 | 0.0065 |
| n | 50 | 50 |
| Decrease in CMT | ||
| Correlation coefficient | 0.531 | 0.342 |
| P | 0.0001 | 0.015 |
| n | 50 | 50 |
CMT: Central macular thickness
Figure 5.

Correlation between fasting blood sugar level and macular thickness. CMT: Central macular thickness
Discussion
Globally, the overall prevalence of DR is 34.6% and of DME is around 6.81%.[11] In a study involving 6218 diabetic patients carried out by All India Ophthalmologic Society, the prevalence of DR was found to be 21.7%. In India,[12] DME is the primary cause of visual impairment in DR. With the number of diabetic patients estimated to reach 642 million by 2040, visual impairment would be largely attributable to DME.[1,13] Thus, its early detection and timely treatment are of utmost importance.
Today, OCT is recognized as an important investigational tool, integral to the evaluation of many chorioretinal pathologies including DME. It provides quantitative data along with information regarding structural and morphological changes occurring in various retinal and choroidal layers.[14,15,16,17] Changes in these variables from the baseline help in monitoring the progression of disease and also to see response to treatment.[18,19,20] Changes in CMT have been an OCT criterion studied in various clinical trials such as RISE/RIDE, VIVID, VISTA, and Protocol T.
Previous studies have reported that many factors such as media opacity, interdevice variance, visual acuity, angle of incidence of light falling on the pupil, and pupil size affect the OCT retinal thickness measurements.[21,22,23] Some studies have also shown that diurnal variation affected CMT measurement.[17,24,25,26,27]
Studies by Arlotte et al.[9] and Grunwald et al.[28] have suggested that acute rise in blood glycemic levels leads to increase in retinal blood flow in diabetic patients. It may result in absorption of the intracellular and extracellular fluids, and decreased retinal thickness in patients of DME. This is the possible explanation for reduction in the CMT thickness in the postprandial state in comparison to the fasting state.
Not much scientific literature explores the effect of fasting and postprandial states on retinal thickness in healthy or diabetic patients. The largest study, which was carried out by DR Clinical Research Network (DRCR.net) on effects of diurnal variation on OCT retinal thickness, showed a weak correlation with diurnal blood glucose concentrations.[29]
If this change is significant, then it can have an impact in our decision of treatment of DME. We may also take into account the fasting/postprandial status of our patients during OCT measurements of macular thickness in our treatment-related clinical trials. Till date, only a single study exists which had studied the variations in pre- and postprandial retinal thickness measurements in DME patients.[10] In that study, the sample size was small, there was no comparison group of healthy individuals, and the correlation of OCT retinal thickness measurement with the blood sugar levels at that point of time was not taken into account.
Our study demonstrated that there was a statistically significant reduction in CMT in DME patients when measured at 8-h fasting and 2-h postprandial state [Figure 6]. However, no significant change in CMT values was seen in nondiabetic patients, though there was a significant change in the blood sugar levels fasting and postprandial in both the groups. In patients with DME, the baseline value of CMT was 346.62 +/- 121.40 and 237.80+/- 9.53 in normal controls [Figure 1] and it showed a statically significant reduction in patients with diabetes (p<0.0001)[Figure 3]. In conformity with the study conducted by Wiemer et al.[30] The change in CMT was not statistically significant in nondiabetic patients (P < 0.527). These results were similar to those of the study by Arlotte et al. and Falavarjani et al.[9,10] The reason for our study showing statistically stronger results could be due to larger study population.[30]
Figure 6.

(a) CMT Value in the fasting state (b) CMT Value after 2h post-prandial state (c, d) OCT Pictures showing cystic spaces and neuro-sensory detachment in DME patient before and after meals
Our study also showed some correlation, though not strong, between central retinal thickness measurements and the blood sugar levels with correlation coefficient r = 0.414 and between CMT at 8-h fasting and CMT at 2 h postprandial for DME patients r = 0.372 [Table 5 and Figure 5]. Variation in CMT measurement was more significant in the group with higher blood sugar levels in both the fasting and postprandial states. The result of the study conducted by DRCR.net differed from ours in that it showed a weak correlation (r = −0.13) of change in retinal thickness with blood sugar levels (r = −0.13).[29]
In terms of OCT morphology and CMT values, it was found that CMT values were maximum in patients who had intraretinal cystic spaces along with subretinal fluid. The mean baseline CMT at 8-h fasting was 549.86 ± 199.72 and change in retinal thickness was also maximum in this morphological subgroup (17.14 ± 10.33) followed by those with only intraretinal cystic spaces subgroup (11.04 ± 10.1) [Table 4 and Figure 4]. However, the subgroup which had epiretinal membrane did not reveal any change in CMT. The reason behind this could be that in patients with epiretinal membrane, the increased CMT in DME patients could have been due to the traction of epiretinal membrane on foveal region and not due to actual edema. These findings are in agreement with the study on macular thickness measurement in clinically significant macular edema before and after meal which showed that mean maximal retinal thickness change was significantly higher in the presence of subretinal fluid (P = 0.01), however, it was not statistically affected by epimacular membrane (P = 0.6).
Our study showed a decrease >14 µ in CMT post meals in about 34% of DME patients which is statistically significant and more than the machine variability. Considering all these findings, the CMT measurements of the DME patients can be affected by their fasting and postprandial states.
However, our study has some limitations. The sample size was not large. Although the nondiabetic patients were evaluated for changes in CMT after meals, the two groups were not comparable with respect to their age. In patients suffering from other systemic conditions like hypertension or dyslipidemia, no such studies are available to know the role of meals and it's effect on retinal thickness. Despite these limitations, our study is one of the first to show statistically significant changes in retinal thickness measurements in DME after meals and also studied the retinal thickness changes in relation to blood sugar levels. Future studies with larger sample sizes and more comparable diabetic and nondiabetic groups are needed to further support our results.
Conclusion
The CMT measurements are decreased postprandially in DME patients, more so in patients with high blood sugar levels and those with intraretinal cystic spaces and subretinal fluid in OCT morphology. Thus, fasting status of patients with DME should be taken into consideration during the measurement of CMT by OCT.
Financial support and sponsorship
Nil.
Conflicts of interest
There are no conflicts of interest.
References
- 1.Khan MA, Hashim MJ, King JK, Govender RD, Mustafa H, Al Kaabi J. Epidemiology of type 2 diabetes – Global burden of disease and forecasted trends. J Epidemiol Glob Health. 2020;10:107–11. doi: 10.2991/jegh.k.191028.001. [DOI] [PMC free article] [PubMed] [Google Scholar]
- 2.Zimmet PZ, Alberti KG. Epidemiology of diabetes-status of a pandemic and issues around metabolic surgery. Diabetes Care. 2016;39:878–83. doi: 10.2337/dc16-0273. [DOI] [PubMed] [Google Scholar]
- 3.Gundogan FC, Yolcu U, Akay F, Ilhan A, Ozge G, Uzun S. Diabetic macular edema. Pak J Med Sci. 2016;32:505–10. doi: 10.12669/pjms.322.8496. [DOI] [PMC free article] [PubMed] [Google Scholar]
- 4.Korobelnik JF, Schmidt-Erfurth U, Boyer DS, Holz FG, Heier JS, Midena E, et al. Intravitreal aflibercept for diabetic macular edema. Ophthalmology. 2015;122:2044–52. doi: 10.1016/j.ophtha.2015.06.017. [DOI] [PubMed] [Google Scholar]
- 5.Diabetic Retinopathy Clinical Research Network , Wells JA, Glassman AR, Ayala AR, Jampol LM, Aiello LP, et al. Aflibercept, bevacizumab, or ranibizumab for diabetic macular edema. N Engl J Med. 2015;372:1193–203. doi: 10.1056/NEJMoa1414264. [DOI] [PMC free article] [PubMed] [Google Scholar]
- 6.Bambo MP, Garcia-Martin E, Otin S, Sancho E, Fuertes I, Herrero R, et al. Influence of cataract surgery on repeatability and measurements of spectral domain optical coherence tomography. Br J Ophthalmol. 2014;98:52–8. doi: 10.1136/bjophthalmol-2013-303752. [DOI] [PubMed] [Google Scholar]
- 7.Lathika VK, Minu SP, Skariah K, Charles KS. Influence of cataract on image quality and macular thickness measured using spectral domain optical coherence tomography- a prospective cohort study. Int J Adv Med. 2017;4:546–50. [Google Scholar]
- 8.Sharifipour F, Farrahi F, Moghaddasi A, Idani A, Yaseri M. Diurnal variations in intraocular pressure, central corneal thickness, and macular and retinal nerve fiber layer thickness in diabetics and normal individuals. J Ophthalmic Vis Res. 2016;11:42–7. doi: 10.4103/2008-322X.180708. [DOI] [PMC free article] [PubMed] [Google Scholar]
- 9.Arlotte DV, Perrott RL, Drasdo N, Owens DR, North RV. The effect of post prandial glucose changes on oscillatory potentials in subjects with type 2 diabetes mellitus. Doc Ophthalmol. 2004;109:35–42. doi: 10.1007/s10633-004-1302-y. [DOI] [PubMed] [Google Scholar]
- 10.Falavarjani KG, Khadamy J, Amirkourjani F, Safi H, Modarres M. Macular thickness measurement in clinically significant macular edema before and after meal. J Curr Ophthalmol. 2015;27:125–8. doi: 10.1016/j.joco.2015.11.005. [DOI] [PMC free article] [PubMed] [Google Scholar]
- 11.Fante RJ, Durairaj VD, Oliver SC. Diabetic retinopathy: An update on treatment. Am J Med. 2010;123:213–6. doi: 10.1016/j.amjmed.2009.09.020. [DOI] [PubMed] [Google Scholar]
- 12.Gadkari SS, Maskati QB, Nayak BK. Prevalence of diabetic retinopathy in India: The all India ophthalmological society diabetic retinopathy eye screening study 2014. Indian J Ophthalmol. 2016;64:38–44. doi: 10.4103/0301-4738.178144. [DOI] [PMC free article] [PubMed] [Google Scholar]
- 13.Yau JW, Rogers SL, Kawasaki R, Lamoureux EL, Kowalski JW, Bek T, et al. Global prevalence and major risk factors of diabetic retinopathy. Diabetes Care. 2012;35:556–64. doi: 10.2337/dc11-1909. [DOI] [PMC free article] [PubMed] [Google Scholar]
- 14.Beltramo E, Porta M. Pericyte loss in diabetic retinopathy: Mechanisms and consequences. Curr Med Chem. 2013;20:3218–25. doi: 10.2174/09298673113209990022. [DOI] [PubMed] [Google Scholar]
- 15.Ishihara M, Yukimura Y, Aizawa T, Yamada T, Ohto K, Yoshizawa K. High blood pressure as risk factor in diabetic retinopathy development in NIDDM patients. Diabetes Care. 1987;10:20–5. doi: 10.2337/diacare.10.1.20. [DOI] [PubMed] [Google Scholar]
- 16.Adhi M, Duker JS. Optical coherence tomography – Current and future applications. Curr Opin Ophthalmol. 2013;24:213–21. doi: 10.1097/ICU.0b013e32835f8bf8. [DOI] [PMC free article] [PubMed] [Google Scholar]
- 17.Wolf-Schnurrbusch UE, Ceklic L, Brinkmann CK, Iliev ME, Frey M, Rothenbuehler SP, et al. Macular thickness measurements in healthy eyes using six different optical coherence tomography instruments. Invest Ophthalmol Vis Sci. 2009;50:3432–7. doi: 10.1167/iovs.08-2970. [DOI] [PubMed] [Google Scholar]
- 18.Mitchell P, Bandello F, Schmidt-Erfurth U, Lang GE, Massin P, Schlingemann RO, et al. The restore study: Ranibizumab monotherapy or combined with laser versus laser monotherapy for diabetic macular edema. Ophthalmology. 2011;118:615–25. doi: 10.1016/j.ophtha.2011.01.031. [DOI] [PubMed] [Google Scholar]
- 19.Stana D, Iancu R, Leasu C, Popescu V, Dumitrescu A, Gradinaru S. The role of spectral domain optical coherence tomography in monitoring uncontrolled hypertensive type 2 diabetic patients. J Med Life. 2014:65–7. 7 Spec No 4. [PMC free article] [PubMed] [Google Scholar]
- 20.Sheu SJ, Lee YY, Horng YH, Lin HS, Lai WY, Tsen CL. Characteristics of diabetic macular edema on optical coherence tomography may change over time or after treatment. Clin Ophthalmol. 2018;12:1887–93. doi: 10.2147/OPTH.S173956. [DOI] [PMC free article] [PubMed] [Google Scholar]
- 21.Ojima T, Tanabe T, Hangai M, Yu S, Morishita S, Yoshimura N. Measurement of retinal nerve fiber layer thickness and macular volume for glaucoma detection using optical coherence tomography. Jpn J Ophthalmol. 2007;51:197–203. doi: 10.1007/s10384-006-0433-y. [DOI] [PubMed] [Google Scholar]
- 22.Kim SW, Oh J, Kwon SS, Yoo J, Huh K. Comparison of choroidal thickness among patients with healthy eyes, early age-related maculopathy, neovascular age-related macular degeneration, central serous chorioretinopathy, and polypoidal choroidal vasculopathy. Retina. 2011;31:1904–11. doi: 10.1097/IAE.0b013e31821801c5. [DOI] [PubMed] [Google Scholar]
- 23.Tanga L, Roberti G, Oddone F, Quaranta L, Ferrazza M, Berardo F, et al. Evaluating the effect of pupil dilation on spectral-domain optical coherence tomography measurements and their quality score. BMC Ophthalmol. 2015;15:175. doi: 10.1186/s12886-015-0168-y. [DOI] [PMC free article] [PubMed] [Google Scholar]
- 24.Virgili G, Menchini F, Peluso E, Rosa F, Casazza G. Optical coherence tomography for detection of maculr edema in patients with diabetic retinopathy. Cochrane datbase Syst Rev. 2011 doi: 10.1002/14651858.CD008081.pub2. CD 008081. PMID 21735421. [DOI] [PubMed] [Google Scholar]
- 25.Alkuraya H, Kangave D, Abu El-Asrar AM. The correlation between optical coherence tomographic features and severity of retinopathy, macular thickness and visual acuity in diabetic macular edema. Int Ophthalmol. 2005;26:93–9. doi: 10.1007/s10792-006-9007-8. [DOI] [PubMed] [Google Scholar]
- 26.Niu S, Yu C, Chen Q, Yuan S, Lin J, Fan W, et al. Multimodality analysis of hyper-reflective foci and hard exudates in patients with diabetic retinopathy. Sci Rep. 2017;7:1568. doi: 10.1038/s41598-017-01733-0. [DOI] [PMC free article] [PubMed] [Google Scholar]
- 27.Pendergast SD, Hassan TS, Williams GA, Cox MS, Margherio RR, Ferrone PJ, et al. Vitrectomy for diffuse diabetic macular edema associated with a taut premacular posterior hyaloid. Am J Ophthalmol. 2000;130:178–86. doi: 10.1016/s0002-9394(00)00472-4. [DOI] [PubMed] [Google Scholar]
- 28.Grunwald JE, Riva CE, Martin DB, Quint AR, Epstein PA. Effect of an insulin-induced decrease in blood glucose on the human diabetic retinal circulation. Ophthalmology. 1987;94:1614–20. doi: 10.1016/s0161-6420(87)33257-9. [DOI] [PubMed] [Google Scholar]
- 29.Diabetic Retinopathy Clinical Research Network , Browning DJ, Glassman AR, Aiello LP, Beck RW, Brown DM, et al. Relationship between optical coherence tomography-measured central retinal thickness and visual acuity in diabetic macular edema. Ophthalmology. 2007;114:525–36. doi: 10.1016/j.ophtha.2006.06.052. [DOI] [PMC free article] [PubMed] [Google Scholar]
- 30.Wiemer NG, Eekhoff EM, Simsek S, Heine RJ, Ringens PJ, Polak BC, et al. The effect of acute hyperglycemia on retinal thickness and ocular refraction in healthy subjects. Graefes Arch Clin Exp Ophthalmol. 2008;246:703–8. doi: 10.1007/s00417-007-0729-8. [DOI] [PMC free article] [PubMed] [Google Scholar]