

Abstract
Oligodendrocyte precursor cells (OPCs) generate differentiated mature oligodendrocytes (MOs) during development. In adult brain, OPCs replenish MOs in adaptive plasticity, neurodegenerative disorders, and after trauma. The ability of OPCs to differentiate to MOs decreases with age and is compromised in disease. Here we explored the cell specific and age-dependent differences in gene expression and H3K27ac histone mark in these two cell types. H3K27ac is indicative of active promoters and enhancers. We developed a novel flow-cytometry-based approach to isolate OPC and MO nuclei from human postmortem brain and profiled gene expression and H3K27ac in adult and infant OPCs and MOs genome-wide. In adult brain, we detected extensive H3K27ac differences between the two cell types with high concordance between gene expression and epigenetic changes. Notably, the expression of genes that distinguish MOs from OPCs appears to be under a strong regulatory control by the H3K27ac modification in MOs but not in OPCs. Comparison of gene expression and H3K27ac between infants and adults uncovered numerous developmental changes in each cell type, which were linked to several biological processes, including cell proliferation and glutamate signaling. A striking example was a subset of histone genes that were highly active in infant samples but fully lost activity in adult brain. Our findings demonstrate a considerable rearrangement of the H3K27ac landscape that occurs during the differentiation of OPCs to MOs and during postnatal development of these cell types, which aligned with changes in gene expression. The uncovered regulatory changes justify further in-depth epigenetic studies of OPCs and MOs in development and disease.
Graphical Abstract

INTRODUCTION
Oligodendrocyte precursor cells (oligodendrocyte progenitor cells, OPCs), together with differentiated mature oligodendrocytes (hereafter MOs), astrocytes, and microglia, constitute one of the four major subtypes of glial cells that are present in the central nervous system (CNS) of humans and other mammals (Dawson et al., 2003). One important function of OPCs is to differentiate into MOs, and thereby adjust myelin production during development and in the normal adult brain or regenerate myelin after insult or in disease (Barateiro, Brites and Fernandes, 2016; Kuhn et al., 2017). The MO-generating function of OPCs explains a persistent interest in this cell type as a potential therapeutic target in neurodegenerative diseases (Zhang et al., 2021; Sommer et al., 2022).
An intriguing feature of OPCs is that despite being a proliferative precursor population with an intrinsic capacity for differentiation, they typically persist in quite large numbers even in the adult CNS tissue, where they are uniformly distributed in their own territories within both white and gray matter regions and homeostatically control their density (Barber, Ali and Kucenas, 2022). Nevertheless, the capacity of OPCs to divide and/or to generate new MOs declines with age and is altered in certain diseases and pathological conditions (Castro and Casaccia, 2018; Samudyata, Castelo-Branco and Liu, 2020; Clayton and Tesar, 2021). The biological mechanisms behind these changes remain poorly understood. Recent findings directly implicate OPC dysfunction in the etiology of various diseases of the CNS, including multiple sclerosis, major depressive disorder, and schizophrenia [see, for example, (Clayton and Tesar, 2021) and references therein].
Despite the extensive research conducted on the molecular and cellular biology of oligodendrocyte progenitor cells (OPCs), several challenges hinder the study of this cell type. One of these challenges arises from the involvement of OPCs in a multitude of interconnected biological processes, including proliferation, apoptosis, migration, detection of neurotransmitter signaling from nearby neurons, inflammatory and regenerative responses, and differentiation. Additionally, the complexity of the biochemical and epigenetic mechanisms that regulate these processes further complicates the investigation (Berry, Wang, & Richard Lu, 2020; Pruvost & Moyon, 2021).
Undoubtedly, a comprehensive understanding of OPCs and their mature oligodendrocyte counterparts (MO) through detailed transcriptomic and epigenetic characterization at different developmental stages and under various conditions would greatly benefit the field. However, such thorough genome-wide analyses are limited, even in well-studied model organisms like mice. This limitation is partly attributed to the low proportion of OPCs among the diverse cell types in the brain, as well as the inefficiency of purification procedures. In the case of humans, the situation becomes even more challenging due to the necessity of isolating OPCs from postmortem tissue, which poses its own set of challenges.
Building upon our previous research on the cell-type-specific epigenetics of human brain cell populations (Kozlenkov et al., 2018, 2015), this study delves into the distinctive transcriptional and epigenetic characteristics of human oligodendrocyte progenitor cells (OPCs) and mature oligodendrocytes (MOs). Specifically, we focused on the H3K27ac histone mark, which serves as a reliable indicator of active chromatin within gene regulatory elements such as promoters and enhancers (Creyghton et al., 2010). Additionally, we aimed to explore the transcriptional and H3K27ac changes that occur within each of these cell types as they progress along the developmental trajectory, specifically from the early postnatal stage to adulthood.
To accomplish these objectives, we first developed and validated a novel protocol based on fluorescence-activated nuclei sorting (FANS), enabling us to isolate a large number of nuclei from OPCs and MOs in human postmortem brain tissue. Subsequently, we conducted an in-depth analysis of the transcriptomic and H3K27ac landscapes within these cell types. Our findings revealed substantial differences between adult OPCs and MOs, likely reflecting the essential H3K27ac profile reorganization that takes place during oligodendroglial differentiation. Furthermore, significant alterations in gene expression and H3K27ac patterns were observed in OPCs and/or MOs between infancy and adulthood. These changes suggest a gradual modulation of cell cycle regulation, transcriptional activity, and neurotransmitter signaling within OPCs throughout postnatal development.
METHODS
Human brain tissue specimens
Postmortem brain samples were from non-psychiatric control subjects (see Table S1). The samples were obtained from the NIH NeuroBioBank. Tissue specimens were dissected from gray matter of dorsolateral prefrontal cortex (DLPFC) by an expert neuropathologist. Approximately 200–300mg of tissue was used per experiment for nuclei isolation.
Fluorescence-activated nuclei sorting (FANS) isolation of OPC and MO nuclei from human postmortem brain
We introduce a novel method to isolate OPC and MO nuclei by FANS from frozen postmortem brain tissue. The method employs the basic framework of previously developed FANS protocols to isolate nuclei of other major brain cell populations, including glutamatergic and GABAergic neurons and oligodendroglial lineage cells (Kozlenkov et al., 2018, 2020, 2015), as well as total neuronal and glial populations (Jiang, Matevossian, Huang, Straubhaar, & Akbarian, 2008). The protocol includes the following steps: (1) tissue specimens are homogenized at 4C in 4 ml of lysis buffer with a glass Douncer, (2) the homogenates are underlaid with a 4.5 ml layer of high sucrose buffer, and centrifuged at 24,000 rpm for 1 hour, (3) nuclear pellets are resuspended in 300 ul of blocking buffer and incubated with primary antibodies for 1.5 hours while rotating at 4C, (4) another centrifugation step for 30 min through a layer of high sucrose buffer is performed, (5) nuclear pellets are resuspended in blocking buffer and incubated with secondary antibodies for 1 hour, (6) after diluting the samples 5x times, a DNA dye (DAPI) is added, and the samples are separated by FANS on a flow cytometer.
The following reagents, parameters and modifications to the basic protocol were employed in the current work to perform efficient isolation of OPC nuclei, ensuring a clear separation between the sorted OPC and MO nuclear populations and a sufficient yield of sorted nuclei even from a limited amount of tissue material (up to 250,000 OPC nuclei from as low as 200–300 mg postmortem brain tissue). Primary antibodies were against the targets: NeuN (also known as RBFOX3) – a well-established marker of neuronal nuclei (Jiang et al., 2008), SOX10 – a marker of oligodendroglial lineage cells (Ernst et al., 2014), and SOX6 – a marker of OPCs (Stolt et al., 2006). The concentrations of antibodies, and the combination of fluorophores used together with the primary antibodies were optimized to ensure the minimal spillover between the signals from different fluorophore channels and the most efficient separation between various cell populations. For anti-SOX10 antibodies (goat polyclonal, R&D Systems, AF2864), custom-made direct conjugates with the AF647 fluorophore were prepared and used at 1:150 dilution. For anti-NeuN antibodies, commercially available direct conjugates with the phycoerythrin (PE) fluorophore were used (mouse monoclonal anti-NeuN-PE, Millipore, FCMAB317PE, at 1:1000 dilution). For anti-SOX6 antibodies [guinea pig polyclonal antibodies, 1:1000 dilution (Stolt et al., 2006)], anti-guinea pig AF488-conjugated secondary antibodies (Jackson ImmunoResearch, 706–546-148) were used at a 1:250 dilution during the second incubation step. The use of the flow cytometer instrument BD Influx with four lasers (355nm, 488nm, 561nm and 640nm) allowed for an improved separation between sorted populations with no need to perform compensation. The details of the gating steps in the flow cytometry protocol are provided in the Results section (see also Fig. 1).
Figure 1. Schematic of the FANS protocol to isolate nuclei of OPC and MO cells from human postmortem brain tissue.
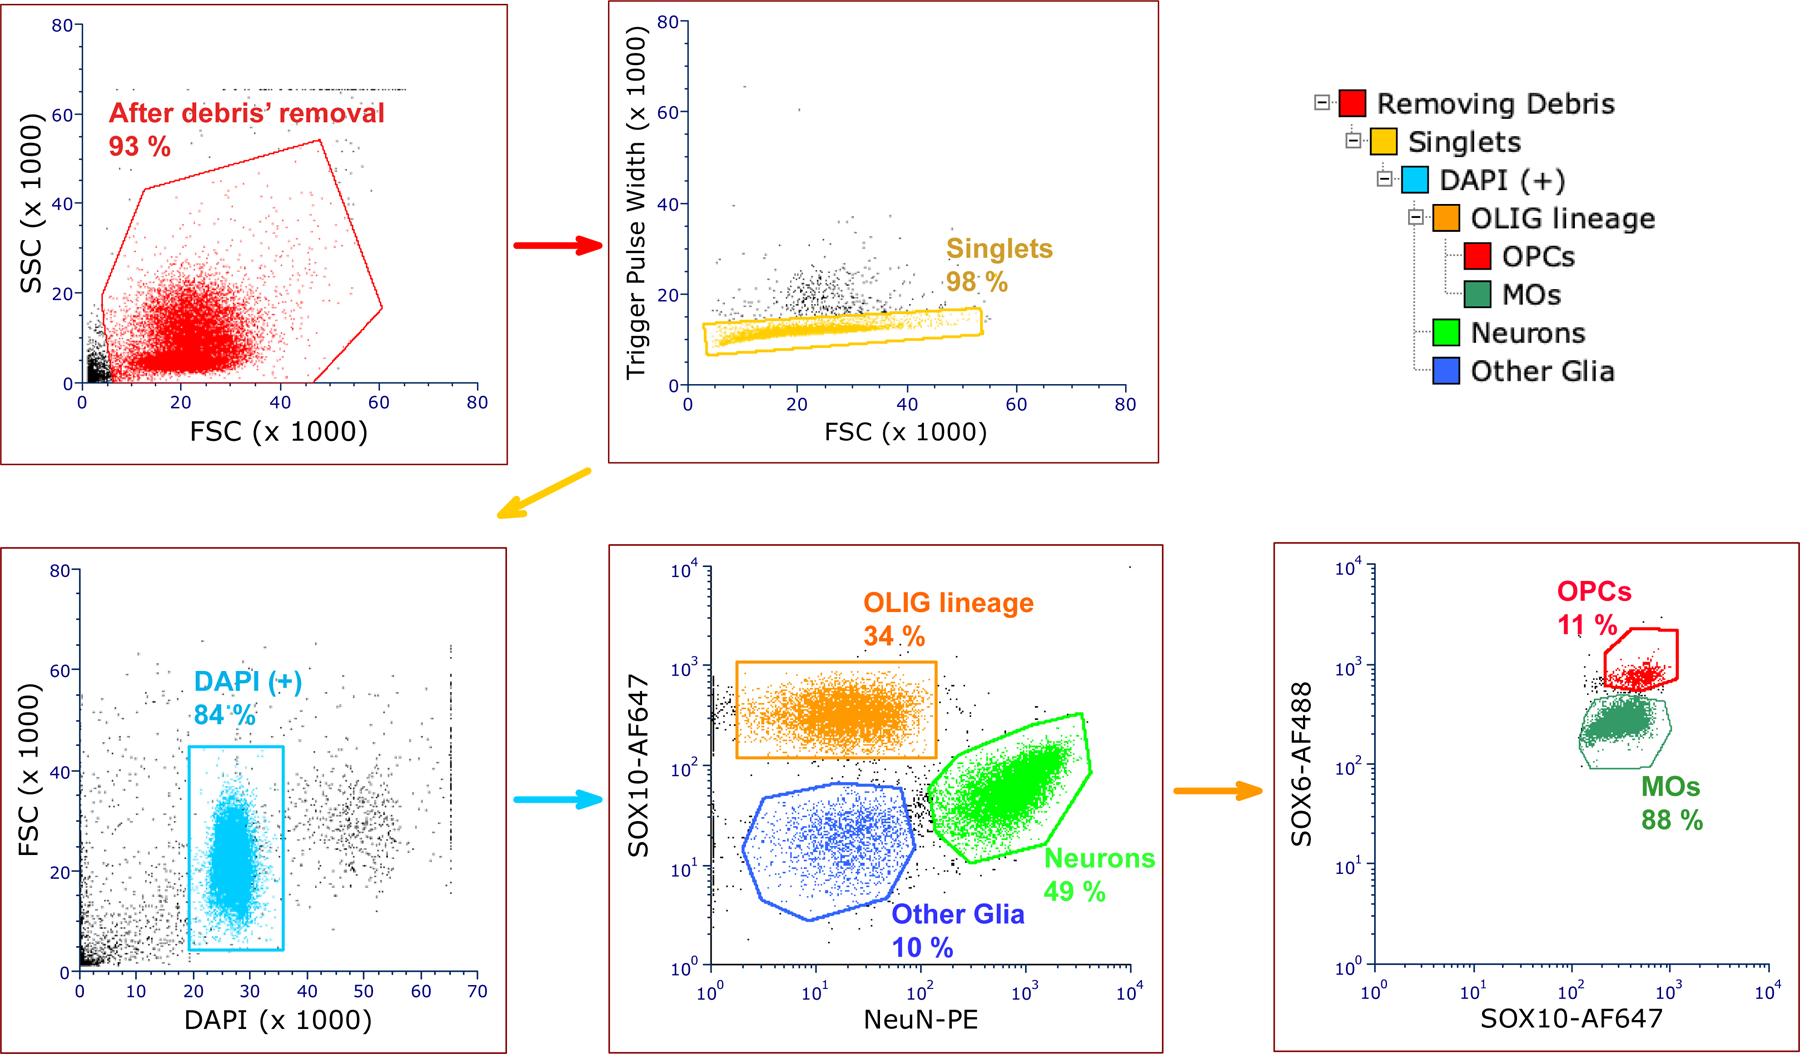
Data for a representative FANS experiment are shown. Upper right panel, dendrogram of the FANS gating steps. Other panels show the sequential gating steps. The labels on the axes denote the antibodies (NeuN, SOX10, SOX6) and the fluorophores (DAPI, PE, AF488, AF647) used. The numbers represent the percentages of sorted populations relative to the parent population in the previous gating step.
In the experiments aimed at obtaining OPC and MO nuclei for RNA isolation, RNase inhibitors were added to all buffers during the nuclei preparation protocol (Recombinant RNase Inhibitors, Takara; 1:40 dilution). In the experiments aimed at obtaining nuclei for ChIP, protease inhibitors (benzamidine (Sigma) and PMSF (Thermofisher Scientific) at 1:1000 dilutions from 0.1 M stocks) were added to the lysis buffer. A small-diameter (70-micron) sorting nozzle was used to minimize the volume of sorted nuclei, which could then be used directly in the ChIP or RNA isolation protocols without the need to concentrate nuclei by pelleting.
RNA isolation and RNA-seq library preparation
To isolate total nuclear RNA from sorted OPC and MO populations, ~200,000 nuclei of each cell type were sorted directly into nuclease-free Eppendorf tubes containing RNA Extraction Buffer (PicoPure kit, Thermofisher Scientific), at a volume ratio 3:1 of Extraction Buffer to the final volume of sorted nuclei. The nuclei-Extraction Buffer mixture was incubated at 42C for 30 min with shaking, and frozen at −80C until RNA isolation. The remaining part of RNA isolation with the PicoPure kit was performed according to the manufacturer’s protocol, including an on-column DNAse digestion step.
For RNA-seq library construction, Pico Input Mammalian SMARTer® Stranded Total RNA-Seq Kit v2 (Takara) was used, with 10 ng RNA as input material and 12 cycles of PCR amplification. The SMARTer® Total RNA-Seq protocol includes a ribosomal cDNA depletion step. Libraries were sequenced on a NovaSeq S4 instrument (Illumina) using the paired-end 100-cycle (PE100) protocol to the average depth of ~50 million reads per sample.
Chromatin immunoprecipitation and ChIP-seq library preparation
The native ChIP protocol using chromatin digestion with micrococcal nuclease (MNase) was as described in (Brind’Amour et al., 2015; Kozlenkov et al., 2018). 150,000 to 200,000 nuclei of each cell type were used per ChIP reaction. Anti-H3K27ac antibody was from Active Motif (catalog #39133; rabbit polyclonal, 3 μg per sample). ChIP-seq libraries were prepared with the NEBNext Ultra II DNA Library Prep Kit (New England BioLabs). For each cell type and age group, matching input control libraries obtained from 1 ng of MNase-digested DNA were also prepared. The resulting libraries were sequenced on NovaSeq using the PE100 protocol, to the average depth of ~35 million read pairs per sample.
RNA-seq data analysis
RNA-seq FASTQ files were trimmed to remove sequencing adapters and low-quality sequences using Scythe (github.com/vsbuffalo/scythe) and Sickle (github.com/najoshi/sickle) software tools. The first 3 bp of Read 2 were removed with seqtk (github.com/lh3/seqtk), according to the instructions for the SMARTer® Stranded Total RNA-Seq v2 Kit. Trimmed reads were then mapped to the hg38 genome and annotated transcriptome GTF_ENSEMBL_v92 with STAR (github.com/alexdobin/STAR). Read counts per gene were calculated using the featureCounts command in the “subread” software tool (subread.sourceforge.net). Only the reads that mapped to exons were included. Differentially expressed genes were then called with the R package DESeq2 (Love, Huber, & Anders, 2014). The genes with low read counts were excluded with the “independent filtering” option during the DESeq2 analysis. Differentially expressed (DE) genes were defined using the settings: Fold Change > 2, FDR < 0.05.
ChIP-seq data analysis
FASTQ files were pre-processed to remove adapters, low quality sequences and PCR duplicates using the HTStream software tool (github.com/s4hts/HTStream). The reads were then mapped to the hg38 genome build with the BWA MEM software (github.com/bwa-mem2). The resulting BAM files were further filtered to remove multimapping reads and other lower quality alignments using the command “samtools view -F 2048 -f 2 -q 30 -b “ (the samtools package; hstlib.org). The reads mapping to ENCODE-blacklisted genomic regions (Amemiya, Kundaje, & Boyle, 2019) were removed with the “bedtools intersect -v” command from the bedtools software package (github.com/arq5x/bedtools2). H3K27ac-enriched regions (peaks) were called using MACS2 [pypi.org/project/MACS2, (Feng, Liu, Qin, Zhang, & Liu, 2012b)] including input controls for each cell type and age group and the following command line settings: callpeak -B -f BAMPE --broad --broad-cutoff 0.00001, as described in (Kozlenkov et al., 2020).
For each condition (e.g., infant OPCs, infant MOs, adult OPCs, adult MOs), we then generated a consensus set of peaks, using the following procedure. The sets of individual replicates from a particular condition (e.g., 5 replicates for adult OPCs), each represented as an individual BED file containing the genomic coordinates of peaks called with MACS2, were analyzed together. The positions of the peak coordinates from these replicate BED files were then overlapped. Only those peaks which were detected by MACS2 in at least 3 replicates were preserved. When the peaks from two replicates overlapped only partially, a merged peak was created. For each condition, this procedure resulted in one set of consensus peaks (represented by one BED file). The procedure was performed using a custom R script in the Rstudio software environment.
The pairwise differential acetylation comparisons were then performed between pairs of conditions (e.g., between adult OPCs and adult MOs, or between adult OPCs and infant OPCs). To this end, the two consensus peak sets were merged into one combined consensus set (e.g., a combined adult set, or a combined OPC set), by preserving every genomic position that constituted a peak in at least one of the two conditions.
This combined consensus peak set was then compared with the individual BAM files, and the number of reads for each consensus position within each individual BAM file was calculated using the coverage command in the software package bedtools. The matrix of read count numbers was then fed into the software tool DESeq2, and differential acetylation analysis was performed as described in (Kozlenkov et al., 2020). The thresholds FC>2 and FDR<0.05 were used to define differentially acetylated (DA) peaks. The annotation of H3K27ac peaks to nearby genes was performed with the R package ChIPseeker (guangchuangyu.github.io/software/ChIPseeker).
Gene ontology analysis
Gene ontology (GO) analysis of the OPC- and MO-enriched DE genes was done with WebGestalt (http://bioinfo.vanderbilt.edu), with the setting FDR<0.05, and the “affinity propagation” option to exclude highly redundant GO terms from the results. The custom reference gene list included 16,354 protein-coding and lincRNA genes for which DE information was available in the current study (Table S2). GO analysis of DA peaks in the OPC vs. MO and infant vs. adult comparisons was done with GREAT (great.stanford.edu), using the “basal plus extension” option, and the +/-1,000 bp range to define the transcription start site-proximal regions. The default setting (<1,000,000 bp) for the maximal extension of the regulatory domain was used to analyze DA peaks in the infant vs. adult comparison. A more stringent setting (<100,000 bp) was used for the adult OPC vs. MO comparison as per software suggestion, because of the high number of detected DA peaks in that comparison.
Immunohistochemistry and immunofluorescence Imaging
Frozen brain tissue specimens (~50–100 mg) were embedded in OCT, cut on a Leica cryostat into 16 um sections and placed on glass slides. The sections were left to dry overnight at room temperature and transferred to −80C in a slide box for storage. One a day of experiment, sections were fixed for 30 min in 4 % PFA, rinsed 2 times for 10 min each in PBS and incubated for 2 h in blocking buffer (BB) (50 mM TrisHCl pH 7.6, 0.15M NaCl, 10 % normal goat serum (Jackson Immunoresearch), 0.3 % Triton X-100). Primary antibodies were diluted in BB and applied to sections for 20 – 24 h. The sections were then rinsed 6 times for 10 min each in PBS and incubated for 2 h with secondary antibodies (donkey AF488, AF555 or AF647 conjugates, Invitrogen) diluted 1:500 in BB. The sections were rinsed in PBS 6 times for 10 min each, stained with DAPI (1 mg/ml in PBS) and mounted with Fluorogel mounting medium. The following primary antibodies and dilutions were used: anti-NG2, mouse monoclonal (50-245-581, Invitrogen) at 1:50 dilution, anti-OLIG2, goat polyclonal (AF2418, R&D Systems) at 1:200 dilution, anti-Ki67 rabbit monoclonal (ab16667, Abcam) at 1:200 dilution, anti-SOX9 rabbit monoclonal [EPR14335-78] (ab185966, Abcam) at 1:150 dilution. Confocal Imaging was performed on a Zeiss LSM 880 microscope. Alternatively, section scanning was performed on a digital slide scanner Pannoramic P250 (3DHISTECH). All replicate samples were imaged using the identical microscope settings. The images were analyzed with the image processing software ImageJ. Image analysis was performed on randomized image files by a person who was agnostic to the identity of the samples.
Analysis of transcription factor binding motifs
Transcription factor (TF) motif analysis was performed with the software tool HOMER using the command “findMotifs.pl”. findMotifs.pl analyzes the promoters of genes and detects TF motifs that are enriched in the promoters of the target gene set relative to other promoters (the background set). The lists of age-dependent DE genes from OPC and MO analyses were used as the target sets, whereas the background gene sets consisted of all genes expressed in OPCs or MOs. The region of interest was defined as the +/-100 bp region surrounding the TSS.
Gene set enrichment analysis (GSEA) in application to RNA-seq and ChIP-seq data
GSEA is typically used as a threshold-independent gene ontology (GO) method to analyze a set of genes that are ranked using a quantitative metric, such as the log2 fold change value obtained from a differential expression analysis. In this study, we employed the GSEA in two different contexts. When analyzing a differential gene expression dataset, GSEA was performed using the standard GSEA pipeline in R with the gseGO command from the R package “clusterProfiler”.
In addition, being interested in a threshold-independent GO approach to ChIP-seq data, in the current study we adapted the GSEA method to analyze the results of differential acetylation (DA) comparisons in H3K27ac peaks. To this end, for each H3K27ac peak in a H3K27ac dataset, a composite quantitative metric (weighted fold change, wFC) was constructed that took into account both the log2 fold change value (log2FC) from the DA comparison and the distance of the peak from the nearest TSS. Specifically, wFC is defined as the product of logFC and the weighting factor (WF), where WF is constructed as a function of peak-to-TSS distance (Dist) as follows: WF = 1 if Dist <= 1,000 bp, and WF = 1/(log10(Dist)-2) if Dist > 1,000 bp. In particular, WF(1,000) = 1, WF(10,000) = 1/2, WF(100,000) = 1/3, etc. As the result, the weighted fold change wFC = log2FC * WF is inversely dependent on the distance of the peak from TSS. The wFC metric is then used to rank the peaks linked to a particular gene. The peak with the highest wFC is then chosen to represent the gene in the standard GSEA approach using the gseGO command in R and the value of wFC as the quantitative metric.
RESULTS
Isolation of OPC and MO nuclei from postmortem brain using a novel FANS protocol
We developed a novel experimental protocol to isolate highly purified nuclear populations of OPC and MO cells from human postmortem brain tissue. This protocol capitalizes on our previous research on a transcription factor SOX6 which is a specific marker of two distinct cell populations in the CNS: medial ganglionic eminence (MGE)-derived GABA neurons and OPCs (Stolt et al., 2006; Kozlenkov et al., 2015, 2018). The protocol is based on a multi-antibody/multi-color flow cytometry-based nuclei isolation approach, employing specific antibodies against NeuN (a marker of differentiated neurons), SOX10 (an oligodendroglial lineage marker), and SOX6. We sequentially gated single nuclei (DAPI+ particles) towards the total glial population (NeuN- nuclei), the oligodendroglial nuclei (“OLIG”; NeuN-/SOX10+ nuclei), and then further into the two mutually complementary populations of SOX10+/SOX6- and SOX10+/SOX6+ glial nuclei, which presumably corresponded to the MO and OPC populations, respectively (Fig. 1). Optimizing the antibody concentrations and the sorting parameters, we achieved a clear separation between the sorted cell types. The yield of the SOX10+/SOX6+ nuclei varied depending on the brain tissue sample and was in the range of 2–5% of all nuclei, which was in agreement with the earlier estimates of OPC numbers in the adult human cortex [2–3%, (Dawson et al., 2003)]. We successfully tested the protocol on human postmortem tissue samples from multiple cortical brain regions, including dorsolateral prefrontal cortex (DLPFC), as well as orbitofrontal and motor cortices, demonstrating its robustness and low technical variability (data not shown).
Validation of the identity of FANS-separated OPC and MO populations from adult brain by gene expression profiling
To validate the nature and purity of the isolated NeuN-/SOX10+/SOX6- and NeuN-/SOX10+/SOX6+ populations, we performed nuclear RNA-seq analysis on nuclei isolated from DLPFC postmortem brain samples of 3 adult neurotypical human subjects (Table S1). We then conducted exploratory data analyses of the obtained gene expression datasets using unsupervised hierarchical clustering and Pearson correlation analysis (Fig. S1), as well as principal component analysis (PCA) (Fig. 2A). We observed high correlations between the replicate samples from the same cell type (3 replicates each, for OPC or MO cell types; r > 0.99, Pearson correlations). Both the clustering analysis and PCA showed that the samples were clearly separated into two groups, with ~80% of the total variance in the PCA associated with the difference of transcriptome patterns between OPCs and MOs. We then performed differential expression (DE) analysis between OPCs and MOs, defining DE genes using the thresholds of FDR < 0.05 and fold change (FC) > 2. The analysis resulted in 5,091 genes that were DE between the two cell types, with 3,026 genes displaying significantly higher expression in OPCs (hereafter denoted as “OPC>MO” or “OPC-enriched genes”), and 2,065 genes displaying higher expression in MOs (“MO>OPC” or “MO-enriched genes”) (Table S2). Comparison between average OPC and MO gene expression levels (shown for protein-coding and lincRNA genes, a total of N=18,063 genes) showed that well-established gene markers of the OPC population (PDGFRA, CSPG4, SOX6) displayed a strong enrichment in the OPC samples, whereas MO markers (MOG, MAG, MOBP, CLDN1) were enriched in the MO samples (Fig. 2B). Also, oligodendroglial lineage markers SOX10 and NKX2-2 showed high expression levels and were nearly equally expressed in both cell types. Non-oligodendroglial markers—BDNF, RBFOX3, NEUROD6 (marker genes for neurons), GLI3, GLI2, AQP4 (marker genes for astrocytes), and CX3CR1, AIF1, ITGAM (microglial markers)—showed lower expression levels in both OPCs and MOs. In an additional analysis, we compared our OPC vs. MO DE results with the single-cell RNA-seq gene expression data from Allen Brain Atlas (https://portal.brain-map.org/atlases-and-data/rnaseq, dataset for multiple cortical areas) for OPCs and mature oligodendrocytes (Fig. S2). We detected high overall correlation of OPC vs. MO fold changes between the two data sets (r = 0.76, Pearson correlation), with most known OPC- or MO-specific genes showing concordant levels of cell-type-specific enrichment, whereas oligodendroglial lineage markers (e.g., SOX10) were expressed at similar levels in both cell types in the two data sets.
Figure 2. Validation of the FANS-separated OPC and MO populations by gene expression profiling.
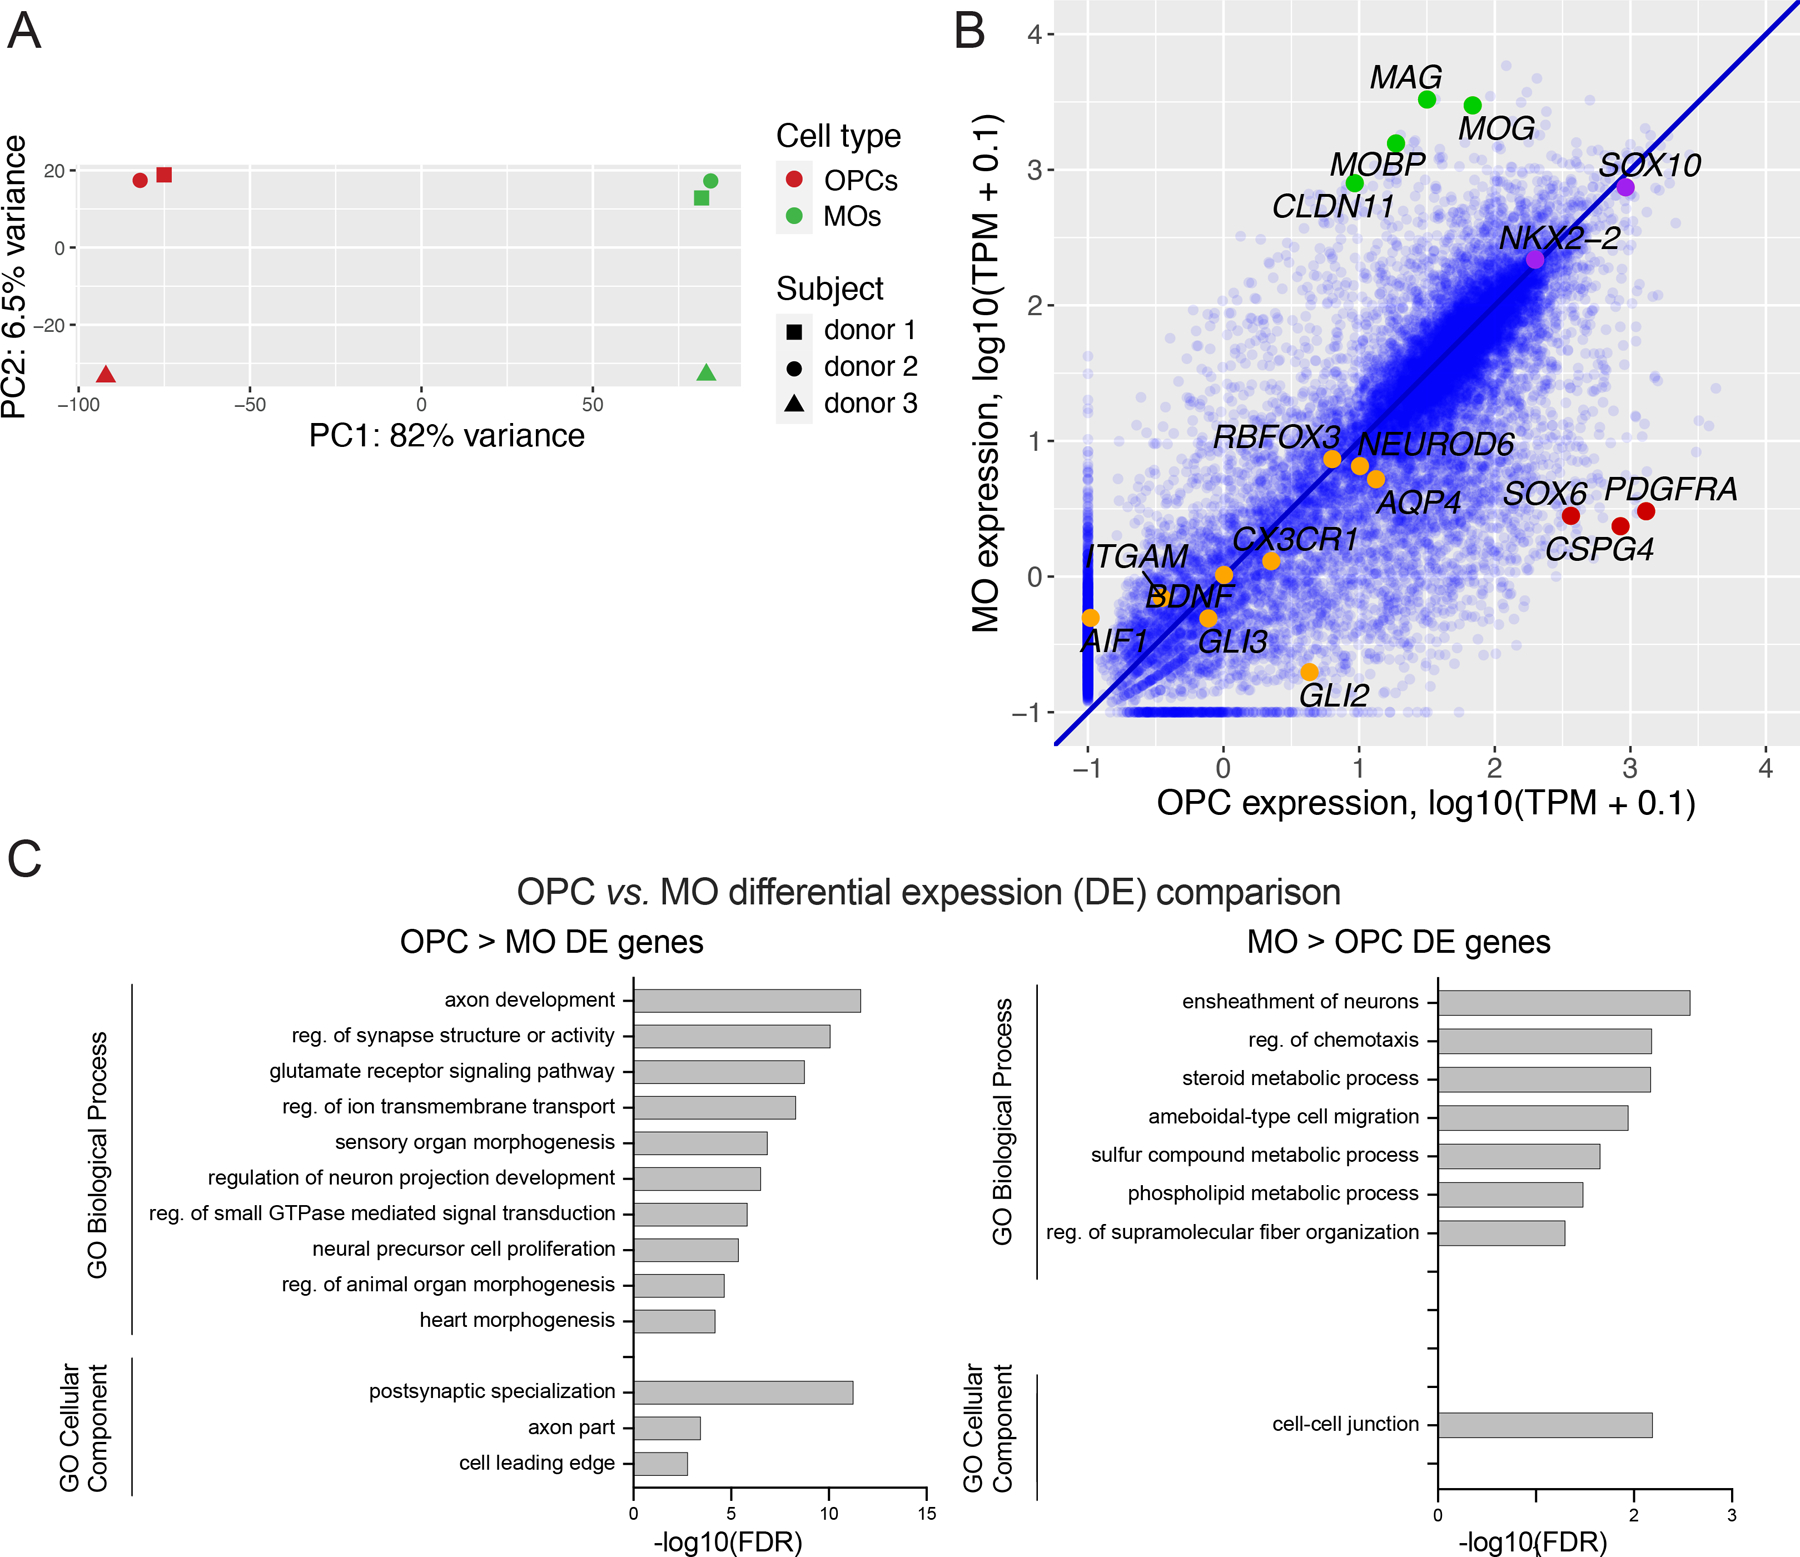
(A) Principal component (PC) analysis of nuclear RNA-seq data sets of MOs and OPCs from 3 donors. (B) Pairwise comparison of gene expression between OPCs and MOs. Each dot represents one gene (data for protein-coding or lincRNA genes are shown). TPM, transcripts per million reads. Green, examples of known markers of MOs. Red, examples of known markers of OPCs. Purple, examples of oligodendroglial lineage markers (e.g., SOX10, NKX2-2). Orange, examples of markers of other brain cell populations (e.g., BDNF, GLI3, CX3CR1). (C) Gene ontology (GO) analysis of the differentially expressed (DE) genes which are enriched in either OPCs (left) or in MOs (right) compared to the other cell type. The website portal WebGestalt was used for the analysis (see Methods). Data for GO Biological Processes and GO Cellular Components are shown for a maximum of 10 top enriched terms. See Table S3 for the entire list of enriched GO terms.
To interpret the function of the isolated cell types, we performed functional enrichment (Gene Ontology; GO) analysis of the OPC- and MO-enriched genes using WebGestalt (Fig. 2C, Table S3). The most significant GO Biological Process term for the MO DE gene list was “ensheathment of neurons”, which is consistent with the major biological function of this cell type. Among other terms, OPC DE genes showed enrichments for “neural precursor cell proliferation”, “glutamate receptor signaling pathway”, and “postsynaptic specialization” terms. This was in line with the partially retained cell proliferation potential of OPC cells in adult brain, as well as the expression of multiple families of ion channels in this cell type, as was reported previously (Cherchi et al., 2021) and in this study (Table S2). Likewise, some of the GO terms enriched for MO DE genes (such as “cell-cell junction”, “steroid metabolic process”, and “phospholipid metabolic process”) reflect the cellular processes which are expected to be specifically upregulated in MOs in adult brain, including the formation and maintenance of inter-membrane contacts, and the synthesis of membrane lipids (Aggarwal, Yurlova and Simons, 2011; Chrast et al., 2011; Bakhti, Aggarwal and Simons, 2014; Schmitt, Cantuti Castelvetri and Simons, 2015).
Gene set enrichment analysis (GSEA) was also employed to study the differential expression comparison between adult OPCs and MOs (Table S4). Importantly, the GSEA methods does not rely on arbitrarily chosen threshold settings but instead utilizes the entire differential expression dataset. A large number of significantly enriched GO terms were found for OPC DE genes, including the terms related to glutamatergic synapse, postsynaptic membrane, and neural precursor cell proliferation. The few significant GO terms enriched for MO DE genes included “axon ensheathment” and “myelination”. Consequently, the findings from two independent GO analysis methods exhibited a strong concurrence.
Collectively, the results of the RNA-seq analysis confirm that the obtained FAN-sorted populations of NeuN-/SOX10+/SOX6- and NeuN-/SOX10+/SOX6+ nuclei indeed represent highly enriched populations of MOs and OPCs, respectively, thus validating our novel experimental approach to isolate OPC and MO nuclei. Notably, the obtained deeply sequenced transcriptomic profiles of human adult OPC and MO cells can serve as a valuable resource to explore gene expression patterns in the two cell types. In particular, employing the list of human transcription factors catalogued in (Lambert et al., 2018), we found 213 OPC-enriched and 108 MO-enriched transcription factors (Table S5), representing a novel and important resource for future studies of gene expression regulation and signaling pathways in the oligodendroglial cells.
H3K27ac ChIP-seq characterization of human adult OPC and MO cells
We next characterized the epigenetic landscapes of these two cell types in adult human DLPFC. We performed a native MNase-based ChIP-seq assay (Brind’Amour et al., 2015; Kozlenkov et al., 2020) with anti-H3K27ac antibodies in the OPC and MO nuclei (~200,000 per experiment) isolated from the DLPFC tissue specimens of 5 human adult neurotypical subjects (N=10 samples, 5 replicates of OPCs and MOs) (Methods, Table S1). For each sample, the MACS2 peak-calling software tool was used to detect H3K27ac peaks (Feng et al., 2012). For each cell type, a consensus set of H3K27ac peaks was then constructed by overlapping the peaks across the individual samples and excluding peaks which were detected in less than one half of all biological replicates (N<3, Methods, Fig. S3). The resulting consensus H3K27ac sets contained 52,960 OPC peaks and 44,512 MO peaks. Visual inspection of the H3K27ac traces in the IGV genome browser showed a high signal-to-noise ratio, as well as multiple regions with strong differences between OPCs and MOs, including regions corresponding to the known OPC and MO marker genes (CSPG4, PDGFRA, and MOBP, MOG, respectively) (Fig. 3A).
Figure 3. Comparison of the H3K27ac landscapes between adult OPCs and MOs.
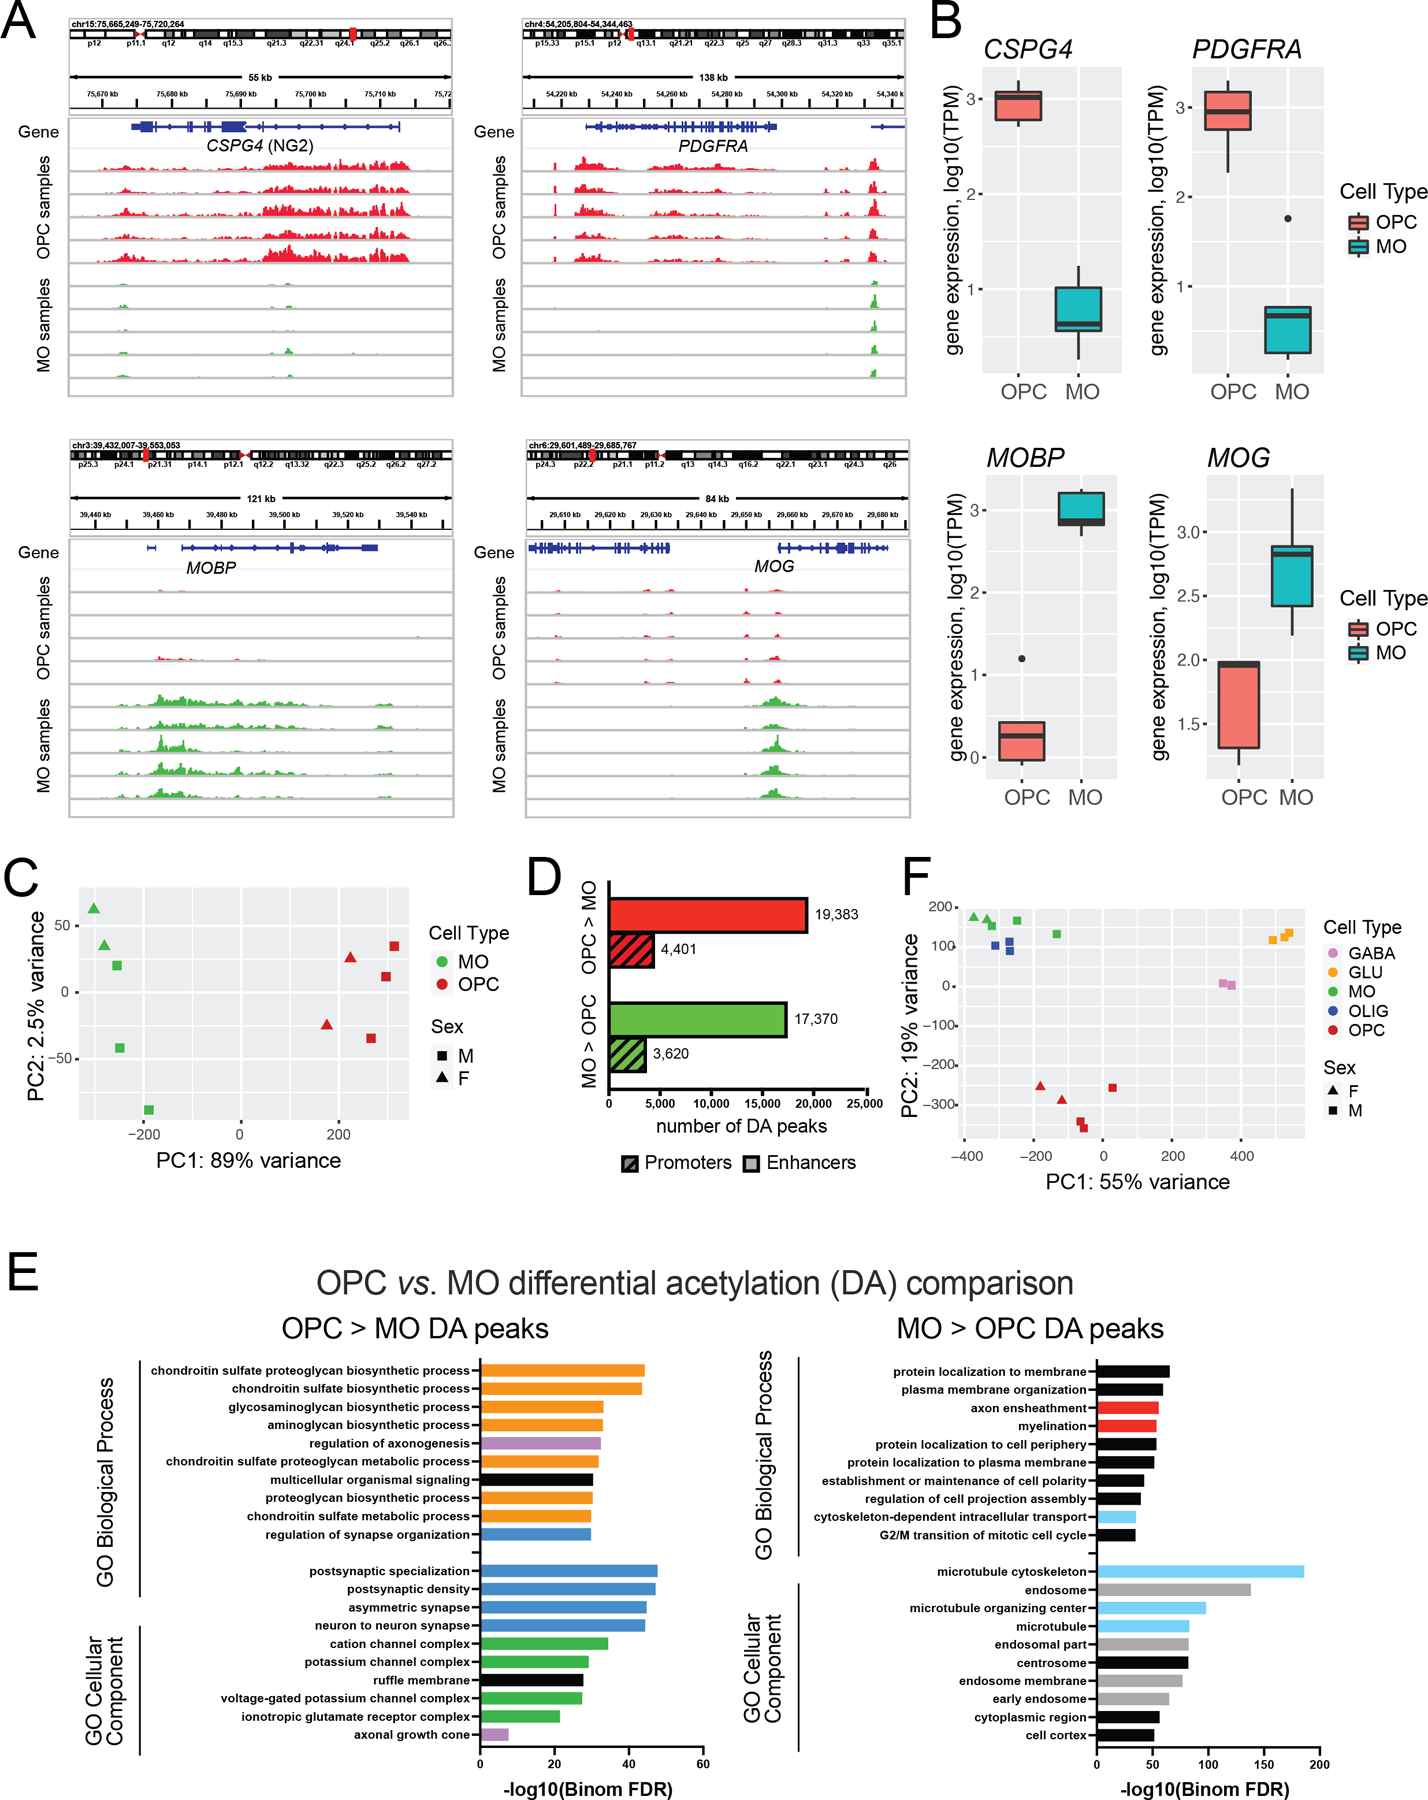
(A) H3K27ac ChIP-seq profiles within loci of OPC (CSPG4, PDGFRA) or MO (MOBP, MOG) marker genes. H3K27ac traces for OPC and MO samples from 5 adult donors are shown. Red traces denote OPC and green traces denote MO samples. The H3K27ac signal is normalized across all samples. (B) Gene expression data for genes shown in (A). (C) PC analysis of the H3K27ac adult data sets. (D) Barplot depicting the numbers of differentially acetylated (DA) peaks identified in the OPC vs. MO comparison using DESeq2 with thresholds FC > 2 and FDR < 0.05. (E) GO analysis of the DA peaks which are enriched in OPCs (left) and MOs (right) compared to the other cell type. The website portal GREAT was used for the analysis. Data for GO Biological Processes and GO Cellular Components for the maximum 10 top enriched terms are shown. See Table S7 for the entire list of the enriched GO terms. Red, GO terms associated with myelination. Light blue, cytoskeleton. Orange, proteoglycan biosynthesis. Dark blue, synaptic components. Pink: axonogenesis. Green: ion channels. Gray: endosomal transport. (F) PC analysis of the combined H3K27ac data sets of MOs and OPCs from this study, and GLU neurons, MGE-GABA neurons and oligodendroglial (OLIG) cells from (Kozlenkov et al., 2018). OLIG consist of OPC and MO populations. Data for all detected peaks were used in the analysis; see Fig. S4 for the analysis of the 1,000 most variable peaks.
We then overlapped the consensus peak sets for the adult OPCs and MOs, obtaining a merged set of 69,372 peaks. Within them, there were 18,890 promoter peaks (defined with a threshold TSS distance < 1,000) and 50,482 distal peaks that correspond to putative enhancers. Principal component analysis of the merged data set (Fig. 3C) showed a clear separation between the replicate samples of OPCs and MOs, with PC1 accounting for 89% of total variance, reflecting the differences between the cell types.
Next, we performed the differential acetylation (DA) analysis between OPCs and MOs with the software tool DESeq2, as described [(Kozlenkov et al., 2020), Methods], adjusting for subject ID, and applying the thresholds of FC > 2 and FDR < 0.05 to define the DA peaks significantly enriched in one of the cell types (OPC- or MO-enriched peaks). The analysis resulted in 23,784 OPC- and 20,990 MO-enriched peaks (Table S6). Thus, ~65 % of all active chromatin regions detected in the combined oligodendroglial lineage data set show significant differences in the H3K27ac signal between the two cell types, with DA promoters comprising ~18% of all DA peaks (Fig. 3D). These data indicate high divergence of the epigenomic profiles between adult OPCs and MOs.
Using GO tool GREAT, we investigated whether the OPC DA and MO DA peaks could be linked to genes associated with specific biological pathways or cellular components [(McLean et al., 2010), Methods], detecting large number of cell-type-specific enriched terms (Table S7, and Fig. 3E). We combined these terms into a smaller number of groups with similar biological processes. In particular, myelination-related terms were among the top significant terms for MO DA peaks (red in Fig. 3E). In contrast, proteoglycan biosynthesis-related terms were significant only for OPC DA peaks (orange, Fig. 3E). As exemplified by CSPG4 (NG2) (Fig. 3B), a number of proteoglycan genes appear to have their expression specifically elevated in OPCs compared to MOs. Other OPC DA peaks-enriched terms were related to synapse- and postsynaptic density (dark blue), axonal development (pink) and ion channel function (green), suggesting that adult OPCs express many genes which are typically associated with neuronal signaling, especially the post-synaptic component thereof. This is consistent with the published data that OPCs are often found in close association with nearby neurons and monitor neuronal activity via a plethora of the OPC-expressed ion channels and receptors (Akay, Effenberger and Tsai, 2021; Moura et al., 2022).
We also overlapped the OPC and MO consensus peak sets with those from other brain cell types identified in our previous work—glutamatergic (GLU) neurons, medial ganglionic eminence (MGE)-GABA neurons, and oligodendroglial cells (OLIG) that comprise MOs and OPCs (Kozlenkov et al., 2020). PCA of the resulting merged set of peaks (N = 252,392 peaks) demonstrated the uniqueness of the H3K27ac landscape in OPCs compared with other brain cell types (Fig. 3F). However, when PCA was applied to the 1,000 most variable peaks, OPCs clustered with MOs and oligodendroglial cells (Kozlenkov et al., 2020) (Fig. S4). This result suggests that the H3K27ac pattern that defines the common signature of oligodendroglial cells (OPCs and MOs) is dependent on a relatively small number of active regulatory elements with strong differences in the H3K27ac signal compared to other cell types.
In summary, we demonstrated that the H3K27ac landscape of adult OPCs is highly divergent from MOs, with the differences in the H3K27ac profiles of these two cell types reflecting the specialization of their biological processes and functions.
Correlation between the H3K27ac epigenetic landscape and gene expression profiles in adult OPC and MO cells
We tested if the considerable divergence of the H3K27ac profiles between adult OPC and MO cells manifested in concordant gene expression differences in the H3K27ac-regulated genes. Using the ChIPseeker software tool to link H3K27ac-marked regulatory elements with nearby genes (Methods), we constructed a combined dataset of gene expression and H3K27ac signal, obtaining a total of 52,107 peak-to-gene pairs, comprising 11,999 unique genes. Among them, we detected 10,131 OPC-enriched and 8,179 MO-enriched concordant pairs (Fig. 4A). Notably, the number of concordant pairs was significantly higher (~10–17 times) than the number of discordant pairs (opposite direction of the OPC vs. MO difference). In line with this, the identified peak-to-gene pairs showed a strong correlation between OPC vs. MO differential expression and H3K27ac differential acetylation (Pearson r value = 0.70) (Fig. S5). These correlations were maintained when gene-promoter and gene-enhancer pairs were analyzed separately (r = 0.75 and 0.68, respectively) (Fig. 4B). As expected, there were significant differences in gene expression levels between OPC-enriched and MO-enriched concordant genes in each cell type (Fig. S6). However, in OPCs we detected no difference in H3K27ac promoter signals and only a small difference (FC=1.4) in enhancer signals between OPC-enriched and MO-enriched concordant promoter peaks (Fig 4C). In contrast, MOs displayed strong differences in both promoters and enhancers (FC=5.4 and 4.0, respectively). Lastly, we analyzed the statistical significance of the association between gene expression and H3K27ac signal in OPCs vs. MOs by randomly permuting the peak-to-gene annotations (N=1,000 permutations, the results for enhancer peaks are shown) (Fig. S7). The number of experimentally observed concordant enhancer-to-gene DA/DE pairs was significantly higher than expected by chance for both OPC-enriched DA/DE and MO-enriched DA/DE enhancers/genes.
Figure 4. Analysis of concordant changes between gene expression and H3K27ac signal in adult OPCs and MOs.
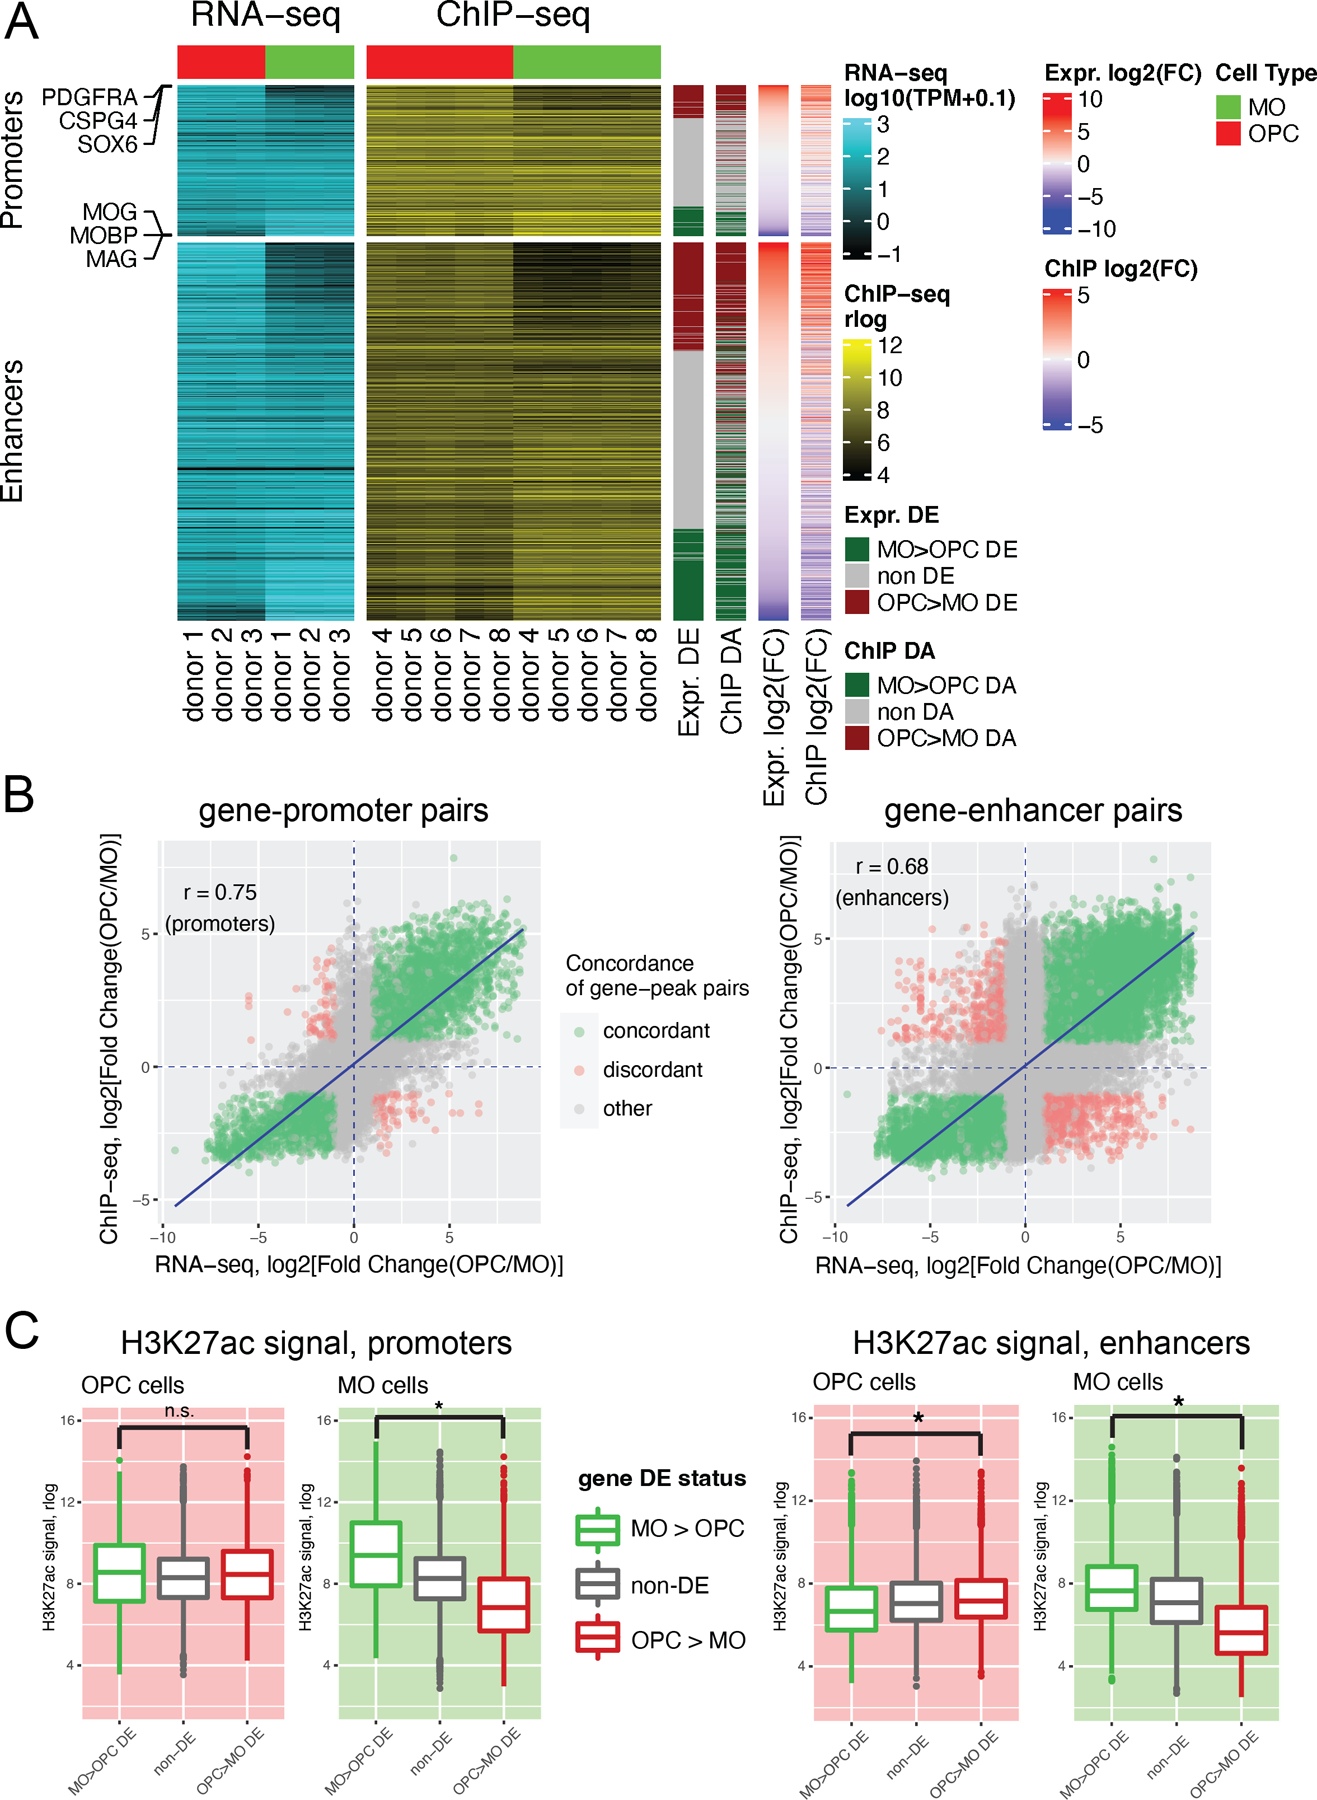
(A) Heatmap of RNA-seq gene expression values (log10(TPM+0.1) and H3K27ac signal intensities (rlog values) for adult replicate samples of OPCs (red column header) and MOs (green column header). Each row denotes a pair of a gene and an associated H3K27ac peak. The peak-to-gene annotations were calculated with the R package ChIPseeker. Also shown are log2(Fold Change) values for the differential expression (DE) and differential H3K27ac acetylation (DA) comparisons between OPCs and MOs, as well as the DE and DA status for genes and peaks. Data are shown separately for promoter peaks (defined as H3K27ac peaks overlapping the regions within 1,000 bp from a transcription start site of a gene), and putative enhancer peaks (distal H3K27ac peaks). The peak-to-gene pairs are sorted by the value of log2(FC) in the DE comparison. Examples of genes and their promoter peaks for several OPC and MO marker genes are highlighted. (B) Correlation between OPCs vs. MOs differences in gene expression and differences in H3K27ac signal intensities for peak-to-gene pairs. r: Pearson correlation coefficient. Blue line, linear regression line. Green, peak-to-gene pairs that show concordant changes in gene expression and H3K27ac signal. Red, peak-to-gene pairs that show discordant changes in gene expression and H3K27ac signal. Gray, other peak-to-gene pairs. (C) Box plots depicting the H3K27ac signal (rlog values) in OPCs (red background) or MOs (green background) for peaks associated with genes that are enriched in OPCs (red), enriched in MOs (green), or not DE (gray) in the OPC vs. MO comparison. Left panel, data for promoter peaks. Right panel, data for enhancer peaks. Statistical comparisons are by Welch t-test, (*) denotes significant differences (all p-values < 2.2e-12).
Collectively, these results clearly demonstrate that the H3K27ac profiles for adult OPCs and MOs reflect gene expression differences between the cell types, highlighting the important role of H3K27 acetylation in epigenetic regulation of transcriptomic patterns in these cells. In addition, our data suggest that in MOs, H3K27 acetylation is a crucial regulatory mechanism that determines the difference in expression levels of genes that distinguish MOs from OPCs. This epigenetic mechanism, however, is less important in defining the identity of OPCs.
Significant differences in the gene expression profiles of OPCs and MOs between infant and adult brain.
In addition to adult specimens, OPC and MO nuclei were isolated from gray matter of the dorsolateral prefrontal cortex (DLPFC) of neurotypical early postnatal donors aged 0 to 3 years (referred to as “infant” subjects) (Kang et al., 2011). The proportion of OPC nuclei among all oligodendroglial nuclei was higher in infant specimens compared to adults. OPC nuclei comprised approximately 44 +/− 21% of the SOX10+ population in infants and approximately 11 +/− 5.8% in adults (p-value < 0.01 by t-test, Fig. S8). RNA-seq and H3K27ac library construction were performed for infant samples using the same methods as for adult subjects. To enhance the power of the RNA-seq comparison between infant and adult stages, RNA-seq samples from additional adult subjects were included (total N=11 adult and 9 infant RNA-seq samples, Table S1). A balanced cohort of male and female subjects was included in the infant-to-adult comparison to account for potential effects of biological sex on OPC and MO developmental profiles (Table S1).
The RNA-seq data sets were separately analyzed for OPC and MO samples. Principal component analysis (PCA) was conducted on combined infant and adult subjects, revealing clear separation between the two age groups for each cell type (Fig. 5A,B). The first principal component (PC1) accounted for 47% or 41% of the total variance for OPCs and MOs, respectively, closely aligning with the separation by subject age. PC2 accounted for 17% variation in both OPCs and MOs and closely correlated with biological sex.
Figure 5. Significant differences in the gene expression profiles of OPCs and MOs between infant and adult brain.
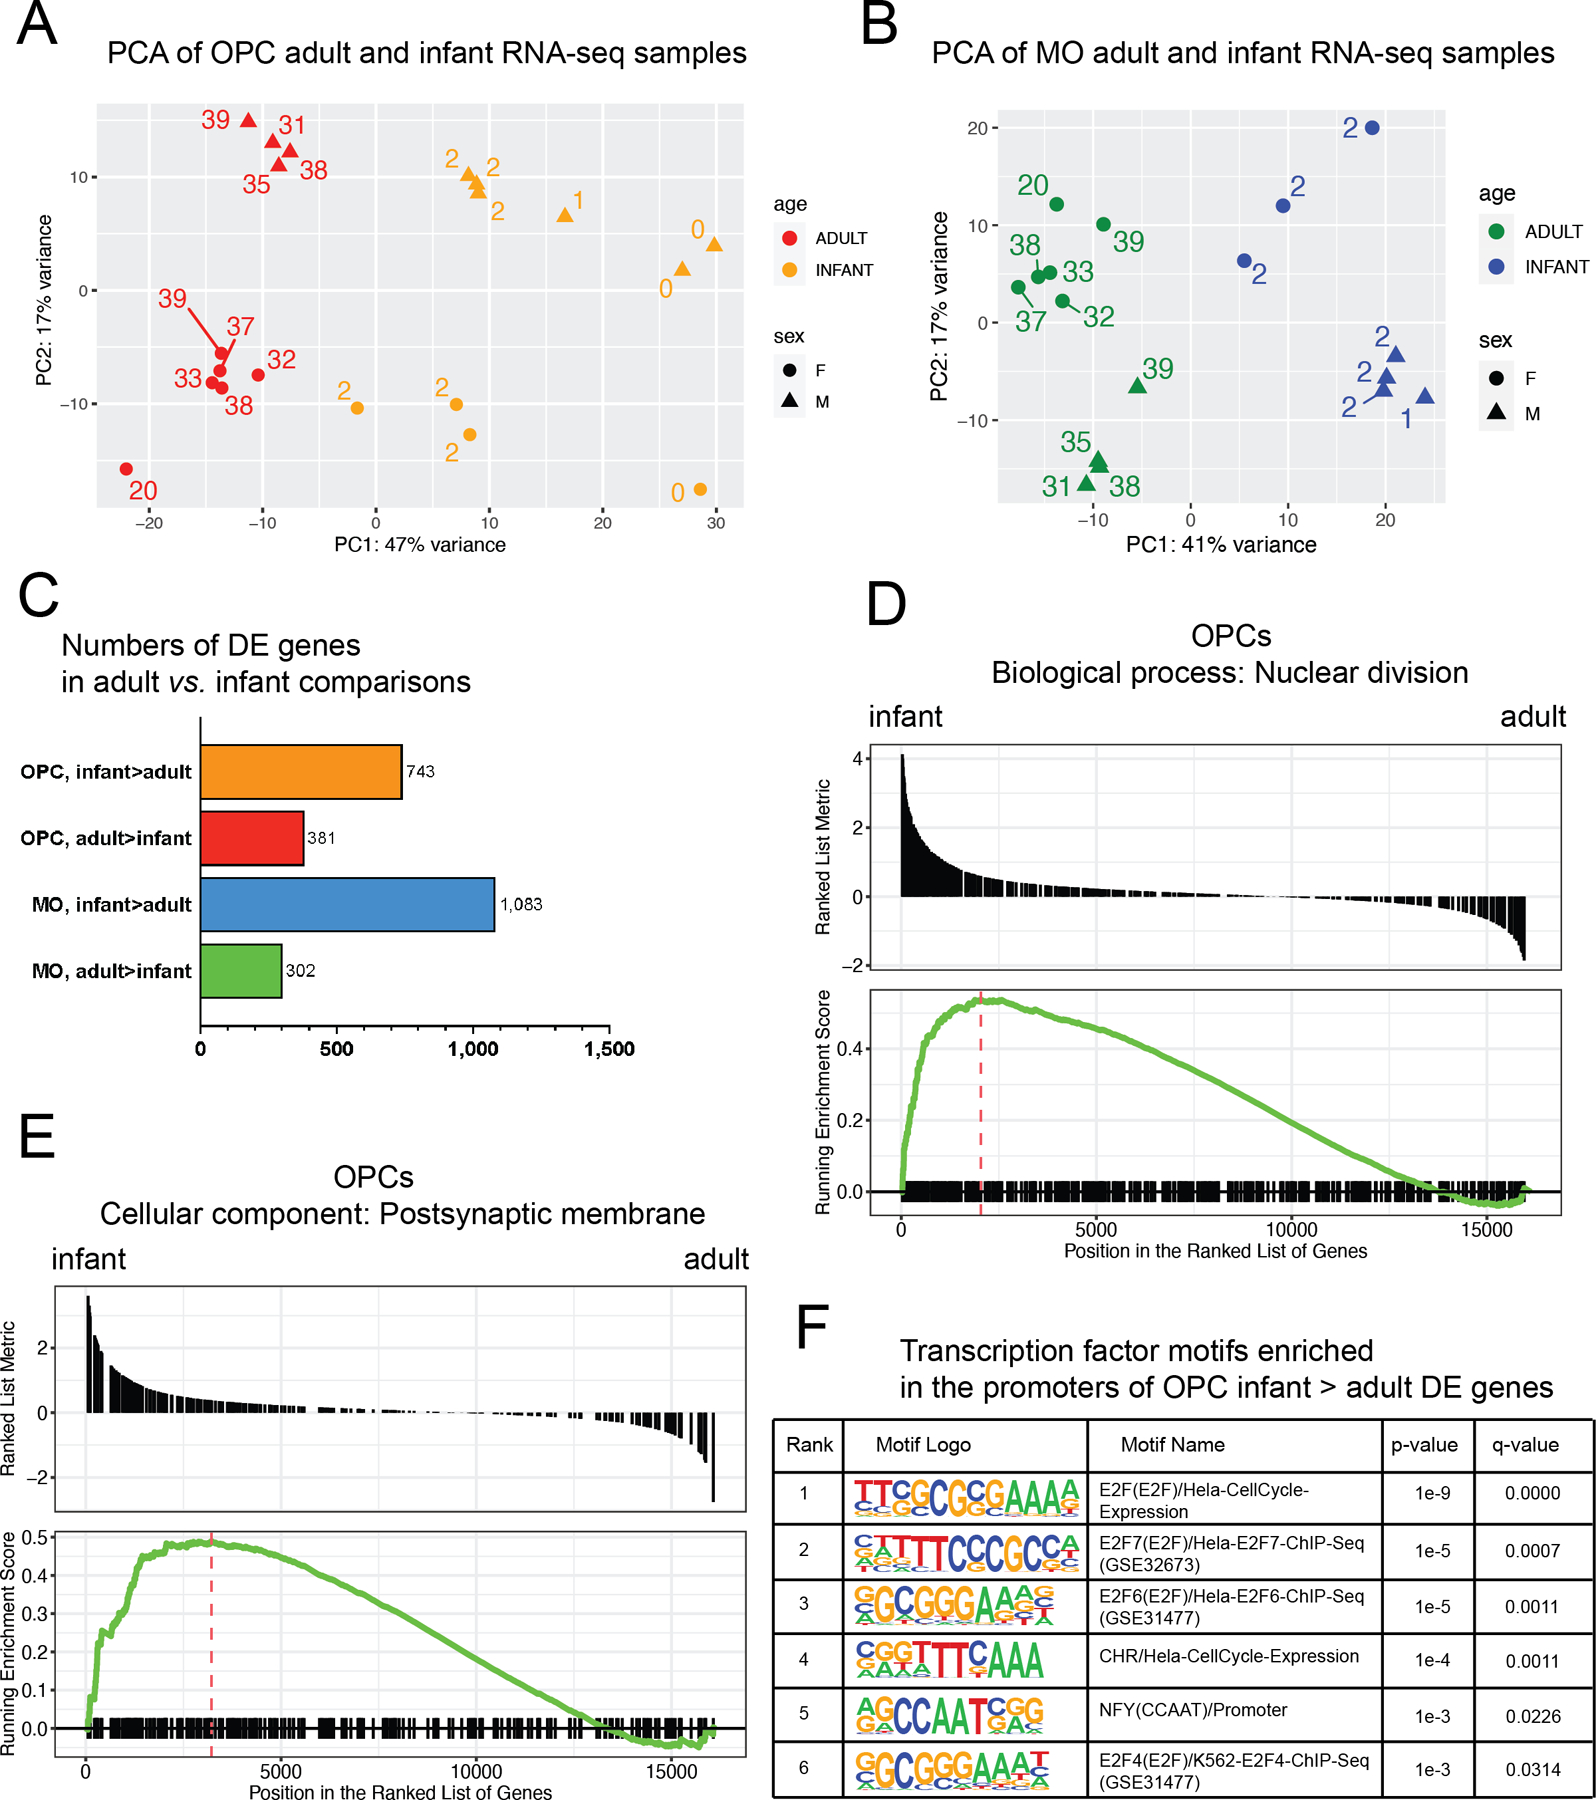
(A) PC analysis of RNA-seq infant and adult OPC samples. Orange, infant OPC samples. Red, adult OPC samples. (B) PC analysis of RNA-seq infant and adult MO samples. Blue, infant MO samples. Green, adult MO samples. Labels in (A) and (B) denote the age of subjects in years. (C) Numbers of DE genes detected in adult vs. infant comparisons in OPCs and MOs. (D) and (E) Selected results of gene set enrichment analysis (GSEA) in OPCs and MOs. GSEA plots for selected GO terms enriched in infant-upregulated genes in OPCs are shown. See Table S10 for the entire list of the enriched GO terms. (F) Results of the analysis of transcription factor binding motif enrichment at promoters of infant vs. adult DE genes. The list of significantly enriched motifs for infant > adult DE OPC genes is shown. The analysis was performed with software tool HOMER.
Differential expression (DE) analysis using DESeq2 was performed between infant and adult samples in both OPCs and MOs. DE genes were defined using the same threshold settings as in the adult OPC vs. MO RNA-seq comparison (absolute fold change >2, FDR < 0.05). A substantial number of DE genes were detected in each cell type, with a greater number of DE genes enriched at the infant stage (N = 743–1,083) compared to the adult stage (302–381) (Fig. 5C, Table S8). Gene ontology (GO) analysis with WebGestalt was then conducted to gain insights into the specific biological functions and gene sets that were up- or downregulated during OPC and MO development (Table S9). Infant-enriched DE genes were strongly associated with multiple GO terms related to cell division, DNA packaging into nucleosomes, and neurotransmitter receptor signaling. In contrast, adult-enriched DE genes were enriched for a distinct set of biological functions, including GO terms such as “positive regulation of cell motility” and “regulation of lipid metabolic process”. Additionally, GO analysis of infant-enriched MO DE genes revealed multiple terms related to neurotransmitter signaling and glutamate receptor activity.
Gene set enrichment analysis (GSEA) was also employed to study age-dependent differential expression comparisons. Importantly, the GSEA results (Table S10) were consistent with the GO analysis results obtained with WebGestalt. For OPCs, the top significant GO term was “nuclear division” (GO:0000280), which was strongly enriched for infant-upregulated genes (Fig. 5D). Similarly, in line with the WebGestalt results, the GO term “postsynaptic membrane” (GO:0045211) as a cellular component was enriched for infant-upregulated genes (Fig. 5E). In summary, the GO analyses consistently highlight a number of developmentally regulated biological functions in OPC and MO cells, including a higher potential for cell division in infant OPCs and elevated expression of glutamate ionotropic receptors in both infant OPCs and MOs. Indeed, among 19 genes coding for ionotropic glutamate receptors that were expressed in OPCs or MOs, 5 and 11 were significantly downregulated in adult compared to infant stage in OPCs and MOs, respectively (Fig. S9).
Furthermore, the analysis revealed a significant number (~200) of transcription factors (TFs) among the DE gene sets (Table S8). Some of these age-dependent DE TFs have also been detected in recent studies of OPC development in mice. For instance, transcription factor-encoding genes HES4 and HIF3A were suggested as markers of pre-OPCs/early OPCs and late OPCs, respectively (Perlman et al., 2020; van Bruggen et al., 2022). Consistent with these findings, our data showed upregulation of HES4 by 4.5-fold and downregulation of HIF3A by 4-fold in infant OPCs. To further investigate the potential roles of TFs in the developmental regulation of OPCs and MOs, the software tool HOMER was utilized to identify significantly enriched TF binding motifs at the promoters of infant- or adult-enriched DE genes (Methods). Significantly enriched TF binding motifs was found only in the case infant-enriched DE genes in OPCs (see Fig. 5F for the exhaustive list of the significant results), and included multiple motifs of the E2F family of TFs, which are implicated in cell cycle regulation (Fischer and Müller, 2017). Notably, the TF-coding genes E2F1, E2F2, E2F3, and E2F7 were among the infant-enriched DE genes identified in our study, further supporting their importance in regulating the proliferative capacity of infant OPCs.
Developmental changes in the H3K27ac histone modification profiles of OPCs and MOs between infants and adults correlate with changes in gene expression.
In order to compare histone acetylation profiles between infant and adult developmental stages in OPCs and MOs, we generated H3K27ac ChIP-seq samples from 5 infant subjects. The initital ChIP-seq data analysis and H3K27ac peak calling was performed for each infant sample using the same approach as previously described for adult samples. We then investigated the relative contributions of each of the covariate factors (cell type, age, sex, subject ID) to the total variance of the H3K27ac signal. To this end, we performed a joint analysis of adult and infant H3K27ac data sets from both cell types. We merged all H3K27ac peaks detected in the 20 samples, obtaining a total of 150,814 unique non-overlapping H3K27ac peaks. The variancePartition R package (Hoffman & Schadt, 2016) was used to estimate the contributions of covariate factors. “Age” was treated as a binary categorical variable (“infants” or “adults”). Consistent with our finding of the vast differences between the H3K27ac landscapes in adult OPCs vs. MOs (Fig. 3), the contribution of the cell type to the total variance of the H3K27ac signal was by far the largest (~53% total variance, Fig. S10). Notably, the second largest contributing factor (~8%), excluding the residuals, was age. It was followed by subject ID (~7%) and sex (~1.6%). We then performed PCA on the same combined data set of infant and adult OPC and MO samples (Fig. 6A; labels denote the exact age of subjects). PC1 accounted for 74% of the variance, and closely corresponded to the separation of samples by cell type, whereas PC2 (7.2% of variance) was associated with age. Overall, the samples could be clearly separated by cell type and age.
Figure 6. Developmental changes in the H3K27ac histone modification profiles of OPCs and MOs between infants and adults.
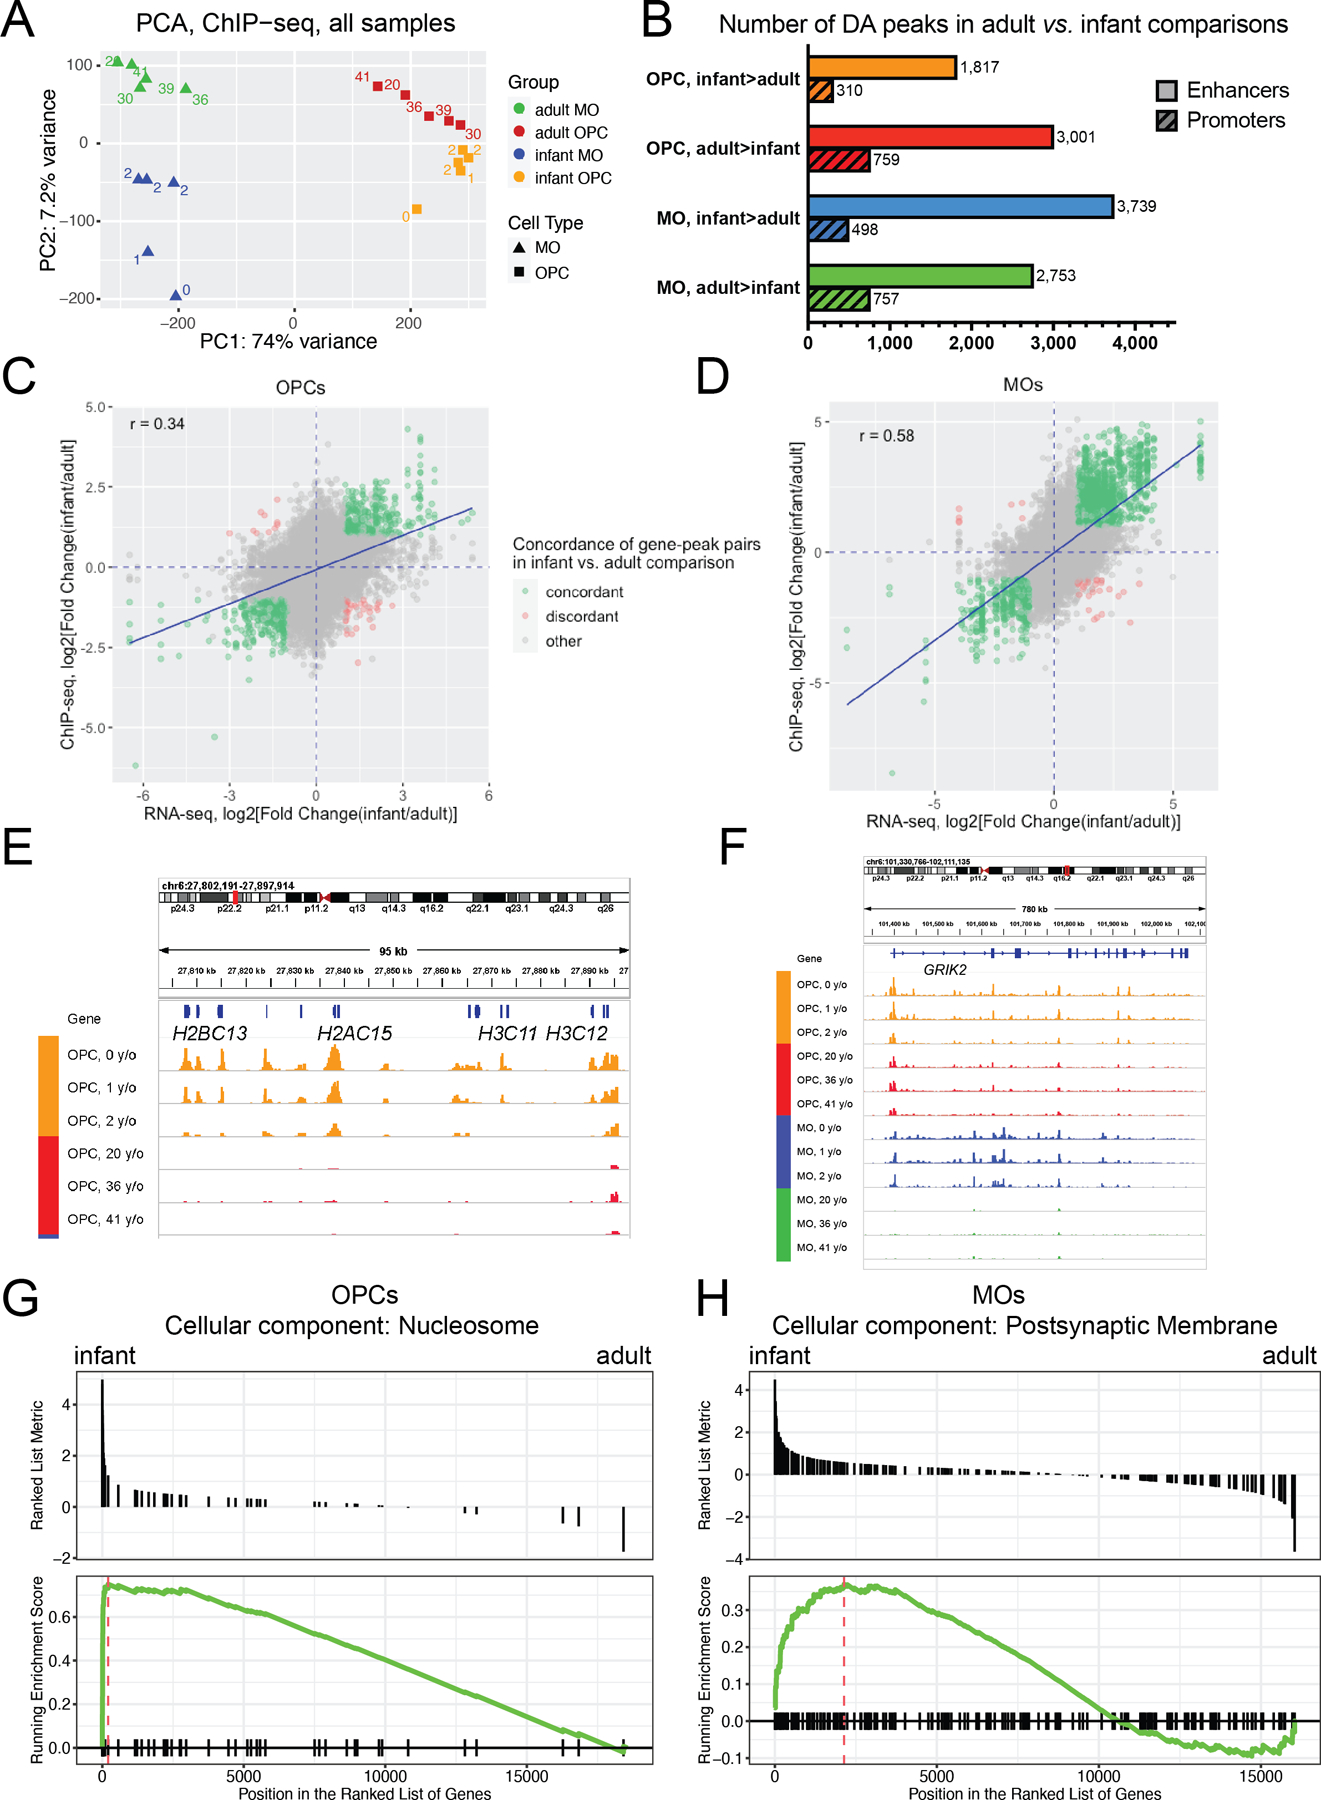
(A) PC analysis of H3K27ac ChIP-seq profiles of MO and OPC samples from infant or adult subjects (a total of 20 samples). The labels denote the age of subjects in years. Blue, infant MO samples. Green, adult MO samples. Orange, infant OPC samples. Red, adult OPC samples. (B) Barplot depicting the numbers of differentially acetylated (DA) peaks detected in infant vs. adult comparisons. DA peaks were defined with DESeq2 using thresholds: FC > 2 and FDR < 0.05. Color code: as in Fig. 6A. (C) and (D) Correlations between adult vs. infant differences in gene expression and differences in H3K27ac signal intensities for peak-to-gene pairs in OPCs (C) and MOs (D). r: Pearson correlation coefficient. Blue line, linear regression line. Green, peak-to-gene pairs that show concordant changes in gene expression and H3K27ac signal. Red, peak-to-gene pairs that show discordant changes in gene expression and H3K27ac signal. Gray, other peak-to-gene pairs. (E) and (F). Examples of gene loci for genes with age-dependent differences in H3K27ac profiles in OPCs and MOs. (E) the chr6:27,800,000–27,898,000 region – a subcluster of histone genes which is a part of the histone gene cluster HIST1, (F) GRIK2 locus. y/o, age in years. (G) and (H) Selected results of gene set enrichment analysis (GSEA) for infant vs. adult H3K27ac comparisons in OPCs and MOs. GSEA plots for selected GO terms enriched in infant-upregulated genes in OPCs (G) and MOs (H) are shown. See Table S15 for the entire list of the enriched GO terms.
We then studied the developmental changes in the H3K27ac profiles separately in each of the two cell types. We generated a separate consensus set of H3K27ac peaks for each cell type (Methods), obtaining 60,469 and 52,830 consensus peaks for OPCs and MOs, respectively. We then performed an infant vs. adult DA analysis among the consensus peaks, adjusting for sex as a covariate (FDR < 0.05, fold change > 2) (Fig. 6B, Table S11). The DA analysis of the OPC samples revealed 2,127 DA peaks enriched in infant OPCs (infant > adult), and 3,760 DA peaks enriched in adult OPCs (adult > infant). The DA analysis of the MO samples resulted in a comparable number of DA peaks (4,237 DA peaks enriched in infant MOs, and 3,510 DA peaks enriched in adult MOs). The proportions of promoters among infant vs. adult DA peaks in both cell types were similar to those previously detected in the adult OPC vs. MO DA ChIP-seq comparison.
We next explored the cell-specificity of the detected age-dependent H3K27ac changes. We used ChIPseeker to link the consensus MO and OPC H3K27ac peaks to corresponding genes. We identified 4 sets of genes with age-dependent H3K27ac changes in OPCs and MOs (infant > adult in OPCs, infant > adult in MOs, adult > infant in OPCs, adult > infant in MOs). We then overlapped these 4 gene sets and found that for most of the genes, the age-dependent H3K27ac changes occurred only in one cell type (~79% of total; 1004, 1360, 1199, 1462 genes, depending on the cell type and/or the direction of the change) (Fig. S11). Among genes with H3K27ac changes in both cell types, 367 genes (5.7%) showed increased H3K27ac in infant vs. adult cells, and 648 genes (10.2%) in adult vs. infant cells. Only a small number of genes had age-dependent changes in the opposite direction in MOs and OPCs. To summarize, differences in H3K27ac signal between infants and adults were highly cell-type-specific for the two cell types of oligodendroglial cells.
We assessed whether the observed developmental changes in the H3K27ac signal at putative active regulatory elements (H3K27-marked peaks) in OPCs and MOs correlated with gene expression changes of genes linked to those H327ac peaks. The analysis was performed similarly to the correlation analysis for gene-peak pairs in the adult OPC vs. MO comparisons, as described above. In each cell type, we constructed a combined dataset of gene expression and H3K27ac signal and obtained 44,807 unique peak-to-gene pairs in OPCs (with 12,317 unique genes) and 40,961 unique peak-to-gene pairs in MOs (with 11,047 unique genes). Importantly, the number of concordant pairs was much higher than discordant pairs (634 and 48 for OPCs, and 1,782 and 39 for MOs). For both cell types, the fold change values of differential expression of genes and differential acetylation of peaks showed significant correlation (Fig. 6C,D). The separate analysis of promoter-to-gene pairs and enhancer-to-gene pairs (Fig. S12) also showed significant correlations (p-value < 2.2e-16 for all comparisons). Overall, these results suggest that the developmental changes in the H3K27ac signal in OPCs and MOs might be functionally significant in determining the magnitude and direction of gene expression changes.
Gene ontology analysis of age-dependent H3K27ac changes in OPCs and MOs.
To interpret the functional significance of the observed age-dependent H3K27ac changes, we performed GO analysis using GREAT. The threshold setting for the maximum distance between the peak and the nearest TSS was chosen as 1,000,000 bp, which is the default choice for this setting in GREAT. In each comparison, we found many GO terms that were enriched for genes linked to the DA peaks (Fig. S13, Table S12). For the infant-enriched OPC peaks, we detected terms that were associated with cell proliferation and differentiation of various cell types, such as osteoblasts, keratinocytes, epithelial cells and neuroblasts. It is likely that genes included in these terms might also be employed during proliferation and differentiation of OPCs. This finding was consistent with the results of our RNA-seq analysis and the published studies indicating that, compared with OPCs from adult brain, the infant OPCs undergo a more active proliferation, as well as differentiate to new MOs (Clayton & Tesar, 2021). Examples of cell cycle-related genes that showed age-dependent decrease in the H3K27ac signal in adult vs. infant OPCs are CDK1 that encodes cyclin-dependent kinase 1, a key player in cell cycle regulation (Fig.S14), and CENPE that encodes a component of the centromere (Fig. S15). For both genes, there was a concordant change in gene expression (fold change = 13-fold for CDK1 and 3.3-fold for CENPE). Other enriched GO terms that reflect the higher proliferative state of infant OPCs are “nucleosome” and “DNA packaging complex”, which contain many histone genes. The expression of histone genes is typically strongly elevated during cell proliferation (Armstrong & Spencer, 2021). In the human genome, most histone genes are localized within the HIST1 locus on chromosome 6p22-21, and this locus can be further subdivided into several subclusters separated by gap regions between them (Marzluff, Gongidi, Woods, Jin, & Maltais, 2002) (Fig. S6G). Our data revealed differences between these subclusters, with several histone-coding genes fully losing the H3K27ac signal at the adult stage (chr6:27,800,000–27,898,000, e.g., H2BC13, H2AC15, H3C11) (Fig. 6E, and Subclusters 4 and 5 in Fig. S16), while others partially retaining the H3K27ac mark (chr6:26,009,000–26,065,000, e.g., H3C1, H2BC3, H1-2) (Subclusters 2 and 3 in Fig. S16). Some of the histone genes (e.g., H2AC15, H3C1, H1-2) were also marked by active chromatin in infant but not in adult MO cells. Notably, the H3K27ac changes at histone genes closely correlated with gene expression changes (Table S13).
We also detected GO terms that were enriched in the adult vs. infant DA peaks in OPCs. One of them is “positive regulation of apoptotic signaling pathway” that is exemplified by the H3K27ac changes at the LTBR locus (Fig. S17). LTBR encodes lymphotoxin beta receptor, which is a member of the tumor necrosis factor receptor superfamily and is implicated in apoptosis (Kuai et al., 2003). LTBR expression is 4-fold higher in adult compared to infant OPCs. The results suggest that H3K27ac-dependent epigenetic activation of apoptosis-related genes in adult OPCs could represent a possible mechanism of age-dependent decrease in the number of OPC cells available for the replenishment of myelinating oligodendrocytes in normal aging, neurodegenerative disorders, or brain injury.
Among GO terms enriched in infant MO DA peaks are the terms associated with glutamate receptor signaling. Notably, as was mentioned above, a large number of ionotropic glutamate receptor genes have lower expression in adult MO and OPCs compared with the infant stage (Fig. S9). The gene with the largest expression fold change is GRIK2. In concordance with the expression data, we observed multiple H3K27ac peaks within the GRIK2 locus in infant but not in adult MOs (Fig. 6F). In a recent study in mouse brain (Marques et al., 2018), GRIK2 was described as a marker of an early population of oligodendrocytes, described as “myelin-forming oligodendrocytes” (MFOLs), suggesting that the infant MOs in our study may be enriched for MFOLs.
The results of the GO analysis algorithms such as GREAT can be sensitive to the choice of settings. For example, for the choice of the cutoff threshold distance between the peak and the nearest TSS, the most common settings are 100,000 and 1,000,000 bp. The latter choice seems preferable in the case of brain-derived data sets, since many genes important for neuronal or glial function have a length of several hundreds of thousand bp or more (e.g., ionotropic glutamate receptors, or cell adhesion molecules), and their gene bodies may contain regulatory elements throughout the whole length of the gene. Nevertheless, we also performed the analysis of the infant vs. adult DA peaks with GREAT using a more stringent 100,000 bp cutoff (Table S14). We observed that some of the significant GO terms (such as “nucleosome” or “apoptotic process”) were more robust to the choice of the distance cutoff than others (e.g., “glutamatergic regulation of synaptic transmission”), probably because of the large size of the genes which comprise the latter GO gene set.
To overcome the drawbacks of GO analysis methods that depend on arbitrary thresholds, we also adapted the threshold-free GSEA approach to analyze H3K27ac ChIP-seq data (see Methods). Notably, the GSEA results recapitulated many of the findings of the GO analysis with GREAT (Table S15). In particular, the “nucleosome” GO term (GO:0000786) was highly enriched for the infant-enriched DA peaks in OPCs (Fig. 6G), whereas the term “postsynaptic membrane” (GO:0045211) was enriched for the infant-enriched DA peaks in MOs (Fig. 6H).
The H3K27ac signal traces from representative infant and adult ChIP-seq samples (Fig. 6E, F) illustrate these results. In Fig. 6E, a subcluster of the histone genes which was found to contain several infant-enriched DE genes in our RNA-seq analysis, demonstrates an infant-specific pattern of H3K27ac signal at the promoters of several histone genes. This result is in line with the presence of the GO term “nucleosome” in the results of both (GREAT and GSEA) GO analyses (Fig. 6G). Since the H3K27ac peaks linked to histone genes are concentrated at gene promoters, the GO term “nucleosome” is not expected to be sensitive to the choice of the TSS distance cutoff in GREAT. In contrast, Fig. 6F displays representative infant and adult OPC and MO H3K27ac traces at the gene locus of GRIK2. This gene belongs to the “postsynaptic membrane” GO term which is significantly enriched in infant MO DA peaks. The gene locus of GRIK2 displays an infant-specific pattern of H3K27ac signal in MOs. These infant-specific H3K27ac peaks are located throughout the whole length of the large GRIK2 locus (total length ~780,000 bp), which explains why the “postsynaptic membrane” GO term was sensitive to the choice of the TSS distance threshold in GREAT.
In summary, using a combination of GREAT and GSEA, we observed several GO terms that were enriched for the DA peak sets obtained in the infant vs. adult H3K27ac comparisons in OPCs and MOs. Notably, these results were largely in agreement with the findings of our RNA-seq analysis.
Validation of Developmental Changes in OPC Gene Expression through Immunohistochemistry.
We aimed to validate the developmental changes observed in OPC cells in our RNA-seq and ChIP-seq data at the protein level using fluorescent immunohistochemistry. We utilized the same frozen cortical tissue specimens that were used for RNA-seq and ChIP-seq experiments. One of the key findings from our RNA-seq and ChIP-seq analyses was the higher proliferative capacity of OPCs in infant cortex compared to adult cortex. A commonly used marker of dividing cells is the anti-Ki67 antibody that specifically labels nuclei of cells that undergo cell division (Scholzen and Gerdes, 2000). Notably, according to our gene expression data, the transcription of the MKI67 gene that encodes the Ki67 protein was ~15-fold higher in infant vs. adult OPCs (Fig. 7A). To assess the presence of dividing cells in the human cortex and their association with oligodendroglial lineage cells, we performed immunohistochemistry staining for Ki67 and OLIG2 (an oligodendroglial lineage marker (Huang et al., 2022)) in gray matter DLPFC tissue sections from 3 adult and 3 infant subjects. The analysis was conducted on whole sections with total surface areas of 10–25 mm2. Our observations revealed a strong nuclear Ki67+ signal in a small subset of cells, with minimal background signal in the surrounding tissue (Fig. 7B). The majority of Ki67+ cells were also OLIG2-positive (80% and 85% in infant and adult specimens, respectively). We attribute the few OLIG2-negative Ki67+ cells to the presence of dividing cells of the hematopoietic lineage within the brain tissue sections. Importantly, the number of Ki67+/OLIG2+ nuclei normalized per surface area was significantly higher (~6.2-fold, p-value = 0.03 by t-test) in infant specimens compared to adult specimens (Fig.7C). We also performed triple Ki67/OLIG2/NG2 immunostaining and confocal microscopy at high magnification in a subset of tissue specimens (2 adult and 2 infant subjects), utilizing the dual NG2/OLIG2 signal as the marker for OPCs. The NG2 antibody recognizes the proteoglycan protein CSPG4, and labels cell surface and cytoplasmic compartment. It is widely used as a marker for OPCs (Chang et al., 2000; Trotter, Karram and Nishiyama, 2010; Huang et al., 2022), but is also expressed in pericytes (Huang et al., 2022). Therefore, only combined staining for NG2 and an oligodendroglial lineage marker such as OLIG2 accurately detects OPCs. We found that all Ki67+/OLIG2+ cells were also NG2-positive (total n=12 Ki67+ cells examined), suggesting that Ki67+/OLIG2+ cells represent dividing OPCs (Fig. 7D).
Figure 7. Validation of developmental changes in OPC gene expression through immunohistochemistry.
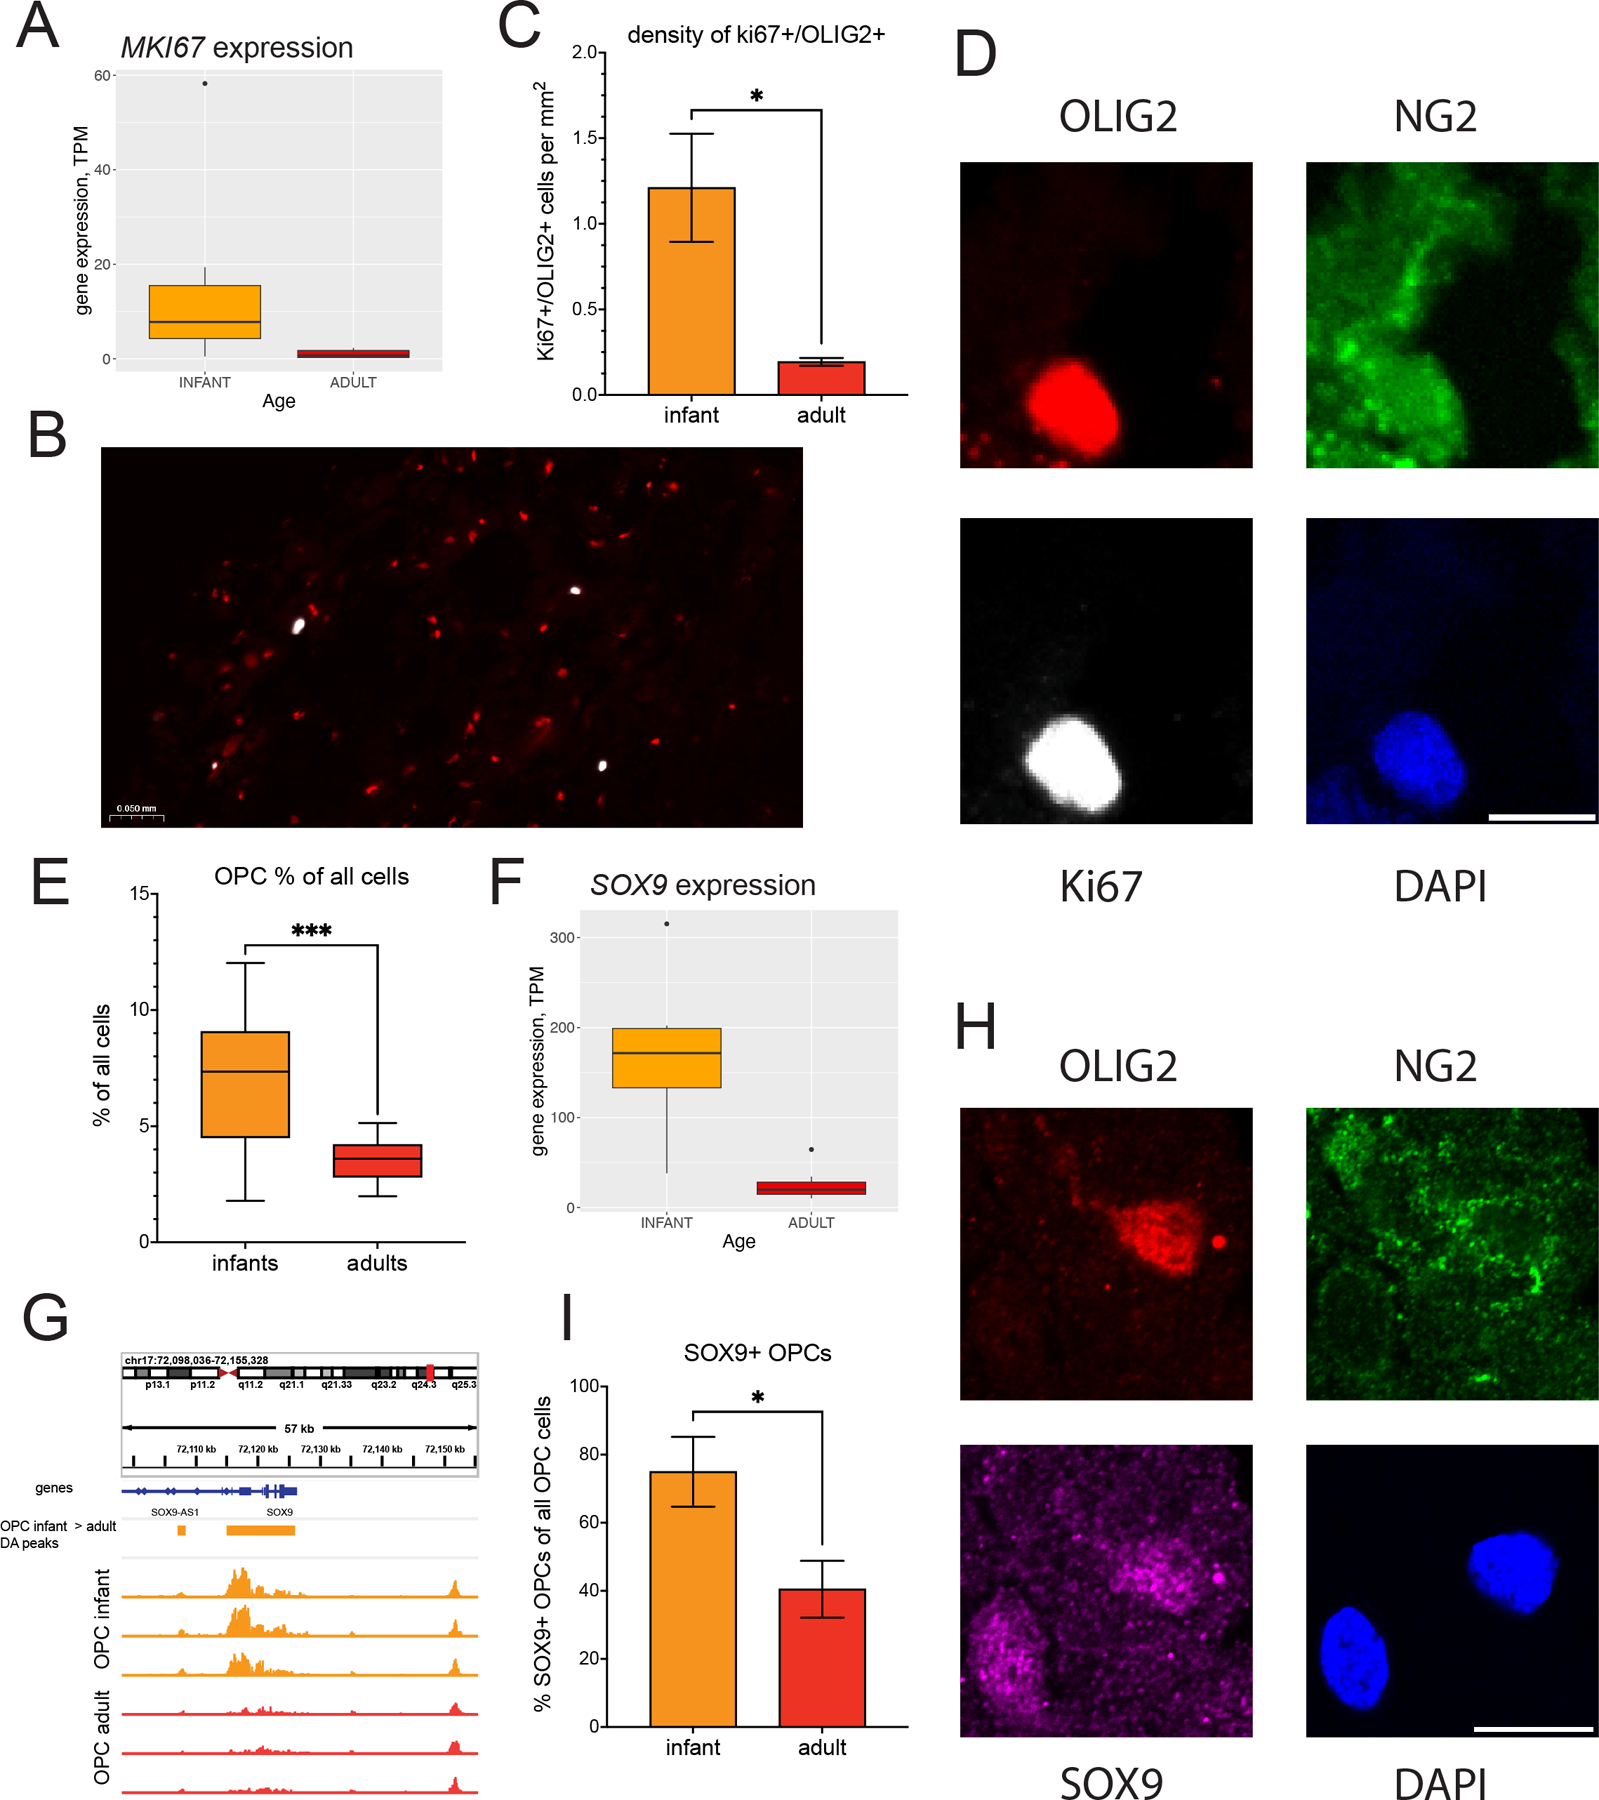
(A) Expression levels of the MKI67 gene in infant and adult OPCs. (B) Representative microscope image of infant DLPFC cortical tissue stained with anti-Ki67 (white) and anti-OLIG2 (red). All Ki67+ cells overlapped with OLIG2+ cells. (C) Density of Ki67+/OLIG2+ cells (cells/mm2) in DLPFC gray matter sections from infants and adults. (D) Representative confocal microscope image (40x magnification) of an OPC cell (NG2+/OLIG2+/DAPI+ cell) which is also positive for Ki67 staining. Scale bar: 10 microns. (E) Percentage of OPC nuclei (SOX6+/SOX10+/NeuN- nuclei) observed in FAN-sorting experiments (n= 11 infant and 14 adult subjects). (F) Expression levels of the SOX9 gene in infant and adult OPCs. (G) H3K27ac profiles from infant (orange) and adult (red) OPC samples in the vicinity of the SOX9 locus, (H) Representative confocal microscope image (63x magnification) of an OPC cell (NG2+/OLIG2+/DAPI+ cell on the right of the field of view) which is also positive for SOX9 staining. The SOX9-positive cell on the left is OLIG2- and NG2-negative. Scale bar: 10 microns. (I) Percentage of SOX9-positive OPCs among all OPCs in DLPFC gray matter sections from infants and adults.
We then explored whether these results could be attributed to changes in OPC density between infant and adult human cortex. For this purpose, we quantified the results of our FANS experiments from 11 infant and 14 adult subjects and observed a 2.0-fold decrease in the percentage of OPC nuclei (SOX6+/SOX10+/NeuN-) from infant to adult (p-value < 0.001, t-test; Fig. 7E). Therefore, the significant decrease (~6-fold) in the density of dividing OPCs in adult cortex compared to infant cortex cannot be solely explained by the concomitant decrease in the number of OPCs (~2-fold). These findings suggest that the proliferative capacity of OPCs is indeed reduced in the adult cortex compared to the infant cortex, consistent with the conclusions drawn from gene expression and H3K27ac histone acetylation comparisons between the two developmental stages.
Our RNA-seq and ChIP-seq analyses identified a substantial number (N=91) of significantly up- or down-regulated transcription factors in OPCs between infants and adults. Using immunohistochemistry, we validated the differential expression of SOX9, a gene that encodes a transcription factor previously implicated in the regulation of oligodendroglial lineage cells (Vogel and Wegner, 2021; Hassel et al., 2023). In our RNA-seq data, SOX9 exhibited a 7.5-fold higher expression in infant OPCs compared to adult OPCs (Fig. 7F). The H3K27ac data also revealed that H3K27ac acetylation signal in two regulatory elements (chr17:72107149–72108375 and chr17:72,051,532–72,199,508) adjacent to or overlapping with the SOX9 locus was significantly higher in infant OPCs compared to adult OPCs (fold changes = 2.1 and 4.0, Fig. 7G). Our analysis automatically assigned these regulatory elements to the antisense SOX9-AS1 transcript; however, this assignment is likely incorrect due to the absence of significant differential expression of the antisense SOX9 transcript (fold change = 1.2). Notably, we recently showed that SOX9 expression in mouse OPCs significantly decreases during early postnatal development (Reiprich et al., 2017; Hassel et al., 2023). By performing triple SOX9/OLIG2/NG2 immunostaining and confocal microscopy on tissue sections from 5 infant and 4 adult subjects, we detected a nuclear staining pattern for SOX9 that partially overlapped with OPCs (OLIG2+/NG2+ cells) (Fig. 7H, Fig. S7A). Since SOX9 is also expressed in astrocytes (Vogel and Wegner, 2021; Huang et al., 2022), the SOX9+/OLIG2-/NG2- cells likely represent astrocytic cells. Quantification of the OPCs (OLIG2+/NG2+ cells) that were also SOX9-positive revealed a significantly higher proportion of SOX9-positive OPCs in the infant cortex compared to the adult cortex (Fig. 7I), aligning with our RNA-seq and ChIP-seq results. Fig. 7H and Fig. S18 provide examples of representative images of a SOX9-overlapping OPC from an infant subject, and a SOX9-non-overlapping OPC from an adult subject, respectively.
In summary, immunohistochemistry staining provides additional validation for changes in expression and H3K27ac profiles in OPCs throughout human postnatal development.
DISCUSSION
Building upon our previous research (Kozlenkov et al., 2018, 2015; Stolt et al., 2006), this study introduces a novel flow-cytometry-based experimental protocol for isolating highly purified nuclear populations of OPC and MO cells from human postmortem brain. The validity of the isolated populations was confirmed through deep nuclear RNA-sequencing, which demonstrated the enrichment of known markers for these cell types. The protocol was also found to be applicable to epigenomic studies, such as H3K27ac histone acetylation profiling, and can be successfully used in both adult and early postnatal brain tissue specimens. Importantly, the protocol requires the use of multiple antibodies and fluorescence detectors on a modern flow cytometry instrument equipped with four lasers and detectors to ensure efficient discrimination and isolation of OPC and MO nuclei (defined as DAPI+/NeuN-/SOX10+/SOX6+ and DAPI+/NeuN-/SOX10+/SOX6- populations, respectively). While further subdivisions or functional states within the OPC or MO populations are still under investigation (Kamen, Pivonkova, Evans, & Káradóttir, 2022; Marques et al., 2018), a recent single-cell RNA-seq study (Jäkel et al., 2019) has provided evidence that the expression of SOX6 sharply decreases at the transition between OPCs (including a small population of “committed” precursors or COPs) and various subsets of differentiated oligodendrocytes at different stages of maturity (referred to as MOs in this study). This finding supports the validity of our experimental approach and the general applicability of our findings.
In this study, we assessed gene expression and H3K27ac modification. The latter serves as an indicator of active promoters and enhancers and is a widely used epigenetic marker for assessing regulatory changes in development and disease (Creyghton et al., 2010; Nord et al., 2013; Corradin et al., 2022). The analysis of differential acetylation (DA) between adult human OPC and MO populations revealed approximately 40,000 H3K27ac DA peaks, representing approximately 65% of all peaks specifically enriched in one cell type or the other. Notably, this level of regulatory landscape divergence is similar to what we previously observed between human excitatory and inhibitory neurons, the two major subclasses of neuronal cells in the central nervous system (Kozlenkov et al., 2020). It is important to highlight that while various subtypes of neurons represent terminally differentiated cellular populations, the differences in epigenetic regulation between OPCs and MOs have significant functional implications, as OPCs can differentiate into MOs, albeit with varying efficiency, even in the adult human brain. Therefore, the extensive H3K27ac divergence observed between OPCs and MOs sheds light on the extensive H3K27ac landscape rearrangements occurring during this differentiation process. Moreover, a high concordance was observed between OPC vs. MO differential expression and differential acetylation of H3K27ac peaks linked to the corresponding genes. Many well-established OPC- or MO-specific marker genes displayed this concordance in both expression and H3K27ac mark. Importantly, this concordance was not only observed for promoters but also for putative enhancers (distal H3K27ac peaks), with the caveat that enhancer-to-gene annotations may be uncertain without 3D chromatin Hi-C data for the two cell types. Notably, our data suggest that while H3K27ac plays a key regulatory role in defining MO-specific gene expression in MOs, its influence is less prominent in OPCs. These results underscore the importance of epigenetic regulation in OPC-to-MO differentiation and the need for further investigation into cell-type-specific epigenetic mechanisms in oligodendroglial cells. These future studies are expected to provide valuable insights into the pathophysiology of diseases and conditions in which OPC-to-MO differentiation is compromised, such as multiple sclerosis and aging (Clayton & Tesar, 2021).
Our hypothesis posited significant transcriptional and regulatory changes in OPC and MO populations as they progress through different stages of development. To test this hypothesis, we compared gene expression and H3K27ac profiles between early postnatal and adult human dorsolateral prefrontal cortex (DLPFC) in FANS-isolated OPCs and MOs. Supporting our hypothesis, a large number of differentially expressed (DE) genes (~6–8%) and DA H3K27ac peaks (~4–8%) were identified between infant and adult samples in each cell type. Notably, significant correlations between H3K27ac and transcriptomic differences were detected in the adult-to-infant comparison in OPC and MO cells, reinforcing the important role of H3K27ac modification in regulating age-dependent gene expression in these cell types.
Many of the age-dependent gene expression and H3K27ac changes detected in our study align with previously reported hypotheses and data. For instance, we observed a decrease in the expression and promoter H3K27ac signal of cell cycle-associated genes (such as CDK1 and CENPU) in infant compared to adult samples, consistent with the higher proliferative capacity of early OPCs (Dimou & Gallo, 2015; Trotter, Karram, & Nishiyama, 2010). We also confirmed that several transcription factors (HES4, HIF3A) can serve as markers of early and late OPC populations (Perlman et al., 2020; van Bruggen et al., 2022). We detected significantly higher expression of the transcription factor SOX9 in infant compared to adult OPCs and validated this finding at the protein level using immunohistochemistry. Additionally, we found that within the genic cluster HIST1, which comprises the majority of histone genes, two subclusters displayed higher gene expression and H3K27ac activity in infant which was nearly completely lost in adult brain (Subclusters 4 and 5 in Fig. S16). This developmental change was particularly pronounced in OPCs but also detected in MO cells. Consequently, the gene ontology terms “nucleosome” and “DNA packaging complex” were enriched in the infant vs. adult DE genes and DA H3K27ac peaks in OPCs. Notably, recent chromatin conformation studies suggest that different subclusters of the HIST1 locus reside within hierarchically organized topologically associating domains (TADs) (Fritz et al., 2018), indicating potential coordinated regulation of genes within these subclusters.
Another intriguing finding is the significant developmental downregulation of multiple ionotropic glutamate receptors in both OPCs and MOs, accompanied by a concordant decrease in the promoter H3K27ac signal. These results are consistent with recent electrophysiological studies in mice, which demonstrated that the NMDA glutamate receptor activity in OPCs transitions through a maximum in early postnatal development (Kamen et al., 2022; Spitzer et al., 2019). Notably, the GRIN2A gene, encoding one of the NMDA receptor subunits, is a risk gene for schizophrenia, and dysfunction of oligodendroglial cells, including OPCs, has been implicated in the etiology of this neurodevelopmental disorder (Clayton & Tesar, 2021; de Vrij et al., 2019). Collectively, these findings underscore the importance of investigating age-dependent changes in expression and regulation in OPCs and MOs.
While a substantial body of literature supports the role of epigenetic regulation in the initial specification, function, and differentiation of OPCs [see (Berry et al., 2020; Elbaz & Popko, 2019; Parras, Marie, Zhao, & Lu, 2020; Pruvost & Moyon, 2021) for recent reviews], our study provides in-depth transcriptomic and H3K27ac profiles of human infant and adult OPC and MO cells for the first time. Multiple epigenetic mechanisms are likely involved in the regulation of OPC and MO function, as well as the differentiation of OPCs to MOs (Elbaz & Popko, 2019; Moyon & Casaccia, 2017; Moyon et al., 2021, 2017). Further research is needed to unravel the intricate details of these mechanisms. In recent years, single-cell RNA-seq and epigenetic studies have gained prominence in the field of oligodendroglial cell specification and differentiation in normal and diseased brains or during development (Huang et al., 2020; Marques et al., 2018; Perlman et al., 2020; van Bruggen et al., 2022). These studies have already provided valuable insights, including the identification of pre-OPC populations in early development (Huang et al., 2020; van Bruggen et al., 2022) and the discovery of disease-associated changes in OPCs and MOs in multiple sclerosis (Falcão et al., 2018; Jäkel et al., 2019). However, these studies often capture limited numbers of cells for rare cell types like OPCs, hindering detailed epigenetic assessments. The advantage of our experimental approach lies in the ability to easily obtain large numbers (200,000–500,000) of highly pure OPC and MO nuclei from human postmortem tissue, providing deeply sequenced cell-type-specific gene expression and epigenetic profiles. Therefore, our approach may prove particularly valuable for studying certain epigenetic marks such as DNA (hydroxy)methylation, inhibitory histone modifications like the H3K27me3 (Polycomb) mark, and transcription factor binding sites. Furthermore, our approach could be used to pre-enrich OPCs, which constitute only approximately 3% of brain cells, prior to conducting single-cell studies. This could be especially relevant for brain tissue samples from aged individuals, where the percentage of OPCs is known to decrease significantly. Other potential directions include exploring the OPC and MO regulatory landscapes in different brain regions or white matter versus gray matter. Finally, as previously mentioned, recent advancements suggest that OPC dysfunction plays a role in the etiology of various neurodegenerative and neurodevelopmental disorders (Clayton & Tesar, 2021; Jäkel et al., 2019), highlighting the clinical translational potential and further avenues for future studies in OPC/MO epigenetic research.
Supplementary Material
MAIN POINTS.
Novel method to isolate human OPCs and mature oligodendrocytes (MOs) is introduced.
OPC/MO-specific genes are controlled by H3K27ac in MOs but not in OPCs.
Concordant H3K27ac and transcriptome changes between infant and adult OPCs are linked to cell proliferation and glutamate signaling.
ACKNOWLEDGMENTS
We are thankful to Drs Miguel Gama-Sosa and Rita De Gasperi for their help with the immunohistochemistry protocol, and to Lauren Harlow, Kaitlin Johnson, Carlos Toro for preparing the tissue sections.
Human postmortem tissue for this study was provided by NIH NeuroBioBank.
FUNDING INFORMATION
The research was funded by grants U01MH122590 (NIMH) and BX005160 (U.S. Department of Veterans Affairs) to S.D.
Footnotes
CONFLICT OF INTEREST STATEMENT
The authors declare that they have no conflict of interest.
DATA AVAILABILITY
Sequencing data reported in this paper have been deposited to the Gene Expression Omnibus (GEO) with accession number GSE239663.
REFERENCES
- Aggarwal S, Yurlova L and Simons M (2011) ‘Central nervous system myelin: Structure, synthesis and assembly’, Trends in Cell Biology Elsevier Ltd, 21(10), pp. 585–593. doi: 10.1016/j.tcb.2011.06.004. [DOI] [PubMed] [Google Scholar]
- Akay LA, Effenberger AH and Tsai LH (2021) ‘Cell of all trades: Oligodendrocyte precursor cells in synaptic, vascular, and immune function’, Genes and Development, 35(3), pp. 180–198. doi: 10.1101/GAD.344218.120. [DOI] [PMC free article] [PubMed] [Google Scholar]
- Bakhti M, Aggarwal S and Simons M (2014) ‘Myelin architecture: zippering membranes tightly together’, Cellular and Molecular Life Sciences, 71(7), pp. 1265–1277. doi: 10.1007/s00018-013-1492-0. [DOI] [PMC free article] [PubMed] [Google Scholar]
- Barateiro A, Brites D and Fernandes A (2016) ‘Oligodendrocyte Development and Myelination in Neurodevelopment: Molecular Mechanisms in Health and Disease’, Current Pharmaceutical Design, 22, pp. 656–679. [DOI] [PubMed] [Google Scholar]
- Barber HM, Ali MF and Kucenas S (2022) ‘Glial Patchwork: Oligodendrocyte Progenitor Cells and Astrocytes Blanket the Central Nervous System’, Frontiers in Cellular Neuroscience, 15(January), pp. 1–14. doi: 10.3389/fncel.2021.803057. [DOI] [PMC free article] [PubMed] [Google Scholar]
- Brind’Amour J et al. (2015) ‘An ultra-low-input native ChIP-seq protocol for genome-wide profiling of rare cell populations’, Nature Communications, 6, p. 6033. doi: 10.1038/ncomms7033. [DOI] [PubMed] [Google Scholar]
- Castro K and Casaccia P (2018) ‘Epigenetic modifications in brain and immune cells of multiple sclerosis patients’, Multiple Sclerosis, 24(1), pp. 69–74. doi: 10.1177/1352458517737389. [DOI] [PMC free article] [PubMed] [Google Scholar]
- Chang A et al. (2000) ‘NG2-positive oligodendrocyte progenitor cells in adult human brain and multiple sclerosis lesions’, Journal of Neuroscience, 20(17), pp. 6404–6412. doi: 10.1523/jneurosci.20-17-06404.2000. [DOI] [PMC free article] [PubMed] [Google Scholar]
- Cherchi F et al. (2021) ‘Ion channels as new attractive targets to improve re‐myelination processes in the brain’, International Journal of Molecular Sciences, 22(14). doi: 10.3390/ijms22147277. [DOI] [PMC free article] [PubMed] [Google Scholar]
- Chrast R et al. (2011) ‘Lipid metabolism in myelinating glial cells: Lessons from human inherited disorders and mouse models’, Journal of Lipid Research © 2011 ASBMB. Currently published by Elsevier Inc; originally published by American Society for Biochemistry and Molecular Biology., 52(3), pp. 419–434. doi: 10.1194/jlr.R009761. [DOI] [PMC free article] [PubMed] [Google Scholar]
- Clayton BLL and Tesar PJ (2021) ‘Oligodendrocyte progenitor cell fate and function in development and disease’, Current Opinion in Cell Biology Elsevier Ltd, 73, pp. 35–40. doi: 10.1016/j.ceb.2021.05.003. [DOI] [PMC free article] [PubMed] [Google Scholar]
- Corradin O et al. (2022) ‘Convergence of case-specific epigenetic alterations identify a confluence of genetic vulnerabilities tied to opioid overdose’, Molecular Psychiatry Springer; US, (June 2021), pp. 1–13. doi: 10.1038/s41380-022-01477-y. [DOI] [PMC free article] [PubMed] [Google Scholar]
- Creyghton MP et al. (2010) ‘Histone H3K27ac separates active from poised enhancers and predicts developmental state.’, Proceedings of the National Academy of Sciences of the United States of America, 107(50), pp. 21931–6. doi: 10.1073/pnas.1016071107. [DOI] [PMC free article] [PubMed] [Google Scholar]
- Dawson MRL et al. (2003) ‘NG2-expressing glial progenitor cells: An abundant and widespread population of cycling cells in the adult rat CNS’, Molecular and Cellular Neuroscience, 24(2), pp. 476–488. doi: 10.1016/S1044-7431(03)00210-0. [DOI] [PubMed] [Google Scholar]
- Feng J et al. (2012) ‘Identifying ChIP-seq enrichment using MACS.’, Nature protocols Nature Publishing Group, 7(9), pp. 1728–40. doi: 10.1038/nprot.2012.101. [DOI] [PMC free article] [PubMed] [Google Scholar]
- Fischer M and Müller GA (2017) ‘Cell cycle transcription control: DREAM/MuvB and RB-E2F complexes’, Critical Reviews in Biochemistry and Molecular Biology Informa Healthcare USA, Inc, 52(6), pp. 638–662. doi: 10.1080/10409238.2017.1360836. [DOI] [PubMed] [Google Scholar]
- Hassel LA et al. (2023) ‘Differential activity of transcription factor Sox9 in early and adult oligodendroglial progenitor cells’, Glia doi: 10.1002/glia.24373. [DOI] [PubMed] [Google Scholar]
- Huang H et al. (2022) ‘Immunological Markers for Central Nervous System Glia’, Neuroscience Bulletin Springer Nature Singapore, (0123456789). doi: 10.1007/s12264-022-00938-2. [DOI] [PMC free article] [PubMed] [Google Scholar]
- Kozlenkov A et al. (2015) ‘Substantial DNA methylation differences between two major neuronal subtypes in human brain’, Nucleic Acids Research, 44(6), pp. 2593–2612. doi: 10.1093/nar/gkv1304. [DOI] [PMC free article] [PubMed] [Google Scholar]
- Kozlenkov A et al. (2018) ‘A unique role for DNA (hydroxy)methylation in epigenetic regulation of human inhibitory neurons’, Science Advances, 4(9). doi: 10.1126/sciadv.aau6190. [DOI] [PMC free article] [PubMed] [Google Scholar]
- Kozlenkov A et al. (2020) ‘Evolution of regulatory signatures in primate cortical neurons at cell-type resolution’, Proceedings of the National Academy of Sciences of the United States of America, 117(45), pp. 28422–28432. doi: 10.1073/pnas.2011884117. [DOI] [PMC free article] [PubMed] [Google Scholar]
- Kuhn S et al. (2017) ‘Oligodendrocytes in Development, Myelin Generation and Beyond’, Cells, 29(1), p. ix. doi: 10.1016/j.coms.2016.10.001. [DOI] [PMC free article] [PubMed] [Google Scholar]
- Lambert SA et al. (2018) ‘The Human Transcription Factors’, Cell Elsevier Inc., 172(4), pp. 650–665. doi: 10.1016/j.cell.2018.01.029. [DOI] [PMC free article] [PubMed] [Google Scholar]
- Marques S et al. (2018) ‘Transcriptional Convergence of Oligodendrocyte Lineage Progenitors during Development’, Developmental Cell, 46(4), pp. 504–517.e7. doi: 10.1016/j.devcel.2018.07.005. [DOI] [PMC free article] [PubMed] [Google Scholar]
- McLean CY et al. (2010) ‘GREAT improves functional interpretation of cis-regulatory regions.’, Nature biotechnology Nature Publishing Group, 28(5), pp. 495–501. doi: 10.1038/nbt.1630. [DOI] [PMC free article] [PubMed] [Google Scholar]
- Moura DMS et al. (2022) ‘Neuron to Oligodendrocyte Precursor Cell Synapses: Protagonists in Oligodendrocyte Development and Myelination, and Targets for Therapeutics’, Frontiers in Neuroscience, 15(January), pp. 1–19. doi: 10.3389/fnins.2021.779125. [DOI] [PMC free article] [PubMed] [Google Scholar]
- Nord AS et al. (2013) ‘Rapid and pervasive changes in genome-wide enhancer usage during mammalian development.’, Cell Elsevier, 155(7), pp. 1521–31. doi: 10.1016/j.cell.2013.11.033. [DOI] [PMC free article] [PubMed] [Google Scholar]
- Reiprich S et al. (2017) ‘Transcription factor Sox10 regulates oligodendroglial Sox9 levels via microRNAs’, Glia, 65(7), pp. 1089–1102. doi: 10.1002/glia.23146. [DOI] [PubMed] [Google Scholar]
- Samudyata, Castelo-Branco G and Liu J (2020) ‘Epigenetic regulation of oligodendrocyte differentiation: From development to demyelinating disorders’, Glia, 68(8), pp. 1619–1630. doi: 10.1002/glia.23820. [DOI] [PubMed] [Google Scholar]
- Schmitt S, Cantuti Castelvetri L and Simons M (2015) ‘Metabolism and functions of lipids in myelin’, Biochimica et Biophysica Acta - Molecular and Cell Biology of Lipids Elsevier B.V., 1851(8), pp. 999–1005. doi: 10.1016/j.bbalip.2014.12.016. [DOI] [PubMed] [Google Scholar]
- Scholzen T and Gerdes J (2000) ‘The Ki-67 protein: From the known and the unknown’, Journal of Cellular Physiology, 182(3), pp. 311–322. doi: 10.1002/(SICI)1097-4652(200003)182:3<311::AID-JCP1>3.0.CO;2-9. [DOI] [PubMed] [Google Scholar]
- Sommer RC et al. (2022) ‘Mechanisms of myelin repair, MRI techniques and therapeutic opportunities in multiple sclerosis’, Multiple Sclerosis and Related Disorders Elsevier B.V., 58(March 2021), p. 103407. doi: 10.1016/j.msard.2021.103407. [DOI] [PubMed] [Google Scholar]
- Stolt CC et al. (2006) ‘SoxD proteins influence multiple stages of oligodendrocyte development and modulate SoxE protein function.’, Developmental cell, 11(5), pp. 697–709. doi: 10.1016/j.devcel.2006.08.011. [DOI] [PubMed] [Google Scholar]
- Trotter J, Karram K and Nishiyama A (2010) ‘NG2 cells: Properties, progeny and origin’, Brain Research Reviews Elsevier B.V., 63(1–2), pp. 72–82. doi: 10.1016/j.brainresrev.2009.12.006. [DOI] [PMC free article] [PubMed] [Google Scholar]
- Vogel JK and Wegner M (2021) ‘Sox9 in the developing central nervous system: A jack of all trades?’, Neural Regeneration Research, 16(4), pp. 676–677. doi: 10.4103/1673-5374.295327. [DOI] [PMC free article] [PubMed] [Google Scholar]
- Zhang X et al. (2021) ‘Replenishing the Aged Brains: Targeting Oligodendrocytes and Myelination?’, Frontiers in Aging Neuroscience, 13(November), pp. 1–11. doi: 10.3389/fnagi.2021.760200. [DOI] [PMC free article] [PubMed] [Google Scholar]
Associated Data
This section collects any data citations, data availability statements, or supplementary materials included in this article.
Supplementary Materials
Data Availability Statement
Sequencing data reported in this paper have been deposited to the Gene Expression Omnibus (GEO) with accession number GSE239663.