

Ophthalmic randomized controlled trials (RCTs) do not enrol participant demographics in commensurate proportions to their respective disease burden. Indeed, non-Caucasian patients are consistently underrepresented in retinal and glaucoma trials [1]. Adequate enrolment of diverse groups is needed to judiciously evaluate therapies. Presbyopia, a global concern for the aging population, is expected to affect 41% of individuals over age 40 by 2030 [2]. Herein, we investigated sex, racial and ethnic disparities in presbyopia trial enrolment.
Figure 1 summarizes the study workflow. “Presbyopia” was searched on clinicaltrials.gov, and we included RCTs with double masking or greater and accessible results via registry or journal publication. Trial characteristics (sponsor and study country, initiation year, phase, and masking) and demographic data (sex, race, and ethnicity according to US Census definitions) were collected. The Global Burden of Disease database provided sex-based presbyopia disease burdens. For female sex, population-to-prevalence ratios (PPRs) with 95% confidence intervals (CI) were calculated, with values between 0.8 and 1.2 constituting judicious enrolment. Kruskal–Wallis tests with subsequent post-hoc comparisons were conducted across trial characteristics.
Fig. 1. Flow diagram of study methods and clinical trial selection.
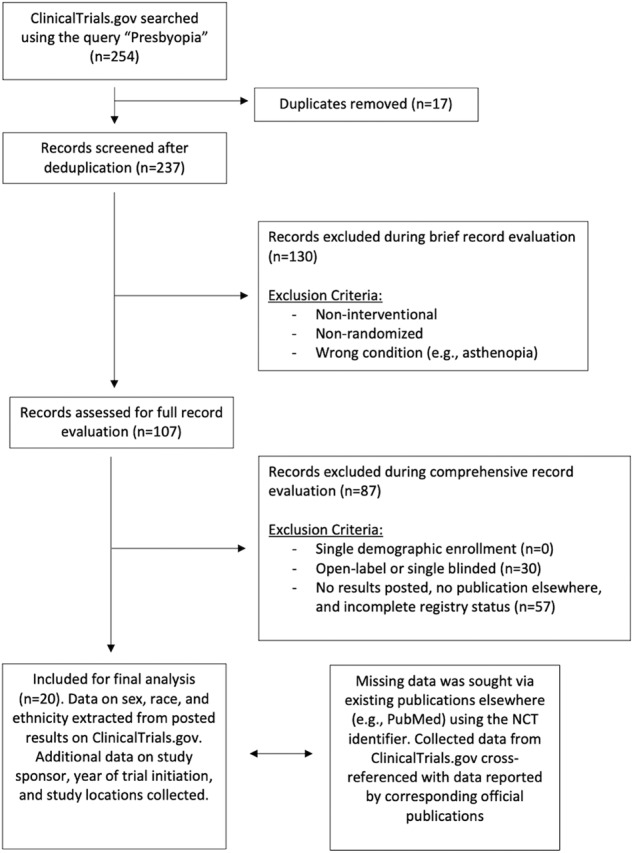
Exclusion criteria for brief and full record evaluation are depicted. From 254 records, we included 20 trials for final analysis, whose study characteristics and trial enrolments were ascertained.
Table 1 provides descriptive and statistical summaries of demographic enrolment. Across 1471 participants (20 trials), females were overrepresented against their disease burden (71.43%; PPR = 1.53, 95%CI [1.42,1.63]), which held over most trial characteristics. Sex overrepresentation in the ophthalmic literature appears to vary with the disease of interest, with women enrolled more often into trials for new US-approved molecular entities, yet underrepresented in diabetic macular oedema trials [3, 4]. Thus, enrolment disparities within ophthalmic conditions deserve individualized study.
Table 1.
Study characteristics and enrollment by sex, age, and race.
| Trial characteristics (20 trials) | N (Reported Race) | Caucasian N; % | Asian N; % | Black N; % | AI/AN N; % | NH/PI N; % | Multiracial N; % | Race Unknown N; % | Hispanic N; % | Total N; % | Female N; % | PPR sex (mean; 95%CI) |
|---|---|---|---|---|---|---|---|---|---|---|---|---|
| Overall | 1804 | 1423; 78.88% | 61; 3.38% | 203; 11.25% | 13; 0.72% | 4; 0.22% | 6; 0.33% | 94; 5.21% | 224; 16.45% | 2471 | 1765; 71.43% | 1.53; 1.42–1.63 |
| Blinding | ||||||||||||
| Double | 835 | 605; 72.46% | 41; 4.91% | 85; 10.18% | 4; 0.48% | 4; 0.48% | 4; 0.48% | 92; 11.02% | 57; 14.5% | 1437 | 1048; 72.93% | 1.54; 1.44–1.65 |
| Triple | 58 | 53; 91.38% | 0; 0% | 1; 1.72% | 2; 3.45% | 0; 0% | 0; 0% | 2; 3.45% | 2; 3.45% | 58 | 27; 46.55% | 1a |
| Quadruple | 911 | 765; 83.97% | 20; 2.2% | 117; 12.84% | 7; 0.77% | 0; 0% | 2; 0.22% | 0; 0% | 165; 18.11% | 976 | 690; 70.7% | 1.59; 1.43–1.75 |
| P value | 0.04b | 0.31 | 0.03c | 0.04c | 0.35 | 0.62 | 0.33 | 0.17 | 0.07 | 0.25 | ||
| Phase | ||||||||||||
| Phase I | 0 | Unreported | Unreported | Unreported | Unreported | Unreported | Unreported | Unreported | Unreported | 75 | 53; 70.67% | 1.54a |
| Phase II | 494 | 400; 80.97% | 12; 2.43% | 69; 13.97% | 7; 1.42% | 2; 0.4% | 2; 0.4% | 2; 0.4% | 85; 22.97% | 634 | 421; 66.4% | 1.43; 1.26–1.6 |
| Phase III | 750 | 639; 85.2% | 16; 2.13% | 89; 11.87% | 5; 0.67% | 0; 0% | 1; 0.13% | 0; 0% | 135; 18% | 750 | 535; 71.33% | 1.7; 1.47–1.94 |
| Phase Not Applicable | 560 | 384; 68.57% | 33; 5.89% | 45; 8.04% | 1; 0.18% | 2; 0.36% | 3; 0.54% | 92; 16.43% | 4; 1.65% | 1087 | 809; 74.43% | 1.55; 1.41–1.68 |
| P value | 0.07 | 0.44 | 0.15 | 0.02c | 0.52 | 1 | 0.22 | 0.09 | 0.07 | 0.14 | ||
| Study Country | ||||||||||||
| US | 1581 | 1316; 83.24% | 42; 2.66% | 197; 12.46% | 13; 0.82% | 2; 0.13% | 3; 0.19% | 8; 0.51% | 224; 16.45% | 2067 | 1483; 71.75% | 1.57; 1.45–1.68 |
| Foreign | 182 | 81; 44.51% | 11; 6.04% | 4; 2.2% | 0; 0% | 2; 1.1% | 2; 1.1% | 82; 45.05% | Unreported | 182 | 112; 61.54% | 1.14a |
| International | 41 | 26; 63.41% | 8; 19.51% | 2; 4.88% | 0; 0% | 0; 0% | 1; 2.44% | 4; 9.76% | Unreported | 41 | 24; 58.54% | 1.46a |
| Not Reported | 0 | Unreported | Unreported | Unreported | Unreported | Unreported | Unreported | Unreported | Unreported | 181 | 146; 80.66% | 1.47; 1.19–1.75 |
| P value | 0.21 | 0.48 | 0.33 | 0.22 | 0.12 | 0.12 | 0.08 | d | 0.16 | 0.24 | ||
| Sponsor Country | ||||||||||||
| US | 153 | 126; 82.35% | 12; 7.84% | 4; 2.61% | 3; 1.96% | 0; 0% | 0; 0% | 8; 5.23% | 2; 3.45% | 277 | 176; 63.54% | 1.38; 1.07–1.69 |
| Foreign | 1527 | 1196; 78.32% | 43; 2.82% | 184; 12.05% | 9; 0.59% | 3; 0.2% | 6; 0.39% | 86; 5.63% | 222; 17.02% | 2021 | 1472; 72.84% | 1.56; 1.45–1.67 |
| International | 124 | 101; 81.45% | 6; 4.84% | 15; 12.1% | 1; 0.81% | 1; 0.81% | 0; 0% | 0; 0% | Unreported | 173 | 117; 67.63% | 1.59; 1.52–1.65 |
| P value | 0.23 | 0.95 | 0.14 | 0.88 | 0.29 | 0.23 | 0.23 | 0.3 | 0.19 | 0.58 | ||
| Initiation Year | ||||||||||||
| 2009–2013 | 95 | 73; 76.84% | 12; 12.63% | 3; 3.16% | 1; 1.05% | 0; 0% | 0; 0% | 6; 6.32% | Unreported | 515 | 386; 74.95% | 1.56; 1.37–1.74 |
| 2014–2017 | 794 | 584; 73.55% | 19; 2.39% | 94; 11.84% | 6; 0.76% | 3; 0.38% | 4; 0.5% | 84; 10.58% | 89; 14.54% | 1041 | 739; 70.99% | 1.47; 1.3–1.64 |
| 2018–2021 | 915 | 766; 83.72% | 30; 3.28% | 106; 11.58% | 6; 0.66% | 1; 0.11% | 2; 0.22% | 4; 0.44% | 135; 18% | 915 | 640; 69.95% | 1.6; 1.45–1.76 |
| P value | 0.58 | 0.11 | 0.62 | 0.79 | 0.77 | 0.66 | 0.33 | d | 0.33 | 0.39 | ||
| Intervention Type | ||||||||||||
| Drug | 1486 | 1243; 83.65% | 30; 2.02% | 194; 13.06% | 12; 0.81% | 2; 0.13% | 3; 0.2% | 2; 0.13% | 224; 16.45% | 1626 | 1152; 70.85% | 1.54; 1.4–1.69 |
| Device | 318 | 180; 56.6% | 31; 9.75% | 9; 2.83% | 1; 0.31% | 2; 0.63% | 3; 0.94% | 92; 28.93% | None enrolled | 845 | 613; 72.54% | 1.51; 1.36–1.66 |
| P value | 0.04b | 0.06 | 0.07 | 0.11 | 0.6 | 0.25 | 0.005b | NA; NA | 0.12 | 0.82 | ||
This table depicts trial enrollment by sex, race, and ethnicity. Absolute number and proportions are shown for these demographics. Participation-to-prevalence ratios (PPRs) were calculated for female patients (PPRsex). Mean and 95% CIs are shown for PPRs. This table also depicts the results of Kruskal–Wallis significance testing for comparing demographic enrollment between by trial characteristics.
AI/AN American Indian or Alaskan Native, NH/PI Native Hawaiian or Other Pacific Islander, PPR participation-to-prevalence ratio.
aPrecludes 95% confidence interval calculation due insufficient number of observations.
bSignificant pairwise or post-hoc comparison; double/quadruple (P = 0.05).
cNo significant post-hoc comparisons.
dPrecludes p value calculation due insufficient statistical levels.
Only seven and 11 trials reported ethnicity and race, respectively, with Caucasians comprising 78.88% of participants with reported race. Predominantly, demographic underrepresentation did not vary with statistical significance across study characteristics. However, Caucasian enrolment was significantly higher in quadruple-blinded over double-blinded trials, and in drug over device trials. These results complement previous research that, despite recent improvements, disparity continues to persist for trial inclusion among racialized and ethnic individuals reflecting underreporting of racial and ethnic categories [1, 3]. This variability in reporting is further compounded by the use of non-standard demographic definitions that are inconsistent with US reporting guidelines [3].
Presbyopia exhibits varying clinical course across demographics. For instance, female sex and Asian race have been associated with early presbyopia progression, and so both groups may benefit from tailored management compared to norms established for other groups [5]. Further, treatment responses may vary across demographics. Norms for adding spherical power, such as those recommended by Pointer, were validated in Caucasian populations with little evidence for generalizability [5]. As well, age-based nomograms for presbyopia may underestimate women’s need for higher power at a given age [2, 5].
In summary, US-registered presbyopia trials do not enrol demographics in proportions that reflect empiric disease burdens, and often underreport race and ethnicity. Diverse demographic enrolment is recommended to promote study generalizability.
Author contributions
Study conception and design: BKT, ARV, MX, GR, EI, FK. Data collection: BKT, ARV, MX. Analysis and interpretation: BKT, ARV, BH, JL, MX, GR, EI, FK. Obtained direct project funding: N/A. Overall responsibility: BKT, ARV, GR, EI, FK.
Funding
This work received no funding from public, commercial, nor not-for-profit sectors. FK is the recipient of the Health Professional-Investigator Award of Michael Smith Foundation for Health Research (2023–2028); Don Rix Physician Leadership Lifetime Achievement Award (2022), BC Achievement Foundation—Mitchell Award of Distinction (2022); The University of British Columbia—Distinguished Achievement Award for Equity, Diversity & Inclusion (2022), Vancouver Medical Dental & Allied Staff Association—Diversity, Equity & Inclusion Award (2022). BT is supported by the Eye Foundation of Canada Scholarship for Medical Students. These recognitions had no role in the design or conduct of this research.
Data availability
Available upon reasonable request to the corresponding author.
Competing interests
The authors declare no competing interests.
Ethics approval
Under article 2.4 of the Tri-Council Policy Statement, this study was exempt from institutional review board approval since all data was gathered from published primary research and publicly available registries. Study results will not identify any individual nor generate new forms of identifiable information.
Footnotes
Publisher’s note Springer Nature remains neutral with regard to jurisdictional claims in published maps and institutional affiliations.
References
- 1.Berkowitz ST, Groth SL, Gangaputra S, Patel S. Racial/Ethnic Disparities in Ophthalmology Clinical Trials Resulting in US Food and Drug Administration Drug Approvals From 2000 to 2020. JAMA Ophthalmol. 2021;139:629–37. doi: 10.1001/jamaophthalmol.2021.0857. [DOI] [PMC free article] [PubMed] [Google Scholar]
- 2.Hickenbotham A, Roorda A, Steinmaus C, Glasser A. Meta-Analysis of Sex Differences in Presbyopia. Investig Ophthalmol Vis Sci. 2012;53:3215–20. doi: 10.1167/iovs.12-9791. [DOI] [PMC free article] [PubMed] [Google Scholar]
- 3.Birnbaum FA. Gender and Ethnicity of Enrolled Participants in U.S. Food and Drug Administration (FDA) Clinical Trials for Approved Ophthalmological New Molecular Entities. J Natl Med Assoc. 2018;110:473–9. doi: 10.1016/j.jnma.2017.12.004. [DOI] [PubMed] [Google Scholar]
- 4.Bowe T, Salabati M, Soares RR, Huang C, Singh RP, Khan MA, et al. Racial, Ethnic, and Gender Disparities in Diabetic Macular Edema Clinical Trials. Ophthalmol Retin. 2022;6:531–3. doi: 10.1016/j.oret.2022.01.018. [DOI] [PubMed] [Google Scholar]
- 5.Han X, Lee PY, Liu C, He M. Distribution and progression of add power among people in need of near correction. Clin Exp Ophthalmol. 2018;46:882–7. doi: 10.1111/ceo.13301. [DOI] [PMC free article] [PubMed] [Google Scholar]
Associated Data
This section collects any data citations, data availability statements, or supplementary materials included in this article.
Data Availability Statement
Available upon reasonable request to the corresponding author.