Abstract
OBJECTIVE
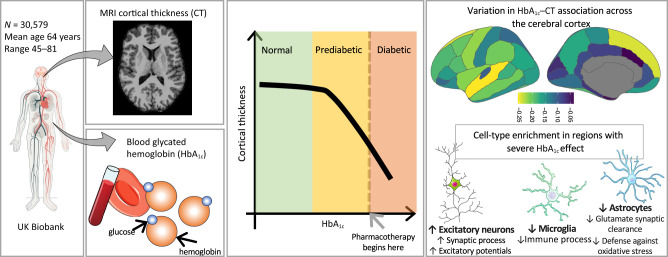
To investigate the relationship between blood glycated hemoglobin (HbA1c) and cerebral cortical thickness (CT) and identify potential cellular mechanisms involved.
RESEARCH DESIGN AND METHODS
A cohort of 30,579 adults age 45 to 81 (mean ± SD: 64 ± 7.5) years with available data on brain MRI and blood HbA1c levels was analyzed. The relationship between HbA1c and CT was probed using independent spatial profiles of cell-specific gene expression. Lastly, a genome-wide association study was conducted on the shared variance between HbA1c and CT.
RESULTS
The HbA1c–CT association was noncontinuous, emerging negatively within the prediabetic range (39.6 mmol/mol). This association was strongest in brain regions with higher expression of genes specific to excitatory neurons and lower expression of genes specific to astrocytes and microglia. A significant locus implicated mitochondrial maintenance and ATP generation.
CONCLUSIONS
Effective glycemia control at prediabetic levels is warranted to preserve brain health and prevent prediabetes-related neurobiologic perturbations.
Graphical Abstract
Introduction
Type 2 diabetes (T2D) is a major risk factor for accelerated brain aging and dementia (1), with up to a twofold risk of dementia and Alzheimer disease (1). Progressive thinning of the cerebral cortex is a neuroimaging marker of brain atrophy in preclinical and clinical dementia (2). T2D may contribute to this cortical thinning. No prior large-scale study has examined the relationship between glycated hemoglobin (HbA1c) and thickness of the cerebral cortex, or which cell types and molecular mechanisms may contribute to the association.
Research Design and Methods
Participants
A total of 30,579 participants age 45 to 81 (mean ± SD: 64 ± 7.5) years from UK Biobank were included in this study (3). Participants without a history of stroke and dementia were studied (Supplementary Material). Blood HbA1c levels were measured using high-performance liquid chromatography, and cortical thickness (CT) was estimated from T1-weighted magnetic resonance images using FreeSurfer (4).
Statistical Analysis
The association between HbA1c and CT was examined by fitting segmented linear regression models (5). Before model fitting, HbA1c was inverse-normal transformed, and CT was adjusted for age, age squared, time between blood sampling and MRI acquisition, and MRI assessment center. The same model was also used to estimate the association for each of the 34 FreeSurfer-parcellated regions of the cerebral cortex.
To identify the potential contributions of cell type, we tested the relationship between cell-type specificity and the correlation of interregional profiles of HbA1c–CT association estimates with interregional profiles of mRNA expression of genes across the 34 cortical regions (Supplementary Fig. 1). The gene specificity for all cell types was calculated using single-nucleus RNA sequencing data from multiple human cortical regions (Allen Institute) with the CELLEX (Cell Type EXpression Specificity) toolkit (6). Gene expression across the cerebral cortex was calculated using bulk mRNA expression from the Allen Human Brain Atlas (7,8).
Next, to explore further the mechanistic basis of the HbA1c–CT association, we conducted a genome-wide association study (GWAS) on the shared variance between HbA1c and CT (indexed by the first principal component [PC1] of the two variables) using Plink (version 2.0). PC1 was calculated using HbA1c and CT adjusted for the same covariates mentioned above, as well as the first five genotype PCs. The GWAS-identified locus of PC1 was then tested for cis–expression quantitative trait loci (eQTLs; i.e., genetic variants associated with mRNA expression of one or more genes) within MetaBrain (9).
A functional enrichment analysis of the gene sets implicated within cell types or cis-eQTL–regulated genes was performed for Gene Ontology biologic processes through the Cluster Profiler R package (10). Cell type– or cis-eQTL–implicated genes were used as seed genes in a coexpression network analysis within an aggregated data set of gene expression from five independent resources including a total of 534 unique donors age 0 to 102 years (11). The top 0.1% of positively coexpressed genes were used as the input for Gene Ontology enrichment analysis.
Data and Resource Availability
All data are available through the UK Biobank study.
Results
Association Between HbA1c and Cerebral CT Emerges at the Low End of Prediabetic HbA1c
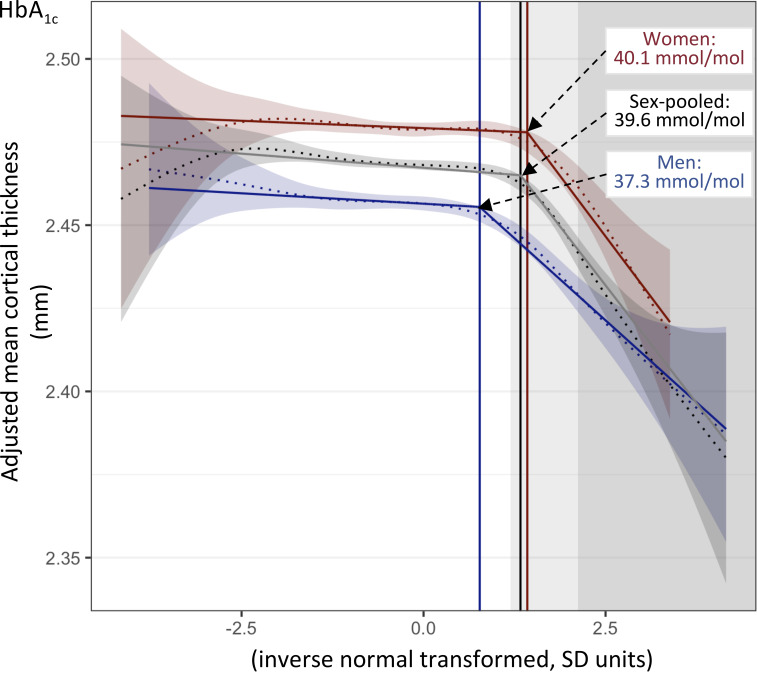
We tested the association between HbA1c and mean CT in 30,579 individuals from UK Biobank (48% men; mean age 64 years; British-European ancestry) (Supplementary Table 1) who had no history of stroke or dementia (3). We showed, using segmented regression modeling (5), that the association between HbA1c and mean CT is not uniform, but rather, it shifts from absence to presence at the HbA1c level of 39.6 mmol/mol, which is the low end of the prediabetic range (Fig. 1). The results were similar when individuals with T2D (n = 741) were excluded from the analysis (Supplementary Fig. 2).
Figure 1.
Association between HbA1c and mean CT in sex-pooled and sex-separate samples. Fitted lines and 95% confidence bands of smooth curves (dotted lines) and fitted lines from segmented linear regression (solid lines) are shown. HbA1c levels were inverse-rank normal transformed, and mean CT was adjusted for age, age squared, time between blood draw and brain MRI, and scanning center. Breakpoint values of HbA1c (i.e., values of HbA1c at which HbA1c–CT association shifts from absence to presence) are shown as vertical lines. Light- and darker-gray backgrounds indicate prediabetes (HbA1c 39–47 mmol/mol) and diabetes (HbA1c ≥48 mmol/mol), respectively.
The association was adjusted for age and sex, and it remained when additionally adjusted for BMI, C-reactive protein, systolic blood pressure, cholesterol, myocardial infarction, white matter hyperintensities, cigarette smoking, and education, suggesting it was independent of these cardiovascular disease risk factors (Supplementary Fig. 3). The same analyses in sex-separate subsamples showed similar association trends in men and women (Fig. 1 and Supplementary Fig. 3); however, the estimated breakpoint was lower in men (37.3 mmol/mol) than in women (40.1 mmol/mol; P = 0.016) (Fig. 1), which resulted in a higher proportion of men (23.2%) than women (6.7%) with a negative statistical effect of HbA1c on CT (P < 2e−16). HbA1c levels did not markedly differ between the sexes, and although men (vs. women) exhibited a more adverse cardiovascular disease profile (age, BMI, blood pressure, myocardial infarction, and white matter hyperintensities) (Supplementary Table 1), adjustment for these factors did not change the breakpoint value. Age-stratified analyses (<65 or ≥65 years) showed that the breakpoint value of HbA1c was at a low prediabetic value in all four subsets, but it tended to be lower in men than in women among older (P = 0.096) but not younger (P = 0.42) individuals (Supplementary Fig. 4).
Excitatory Neurons and Glial Cells Play Opposing Roles in the HbA1c–CT Association
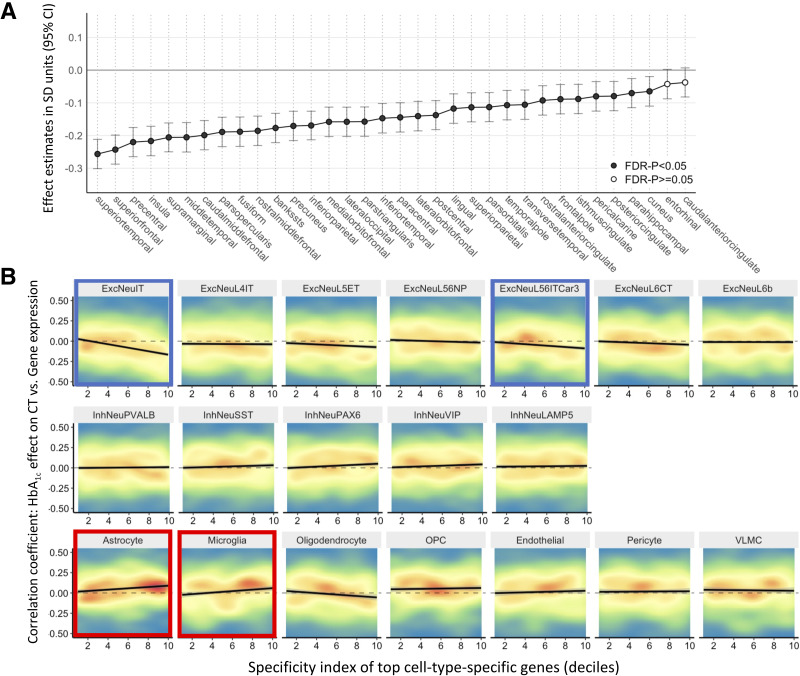
The association between HbA1c and CT varied in strength across the cerebral cortex (Fig. 2). We related this interregional variation in the estimated association between HbA1c and CT across the 34 regions, with cell-specific gene expression across the same 34 regions. Cell-specific gene expression profiles were derived from an independent data set of donors from the Allen Human Brain Atlas (see Research Design and Methods and Supplementary Material). Cell-type enrichment analyses revealed that regions with greater expression of genes specific to excitatory neurons (ExcNeuIT and ExcNeuL56ITCar3) and lower expression of genes specific to astrocytes and microglia showed larger negative effects of HbA1c on CT (Fig. 2 and Supplementary Table 3). The same analysis in sex-separate samples suggested a similar involvement of these four cell types (Supplementary Fig. 5).
Figure 2.
Regional associations between HbA1c and CT and cell-type enrichment analysis. A: Regional associations across the cerebral cortex for each of 34 regions in Desikan-Killiany Atlas estimated in individuals with sex-specific HbA1c levels above breakpoint values shown in Fig. 1. B: Cell-type enrichment analysis of association between cell-type specificity for gene and its correlation between bulk mRNA expression and HbA1c–CT coefficient (from panel A). Individual genes are are shown in a density plot, where red represents areas with high density of genes, and blue represents areas with low density of genes. Solid black line represents linear model fit. FDR, false discovery rate; OPC, oligodendrocyte precursor cell; VLMC, vascular leptomeningeal cell.
Glutamatergic Dysregulation of Excitatory Neurons and Diminished Counter-Regulatory Functions of Astrocytes and Microglia Contribute to HbA1c-Associated CT
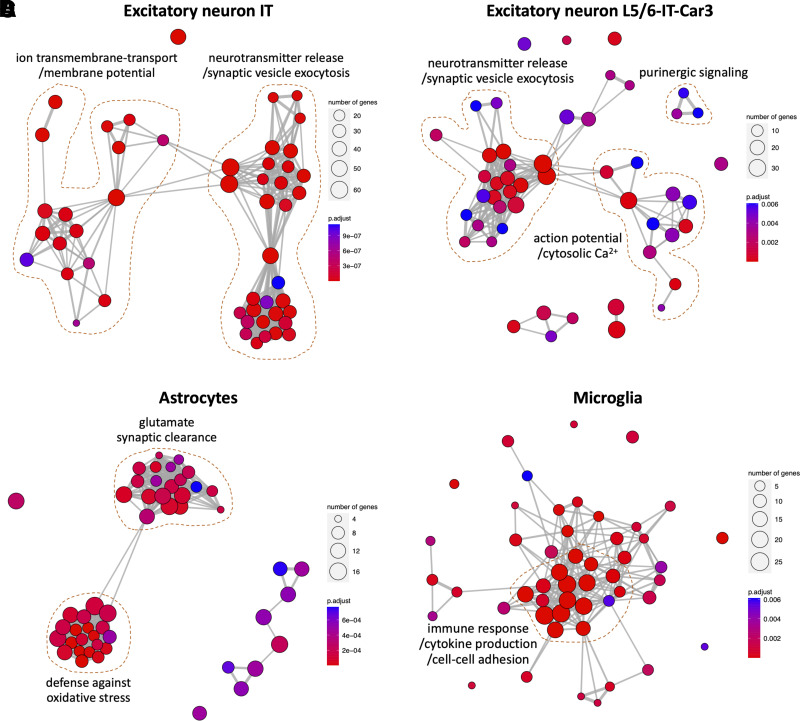
Biologic processes enriched for the cell-specific genes implicated in the HbA1c–CT association are shown in Fig. 3. Excitatory neuron-specific genes with higher expression in regions most affected by HbA1c were involved in synaptic signaling, neurotransmission, purinergic signaling, and regulation of action potential/cytosolic Ca2+. Contrastingly, astrocyte-specific genes with lower expression in regions most affected by HbA1c were enriched with glutamate synaptic clearance and defense against oxidative stressors. Similarly, microglia-specific genes were enriched in general immune processes, such as cytokine production.
Figure 3.
Functional network enrichment analysis of genes specific to cell types implicated by HbA1c–CT association: excitatory IT neurons (A), excitatory L5/6-IT-Car3 neurons (B), astrocytes (C), and microglia (D). Significant biologic processes are represented as nodes, and thickness of connecting edges represents pairwise similarity between processes. N of intersected genes for a particular process is represented by size of each node, whereas false discovery rate–corrected P value is indicated by color. IT, intra-telencephalic.
Genomic Locus of HbA1c-Associated Cortical Thinning Regulates Expression of Cortical Genes Involved in Mitochondria Maintenance and Immune Response
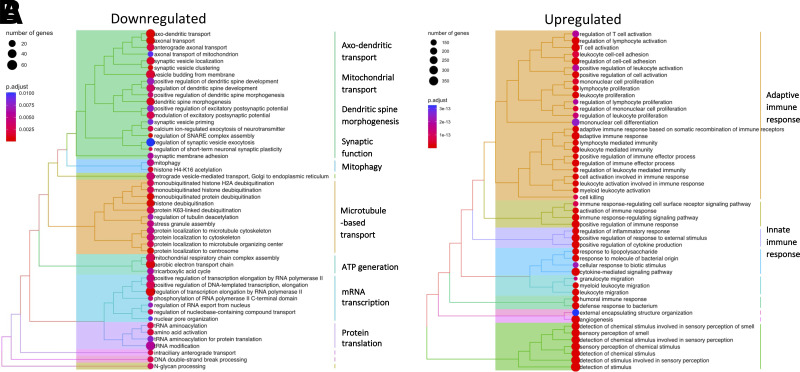
Regionally, the largest negative effect sizes of HbA1c on CT were observed in the superior frontal and superior temporal cortices (Fig. 2). PC1 capturing the shared variance between the CT of these regions and HbA1c was used as an index of HbA1c-associated cortical thinning; it was loaded positively by HbA1c and negatively by CT. We identified a GWAS-significant locus of PC1 within the major histocompatibility complex on chromosome 6 (rs9271176; P = 2.6e−8). The locus showed similar association patterns with PC1 in men and women (Supplementary Fig. 6). The rs9271176 single nucleotide polymorphism was located in an enhancer and was associated with mRNA expression (acting as a cis-eQTL) in the human cerebral cortex of 12 protein-coding genes (MetaBrain (9)) (Supplementary Table 4). These 12 genes were used as seed genes for coexpression analysis using bulk gene-expression data from five independent data sets with up to 534 unique donors. The most positively coexpressed genes were enriched in biologic processes related to immune response, and the most negatively coexpressed genes were enriched in biologic processes of axonal transport, mitochondria maintenance, ATP generation, dendritic spine morphogenesis, and synaptic function (Fig. 4).
Figure 4.
Functional enrichment analysis of 12 genes regulated by eQTL rs9271176 in the cerebral cortex. This eQTL is a GWAS-significant locus of shared variance between HbA1c and CT in individuals with sex-specific HbA1c levels above breakpoint values illustrated in Fig. 1. Biologic processes downregulated (A) and upregulated (B) with genes coexpressed with the 12 eQTL-regulated genes. Terms are presented in a dendrogram by pairwise similarity and clustered into 10 large groups of processes.
Conclusions
We observed a strong negative relationship between HbA1c levels and CT starting within prediabetic ranges, warranting enhanced glycemic control early in the natural history of T2D to protect brain health.
Cell-type and gene-enrichment analyses (Figs. 2 and 3) suggested that HbA1c-associated CT may involve weak excitotoxicity resulting from glutamatergic dysregulation of excitatory neurons (12) and diminished counter-regulatory functions of astrocytes (13) and microglia (14). This includes increased synaptic signaling and cytosolic Ca2+ within excitatory neurons and reduced glutamate synaptic clearance/defense against oxidative stress by astrocytes. Increased cytosolic Ca2+ in neurons impairs cell bioenergetics via mitochondrial dysfunction and ATP depletion and enhances oxidative stress and proapoptotic signaling (12). This glutamatergic dysregulation may develop as a result of subtle metabolic aberrations that arise during prediabetes and that include impaired brain-tissue glucose metabolism (15), insulin resistance (16), and hyperinsulinemia (17).
Lastly, we identified a single nucleotide polymorphism associated with HbA1c-related cortical thinning (i.e., PC1 of HbA1c and CT). This locus regulates genes involved in immune function, synaptic function, axonal transport, and ATP generation (Fig. 4). Neurons and their synapse-related processes require high levels of ATP generated by mitochondria, which are replenished via axonal transport (18). Thus, the identified locus may enhance (pre)diabetes-related weak excitotoxicity by heightening the depletion of ATP (12).
The strengths of this study lie in its innovative methodologic approaches, including a segmented regression analysis that uncovered the nonuniform association between HbA1c and CT, and the integration of cell type–specific transcriptomic data that implicated specific cell types involved. The study is limited by its examination of a single ancestry (British-European) (Supplementary Figs. 7 and 8) and cross-sectional design. The duration of prediabetes was unknown, which may have been a contributor, and exclusion of participants with stroke may restrict generalizability.
Overall, our findings stress the importance of enhanced glycemic control early in the natural history of T2D to protect brain health, and they implicate potential cellular and biologic processes involved.
This article contains supplementary material online at https://doi.org/10.2337/figshare.24174690.
Article Information
Acknowledgments. The authors thank all participants who took part in the UK Biobank study.
Funding. The current study was conducted under the project ID 43688 and funded by the National Institutes of Health (R01AG056726).
Duality of Interest. No potential conflicts of interest relevant to this article were reported.
Author Contributions. J.S., Y.P., T.P., and Z.P. conceptualized the study. J.S., Y.P., and Z.P. researched data and wrote the original manuscript. N.P. edited the manuscript. Z.P. supervised the study and obtained funding. All authors contributed to revising the content and approved the final version. Z.P. is the guarantor of this work and, as such, had full access to all the data in the study and takes responsibility for the integrity of the data and the accuracy of the data analysis.
Funding Statement
The current study was conducted under the project ID 43688 and funded by the National Institutes of Health (R01AG056726).
Footnotes
J.S. and Y.P. contributed equally to this work.
References
- 1. Ott A, Stolk RP, van Harskamp F, Pols HA, Hofman A, Breteler MM. Diabetes mellitus and the risk of dementia: the Rotterdam study. Neurology 1999;53:1937–1942 [DOI] [PubMed] [Google Scholar]
- 2. Bakkour A, Morris JC, Dickerson BC. The cortical signature of prodromal AD: regional thinning predicts mild AD dementia. Neurology 2009;72:1048–1055 [DOI] [PMC free article] [PubMed] [Google Scholar]
- 3. Sudlow C, Gallacher J, Allen N, et al. UK Biobank: an open access resource for identifying the causes of a wide range of complex diseases of middle and old age. PLoS Med 2015;12:e1001779. [DOI] [PMC free article] [PubMed] [Google Scholar]
- 4. Fischl B. FreeSurfer. Neuroimage 2012;62:774–781 [DOI] [PMC free article] [PubMed] [Google Scholar]
- 5. Muggeo VM. Estimating regression models with unknown break-points. Stat Med 2003;22:3055–3071 [DOI] [PubMed] [Google Scholar]
- 6. Timshel PN, Thompson JJ, Pers TH. Genetic mapping of etiologic brain cell types for obesity. eLife 2020;9:e55851. [DOI] [PMC free article] [PubMed] [Google Scholar]
- 7. French L, Paus T. A FreeSurfer view of the cortical transcriptome generated from the Allen Human Brain Atlas. Front Neurosci 2015;9:323. [DOI] [PMC free article] [PubMed] [Google Scholar]
- 8. Hawrylycz MJ, Lein ES, Guillozet-Bongaarts AL, et al. An anatomically comprehensive atlas of the adult human brain transcriptome. Nature 2012;489:391–399 [DOI] [PMC free article] [PubMed] [Google Scholar]
- 9. de Klein N, Tsai EA, Vochteloo M, et al. Brain expression quantitative trait locus and network analyses reveal downstream effects and putative drivers for brain-related diseases. Nat Genet 2023;55:377–388 [DOI] [PMC free article] [PubMed] [Google Scholar]
- 10. Yu G, Wang LG, Han Y, He QY. clusterProfiler: an R package for comparing biological themes among gene clusters. OMICS 2012;16:284–287 [DOI] [PMC free article] [PubMed] [Google Scholar]
- 11. Patel Y, Parker N, Shin J, et al.; Writing Committee for the Attention-Deficit/Hyperactivity Disorder; Autism Spectrum Disorder; Bipolar Disorder; Major Depressive Disorder; Obsessive-Compulsive Disorder; and Schizophrenia ENIGMA Working Groups . Virtual histology of cortical thickness and shared neurobiology in 6 psychiatric disorders. JAMA Psychiatry 2021;78:47–63 [DOI] [PMC free article] [PubMed] [Google Scholar]
- 12. Armada-Moreira A, Gomes JI, Pina CC, et al. Going the extra (synaptic) mile: excitotoxicity as the road toward neurodegenerative diseases. Front Cell Neurosci 2020;14:90. [DOI] [PMC free article] [PubMed] [Google Scholar]
- 13. Bonvento G, Bolaños JP. Astrocyte-neuron metabolic cooperation shapes brain activity. Cell Metab 2021;33:1546–1564 [DOI] [PubMed] [Google Scholar]
- 14. Badimon A, Strasburger HJ, Ayata P, et al. Negative feedback control of neuronal activity by microglia. Nature 2020;586:417–423 [DOI] [PMC free article] [PubMed] [Google Scholar]
- 15. Baker LD, Cross DJ, Minoshima S, Belongia D, Watson GS, Craft S. Insulin resistance and Alzheimer-like reductions in regional cerebral glucose metabolism for cognitively normal adults with prediabetes or early type 2 diabetes. Arch Neurol 2011;68:51–57 [DOI] [PMC free article] [PubMed] [Google Scholar]
- 16. Hascup ER, Broderick SO, Russell MK, et al. Diet-induced insulin resistance elevates hippocampal glutamate as well as VGLUT1 and GFAP expression in AβPP/PS1 mice. J Neurochem 2019;148:219–237 [DOI] [PMC free article] [PubMed] [Google Scholar]
- 17. Datusalia AK, Agarwal P, Singh JN, Sharma SS. Hyper-insulinemia increases the glutamate-excitotoxicity in cortical neurons: a mechanistic study. Eur J Pharmacol 2018;833:524–530 [DOI] [PubMed] [Google Scholar]
- 18. Mandal A, Drerup CM. Axonal transport and mitochondrial function in neurons. Front Cell Neurosci 2019;13:373. [DOI] [PMC free article] [PubMed] [Google Scholar]


