Abstract
Purpose
To externally evaluate a mammography-based deep learning (DL) model (Mirai) in a high-risk racially diverse population and compare its performance with other mammographic measures.
Materials and Methods
A total of 6435 screening mammograms in 2096 female patients (median age, 56.4 years ± 11.2 [SD]) enrolled in a hospital-based case-control study from 2006 to 2020 were retrospectively evaluated. Pathologically confirmed breast cancer was the primary outcome. Mirai scores were the primary predictors. Breast density and Breast Imaging Reporting and Data System (BI-RADS) assessment categories were comparative predictors. Performance was evaluated using area under the receiver operating characteristic curve (AUC) and concordance index analyses.
Results
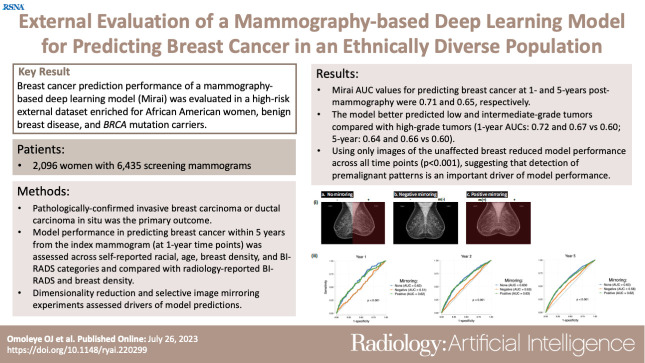
Mirai achieved 1- and 5-year AUCs of 0.71 (95% CI: 0.68, 0.74) and 0.65 (95% CI: 0.64, 0.67), respectively. One-year AUCs for nondense versus dense breasts were 0.72 versus 0.58 (P = .10). There was no evidence of a difference in near-term discrimination performance between BI-RADS and Mirai (1-year AUC, 0.73 vs 0.68; P = .34). For longer-term prediction (2–5 years), Mirai outperformed BI-RADS assessment (5-year AUC, 0.63 vs 0.54; P < .001). Using only images of the unaffected breast reduced the discriminatory performance of the DL model (P < .001 at all time points), suggesting that its predictions are likely dependent on the detection of ipsilateral premalignant patterns.
Conclusion
A mammography DL model showed good performance in a high-risk external dataset enriched for African American patients, benign breast disease, and BRCA mutation carriers, and study findings suggest that the model performance is likely driven by the detection of precancerous changes.
Keywords: Breast, Cancer, Computer Applications, Convolutional Neural Network, Deep Learning Algorithms, Informatics, Epidemiology, Machine Learning, Mammography, Oncology, Radiomics
Supplemental material is available for this article.
© RSNA, 2023
See also commentary by Kontos and Kalpathy-Cramer in this issue.
Keywords: Breast, Cancer, Computer Applications, Convolutional Neural Network, Deep Learning Algorithms, Informatics, Epidemiology, Machine Learning, Mammography, Oncology, Radiomics
Summary
External evaluation of a mammography-based deep learning tool for breast cancer prediction in a dataset from a high-risk population demonstrated that detection of precancerous changes is likely a major driver of model performance.
Key Points
■ External evaluation of a mammography-based deep learning model for breast cancer risk prediction in a high-risk case-control dataset enriched for African American patients, benign breast disease, and BRCA mutation carriers demonstrated 1- and 5-year area under the receiver operating characteristic curve (AUC) values of 0.71 and 0.65, respectively.
■ The model showed a higher discriminatory ability for predicting low- and intermediate-grade (vs high-grade) breast cancers (5-year AUC, 0.64 and 0.66 vs 0.60, respectively; all P < .05), while no evidence of a difference was found in performance at the 5-year time point according to age group (P = .06), breast density category (P = .65), or receptor status (P = .20).
■ Mirroring explainability experiments revealed that the image of the breast with future cancer was more critical in determining the deep learning model’s predictions compared with bilateral field effects (5-year AUCs of no mirroring vs negative mirroring, 0.63 vs 0.56; P < .001), suggesting that the model is likely detecting early premalignant changes.
Introduction
Current guidelines for breast cancer surveillance apply models to stratify women into risk categories to inform preventative measures (1,2). While mammography-based breast cancer risk assessment has hitherto mainly focused on visually assessed breast density and radiology-reported Breast Imaging Reporting and Data System (BI-RADS) assessment categories (3–5), recent studies have proposed using deep learning (DL) approaches to estimate breast cancer risk (6,7) by leveraging mammographic data.
Numerous mammography-based artificial intelligence tools have been developed to detect cancer on digital mammograms (8,9), triage screeners (10), pathologically classify apparent lesions (11,12), and quantitatively estimate breast density (13,14). Nevertheless, using DL to estimate near- and long-term breast cancer risk from mammographic data has only recently been explored (6,15,16). While a handful of encouraging results have been found with mammography-based DL for breast cancer risk prediction (6,7,15,17,18), there are insufficient data demonstrating independent external testing of these new models in prospectively selected, racially diverse, high-risk populations of women who stand to benefit most from more accurate risk assessment. The black box phenomenon (19) and the risk of propagating nongeneralizable DL algorithms (20,21) underscore the need for extensive external testing of mammography DL tools in diverse patient settings and closer attention to DL model explainability. Moreso, increased external testing is expected to fast-track clinical adoption.
Mirai is a DL model designed to predict breast cancer risk at multiple time points by leveraging mammographic data (6). The mammography DL model was trained on approximately 211 000 screening mammograms acquired at Massachusetts General Hospital to predict 1- to 5-year breast cancer risk (6). Internal testing of Mirai demonstrated its superior performance compared with the Tyrer-Cuzick model commonly used in clinics (6); Harrell concordance indexes of Mirai ranged from 0.75 to 0.84, which advances the state of the art for breast cancer risk prediction (15). We rigorously evaluated this DL model with the Chicago Multiethnic Epidemiologic Breast Cancer Cohort (22), assessing its performance according to age, self-reported race and ethnicity, breast density, and BI-RADS assessment categories and comparing it with radiology-reported breast density and BI-RADS. Furthermore, we assessed model performance in predicting specific breast cancer molecular subtypes. Finally, we performed dimensionality reduction and conducted selective image mirroring experiments to better understand the drivers of model predictions.
Materials and Methods
Study Design, Setting, and Dataset
This was a retrospective case-control study that was Health Insurance Portability and Accountability Act compliant and approved by the University of Chicago Institutional Review Board. Consecutive women evaluated in the Cancer Risk Clinic or the Breast Center at the University of Chicago Medicine since 1992 were prospectively recruited and consented to provide longitudinal follow-up data. Patients included women with a positive family history of breast cancer, a personal history of benign breast disease, and known or suspected breast cancer predisposing gene mutations, as previously described (22,23). Screening mammograms and clinicopathologic information acquired from medical records from 2006 to 2020 were included (see also Appendix S1). Herein, we refer to a single screening mammographic encounter as an “examination.” Excluded examinations comprised those lacking one or more standard mammographic views, those with breast implants or other foreign devices, those with burned-in annotations, and control examinations with less than 1 year of follow-up. All included examinations were in “For Presentation” mode.
Data Sources and Measurements
Pathologically confirmed invasive breast carcinoma, or ductal carcinoma in situ, was the primary outcome. Case examinations were defined as those that had a breast cancer diagnosis within 5 years from the date of mammography. Control examinations were ascertained to be cancer free at specified follow-up dates. Using the publicly available Mirai model with pretrained weights, we generated examination-level risk scores from input examinations with the four standard mammographic views. The primary predictor was the mammography DL risk score.
Comparative predictors were BI-RADS assessment and breast density. BI-RADS assessment and visually assessed breast density were retrieved from signed radiology reports, read at the University of Chicago Medicine. We summarized BI-RADS categories 4 and 5 into one category denoting “suspicious findings” and ranked them from low to high risk as follows: 1, 2, 3, 0, 4, and 5, in accordance with a previously published systematic review and meta-analysis (24). In addition, we applied the breast density classifier (BDC) (25), a publicly available DL model, to generate a quantitative measure of breast density. The BDC provides distributed probabilities of the examination falling into any of the density classes (A–D), denoted by cat0, cat1, cat2, and cat3. The sum of four probability scores, cat 0 to 3, always adds to 1. We computed weighted density (WD) scores using the following formula:
The WD reflects a sum of the probability of falling into any of the density classes multiplied by the magnitude of that class (1 to 4).
Model Explainability Analyses
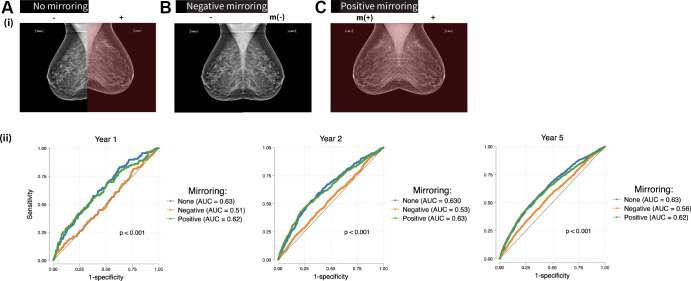
Mirai encodes each mammogram view into a 512-dimensional vector and concatenates all four views into a 2048-dimensional vector representation. Uniform manifold approximation and projection (26) two-dimensional representations of examinations were compared according to case or control status, breast density, self-reported race and ethnicity, tumor receptor status, and tumor grade. Through selective mirroring, we tested the impact of removing the input image of the breast side with future cancer on Mirai’s performance to determine whether supposedly premalignant changes unique to the ipsilateral (future affected) breast were paramount to the DL model’s predictions. In “positive mirroring,” we replaced the image of the unaffected breast with a mirror image of the affected breast. In “negative mirroring,” we replaced the image of the affected breast with a mirror image of the unaffected breast. Examinations with bilateral breast cancer were excluded from the mirroring analysis. Mirroring was accomplished using the cv2 module in Python. To prevent the introduction of bias from mirroring itself (given that side localization applied only to case examinations), we randomly mirrored breast sides in control examinations.
Statistical Analysis
Statistical analyses were conducted using Stata version 17 (StataCorp). Mirai and BDC scores were generated in Python version 3.6 (https://www.python.org/downloads/release/python-360/). We evaluated the ability of risk measures to predict breast cancer occurring within 5 years from the index mammogram at discrete 1-year incremental time points. Using specified risk scores and time-to-event labels, we performed nonparametric area under the receiver operating characteristic curve (AUC) analysis. At each annual 1- to 5-year time point, a positive examination was defined as one where cancer had developed since the mammography until that time point. A negative examination was one confirmed cancer free from mammography until that time point. Thus, an examination that showed cancer 3 years after mammography was considered negative for the 1- and 2-year AUC calculations but positive for the 3- to 5-year AUC calculations. Follow-up time was determined from the date of mammography and the most recent subsequent cancer-negative screening. Control examinations with unconfirmed cancer-free status at or after x year were right-censored for the respective x-year AUC calculation. AUC was determined using the roctab command (Stata), which performs nonparametric receiver operating characteristic analyses (27). For receiver operating characteristic comparison, we used the DeLong method (27) to evaluate model performance according to age, breast density, BI-RADS, and self-reported racial categories, as well as to compare individual models (Mirai vs BI-RADS assessment). For comparison of AUCs according to tumor grade and clinical subtype, we used the bootstrap approach because these subtype comparison groups had a shared control set, a scenario in which AUCs cannot be compared using the DeLong method. In particular, we bootstrapped the dataset 1000 times to obtain the distribution of subtype-specific AUCs and calculate P values for comparisons. AUC values are reported with 95% CIs. The Harrell concordance index (28), a global measure of discrimination of predictive models that factors in time-to-event differences, was computed using the somersd package (Stata) to indicate overall model performance. Groupwise risk score distributions were compared using the Kruskal-Wallis test, a nonparametric equivalent of the one-way analysis of variance. Spearman correlation (r) was calculated to assess any relationship between Mirai scores and BDC-WD scores, with r values of 0 to 0.19 indicating very weak, 0.2 to 0.39 indicating weak, 0.4 to 0.59 indicating moderate, 0.6 to 0.79 indicating strong, and 0.8 to 1 indicating very strong correlations. A logistic regression model was built to predict 1-year cancer outcome using Mirai 1-year risk scores and BI-RADS categories as independent variables. The combined model was compared with each standalone model using roccomp (Stata). All statistical tests were two-sided, and P < .05 was considered indicative of a statistically significant difference.
Results
Patient-level and Examination-level Characteristics
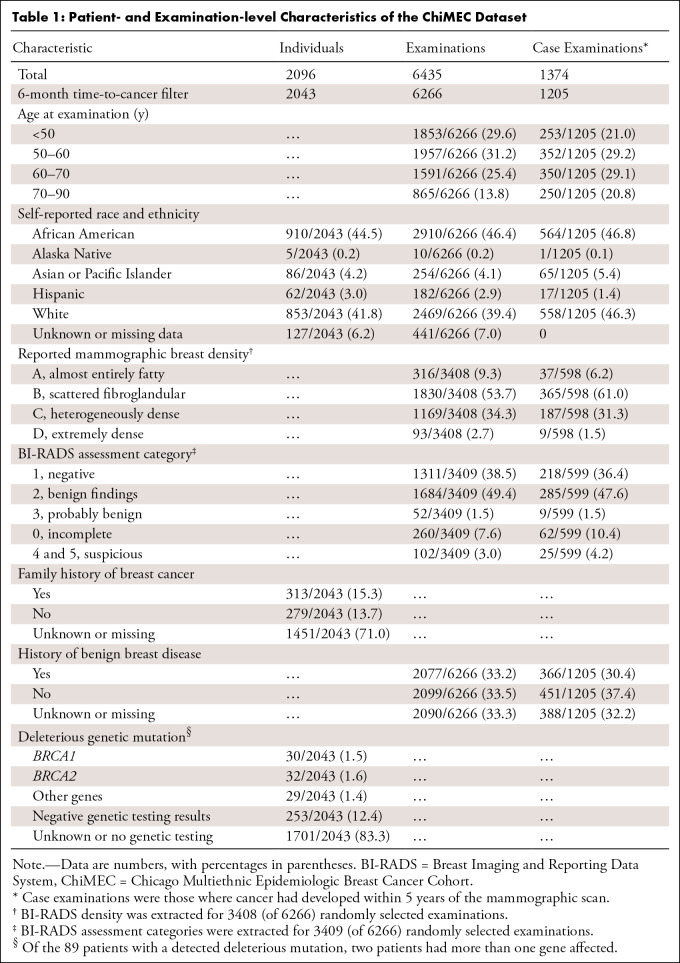
A total of 6435 examinations in 2096 individuals were included. After filtering out 169 examinations with a time to cancer of less than 6 months, 6266 examinations in 2043 patients (910 African American, 853 White) were further analyzed (Table 1, Table S1). The median age at mammography was 56.4 years ± 11.2 (SD). There were a total of 1205 case examinations, in which cancer had developed within 5 years, in the filtered set. The median time to cancer was 2 years for case examinations, with an IQR of 1–4 years. For controls, the median duration of follow-up was 5 years (IQR, 3–7 years). Among the examinations, 46.4% (2910 of 6266) were obtained in African American women. Dense breasts were reported in 37% (1262 of 3408) of randomly selected examinations, and 2077 of 6266 (33.2%) examinations were associated with a history of benign breast disease. A total of 342 patients had genetic testing information available, of whom 89 (26.0%) had a deleterious mutation in a breast cancer–predisposing gene, most commonly BRCA mutation (62 of 89, or 69.7%, women with a gene mutation).
Table 1:
Patient- and Examination-level Characteristics of the ChiMEC Dataset
Mirai Model Discrimination Evaluation
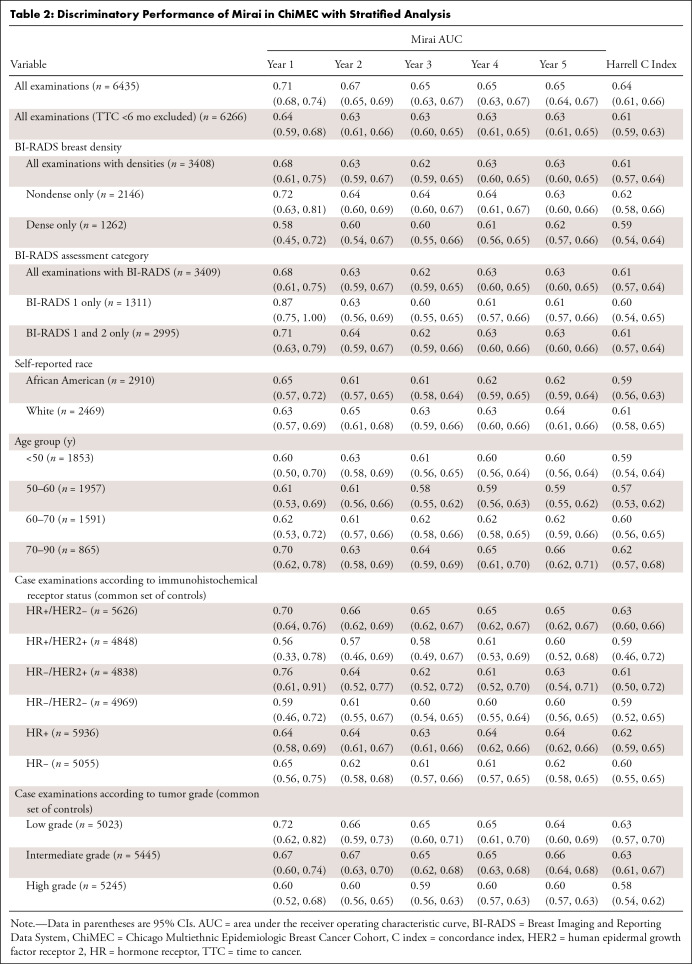
In the unfiltered set, Mirai achieved a 1-year AUC of 0.71 (95% CI: 0.68, 0.74), 5-year AUC of 0.65 (95% CI: 0.64, 0.67), and Harrell concordance index of 0.64 (95% CI: 0.61, 0.66). Mirai showed better discriminatory performance for near-term compared with long-term cancer prediction, as demonstrated by the decreasing AUCs at sequential time points (Table 2). After excluding case examinations with a time to cancer less than 6 months, the 1- and 5-year AUCs were 0.64 (95% CI: 0.59, 0.68) and 0.63 (95% CI: 0.61, 0.65), respectively, and the Harrell concordance index was 0.61 (95% CI: 0.59, 0.63). See Table S2 for sensitivity and specificity analyses. In further analyses, examinations with a time to cancer less than 6 months were excluded.
Table 2:
Discriminatory Performance of Mirai in ChiMEC with Stratified Analysis
Mirai Scores versus Radiology-reported BI-RADS Assessment Categories
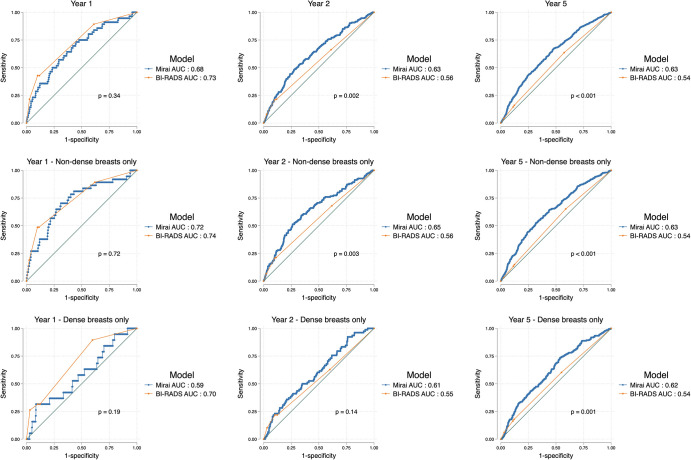
At the year 1 time point, there was no evidence of a difference between BI-RADS assessment and Mirai (AUC, 0.73 [95% CI: 0.66, 0.79] and 0.68 [95% CI: 0.61, 0.75], respectively; P = .34) (Fig 1, Table S3). However, for longer-term prediction (2–5 years), Mirai outperformed BI-RADS (all P < .01). Using BI-RADS category 3 as the cutoff showed a sensitivity of 42.9% (24 of 56) and specificity of 88.4% (2963 of 3353) at year 1, whereas using the 75th percentile of Mirai risk scores as the cutoff achieved a sensitivity and specificity of 36.3% (438 of 1205) and 80.5% (2224 of 2763), respectively, at year 5 (Tables S2, S4). More suspicious BI-RADS categories obtained higher Mirai risk score distributions, reflecting that pathologic finding on the evaluated mammogram, irrespective of its malignancy, was detected by the DL model (Fig 2). We observed differences in Mirai scores across BI-RADS categories, even when stratified according to case or control status (P < .001).
Figure 1:
Area under the receiver operating characteristic curves (AUCs) show comparisons of Mirai risk scores and Breast Imaging Reporting and Data System (BI-RADS) assessment scores in all examinations (top row) and stratified according to nondense (middle row) and dense (bottom row) breasts at the 1-year, 2-year, and 5-year time points. Mirai’s predictions were superior to those of BI-RADS for outcomes beyond year 1. Both models performed better in nondense breasts compared with dense breasts, but this was not statistically significant.
Figure 2:
Left: Density plot shows lower Mirai score distribution among Breast Imaging Reporting and Data System (BI-RADS) 1 (negative) mammograms compared with BI-RADS 2 and above. Right: Box plots show higher distribution of scores with more suspicious BI-RADS categories when stratified according to (future) case (1, top) or control (0, bottom) status. For each box, the central line indicates the median Mirai score, while the left and right edges indicate the 25th and 75th percentiles, respectively. The left and right whiskers represent the lower and upper extremes of values, respectively. Outliers are plotted as separate points.
Logistic regression was used to combine Mirai and BI-RADS scores to predict the 1-year outcome using a 70:30 development-test split. In the test set, the combined Mirai plus BI-RADS scores achieved a 1-year AUC of 0.75 (95% CI: 0.63, 0.87), compared with BI-RADS assessment (AUC, 0.70; 95% CI: 0.57, 0.83; P = .08) or Mirai 1-year risk score (AUC, 0.67; 95% CI: 0.54, 0.81; P = .33). The combined score had a very high correlation with BI-RADS (r = 0.86) and a moderate correlation with Mirai (r = 0.43).
Breast Density and Model Performance
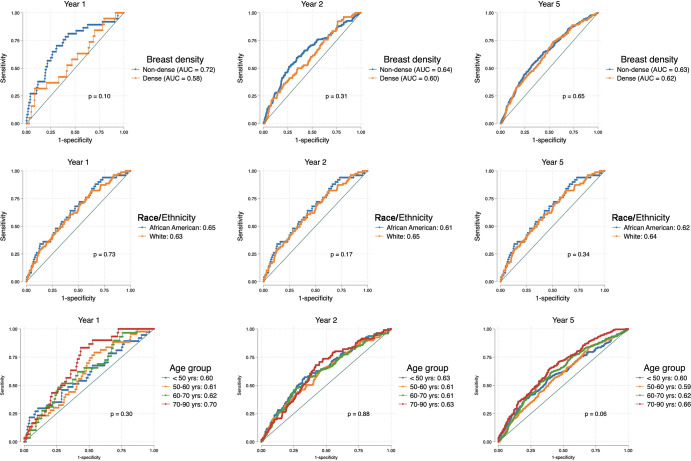
Mirai had high performance in predicting 1-year risk in nondense breasts (AUC, 0.72; 95% CI: 0.63, 0.81) compared with dense breasts (AUC, 0.58; 95% CI: 0.45, 0.72; P = .10). Beyond year 1, the difference in Mirai’s performance between nondense and dense breasts gradually tapered (Table 2, Fig 3). On the other hand, the 1-year AUC using BI-RADS was 0.74 (95% CI: 0.66, 0.82) for nondense breasts versus 0.70 (95% CI: 0.59, 0.81) (P = .52) for dense breasts (Table 3).
Figure 3:
Area under the receiver operating characteristic curves (AUCs) show comparisons of Mirai according to breast density (top row), self-reported race and ethnicity (middle row), and age group (bottom row). Mirai showed better performance in nondense breasts, White women, and older women; however, none of the AUC differences was statistically significant.
Table 3:
BI-RADS Assessment Performance in the Entire Sample according to Breast Density
Model Performance according to Age and Self-reported Race and Ethnicity
We found no evidence of differences in Mirai’s performance across age groups or racial categories (Table 2, Fig 3).
Breast Density Measures as a Predictor of Breast Cancer
Using radiology-reported density as ground truth labels, BDC-WD scores achieved an AUC of 0.86 (95% CI: 0.85, 0.88), showing high performance in its primary task of predicting breast density. There was a strong positive correlation between the BDC-WD scores and reported mammographic density (r = 0.66, P < .001). There was a very weak correlation between BDC-WD and 1-year Mirai risk scores (r = 0.18, P < .001), as well as between reported density and the 1-year Mirai risk score (r = 0.18, P < .001). For predicting future case or control status, Mirai scores outperformed BDC-WD scores and reported density at all time points (all P < .001). See Table S5 for a detailed AUC comparison.
Mirai Risk Score Distributions in Breast Cancer Subtypes
Examinations with future high-grade tumors displayed lower Mirai score distributions compared with examinations with future low- to intermediate-grade tumors (Fig 4A) (P = .005). This was substantiated by higher AUCs for predicting low- and intermediate-grade versus high-grade tumors at the 1-year (0.72 and 0.67 vs 0.60) and 5-year (0.64 and 0.66 vs 0.60) time points (Table 2). We observed differences in predicting 2–5-year risks of low- to intermediate-grade versus high-grade tumors (all P < .05). We also found differences in score distributions according to tumor receptor subtype (Fig 4B). In particular, the 5-year Mirai risk score was higher for hormone receptor (HR) positive and human epidermal growth factor receptor 2 (HER2) negative, or HR+/HER2−, subtype than the other three subtypes (P = .02). Similarly, Mirai performed better at predicting HR+/HER2− breast cancer compared with other receptor subtypes (Table 2), although the differences were not statistically significant (P = .20 for 5-year risk score).
Figure 4:
Density plots show the distribution of Mirai 5-year risk scores in cases according to tumor grade (left) and receptor status (right). Examinations with future high-grade tumors had lower scores compared with examinations with future low- or intermediate-grade tumors. HER2 = human epidermal growth factor receptor 2, HR = hormone receptor.
The Impact of Selective Image Mirroring
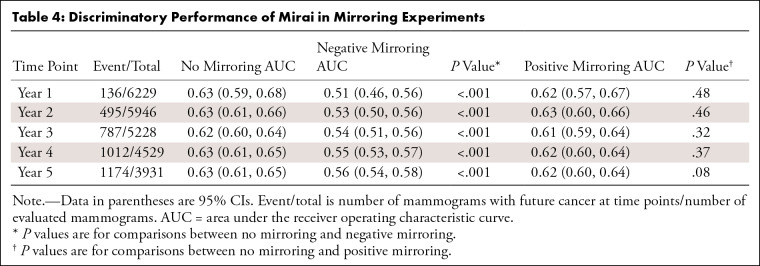
Mirai model performance was not affected by positive mirroring (Fig 5, Table 4). However, negative mirroring caused a decrease in model performance across all time points (P < .001); this reduction was nearly complete for year 1 risk prediction (AUC, 0.51) and partial for year 5 (AUC, 0.56). Negative mirroring of case examinations led to a decrease in their risk scores (Fig 6). Surprisingly, we observed a marginal decrease in the risk score distribution with positive mirroring of cases, as well as with random mirroring of controls.
Figure 5:
Top: Radiographic schema of mirroring experiment (only mediolateral oblique mammographic views shown for demonstration) shows no mirroring, as indicated by the original input screening mammogram with the known breast side of future cancer (+) and the unaffected breast side (−); negative mirroring, whereby the unaffected breast side (−) is mirrored, indicated by m (−), so that the input examination excludes the future affected breast (+); and positive mirroring, where the affected breast side is mirrored such that the input examination includes two copies of the future affected breast, indicated by m (+) and +. Bottom: Area under the receiver operating characteristic curves (AUCs) show Mirai performance in mirroring experiments (years 1, 2, and 5 from left to right). No mirroring and positive mirroring display superior model discrimination compared with negative mirroring at all time points.
Table 4:
Discriminatory Performance of Mirai in Mirroring Experiments
Figure 6:
Left: Box plot shows risk score distribution in different mirroring experiments. Higher-score distributions are observed in unmirrored (future) cases, with negative mirroring causing the most notable reduction in scores and positive mirroring causing a smaller reduction. For each box, the central line indicates the median Mirai score, while the upper and lower edges indicate the 75th and 25th percentiles, respectively. The upper and lower whiskers represent the upper and lower extremes of values, respectively. Outliers are plotted as separate points. Right: Density plot shows lower score distributions among negatively mirrored future cases (F.Case, M−) compared with unmirrored future cases (F.Case, M0), with positive mirroring (F.Case, M+) scoring in between. In either mirroring scenario, examination images in women without future breast cancer (controls) were randomly mirrored.
Dimension Reduction of Mirai’s Hidden Representations
Uniform manifold approximation and projection of the Mirai model’s hidden representations according to case and control status, race and ethnicity, tumor receptor status, and tumor grade (Appendix S1, Fig S1) did not demonstrate notable dimensional separation between groups. However, some separation was observed between dense and nondense breasts.
Discussion
We externally evaluated a mammography-based DL breast cancer risk prediction model, Mirai, in a high-risk racially diverse dataset enriched for BRCA mutation carriers and benign breast diseases. In this study, Mirai showed higher discriminatory capacity for short-term cancer prediction (overall AUC: year 1, 0.71 [95% CI: 0.68, 0.74] vs year 5, 0.65 [95% CI: 0.64, 0.67]) and performed marginally better in women with nondense breasts (1-year AUC, 0.72 vs 0.58; P = .10; not statistically significant but deserving further confirmation). The DL model outperformed BI-RADS for longer-term (2–5-year) prediction (Fig 1). Furthermore, Mirai showed higher discrimination for low- to intermediate-grade versus high-grade tumors (all P < .05). Mirroring experiments showed that the image of the breast side with the future cancer was critical for model discrimination (1-year AUCs of 0.63, 0.62, and 0.51 for no mirroring, positive mirroring, and negative mirroring, respectively). Neither visually assessed breast density nor BDC-WD was a good discriminator of future breast cancer in this high-risk population, and both measures were significantly outperformed by Mirai predictions at all time points.
Recent work has shown that Mirai can predict 5-year cancer risk, with AUCs ranging 0.76–0.85 in several independent retrospective test sets (6,15). Compared with previously published multi-institutional testing by Yala et al (15), we observed relatively lower discriminatory performance in the Chicago Multiethnic Epidemiologic Breast Cancer Cohort, which is more enriched for BRCA mutation carriers, benign breast disease, and African American women. Nearly 50% of mammograms in our study were from self-reported African American women, compared with 4.8% of total examinations in the previous test set (6). Still, the published performance of Mirai reflects considerable advancement over established clinical risk models, such as Tyrer-Cuzick, which obtained a 5-year AUC of 0.62 in a test set, compared with an AUC of 0.76 for Mirai (6). The DL model performance noted in the Chicago Multiethnic Epidemiologic Breast Cancer Cohort is similar to those reported by Lehman et al (17), in which Mirai obtained a 5-year AUC of 0.68 (95% CI: 0.66, 0.70), and Arasu et al (18) in an external evaluation (5-year AUC, 0.67; 95% CI: 0.66, 0.68). Furthermore, Lehman et al (17) externally assessed Mirai alongside the National Cancer Institute Breast Cancer Risk Assessment Tool and Tyrer-Cuzick in a prospectively recruited patient cohort and found that the DL model obtained significantly higher AUCs and future cancer yield.
However, none of the previously published external evaluation studies assessed Mirai performance compared with BI-RADS assessment categories or breast density, which are routinely available in mammography reports. In addition, none of the previous studies performed mirroring experiments on input images to see how mirroring affected model predictions. In our study, the combined DL and BI-RADS scores showed better short-term discrimination than either model evaluated alone, and while this difference was not statistically significant, it suggests that mammography DL tools could supplement the assessment of screening mammograms for more accurate near-term risk stratification. Still, it would be interesting to evaluate this on a larger dataset.
Given that parenchymal-level information is captured by the DL model, it is biologically plausible that Mirai performs better at estimating nearer-term risk compared with longer-term risk. The sustained performance of Mirai when evaluating negative or benign (BI-RADS 1 and 2) screening mammograms alone (Table 2) shows that it might be a valuable tool for alerting radiologists about normal-appearing (negative or benign BI-RADS) examinations as well as high Mirai-scoring mammograms, which may harbor occult malignancy or demonstrate premalignant changes. The trend toward lower discriminatory performance of both Mirai and BI-RADS assessment in women with dense breasts reflects the limitations of mammography as a screening modality (29,30). Dense breasts obscure parenchymal changes (29), and the lack of granular detail of breast parenchyma could affect DL model performance. Therefore, modalities less impacted by breast density, such as breast tomosynthesis (31) or abbreviated breast MRI (32), might constitute good training data for DL models.
Results from selective mirroring, along with better performance of the DL model for near-term versus longer-term prediction (Table 2), suggest that DL may detect premalignant or early malignant changes before they become apparent. These results suggest that field-effect biomarkers, which are expectedly common to both breasts (33,34), are not the most critical feature driving the DL model’s predictions; however, they may be contributory because negative mirroring did not completely eliminate discriminatory ability (5-year AUC, 0.56; 95% CI: 0.54, 0.58). The reduction in Mirai risk scores with positive mirroring could possibly be the result of a loss of asymmetry in the full examination ensemble, which the model might be sensitive to, considering that this score reduction was observed in both cases and controls (which were randomly mirrored).
Performance of the mammography DL model also differed according to breast cancer subtype and tumor grade. Previous studies have indicated that mammography is less sensitive at detecting higher-grade and HR-negative breast cancers (35). Our findings of higher Mirai scores in examinations with future low- to intermediate-grade and HR+/HER2− tumors, as well as higher AUCs for predicting low to intermediate grade (vs high grade) and HR+/HER2− (vs other immunohistochemical subtypes) cancers, are in concordance with known subtype-specific mammographic sensitivity differences. However, these differences may also reflect model training set biases because most cancer cases in the training set were low-grade and HR+/HER2− cancers (6). From a public health perspective, it is desirable to develop more accurate risk prediction models for aggressive forms of breast cancer, such as high-grade and triple-negative breast cancers, in future DL studies. Our study, when juxtaposed with previous work, provides additional insight on mammography DL risk prediction models (6,15,17) in that it was performed in a group enriched for a high prevalence of risk factors, including family history and benign breast disease, compared with the model development set (6).
Our study is not without limitations. Given the limited sample size of other self-reported racial and ethnic groups, we were only able to equitably evaluate the model’s performance in White and Black women. Furthermore, equitable comparison with BI-RADS for short- and long-term prediction may be limited by our sample size and lack of granular detail on the BI-RADS assessment subcategories (4a, b, and c). Given that this was a case-control study, we did not assess model calibration. Although Mirai’s usage is not limited to distinct risk groups, it is important to acknowledge that the model was trained on a dataset with a likely lower-risk profile and tested on a high-risk dataset. As a result, our findings may not readily extend to women of average risk. Our study predominantly provides an initial evaluation of Mirai’s performance within high-risk populations. Larger prospective studies focusing on high-risk women are needed.
In conclusion, this study was, to our knowledge, the first independent external evaluation study of a mammography-based DL model for breast cancer risk prediction in a prospectively selected high-risk case-control population enriched for BRCA mutation carriers and African American women. The model performed well in breast cancer risk prediction, and our results suggest that precancerous changes may represent an important factor driving model performance. With a larger prospective cohort, the model could be calibrated to the diverse patient population of the University of Chicago Medicine to provide absolute 1–5-year risk estimates based on the incident cancer cases seen at examinations.
Acknowledgments
Acknowledgments
We thank the Human Imaging Resource Office (HIRO) and the Clinical Research Data Warehouse (CRDW) of the University of Chicago Medicine for their help in collating relevant de-identified patient data for the study. We also thank the Center for Research Informatics (CRI) for its support with data storage and high-performance computing resources, as well as Kelly Menna, Arnaaz Khwaja, Anusha Gupta, and Naina Jolly for their help with chart reviews.
H.A. and D.H. are co–senior authors.
Supported by the University of Chicago Comprehensive Cancer Care Center Spotlight grant (6-9398-9660), Susan G. Komen for the Cure (SAC210203, TREND21675016), National Institutes of Health/National Cancer Institute (P20CA233307), and Breast Cancer Research Foundation (BCRF-21-071).
Data sharing: Data generated or analyzed during the study are available from the corresponding author by request (pending Data Use Agreement). All code used in the implementation of the models evaluated are available, by request of the authors, on https://github.com/olopade-lab/mirai_validation.
Disclosures of conflicts of interest: O.J.O. No relevant relationships. A.E.W. No relevant relationships. F.M.H. Funding from American Society of Clinical Oncology/Breast Cancer Research Foundation Young Investigator Award (2022YIA-6675470300), Department of Defense (DoD) Breakthrough Level 2 Award (BC211095P1), American Cancer Society Institutional Research Grant, National Institutes of Health (NIH)/National Cancer Institute (NCI) (K12CA139160), and Cancer Research Foundation Young Investigator Award. F.Z. No relevant relationships. T.F.Y. No relevant relationships. Y.Z. No relevant relationships. A.T.P. Funding from NIH/National Institute of Dental and Craniofacial Research (R56-DE030958), NIH/NCI (U01-CA243075), DoD Breakthrough Cancer Research program (BC211095), Horizon (2021-SC1-BHC), Stand Up to Cancer–Fanconi Anemia Research Fund–Farrah Fawcett Foundation, NCI/Department of Energy Innovative Methodologies and New Data for Predictive Oncology Model Evaluation (IMPROVE) project IAA; grants or contracts from AbbVie and Kura Oncology; honorarium from AbbVie; advisory board for Prelude, Elevar Therapeutics, Privo, and Ayala. M.L. No relevant relationships. B.S.A. No relevant relationships. K.K. No relevant relationships. G.S.K. No relevant relationships. O.I.O. Funding from the Susan & Richard Kiphart Family Foundation; leadership role with American Cancer Society and MacArthur Foundation; stock or stock options with CancerIq, Tempus, and Healthwell; receipt of equipment or services from Genentech/Roche, Cepheid, and Color Genomics. H.A. No relevant relationships. D.H. No relevant relationships.
Abbreviations:
- AUC
- area under the receiver operating characteristic curve
- BDC
- breast density classifier
- BI-RADS
- Breast Imaging Reporting and Data System
- DL
- deep learning
- HER2
- human epidermal growth factor receptor 2
- HR
- hormone receptor
- WD
- weighted density
References
- 1. Clift AK , Dodwell D , Lord S , et al . The current status of risk-stratified breast screening . Br J Cancer 2022. ; 126 ( 4 ): 533 – 550 . [DOI] [PMC free article] [PubMed] [Google Scholar]
- 2. Monticciolo DL , Newell MS , Moy L , et al . Breast cancer screening in women at higher-than-average risk: recommendations from the ACR . J Am Coll Radiol 2018. ; 15 ( 3 Pt A ): 408 – 414 . [DOI] [PubMed] [Google Scholar]
- 3. Magny SJ , Shikhman R , Keppke AL . Breast imaging reporting and data system . In: StatPearls . Treasure Island, FL: : StatPearls Publishing; , 2022. . http://www.ncbi.nlm.nih.gov/books/NBK459169/. Accessed October 24, 2022 . [PubMed] [Google Scholar]
- 4. McCormack VA , dos Santos Silva I . Breast density and parenchymal patterns as markers of breast cancer risk: a meta-analysis . Cancer Epidemiol Biomarkers Prev 2006. ; 15 ( 6 ): 1159 – 1169 . [DOI] [PubMed] [Google Scholar]
- 5. Vachon CM , van Gils CH , Sellers TA , et al . Mammographic density, breast cancer risk and risk prediction . Breast Cancer Res 2007. ; 9 ( 6 ): 217 . [DOI] [PMC free article] [PubMed] [Google Scholar]
- 6. Yala A , Mikhael PG , Strand F , et al . Toward robust mammography-based models for breast cancer risk . Sci Transl Med 2021. ; 13 ( 578 ): eaba4373 . [DOI] [PubMed] [Google Scholar]
- 7. Yala A , Lehman C , Schuster T , et al . A deep learning mammography-based model for improved breast cancer risk prediction . Radiology 2019. ; 292 ( 1 ): 60 – 66 . [DOI] [PubMed] [Google Scholar]
- 8. Shen L , Margolies LR , Rothstein JH , et al . Deep learning to improve breast cancer detection on screening mammography . Sci Rep 2019. ; 9 ( 1 ): 12495 . [DOI] [PMC free article] [PubMed] [Google Scholar]
- 9. Rodriguez-Ruiz A , Lång K , Gubern-Merida A , et al . Stand-alone artificial intelligence for breast cancer detection in mammography: comparison with 101 radiologists . J Natl Cancer Inst 2019. ; 111 ( 9 ): 916 – 922 . [DOI] [PMC free article] [PubMed] [Google Scholar]
- 10. Yala A , Schuster T , Miles R , Barzilay R , Lehman C . A deep learning model to triage screening mammograms: a simulation study . Radiology 2019. ; 293 ( 1 ): 38 – 46 . [DOI] [PubMed] [Google Scholar]
- 11. Ribli D , Horváth A , Unger Z , Pollner P , Csabai I . Detecting and classifying lesions in mammograms with deep learning . Sci Rep 2018. ; 8 ( 1 ): 4165 . [DOI] [PMC free article] [PubMed] [Google Scholar]
- 12. Wu N , Phang J , Park J , et al . Deep neural networks improve radiologists’ performance in breast cancer screening . IEEE Trans Med Imaging 2020. ; 39 ( 4 ): 1184 – 1194 . [DOI] [PMC free article] [PubMed] [Google Scholar]
- 13. Haji Maghsoudi O , Gastounioti A , Scott C , et al . Deep-LIBRA: an artificial-intelligence method for robust quantification of breast density with independent validation in breast cancer risk assessment . Med Image Anal 2021. ; 73 : 102138 . [DOI] [PMC free article] [PubMed] [Google Scholar]
- 14. Lee J , Nishikawa RM . Automated mammographic breast density estimation using a fully convolutional network . Med Phys 2018. ; 45 ( 3 ): 1178 – 1190 . [DOI] [PMC free article] [PubMed] [Google Scholar]
- 15. Yala A , Mikhael PG , Strand F , et al . Multi-institutional validation of a mammography-based breast cancer risk model . J Clin Oncol 2022. ; 40 ( 16 ): 1732 – 1740 . [DOI] [PMC free article] [PubMed] [Google Scholar]
- 16. Lehman CD , Isaacs C , Schnall MD , et al . Cancer yield of mammography, MR, and US in high-risk women: prospective multi-institution breast cancer screening study . Radiology 2007. ; 244 ( 2 ): 381 – 388 . [DOI] [PubMed] [Google Scholar]
- 17. Lehman CD , Mercaldo S , Lamb LR , et al . Deep learning vs traditional breast cancer risk models to support risk-based mammography screening . J Natl Cancer Inst 2022. ; 114 ( 10 ): 1355 – 1363 . [DOI] [PMC free article] [PubMed] [Google Scholar]
- 18. Arasu VA , Habel LA , Achacoso NS , et al . Comparison of mammography artificial intelligence algorithms for 5-year breast cancer risk prediction . medRxiv 2022.01.05.22268746 [preprint]. Posted January 7, 2022. Accessed October 1, 2022 . [DOI] [PMC free article] [PubMed] [Google Scholar]
- 19. Handelman GS , Kok HK , Chandra RV , et al . Peering into the black box of artificial intelligence: evaluation metrics of machine learning methods . AJR Am J Roentgenol 2019. ; 212 ( 1 ): 38 – 43 . [DOI] [PubMed] [Google Scholar]
- 20. Noseworthy PA , Attia ZI , Brewer LC , et al . Assessing and mitigating bias in medical artificial intelligence: the effects of race and ethnicity on a deep learning model for ECG analysis . Circ Arrhythm Electrophysiol 2020. ; 13 ( 3 ): e007988 . [DOI] [PMC free article] [PubMed] [Google Scholar]
- 21. Willemink MJ , Koszek WA , Hardell C , et al . Preparing medical imaging data for machine learning . Radiology 2020. ; 295 ( 1 ): 4 – 15 . [DOI] [PMC free article] [PubMed] [Google Scholar]
- 22. Zhao F , Copley B , Niu Q , et al . Racial disparities in survival outcomes among breast cancer patients by molecular subtypes . Breast Cancer Res Treat 2021. ; 185 ( 3 ): 841 – 849 . [DOI] [PMC free article] [PubMed] [Google Scholar]
- 23. Zhao F , Henderson TO , Cipriano TM , et al . The impact of coronavirus disease 2019 on the quality of life and treatment disruption of patients with breast cancer in a multiethnic cohort . Cancer 2021. ; 127 ( 21 ): 4072 – 4080 . [DOI] [PMC free article] [PubMed] [Google Scholar]
- 24. Kerlikowske K , Smith-Bindman R , Ljung BM , Grady D . Evaluation of abnormal mammography results and palpable breast abnormalities . Ann Intern Med 2003. ; 139 ( 4 ): 274 – 284 . [DOI] [PubMed] [Google Scholar]
- 25. Wu N , Geras KJ , Shen Y , et al . Breast density classification with deep convolutional neural networks . In: 2018 IEEE International Conference on Acoustics, Speech and Signal Processing (ICASSP) , 2018. , 6682 – 6686 . [Google Scholar]
- 26. UMAP: Uniform Manifold Approximation and Projection for Dimension Reduction — umap 0.5 documentation . https://umap-learn.readthedocs.io/en/latest/. Accessed September 27, 2022 .
- 27. DeLong ER , DeLong DM , Clarke-Pearson DL . Comparing the areas under two or more correlated receiver operating characteristic curves: a nonparametric approach . Biometrics 1988. ; 44 ( 3 ): 837 – 845 . [PubMed] [Google Scholar]
- 28. Harrell FE Jr , Califf RM , Pryor DB , et al . Evaluating the yield of medical tests . JAMA 1982. ; 247 ( 18 ): 2543 – 2546 . [PubMed] [Google Scholar]
- 29. Boyd NF , Guo H , Martin LJ , et al . Mammographic density and the risk and detection of breast cancer . N Engl J Med 2007. ; 356 ( 3 ): 227 – 236 . [DOI] [PubMed] [Google Scholar]
- 30. Kelly KM , Dean J , Comulada WS , Lee SJ . Breast cancer detection using automated whole breast ultrasound and mammography in radiographically dense breasts . Eur Radiol 2010. ; 20 ( 3 ): 734 – 742 . [DOI] [PMC free article] [PubMed] [Google Scholar]
- 31. Rafferty EA , Durand MA , Conant EF , et al . Breast cancer screening using tomosynthesis and digital mammography in dense and nondense breasts . JAMA 2016. ; 315 ( 16 ): 1784 – 1786 . [DOI] [PubMed] [Google Scholar]
- 32. Guindalini RSC , Zheng Y , Abe H , et al . Intensive surveillance with biannual dynamic contrast-enhanced magnetic resonance imaging downstages breast cancer in BRCA1 mutation carriers . Clin Cancer Res 2019. ; 25 ( 6 ): 1786 – 1794 . [DOI] [PMC free article] [PubMed] [Google Scholar]
- 33. Chai H , Brown RE . Field effect in cancer—-an update . Ann Clin Lab Sci 2009. ; 39 ( 4 ): 331 – 337 . [PubMed] [Google Scholar]
- 34. Yan PS , Venkataramu C , Ibrahim A , et al . Mapping geographic zones of cancer risk with epigenetic biomarkers in normal breast tissue . Clin Cancer Res 2006. ; 12 ( 22 ): 6626 – 6636 . [DOI] [PubMed] [Google Scholar]
- 35. Porter PL , El-Bastawissi AY , Mandelson MT , et al . Breast tumor characteristics as predictors of mammographic detection: comparison of interval- and screen-detected cancers . J Natl Cancer Inst 1999. ; 91 ( 23 ): 2020 – 2028 . [DOI] [PubMed] [Google Scholar]


