Abstract
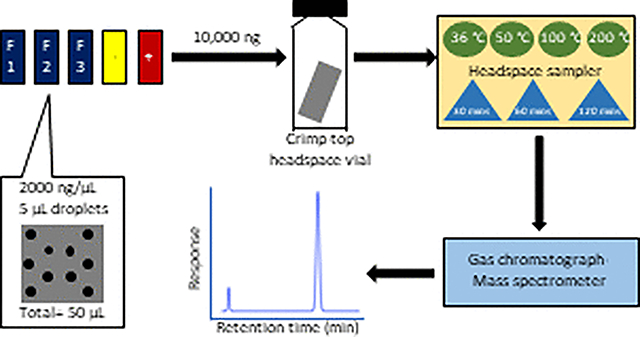
Firefighting is classified as a 2B-possibly carcinogenic profession by the International Agency for Research on Cancer (IARC). Firefighters are exposed to a host of toxic fireground contaminants such as phenols, phthalates, and polycyclic aromatic hydrocarbons (PAHs), many of which are potentially carcinogenic. Studies show that the exposure to contaminated firefighter gear postfire poses a health risk to the firefighters. This study focused on the issue of contaminants being present on the gear and developing a thermal extraction method to perform the assessment. A headspace sampler (HS) connected to a gas chromatography–mass spectrometry (GC–MS) system was used to thermally extract known fireground contaminants and understand the effect of equilibration time and temperature on the thermal extraction efficiencies. The outer shell fabric samples (PBI/Kevlar blend) were spiked with known amounts of fireground chemicals, heated at various temperatures (36, 50, 100, and 200 °C), and analyzed using the developed method to calculate extraction efficiencies. This study is one of the first to utilize the all-in-one HS–GC–MS instrument to analyze the thermal extraction of a variety of fireground contaminants relative to different temperatures from firefighter gear materials. Based on the conditions evaluated, the results indicate that the 200 °C condition allowed for the maximum thermal extraction of contaminants from the outer shell material. The data collected from this study pave a way of creating a new method for the analysis of volatile and semivolatile contaminants from field-contaminated firefighter turnout material using HS–GC–MS.
Keywords: gas chromatography, headspace sampling, phenols, phthalates, polycyclic aromatic hydrocarbons, thermal extraction, firefighter
Graphical Abstract
INTRODUCTION
Fireground Contaminants in Firefighting.
In the world of firefighting, the turnout jacket and pants are exposed to several toxic chemicals in the fire scenario, including volatile organic compounds (VOCs), semivolatile compounds, particulates, gases, and soot.1,2 It is known that the ability to extract the amount of chemicals thermally is mostly dependent on the temperature and the time that the sample is analyzed after exposure/contamination. VOCs, such as acetone, benzene, hexane, and toluene, have been shown to off-gas for about 30 min after the gear is exposed to the fire.3 VOCs are organic chemical compounds that can evaporate under normal indoor atmospheric conditions of temperature and pressure. Although the specific boiling point of most VOCs ranges between 50 and 260 °C at ambient conditions, these compounds could be available for thermal extraction at lower temperatures on increasing the vapor pressure.4 Other compounds such as phenols, phthalates, polycyclic aromatic hydrocarbons (PAHs), brominated flame retardants, and dioxins are commonly found fireground contaminants.5–7 For this study, a range of fireground contaminants was initially chosen for identification on the GC–MS system. Of the many, PAHs were specifically chosen since they are known to have carcinogenic properties (refer to Table 1). Also, they are commonly found at structural fires as they are common products of combustion for modern commercial products.8–10 The four different PAHs were chosen based on increasing aromatic ring sizes and boiling points to cover a broad spectrum of this class of compounds. Phthalates were chosen since they are universal plasticizers. As seen in Table 1, some of them are carcinogenic, while others are highly toxic. These compounds are present in almost all plastic products, which burn in many structural fires. Additionally, phenols were chosen since they were common fireground contaminants according to various literature sources.11,12 The National Fire Protection Association (NFPA) references these classes of chemicals in the “NFPA 1851:2020 Standard on Selection, Care and Maintenance of Protective Ensembles for Structural Fire Fighting and Proximity Fire Fighting”.23 The three types of compounds are varied in their physical and chemical properties and are harmful to human health. The mere presence of these compounds in the firefighting atmosphere is potentially dangerous for the health of the firefighters in multiple ways such as inhalation, dermal exposure, and ingestion.9,19,21,24,25 These compounds had sufficiently different retention times for separation in the initial screening using a liquid injection GC–MS method. Hence, based on the compatibility to the developed method, available literature, broad spectrum of consideration, and hazard levels, these compounds were selected for analysis.
Table 1.
Master Mix Compounds and Their Properties Relevant to HS Analysis15
| compounds | boiling point (°C) | volatility | vapor pressure at 25 °C (mmHg) | IARCa classification |
|---|---|---|---|---|
| phenol | 182 | volatile | 3.50 × 10−01 | Group 3 |
| 2,4,6-trichlorophenol (2,4,6-TCP) | 246 | volatile | 8.00 × 10−03 | Group 2B |
| pentachlorophenol (PCP) | 310 | semivolatile | 1.10 × 10−04 | Group 2B |
| dibutyl phthalate (DBP) | 340 | semivolatile | 2.00 × 10−05 | Group 3 |
| benzyl butyl phthalate (BBP) | 370 | semivolatile | 8.25 × 10−06 | Group 3 |
| di-ethylhexyl phthalate (DEHP) | 384 | semivolatile | 1.42 × 10−07 | Group 2B |
| naphthalene (NA) | 218 | volatile | 8.50 × 10−02 | Group 2B |
| phenanthrene (PA) | 340 | semivolatile | 1.21 × 10−04 | Group 3 |
| pyrene (PY) | 404 | semivolatile | 4.50 × 10−06 | Group 3 |
| benzo[a] pyrene (BaP) | 495 | semivolatile | 5.49 × 10−09 | Group 1 |
The International Agency for Research on Cancer (IARC) classifies substances to show whether they are suspected to cause cancer or not. It places the substances into four categories depending on the strength of evidence for their carcinogenicity. The categories are as follows: Group 1, carcinogenic to humans; Group 2A, probably carcinogenic to humans; Group 2B, possibly carcinogenic to humans; and Group 3, not classifiable as to its carcinogenicity to humans.16–18
Importance of Thermal Extraction.
Thermal extraction utilizes heat to extract analytes from a substrate, translating to the evolution of chemicals from a solid/liquid analyte into a vapor phase. The sample, upon heating, reaches a liquid–vapor equilibrium after a specific time, which is the maximum amount that would be released in the specific conditions of the test environment. Thermal extraction is particularly useful in removing VOCs from fabrics. Currently, no research utilizes the headspace sampler to extract contaminants from firefighters’ gear thermally. However, it is essential to know the rate at which various fireground contaminants are released from the fabrics, which could potentially be hazardous to the firefighters’ health in certain conditions. A headspace sampler (HS) is an instrument that can perform thermal extraction in solid or liquid matrices. The solid/liquid samples are placed in HS crimp-top glass vials and heated at a set temperature for a fixed amount of time (as seen in Figure 1).
Figure 1.
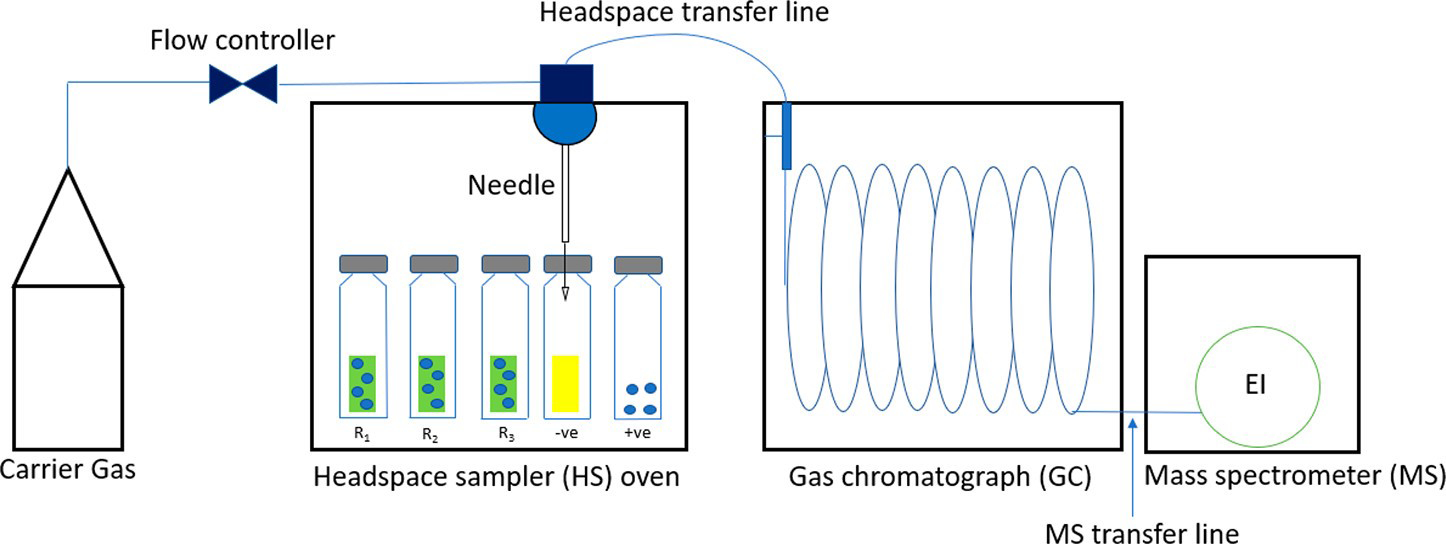
Schematic of the headspace sampler–GC–MS setup.
The instrument is built so that the vial can be equilibrated and shaken in the oven precisely. The best feature of this add-on is that it can be directly attached to a gas chromatograph (GC) inlet via a heated transfer line. After a sample is heated, the gases evolving from the sample are collected in the headspace area between the sample and the vial cap. A needle precisely pierces through the sealed cap and transfers the gas to the transfer line through a heated loop. The heated transfer line then carries the gas into the GC inlet with minimal sample loss. One of the significant advantages of using the HS is that there is very little sample preparation required. Any solid or liquid sample can be placed inside the glass vial and can be heated in the oven for analysis. Simulating the extraction using heat and measuring the output gases through any other method such as polymer sorption–liquid extraction or active/passive air sampling requires an elaborate setup and complex sample preparation. At all temperatures used for this study, the time the sample was allowed to equilibrate in the headspace oven was a factor deciding the amount released from the materials because there is a solid–gas equilibrium that is formed inside the heated vial. This equilibrium involves the partitioning of the contaminants between the fabric and the gases accumulated in the headspace region. Since this is a closed system, the maximum amount that can be thermally extracted is also dependent on the volume in the vial and the saturation point in the air at those temperature and pressure conditions. This equilibrium is when no further liquid would transfer to the vapor phase. To obtain the best-suited temperature and time conditions, several trials were conducted. This study assesses the viability of the HS explicitly to measure the thermal extraction of compounds at various temperatures from the outer shell material. The study focuses on developing a robust method having the capability to perform thermal extraction on firefighter turnout gear materials. The study could be extrapolated to include other elements of personal protective equipment such as gloves, hoods, or boots.
Currently, several other methods aid in the understanding of contamination from firefighter gear. However, they can be complicated, time-consuming, and expensive to run. Easter et al. developed a method to assess soil deposits on contaminated firefighter gear by using microwave-assisted extraction in a 1:1 mixture of methylene chloride and acetone, followed by separate GC–MS analyses for PAHs, phthalates, and other compounds.13 Alexander used wipe samples from different areas of the turnout gear and performed liquid extraction on the samples followed by a GC–MS analysis using the EPA 8270D method to analyze PAHs and phthalates.14 The headspace–GC–MS method developed does not require a solvent and is a simple one-step process from sample preparation to analysis.
Scope of the Research.
This research investigates the thermal extraction of selected fireground contaminants from outer shell fabrics. The study looks at parameters such as the effect of equilibration time and temperature. The research is a first-of-its-kind using a headspace sampler to understand the thermal extraction of contaminants from firefighter gear material. The purpose of this study is to assess the viability of the headspace–GC system as a screening tool to perform the thermal extraction of fireground contaminants from turnout materials. The goal is also to develop a simple yet robust method that is capable of analyzing the thermal extraction of selected fireground contaminants. The following are the questions addressed through this research:
Is the headspace sampler a useful tool to analyze the thermal extraction of the fireground contaminants from the outer shell material in a simple, one-step process?
What is the effect of temperature on the thermal extraction efficiencies for the selected fireground contaminants?
What is the ideal equilibration time to carry out the thermal extraction of contaminants from the outer shell material?
Does the headspace sampler generate valuable data to further the study to mimic actual conditions in the fire service?
MATERIALS AND METHODS
Materials.
A custom calibration standard solution containing three phenols, three phthalates, and four polycyclic aromatic hydrocarbons (PAHs) (Table 1, structures are shown in the Supporting Information) was purchased from Agilent Technologies. This solution will be referred to as the master mix. The concentration of each of the compounds in the master mix was 2000 ng/μL (methylene chloride as a solvent), and the solution was stored in the refrigerator (4 °C) in 2 mL amber ampules. The compounds in the master mix were chosen based on their prevalence in structural fires and toxicity profiles.8 For calibration standards, n-hexane (gas chromatography grade, 99.9+%, ACROS Chemicals) was used.
Methods.
Calibration Method Development on the Headspace–GC. Calibration Solution Preparation for Headspace Sampling.
A 50 ng/μL master mix stock solution was prepared by pipetting 250 μL of the 2000 ng/μL master mix into a 10 mL volumetric flask and diluting with n-hexane. Further, a total of nine calibration solutions from 50 to 10 000 ng (as per mass-in vial) were prepared using two solutions: 50 ng/μL stock solution was used to prepare the 50, 100, 200, 500, and 1000 ng samples by pipetting 1, 2, 4, 10, and 20 μL, respectively, into HS crimp-top vials. 2000 ng/μL stock solution was used to prepare the 2000, 4000, 8000, and 10 000 ng samples by pipetting 1, 2, 4, and 5 μL, respectively into HS crimp-top vials. Each liquid calibration solution was spiked in a 20 mL crimp-top glass vial.
GC–MS Analysis Method.
The analysis of phenols, phthalates, and PAHs was carried out using an Agilent 7890B gas chromatographic system coupled to an Agilent 5977B mass spectrometer equipped with electron ionization (EI). Chromatographic analysis was conducted in the split mode with a split ratio of 10:1. The column used in the GC was an Agilent EPA 8270D, fused silica capillary column (30 m × 0.25 mm × 0.25 μm). An Agilent 5190–3136 UI splitless single taper with glass wool liner was used in the inlet for injection. The injection volume was 1 μL, and the injection temperature was kept at 250 °C with a helium flow rate of 1.2 mL/min. The oven gradient was set to begin at 40 °C, increased to 280 °C for 1 min at a rate of 10 °C/min, and further increased to 300 °C at 5 °C/min for 1 min. The total run time was 30 min. The MS transfer line was kept at 280 °C throughout the run. The MS quadrupole temperature was maintained at 230 °C, and the ion source temperature was kept at 150 °C. The gain factor used was 1.00. The analysis was conducted in scan mode (35–550 amu) using electron ionization (EI) with an energy of 70 eV. A calibration curve of peak area versus mass-in vial (ng) was plotted for all the compounds.
Thermal Extraction Method Development on the Headspace–GC.
The 7697A Agilent Technologies headspace sampler connected to a 7890B GC and 5977B MS instrument was used to extract the contaminants from the fabric samples thermally. Three replicates of 1 cm × 1 cm outer shell fabric materials were spiked with 10 000 ng (mass-on fabric) of each of the compounds in the master mix by evenly spreading five drops of 1 μL having a concentration of 2000 ng/μL. The drops were allowed to soak into the fabrics for 1 h and were then transferred into crimp-top headspace vials for analysis. An unused reference outer shell fabric was chosen as the negative control to obtain the baseline signal. A positive control was used, for which 5 μL of the master mix was directly spiked into the headspace vial. The positive control is crucial in understanding the maximum mass that could be extracted through the headspace method. This is because 10 000 ng of pure liquid chemical directly spiked inside a headspace vial and analyzed produces variable mass values, depending on the specific method parameters. To account for variability in calculating the extraction efficiencies of spiked fabric samples, the value of the positive control sample is considered as the maximum mass the instrument can detect (without any interferences from the fabric matrix). The positive control sample is also essential in calculating the percent extraction efficiencies for all the compounds. All the extraction efficiencies calculated in this study are relative extraction efficiencies based on the mass of the positive control sample. The value of the percent extraction efficiency cannot be directly compared to the mass initially added on the fabric, without knowing the mass of the positive control detected. The spiked fabrics and both the control samples were placed in 20 mL crimp-top glass vials. The GC–MS method developed earlier was used for the headspace–GC analysis. A set of different temperatures and times was used to understand the temperature and time profiles. Table 2 shows the various conditions that were tested.
Table 2.
Conditions Used for HS-GC-MS Method Development
| temperature (°C) | time (min) |
|---|---|
| 36 °C | 30 |
| 50 °C | 30 |
| 100 °C | 30, 60, 120 |
| 200 °C | 30 |
The physical limit of the headspace sampler oven is 260 °C. Initial trials at 260 °C showed that the crimp-top caps were separated from the vial, possibly because of excessive pressure being built up in the vial due to the expansion of moisture in the fabrics. Hence, the maximum temperature used for all headspace analysis was limited to 200 °C for the smooth functioning of the instrument.
Figure 1 shows a schematic of the headspace–GC–MS setup. The figure also depicts the various types of samples and controls that were used. The R1, R2, and R3 are replicates of the 1 cm × 1 cm outer shell fabrics spiked with a known amount of the master mix. The −ve (negative control) sample is a reference unused outer shell fabric measuring 1 cm × 1 cm. The +ve sample is the pure master mix liquid directly spiked inside the vial. The vials are made of borosilicate glass and crimp-top to avoid loss of analytes.
Calculation of the Extraction Efficiencies.
The peak areas for the compounds were obtained from the chromatograms. This area was entered into the calibration curve equation to obtain the resulting mass. The same was repeated for the fabric and control samples. The mass of individual fabric samples was divided by the mass of the positive control sample to obtain the percent extraction efficiency. Equation 1 shows the formula to obtain the mass of compound in individual vials:
| (1) |
For noting the extraction values, consider the following Table 3.
Table 3.
Calculation of Percent Extraction Efficiency for Spiked Fabric Samples
| sample | peak area | effective mass (ng); (substitute in y = mx + b calibration curve equation) | original mass (ng); (the mass of master mix used in spiking) | relative % extraction efficiency; (relative to the positive control) |
|---|---|---|---|---|
| fabric 1 | F1a | [F1a — b]/m = F1c | 10 000 | (F1c/Kc) X 100 |
| fabric 2 | F2a | [F2a — b]/m = F2c | 10 000 | (F2c/Kc) X 100 |
| fabric 3 | F3a | [F3a — b]/m = F3c | 10 000 | (F3c/Kc) X 100 |
| negative control | O | [O — b]/m = Oc | 0 | (Oc/Kc) X 100 |
| positive control | K | [K — b]/m = Kc | 10 000 | 100 |
There were compounds detected from the unused blank outer shell fabric, some of which eluted at the same or similar retention times of the master mix compounds. These nontarget compounds had constant values, regardless of the temperatures used. These compounds, forming the negative control signal, were marked as . The negative control was subtracted from the sample areas , and the effective masses were calculated, as seen in Table 3. The masses obtained from the fabric samples were divided by the masses of the positive control sample to obtain percent extraction efficiencies. These relative extraction efficiencies are based on positive control samples and cannot be directly compared to the original mass () that was spiked on the fabric because only a part of the mass in the vial actually vaporized (as per the boiling point and vapor pressure of each compound) and was further transferred to the GC for analysis.
Calculation of Error Bars for All the Graphs Plotted.
Error bars were plotted as standard error with 95% confidence, which is calculated using the formula shown in eq 2:
| (2) |
where = z-score for 95% CI, = standard deviation of samples, and = number of samples in consideration
The standard error, when added and subtracted from the sample mean, would give the upper bound and lower bound for the confidence interval, as shown in eq 3:
| (3) |
RESULTS AND DISCUSSION
Effect of Equilibration Time on Thermal Extraction.
Equilibration time is an important factor that governs the amount of a compound partitioning into the vapor phase. The solid/liquid matrix in the headspace vial must be allowed to equilibrate for sufficient time so that a complete sample–vapor equilibrium can be reached. Effective transfer into the vapor phase is possible only when an equilibrium is reached inside the vial. Even though the temperature of exposure might be lower than the boiling point of the compound to be extracted, if the compound is left inside the vial for enough time, a certain fraction of thermal extraction is possible. An optimal equilibration time must be calculated based on the extraction efficiencies obtained for the compounds. There may be a possibility that having an equilibration time much greater than the optimal time could lead to the redeposition of the vapor phase into the fabric sample/surfaces inside the vial. The current section assesses the effect of equilibration time on the thermal extraction of phenols, phthalates, and PAHs spiked onto outer shell fabrics. Table 4 shows the average of the actual masses of compounds detected using the headspace–GC at 100 °C for 30, 60, and 120 min.
Table 4.
Masses of Compounds Detected Using Headspace-GC at 100 °C for 30, 60, and 120 min of Equilibration Time
| compound | 30 min | 60 min | 120 min |
|---|---|---|---|
| phenol | 979 ng ± 42 ng | 1350 ng ± 88 ng | 1093 ng ± 124 ng |
| 2,4,6-TCP | 2150 ng ± 91 ng | 2333 ng ± 46 ng | 2371 ng ± 282 ng |
| DBP | 118 ng ± 115 ng | 313 ng ± 37 ng | 240 ng ± 235 ng |
| NA | 7506 ng ± 273 ng | 7817 ng ± 686 ng | 7658 ng ± 495 ng |
| PA | 1358 ng ± 84 ng | 1568 ng ± 55 ng | 1773 ng ± 248 ng |
| PY | 360 ng ± 82 ng | 236 ng ± 5 ng | 317 ng ± 40 ng |
Extraction Efficiencies for Phenols.
Firstly, of the three phenolic compounds present in the master mix that was spiked onto the outer shell fabrics, only two compounds were detected at the 100 °C condition, as seen in Figure 2. The temperature that the fabrics were exposed to was below the boiling point for all the compounds. Phenol provided a low extraction efficiency of about 10% since there were issues with the detection of the compound, which was persistent even after several troubleshooting techniques. 2,4,6-TCP was detected but had a low efficiency of around 24%, since it has a boiling point of 246 °C, which is significantly above the temperature of exposure (100 °C). PCP was absent since it has a boiling point of 310 °C, and an exposure of 100 °C provided insufficient energy for the transfer of the compound into the vapor phase. The overall trend for phenolic compounds shows that the equilibrium is formed in 30 min of heating, and any further equilibration time would be insignificant.
Figure 2.
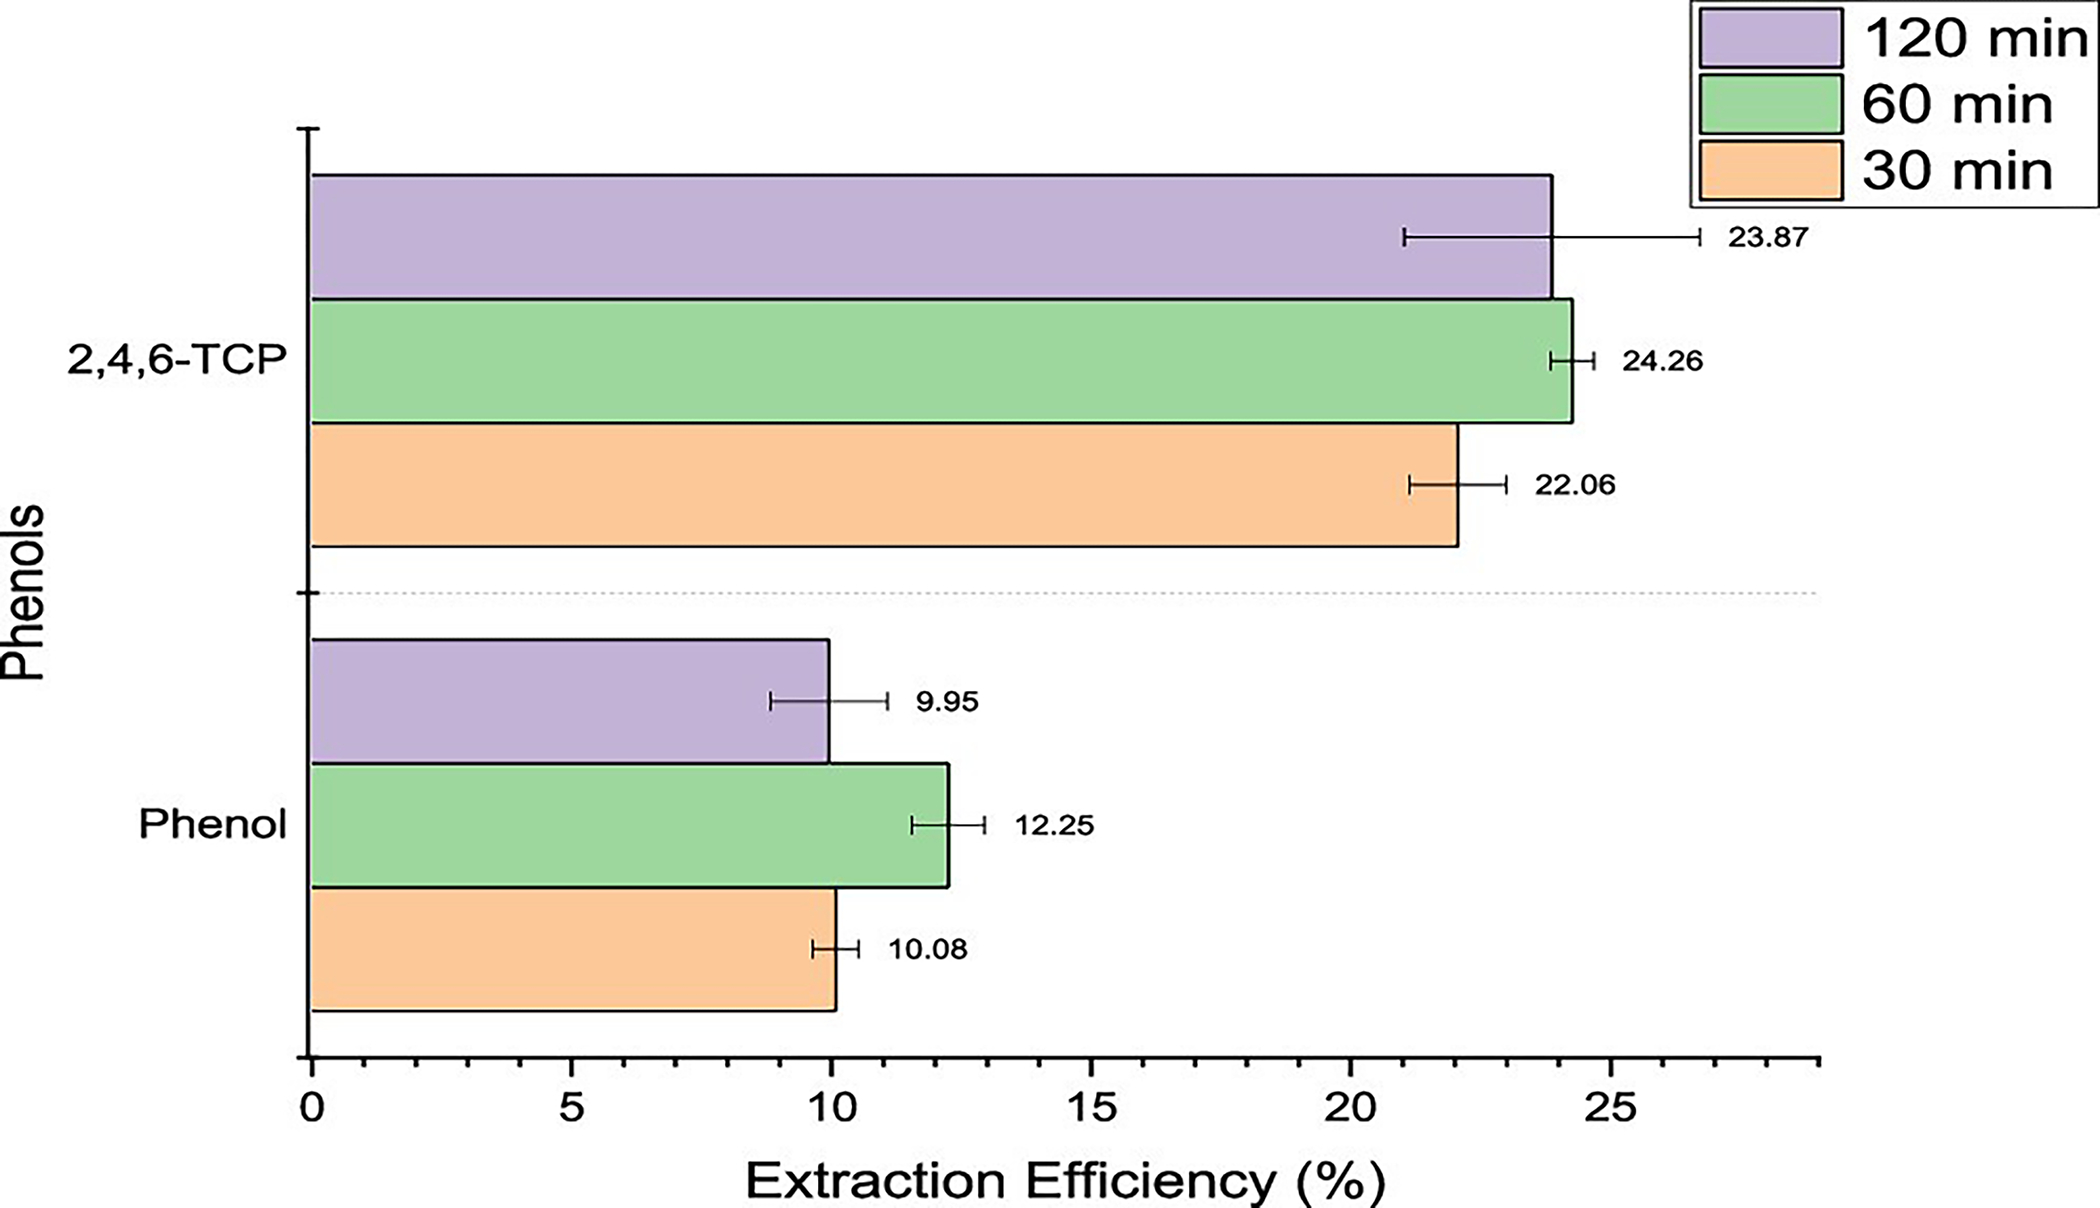
Extraction efficiencies for phenols using headspace–GC at 100 °C for 30, 60, and 120 min.
Extraction Efficiencies for Phthalates.
Of the three phthalates present in the master mix spiked onto the outer shell fabrics, only DBP was detected, as seen in Figure 3. With the boiling points of all the compounds over 300 °C, the exposure of the fabrics to only 100 °C proved insufficient to extract the compounds thermally. DBP was detected at a very low efficiency of 1% with a large standard error of almost 1%, which states that the compound could be absent in some of the fabric replicates that were run. Even though the extraction efficiencies for DBP were low, increasing the equilibration time from 30 to 60 min produced nearly a 3-fold increase in the extraction efficiency, but this was reduced when further increased to 120 min.
Figure 3.
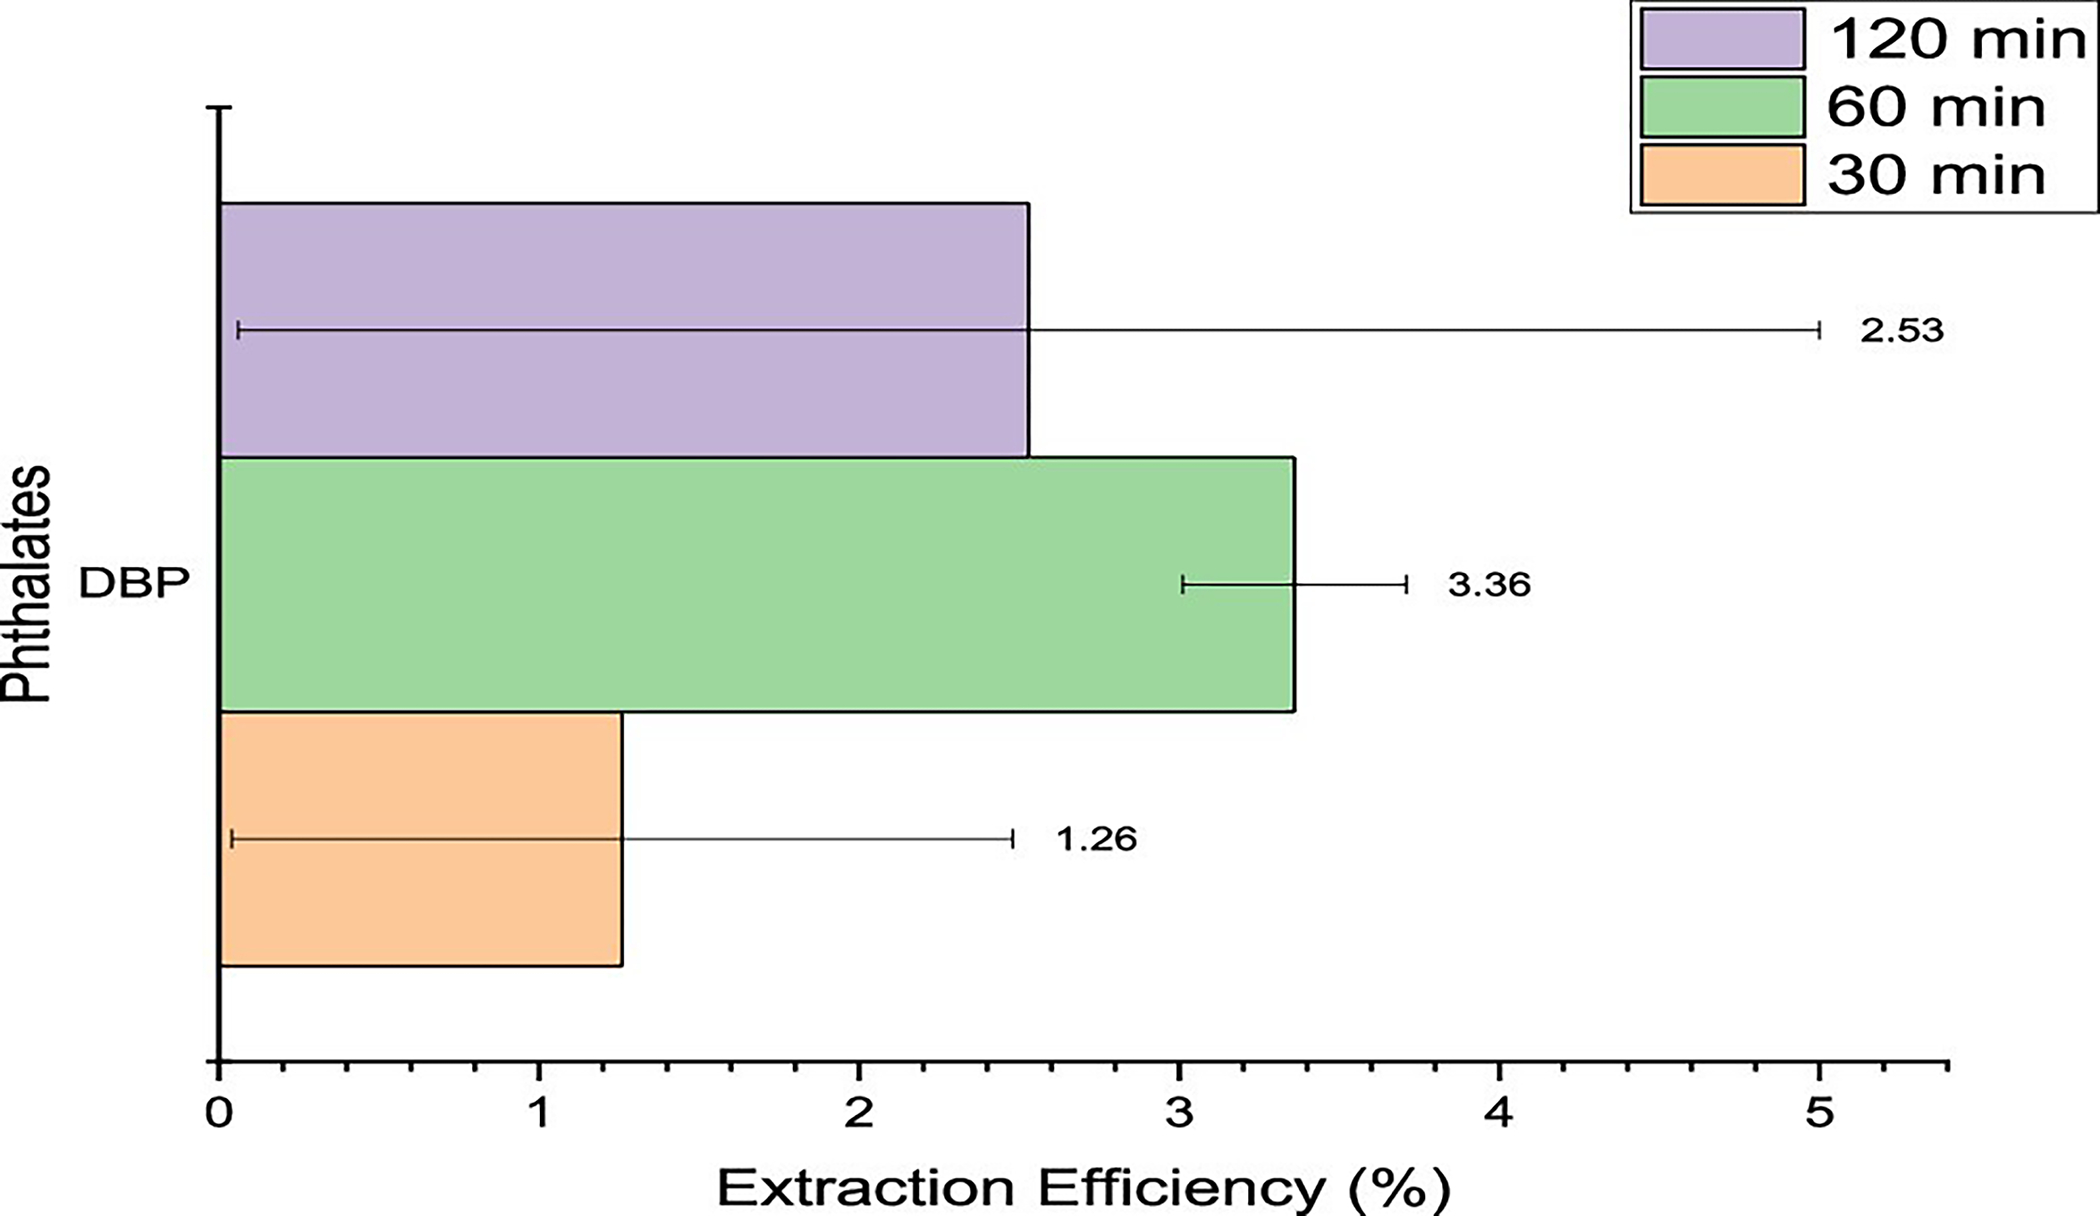
Extraction efficiencies for phthalates using headspace–GC at 100 °C for 30, 60, and 120 min.
Extraction Efficiencies for PAHs.
Three out of the four PAHs present in the master mix that was spiked on the outer shell material were detected, as seen in Figure 4. Pyrene, phenanthrene, and benzo[a] pyrene being semivolatile compounds, having boiling points over 300 °C, were not sufficiently thermally extracted at a lower condition of 100 °C. Naphthalene had a relatively higher extraction efficiency between 72% and 78%, which was interesting to note since the temperature of 100 °C used for analysis was below its boiling point of 182 °C. However, naphthalene is highly volatile and is known to sublime at as low as 50 °C.20 Hence, at a temperature of 100 °C, the vapor pressure of naphthalene was sufficient to extract significant amounts from the fabric. Overall, it was seen from Figure 4 that an equilibration time of 30 min was sufficient to cause maximum extraction at the 100 °C temperature condition.
Figure 4.
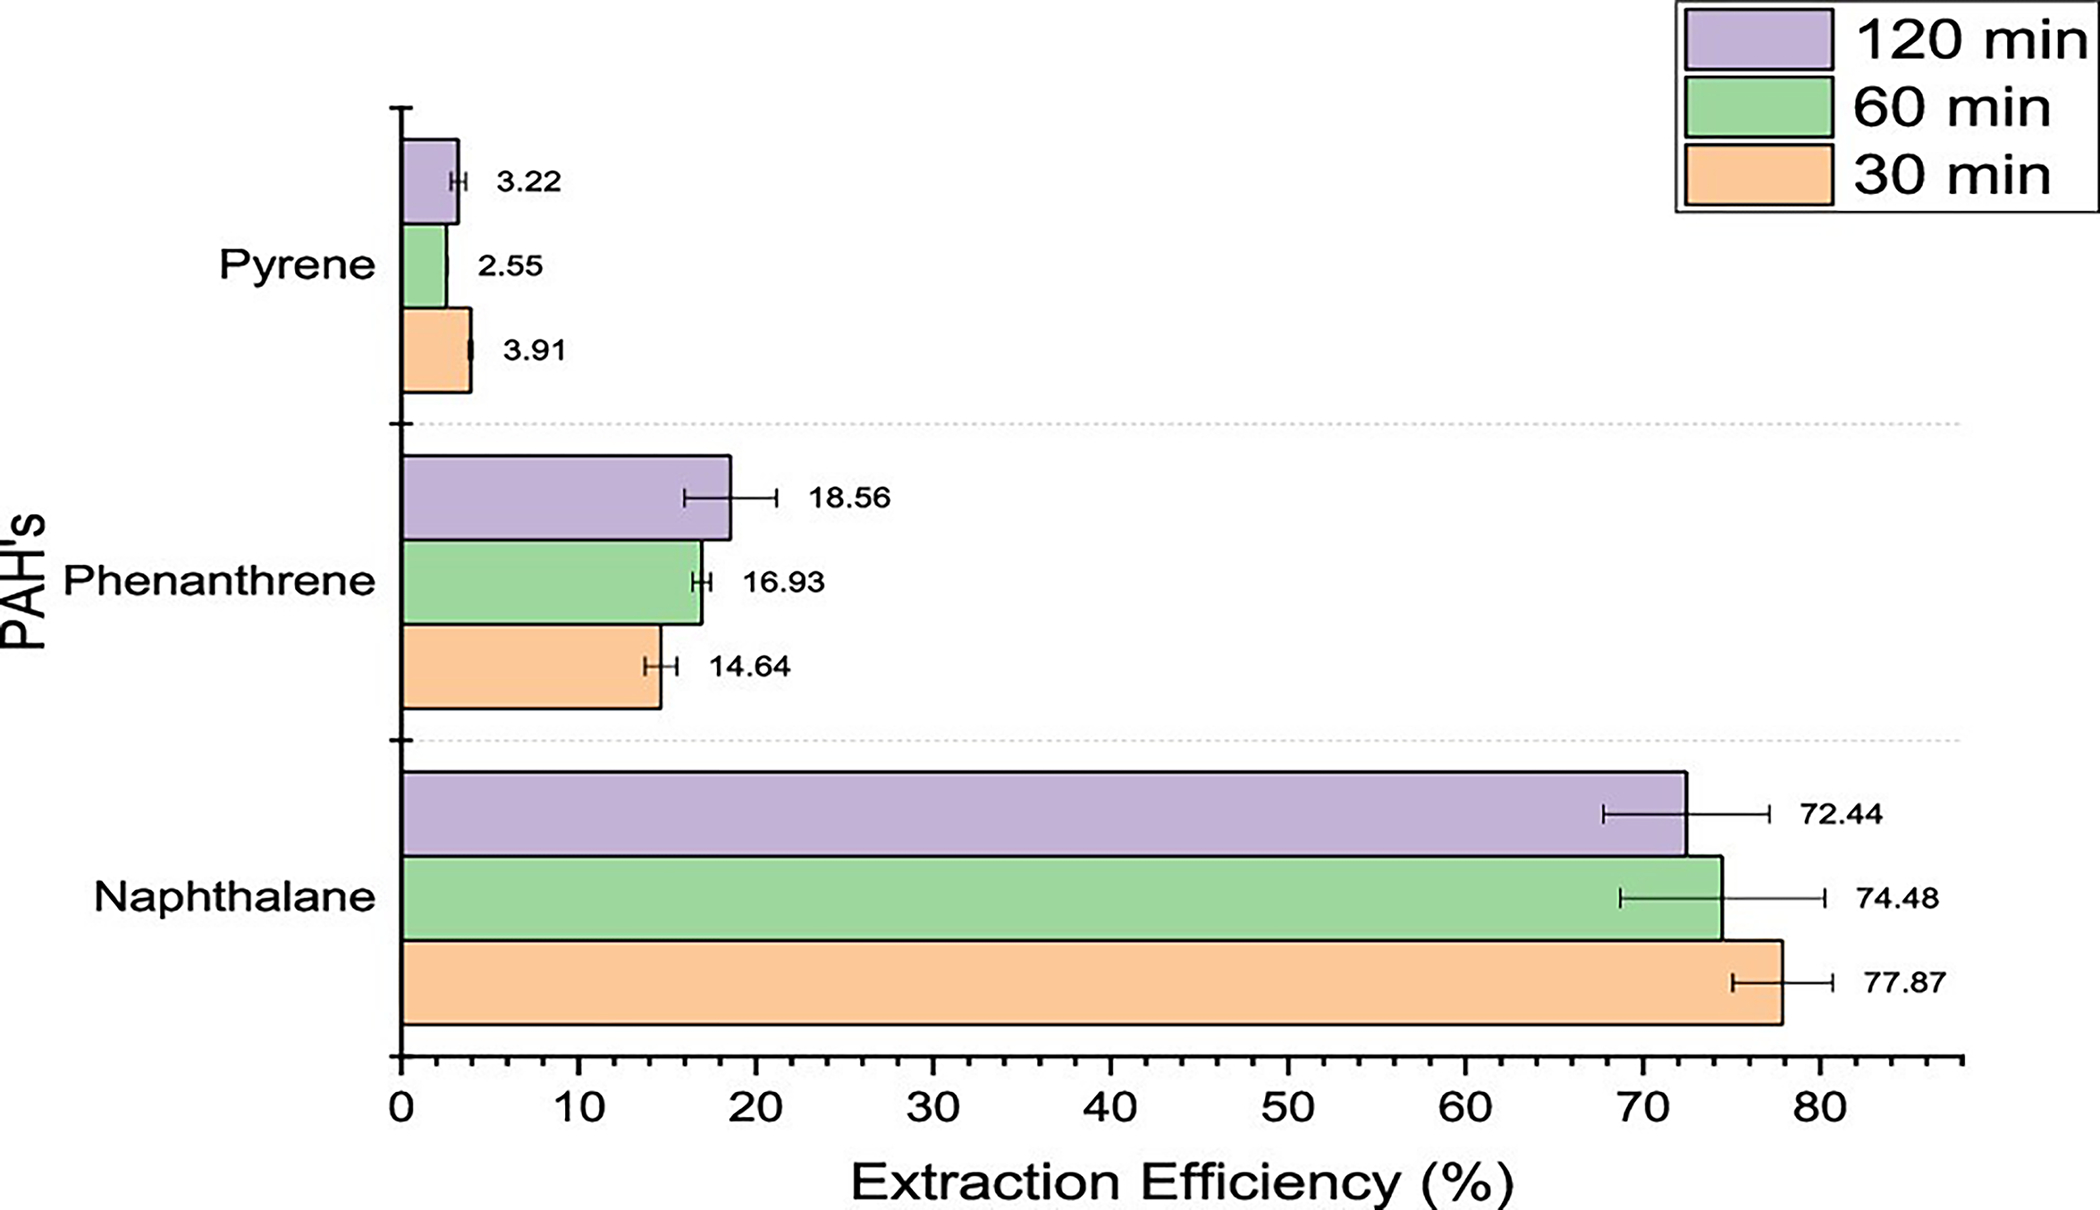
Extraction efficiencies for PAHs using headspace–GC at 100 °C for 30, 60, and 120 min.
Best-Suited Equilibration Time for Thermal Extraction.
After analyzing data from Table 4, it was decided that the equilibration time of 30 min was most efficient for the thermal extraction of the fireground contaminants from outer shell fabrics in the headspace sampler vials, best suited to the combination of the time and the temperature tested. The chosen condition works best for the majority of the compounds. The thermal extraction levels conducted in this study pertain to the specific HS vials (having a specific volume) that were used for the analysis. The headspace sampler equilibration time combined with the GC–MS analysis run time equates to a 1 h method for analyzing a single sample. Compared to other methods of analyzing thermal extraction, the method developed through this research proves to be less time-consuming. The samples to be used for headspace–GC analysis do not need sample preparation, and multiple samples can be analyzed continuously, further reducing the time spent.
Effect of Equilibration Temperature on Extraction Efficiency.
It is known that the vapor pressure of most compounds, except water, increases as the temperature is increased. Compounds having a higher vapor pressure at a given temperature will volatilize rapidly as compared to compounds with lower vapor pressure. The data shown in this section outline the effect of the temperature on the amount of thermal extraction of fireground contaminants from spiked outer shell materials. Table 5 summarizes the thermal extraction efficiencies for all the compounds in the master mix at various temperatures tested. The equilibration time was constant at 30 min, as concluded to be sufficient from the previous section.
Table 5.
Extraction Efficiencies for All Compounds at Various Temperatures
| compound | boiling point (°C) | extraction efficiencies (%) |
|||
|---|---|---|---|---|---|
| 36 °C | 50 °C | 100 °C | 200 °C | ||
| phenol | 182 | 1.25 ± 0.32 | 1.93 ± 0.11 | 10.08 ± 0.43 | 62.43 ± 2.37 |
| 2,4,6-TCP | 246 | 4.52 ± 0.17 | 22.06 ± 0.92 | 106.20 ± 1.95 | |
| PCP | 310 | 86.76 ± 3.02 | |||
| DBP | 340 | 2.53 ± 2.46 | 91.49 ± 1.15 | ||
| BBP | 370 | 69.79 ± 0.21 | |||
| DEHP | 384 | 66.14 ± 0.71 | |||
| NA | 218 | 15.67 ± 2.18 | 34.97 ± 2.90 | 74.48 ± 6.53 | 102.26 ± 1.67 |
| PA | 340 | 14.64 ± 0.90 | 84.20 ± 2.96 | ||
| PY | 404 | 3.91 ± 0.10 | 63.33 ± 2.90 | ||
| BaP | 495 | 23.44 ± 0.37 | |||
For a firefighter gear application, it is crucial to understand the types and amounts of compounds at various exposures of heat. To test the effect of temperature, a mass of of the master mix was spiked onto the outer shell materials for headspace–GC analysis. Table 6 shows the masses of compounds thermally extracted at the various temperatures.
Table 6.
Thermal Extraction Masses of Compounds at Various Temperatures
| compound | 36 °C | 50 °C | 100 °C | 200 °C |
|---|---|---|---|---|
| phenol | 114 ± 31 ng | 186 ± 12 ng | 979 ± 42 ng | 6126 ± 234 ng |
| 2,4,6-TCP | 0 | 416 ± 15 ng | 2150 ± 91 ng | 10553 ± 195 ng |
| PCP | 0 | 0 | 0 | 9228 ± 322 ng |
| DBP | 0 | 0 | 118 ± 115 ng | 8782 ± 111 ng |
| BBP | 0 | 0 | 0 | 7052 ± 22 ng |
| DEHP | 0 | 0 | 0 | 6688 ± 64 ng |
| NA | 1446 ± 201 ng | 3336 ± 283 ng | 7506 ± 273 ng | 9719 ± 141 ng |
| PA | 0 | 0 | 1358 ± 84 ng | 8190 ± 288 ng |
| PY | 0 | 0 | 383 ± 82 ng | 6234 ± 286 ng |
| BaP | 0 | 0 | 0 | 2453 ± 39 ng |
The chromatogram shown in Figure 5 shows an overlay of individual chromatograms of compounds extracted from outer shell fabrics at various temperatures. The height of the peak represents the masses of compounds extracted from the outer shell fabrics at respective temperatures. The chromatogram (Figure 5) provides a general visual representation of the masses obtained, as shown in Table 6. While all compounds were detected at 200 °C, only six were detected at 100 °C; three were detected at 50 °C and two at 36 °C.
Figure 5.
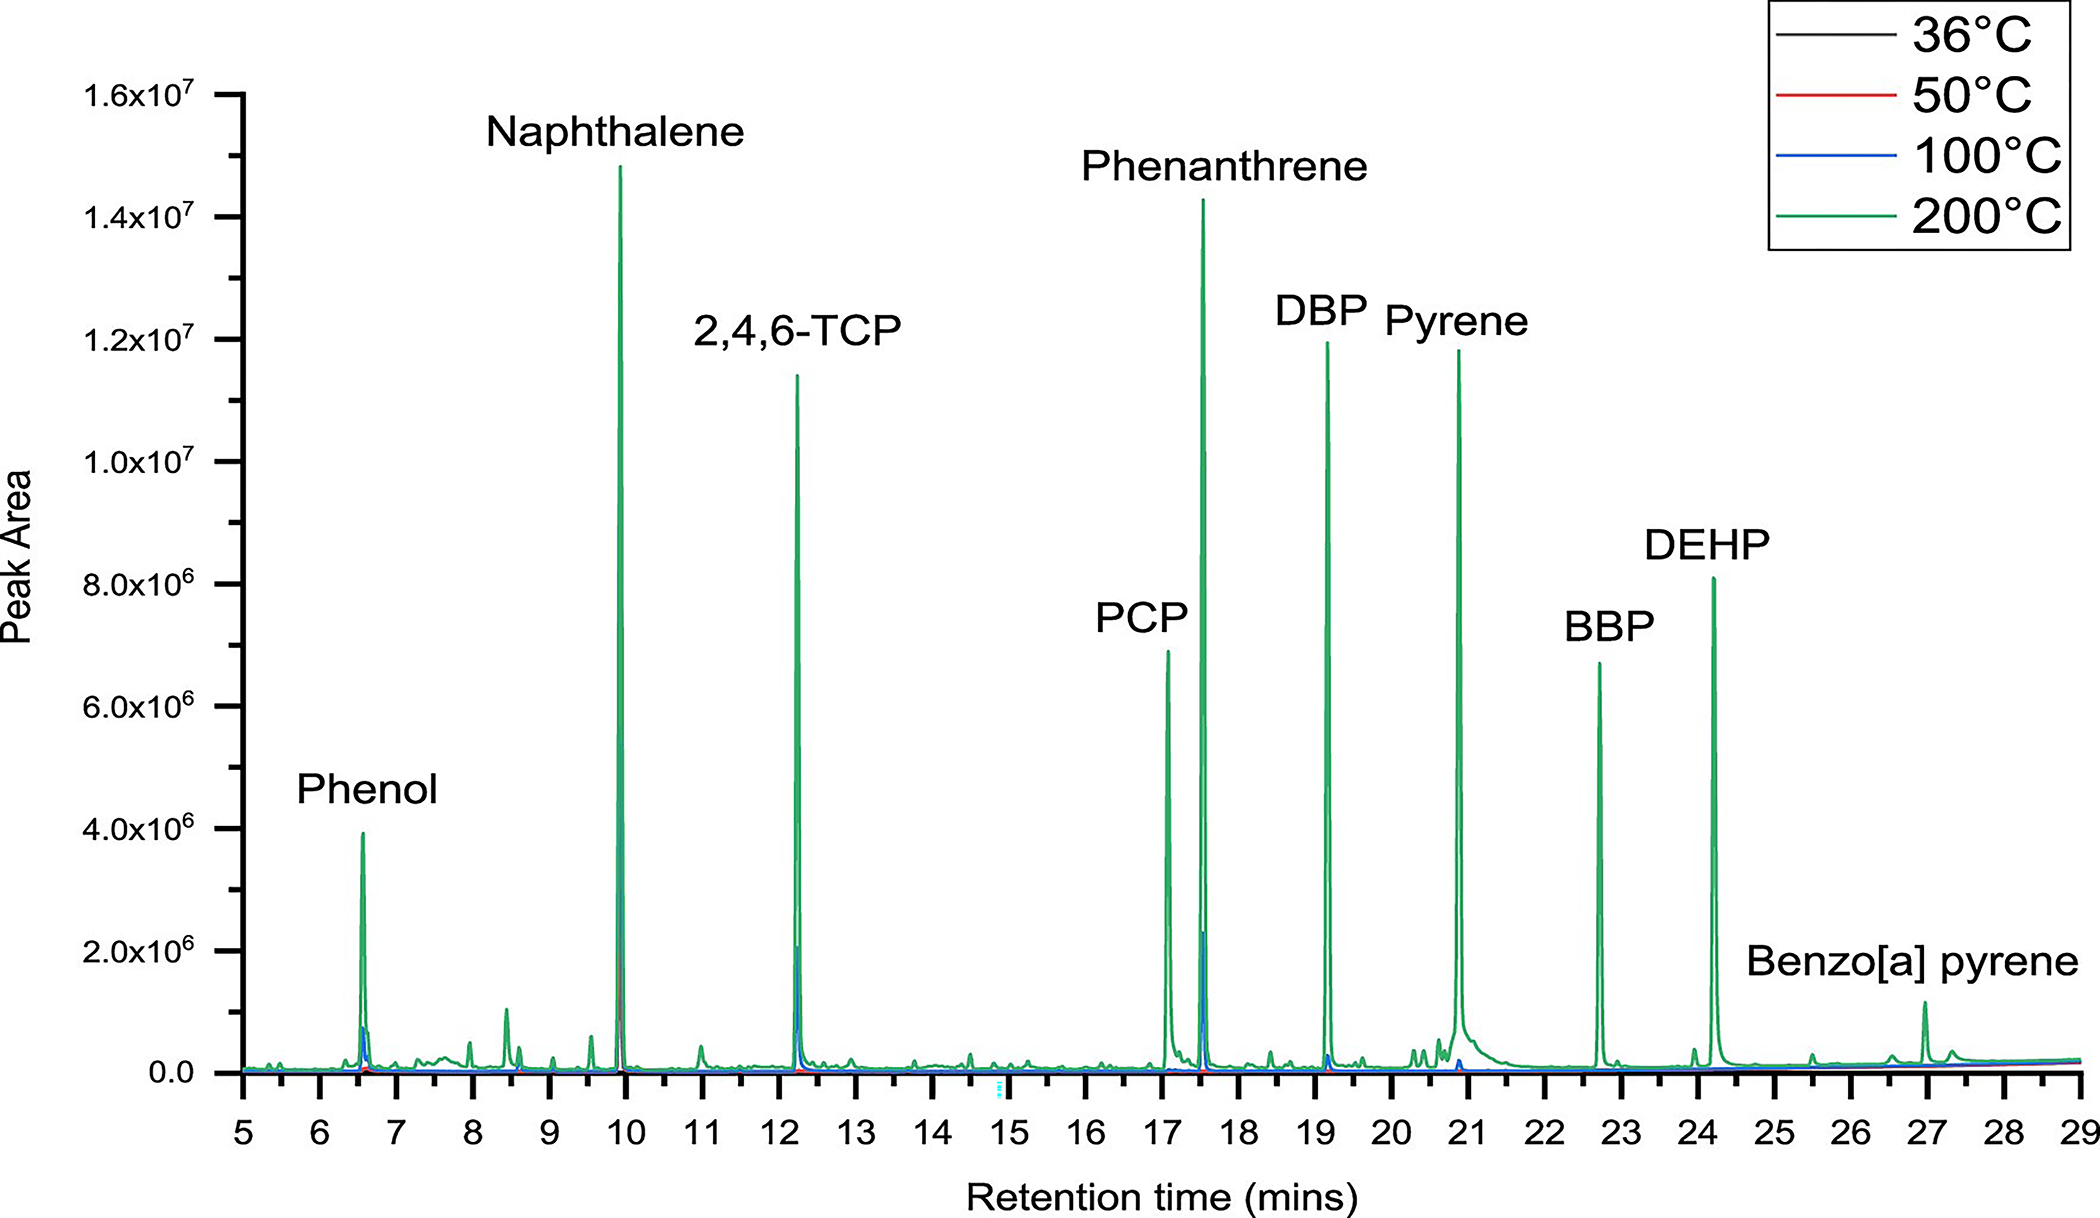
Effect of temperature on extraction of compounds from outer shell fabrics.
A proper comparison of the amounts at various temperatures is not clearly visible in Figure 5. Hence, Figure 6 shows the representative comparison for naphthalene in a magnified version. It can be seen from the peak heights that higher amounts of naphthalene are detected at higher temperatures.
Figure 6.
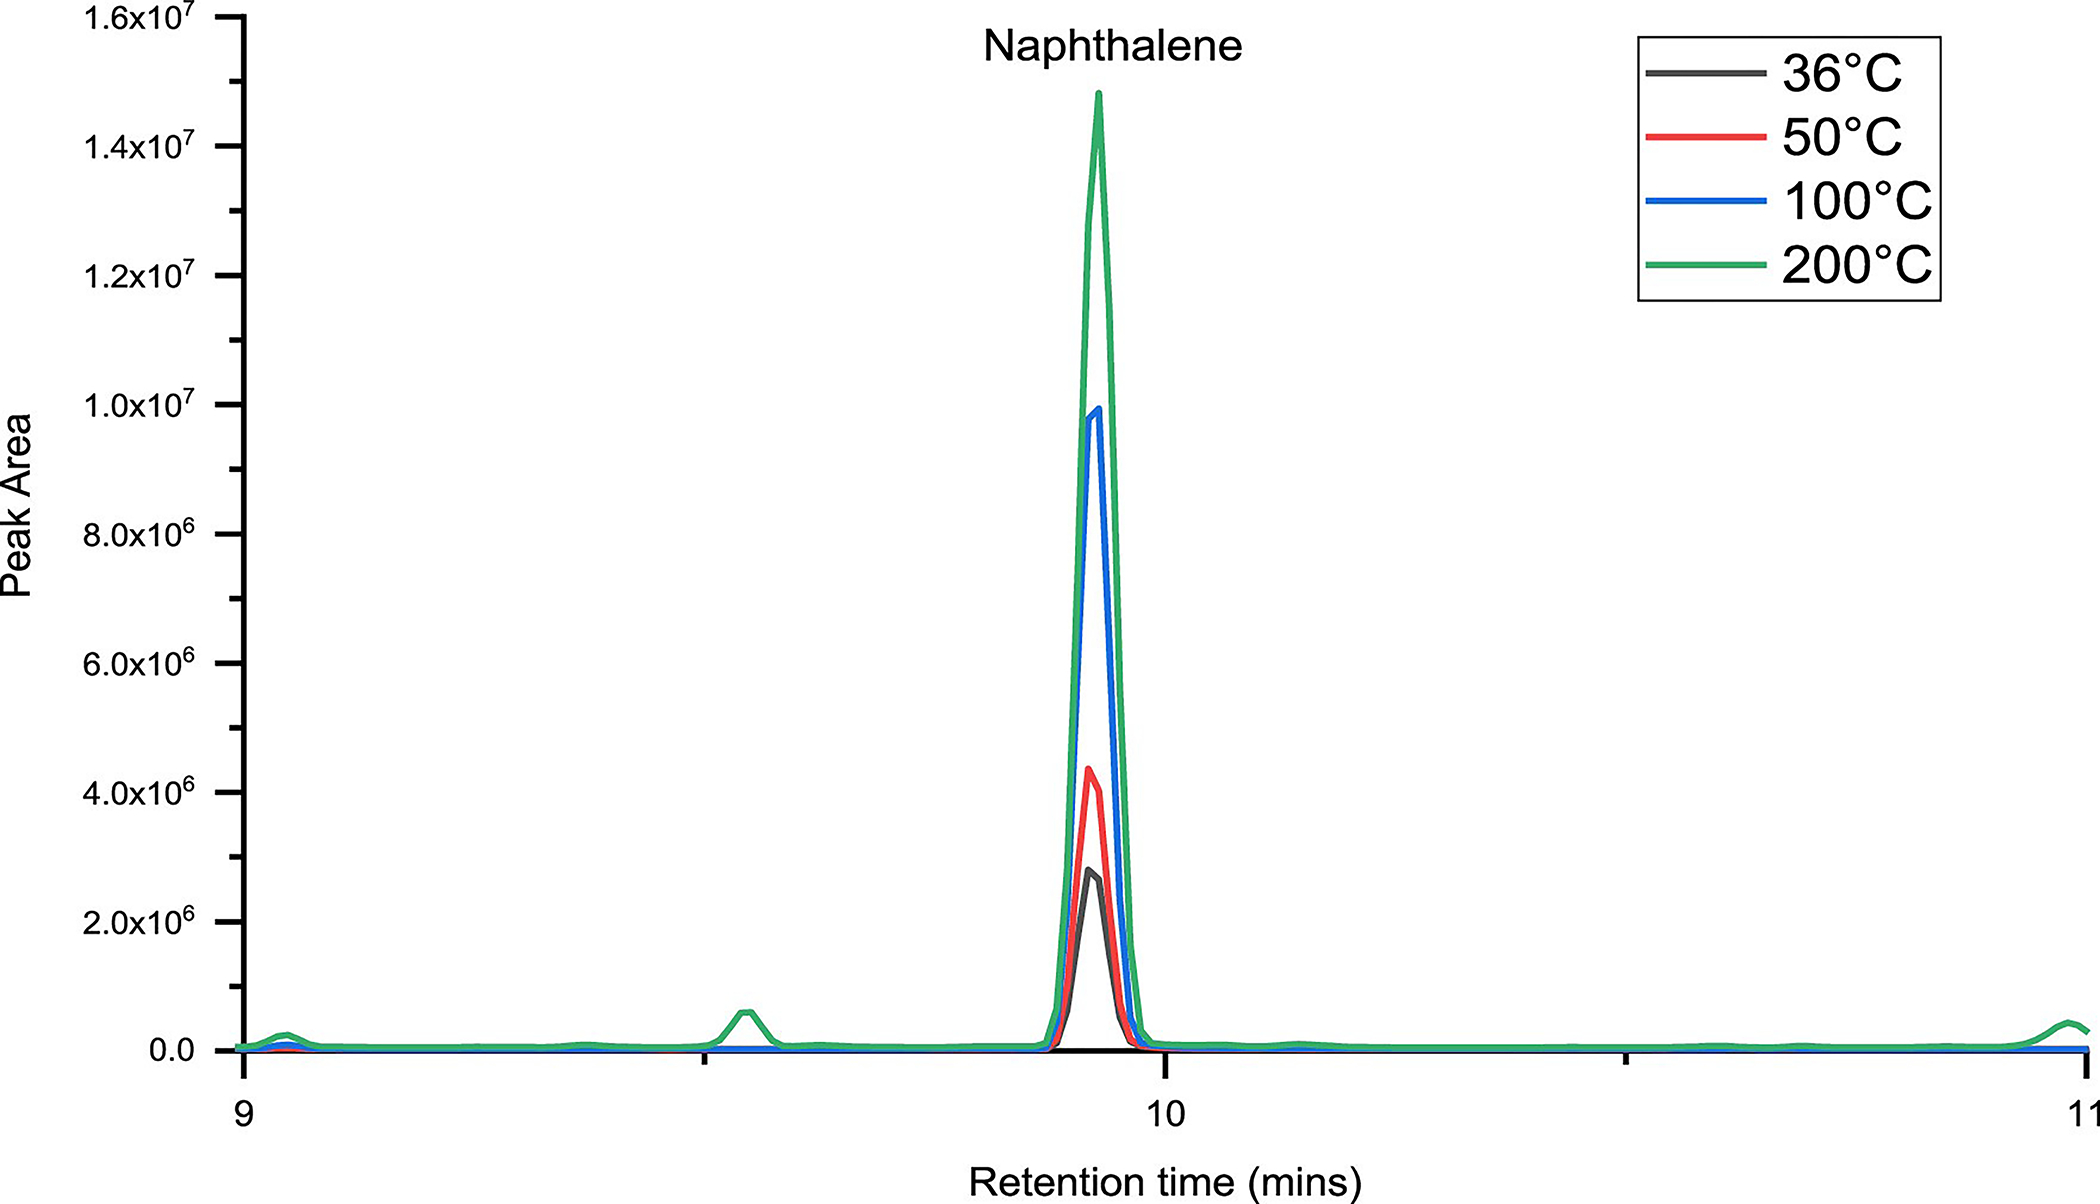
Magnified chromatogram showing the peak areas at various temperatures.
Extraction Efficiencies for Phenols.
It can be seen in Figure 7 that all the three phenolic compounds were detected at 200 °C, two at 100 °C, two at 50 °C, and one at 36 °C. The extraction efficiencies for phenols were in the range 60–100%. Phenol and 2,4,6-TCP had increasing extraction efficiencies when they were exposed to higher temperatures. For phenol and 2,4,6-TCP, the extraction efficiencies went up by 6-fold and 5-fold, respectively, compared at 100 °C versus 200 °C, as seen in Table 6.
Figure 7.
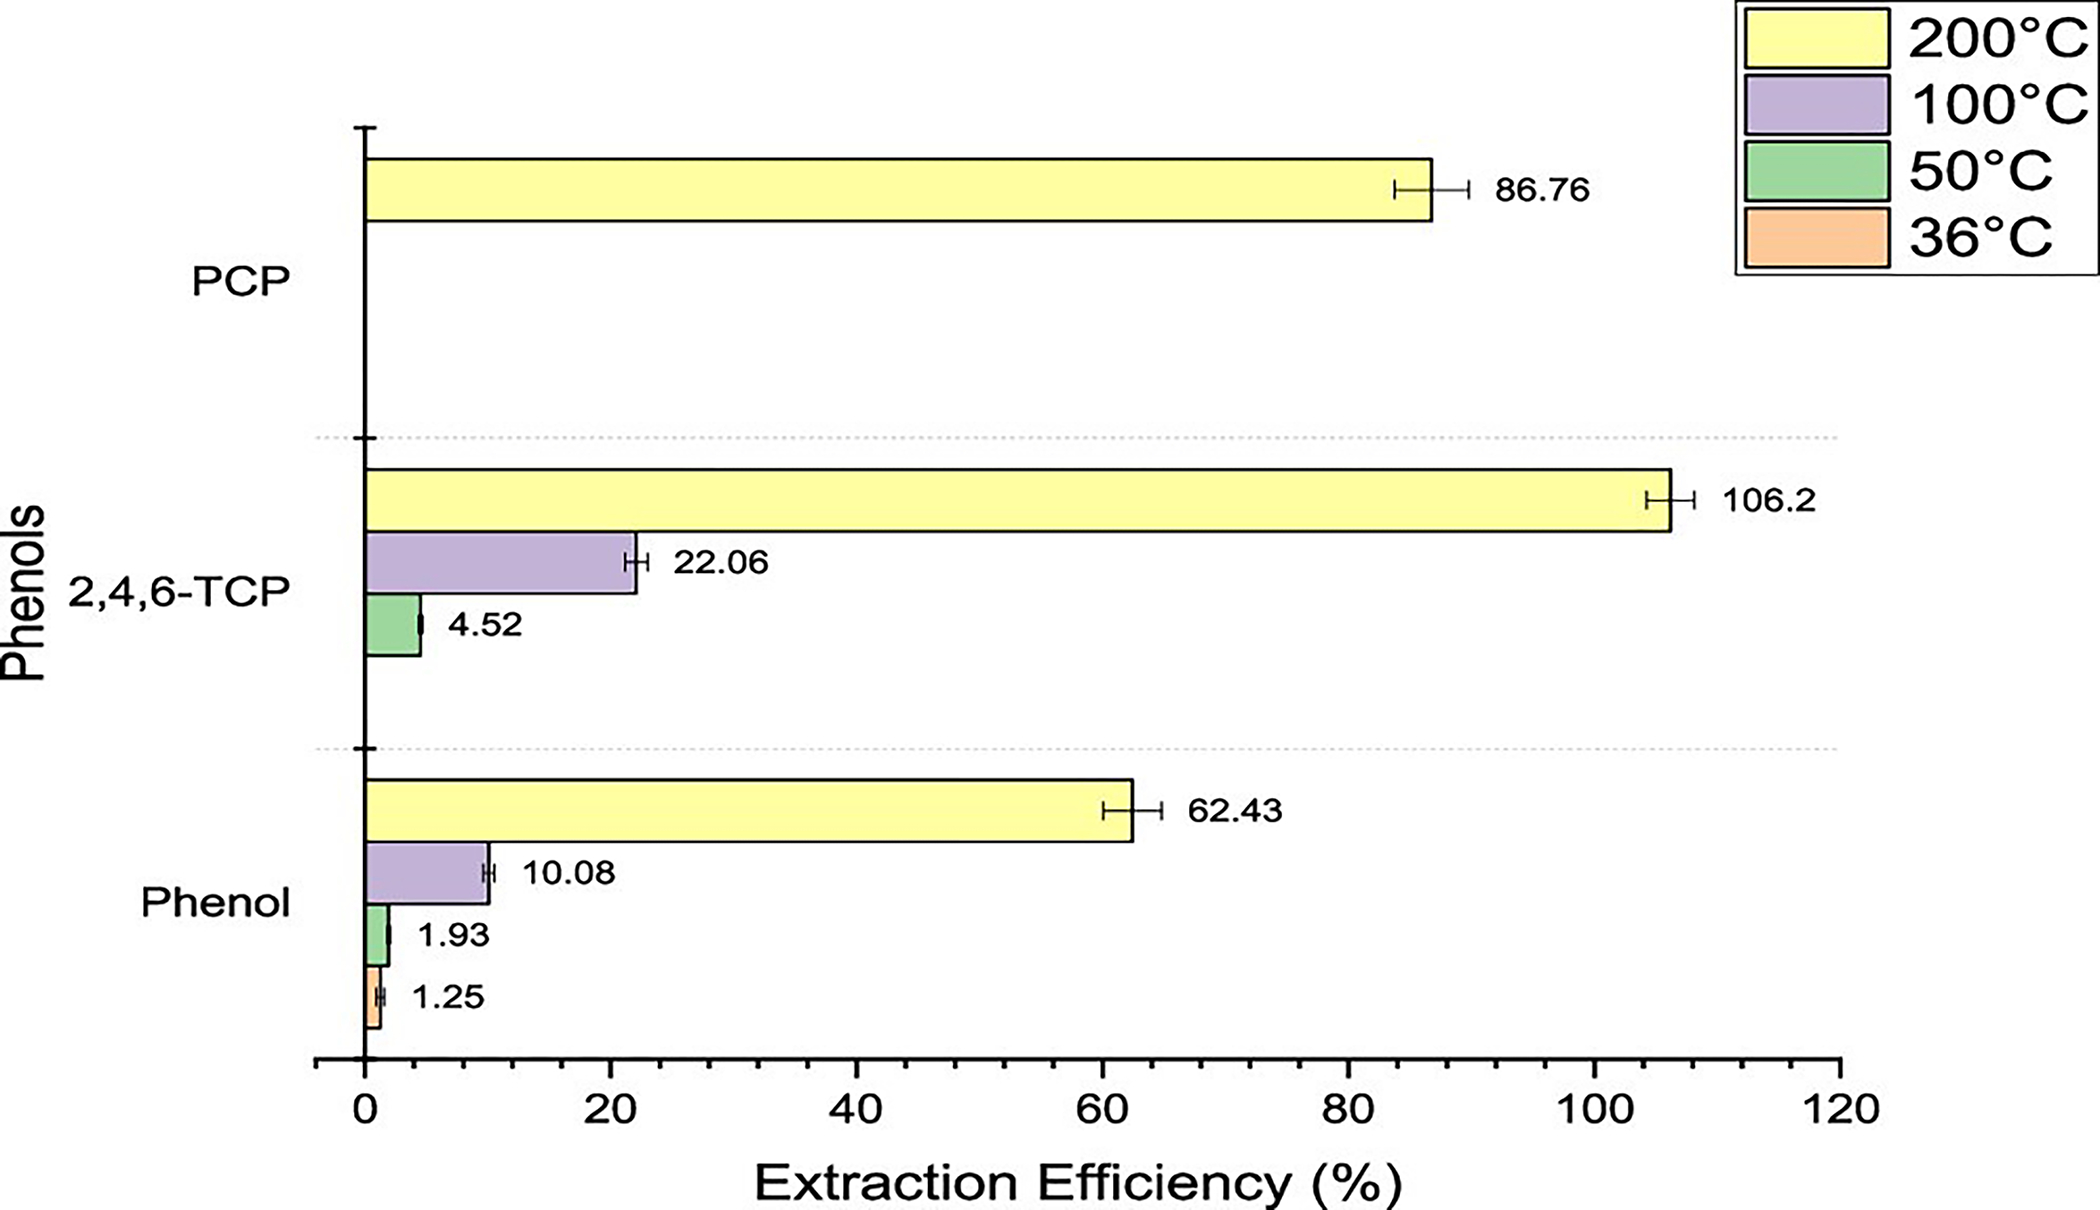
Extraction efficiencies for phenols using headspace–GC at 36, 50, 100, and 200 °C for 30 min.
Extraction Efficiencies for Phthalates.
It can be seen in Figure 8 that all three phthalates were detected at 200 °C, and only one was detected at 100 °C. None of the phthalates were detected at 50 and 36 °C. All the compounds are semivolatile compounds having boiling points over 300 °C; thus, the vaporization at the temperatures tested was not significant. However, at 200 °C, DEHP had a relative extraction efficiency of about 92%, BBP a relative extraction efficiency of about 70%, and DBP a relative extraction efficiency of about 66%. These efficiencies could be due to the 30 min equilibration time being sufficient to form a partial solid–vapor equilibrium and extract the partial compound from the outer shell fabrics.
Figure 8.
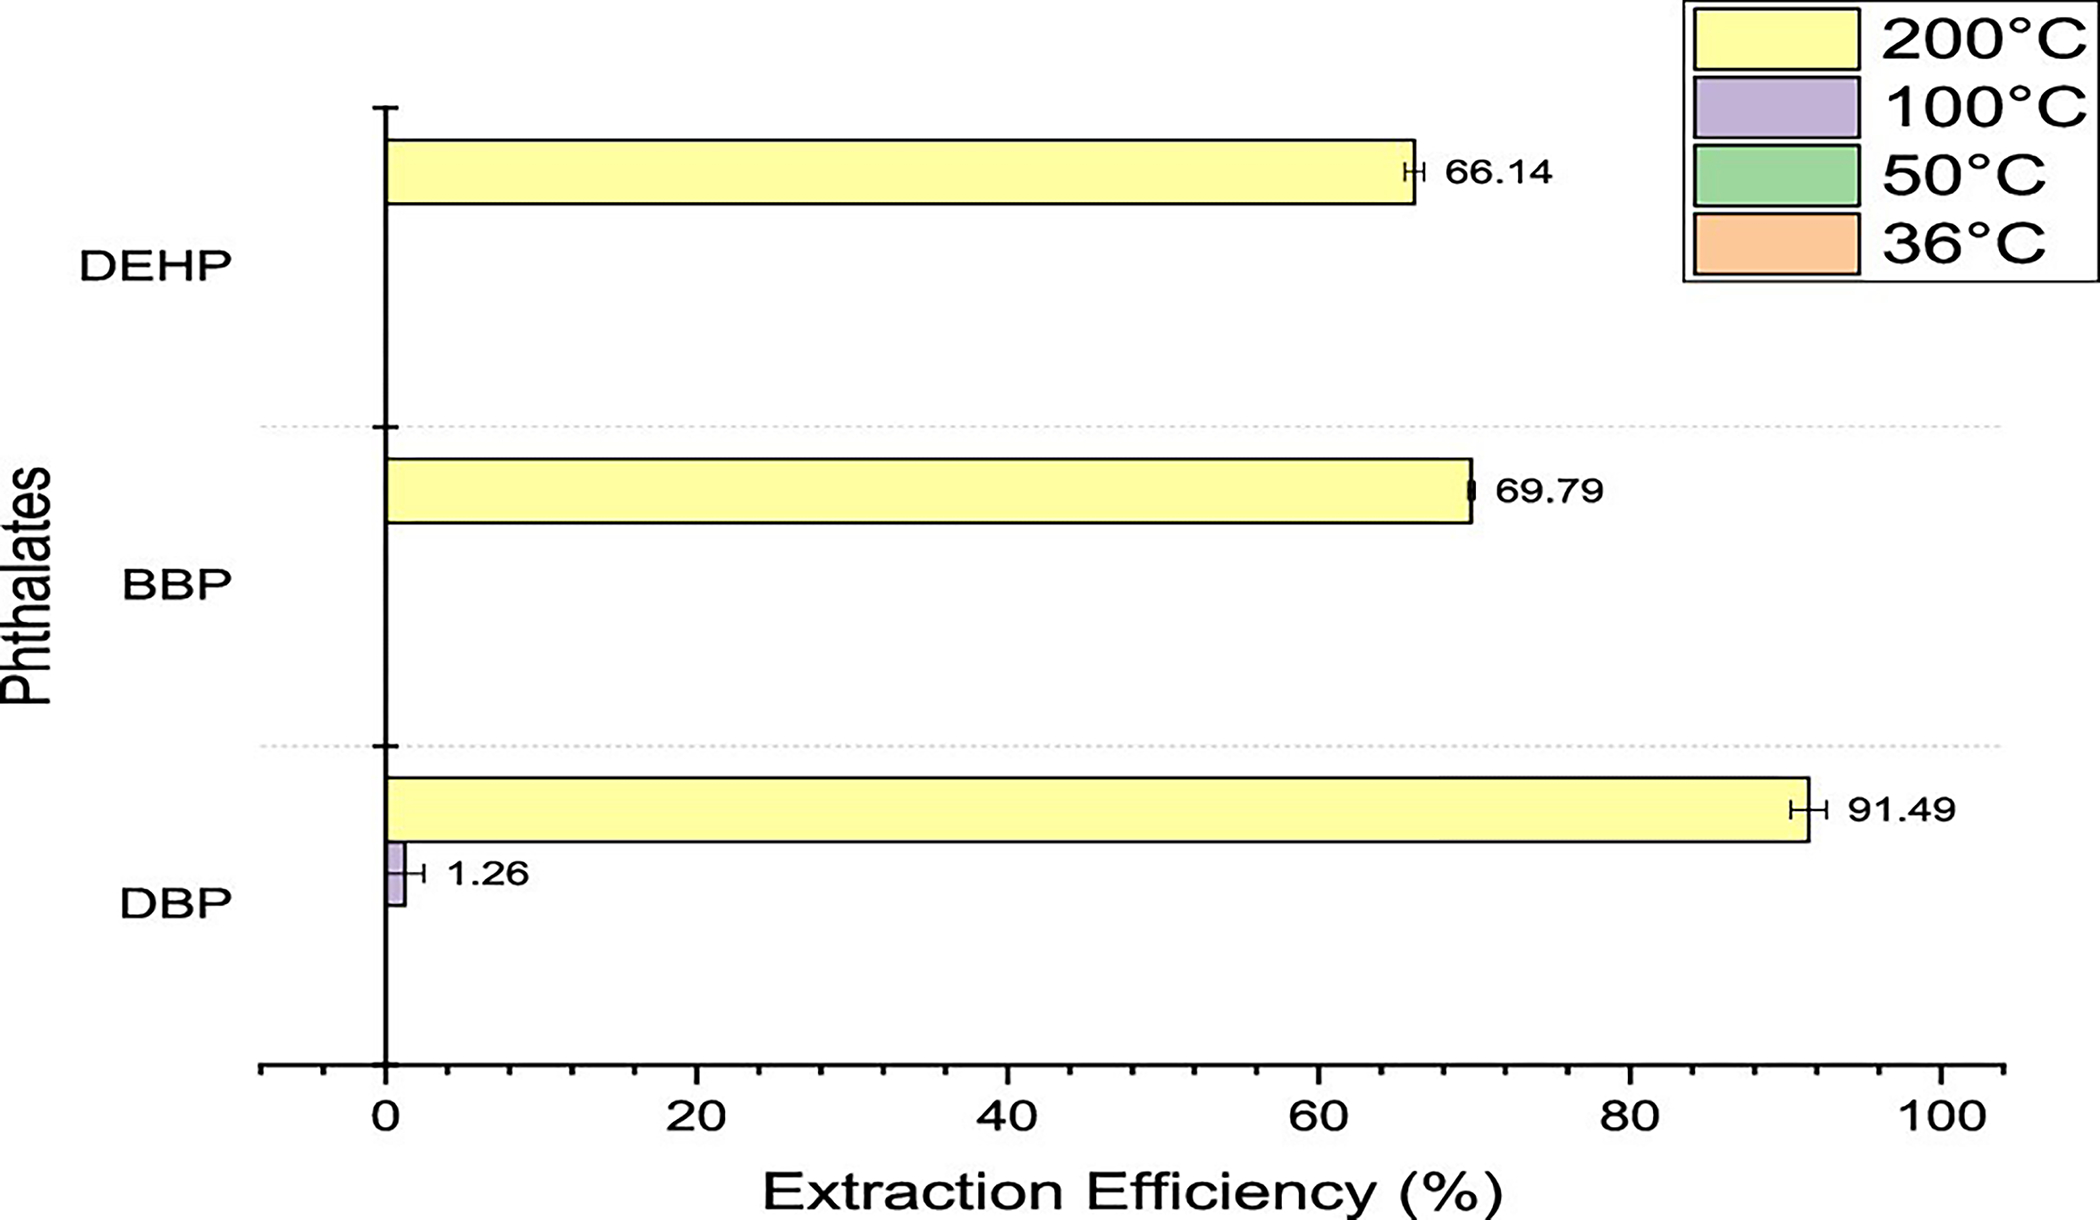
Extraction efficiencies for phthalates using headspace–GC at 36, 50, 100, and 200 °C for 30 min.
Extraction Efficiencies for PAHs.
It can be seen in Figure 9 that all four PAHs were detected at 200 °C; three were detected at 100 °C, while only one compound was detected at 50 and 36 °C. Naphthalene, phenanthrene, and pyrene had increasing extraction efficiencies when they were exposed to higher temperatures. When comparing the efficiency at 200 °C versus that at 100 °C, phenanthrene had a 6-fold increase in the mass extracted, pyrene a 16-fold increase, and naphthalene just over a 1.5-fold increase. Of all the compounds, only naphthalene was detected at all the temperatures tested. The extraction efficiency and masses extracted for naphthalene almost doubled when increasing the temperature from 36 to 50 °C and from 50 to 100 °C. Naphthalene is a highly volatile compound with a high vapor pressure at room temperature, where it is known to sublime if kept for a long time.17 Hence, when exposed to elevated temperatures, the vapor pressure is even higher, and higher vaporization of the compound occurs. Overall, the 200 °C exposure was best suited among all the temperatures tested for the thermal extraction of PAHs. However, it can be observed from Figure 9 that the extraction efficiencies decreased as the boiling point of the compounds was much higher than 200 °C (comparing phenanthrene, pyrene, and benzo[a] pyrene; where benzo[a] pyrene has the highest boiling point of the three compounds). This further means that the thermal extraction of the higher-boiling PAHs using headspace–GC might not be the most efficient method at extracting significant amounts of the compounds from the substrate. Other methods or instruments might have to be used, wherein the temperature of exposure could be elevated around the boiling point of some of these compounds.
Figure 9.
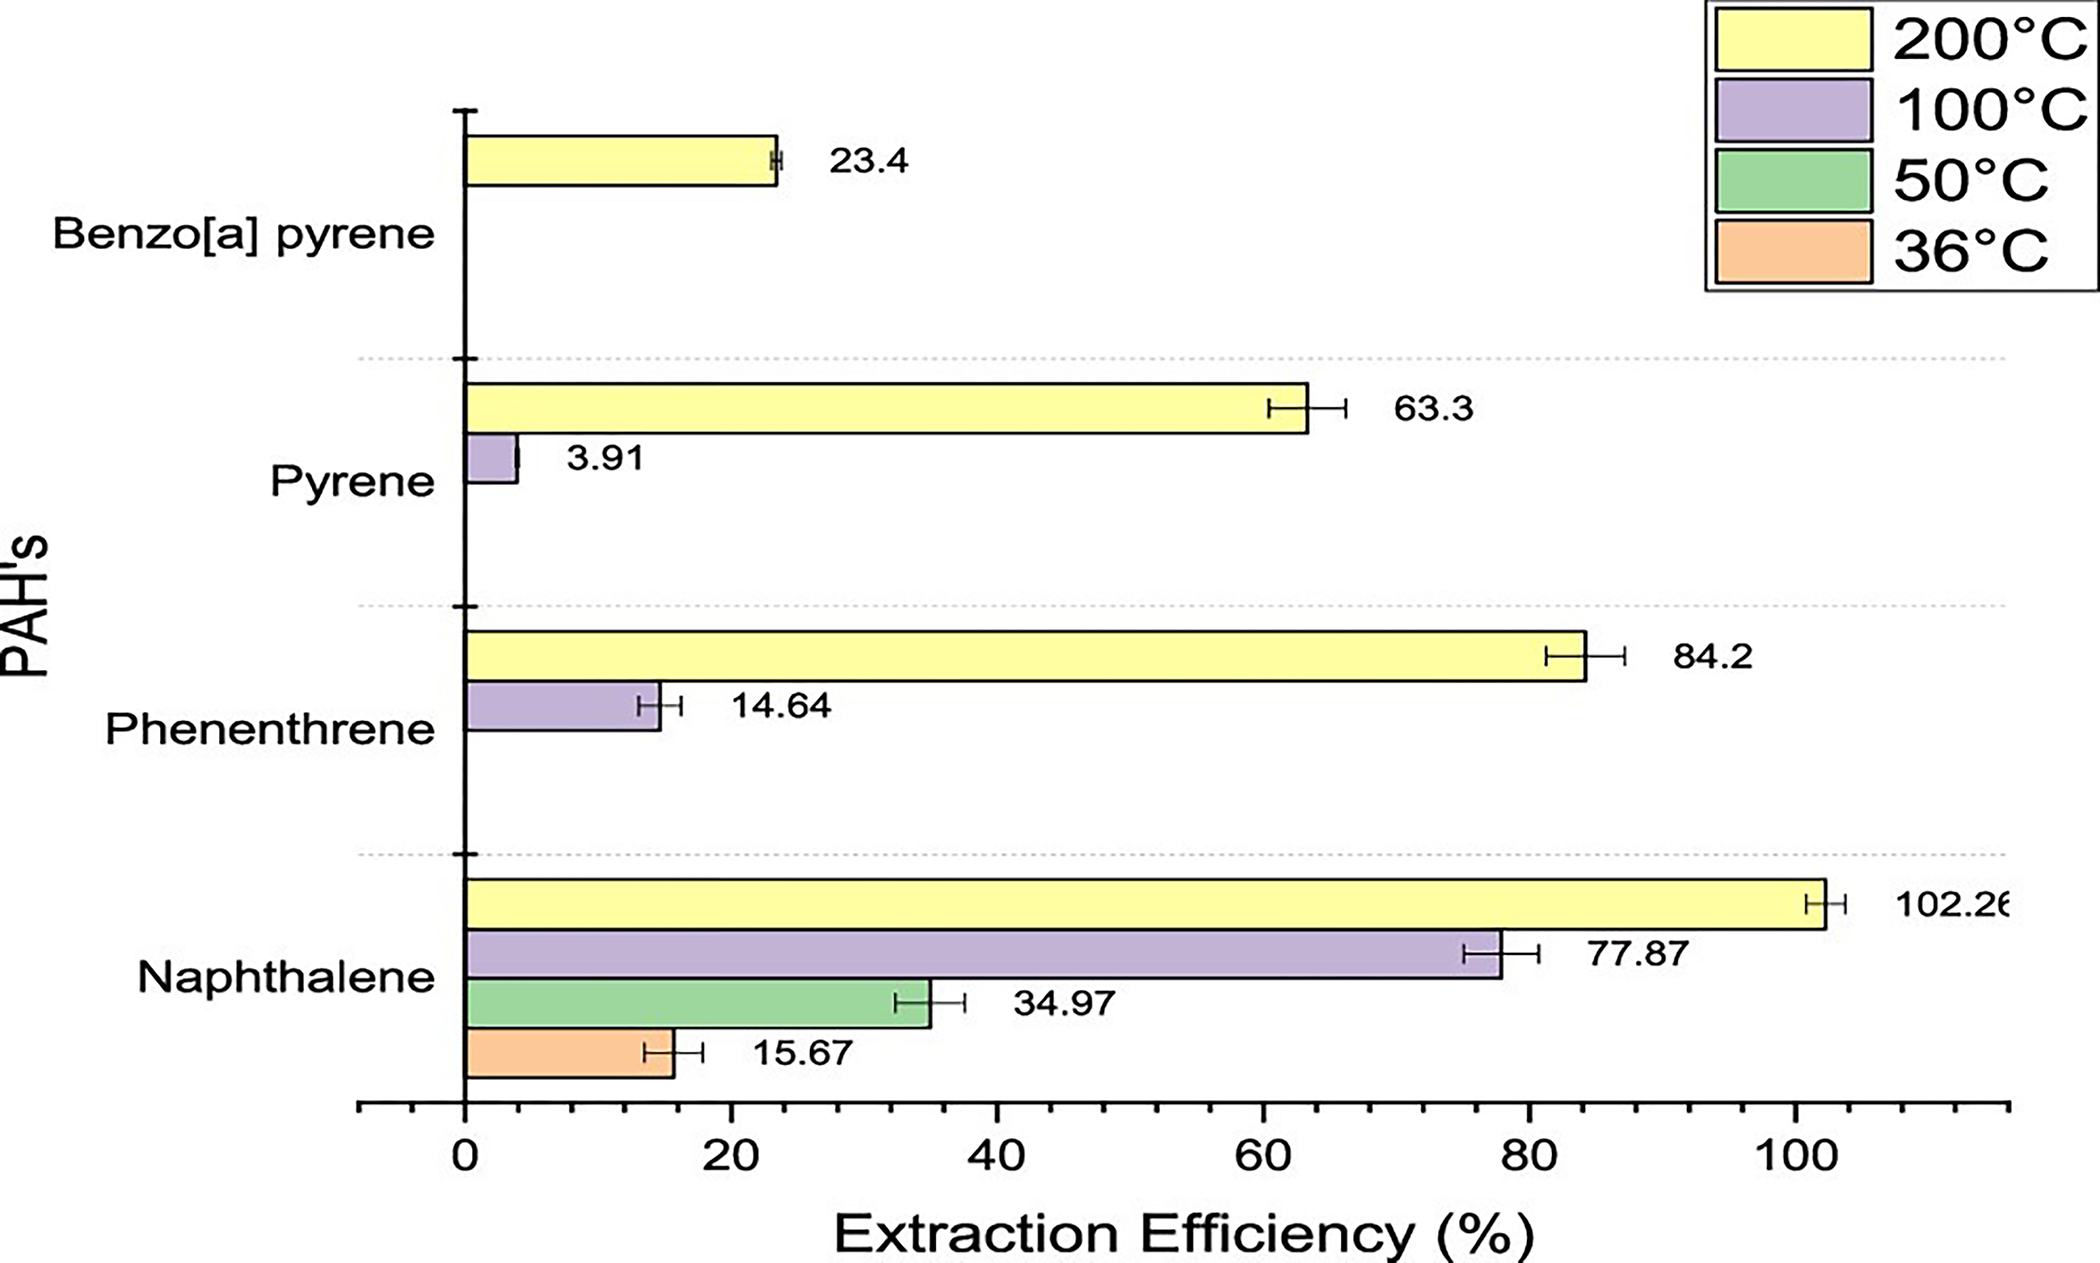
Extraction efficiencies for PAHs using headspace–GC at 36, 50, 100, and 200 °C for 30 min.
Best-Suited Method for Thermal Extraction Using Headspace–GC.
After headspace–GC analysis of spiked outer shell materials at 36, 50, 100, and 200 °C, it can be concluded that 200 °C with an equilibration time of 30 min is the best-suited method for the extraction of fireground contaminants. There was a significant increase in the extraction efficiencies at higher temperatures because the vapor pressure of the compounds increases with an increase in the temperature. At a higher vapor pressure, the volatility of the compounds is higher, and a higher mass of compound is converted to the vapor phase. Table 5 contains the extraction efficiencies for all the compounds. It was intriguing to point out that, at 200 °C, 2,4,6-TCP and naphthalene had extraction efficiencies over 100%. The Association of Official Analytical Chemists (AOAC) has published several documents where it is specified that extraction efficiencies over 100% are regularly obtained and are a result of variability in the readings. The acceptable range for extraction efficiencies is typically between 85% and 115%.18
The chromatogram (seen in Figure 10) shows the compound peaks for pure liquid chemicals overlaid with compounds extracted from outer shell materials. The analysis was conducted using headspace–GC at 200 °C, 30 min. As seen in Figure 10, the peak heights for the pure liquid compounds are higher than the extracted compound peaks. This difference is because, when the chemicals are spiked onto fabrics, factors such as fabric construction and absorption affect the ability to extract thermally. It is observed that the masses of the compounds detected from spiked fabric samples were always lesser than pure liquid samples. Most fabrics have higher binding capabilities for compounds; hence, the analysis of pure liquid chemicals results in higher responses. The chromatogram, shown in Figure 10, displays appropriate compound resolution with sharp peak shapes, which is required for accurate analysis.
Figure 10.
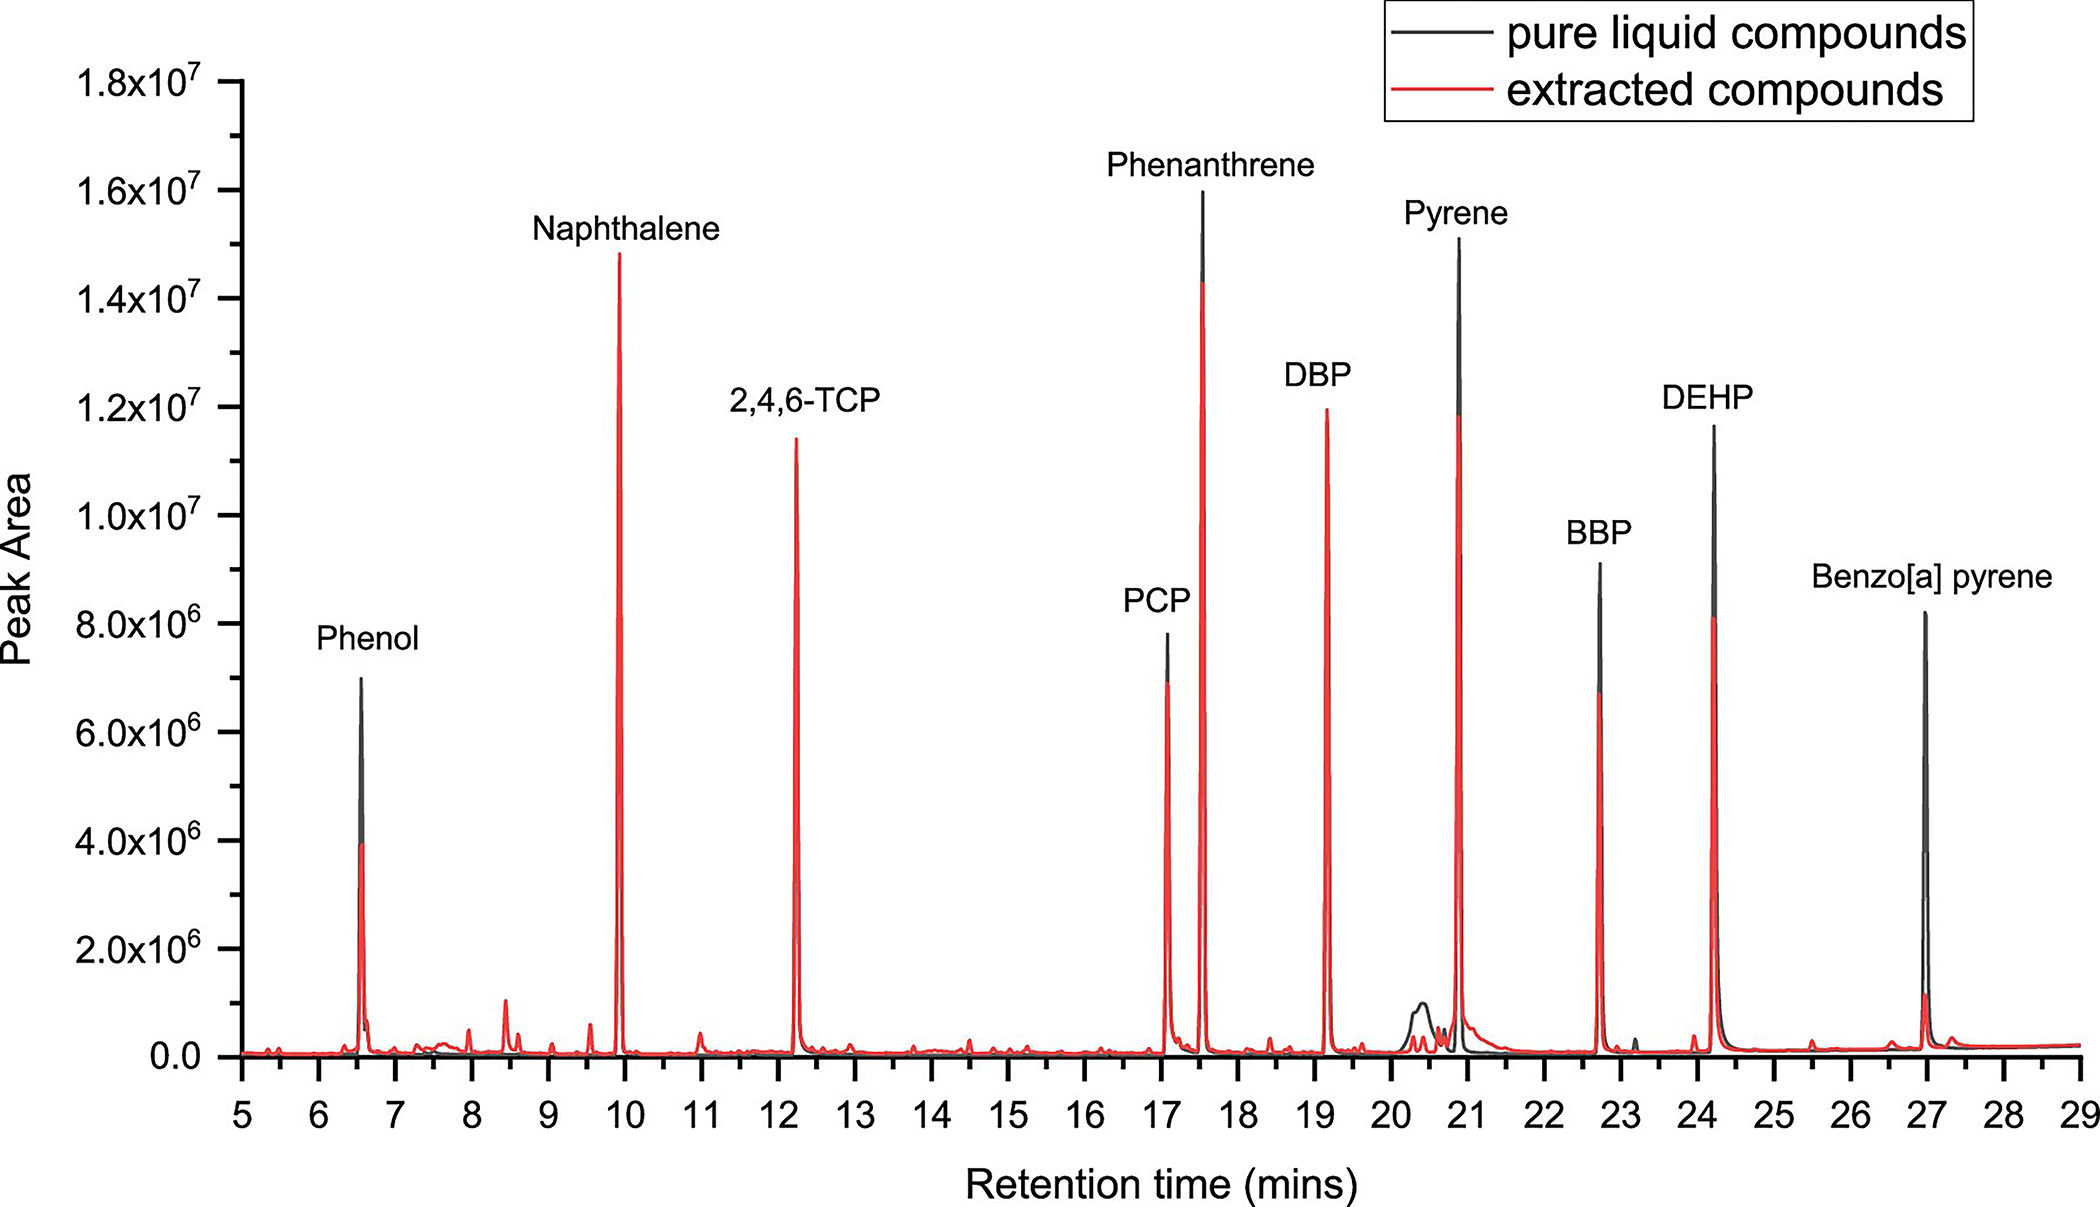
Overlaid chromatogram of the liquid compounds and extracted compounds using headspace–GC injection at 200 °C for 30 min.
LIMITATIONS
The headspace sampler oven has an operational temperature range between 35 and 260 °C, which is a limitation in the case of thermal extraction analysis of fireground contaminants with lower volatility. In the current study, it was seen that this method was not particularly helpful for the thermal extraction of some of the much higher-boiling PAHs such as benzo[a] pyrene (having a boiling point of 404 °C). If the instrument could achieve higher temperatures, the higher-boiling PAHs could be better detected. In such a case, some other suitable methods would need to be used to analyze these types of compounds. The current method focused on 10 representative fireground contaminants. However, a field-contaminated jacket could have hundreds of compounds present on it, and a suitable chromatographic separation method would need to be separately developed to cater to a higher number of compounds. However, even with the limitations, the current method was able to provide a quick screening method to analyze contamination on the outer shell materials.
CONCLUSION
From the various temperatures tested, it can be concluded that 200 °C was the most suited temperature to thermally extract the maximum amounts of phenols, phthalates, and PAHs from the outer shell material used in firefighter turnout gear. The current research proves that headspace–GC could be reliably used as a screening tool to measure the amounts of different compounds on gear using a single/all-in-one method of analysis. The compounds analyzed included volatile and semivolatile compounds, many of which are found in actual field-contaminated samples. The method requires minimal sample preparation, covers a range of compounds, and is relatively quick at producing results. This study proves that the method is between 80% and 100% effective at extracting certain types of phenols, phthalates, and PAHs. The method is especially useful for extracting highly volatile compounds such as naphthalene, where it may evaporate in other methods of extraction, such as the sonication or pressurized solvent extraction, resulting in low extraction efficiencies.
For all compounds, it was observed that increasing the temperature of exposure leads to the evolution of higher amounts. This study also shows that the equilibration time does not affect the amount of extraction of the compounds from the outer shell material significantly. An equilibration time of 30 min was found to be sufficient for most of the compounds that were analyzed. Ultimately, this study validates the headspace–GC as an easy and robust technique to measure the off-gassing of certain chemicals from firefighter gear material.
As seen in Table 5, the higher-boiling PAHs had a low extraction efficiency across the temperatures tested. This finding suggests that such compounds might still be present on the gear and be available for dermal exposure. In the past, several studies have looked at dermal exposure of contaminants through the skin, leading to a variety of health problems.20,21,24,25 Additionally, it is known that the typical temperatures in structural fires are above 50 °C,22 and hence, the fireground contaminants that are off-gassing could potentially be a dermal exposure risk to the firefighters.
FUTURE WORK
The results from this study indicate that headspace–GC–MS is a viable tool to assess the thermal extraction of fireground contaminants from outer shell material. Therefore, the study opens avenues for several other questions to be addressed about off-gassing in the fire service. It is seen that the fire service is slowly transitioning to an on-site gross decontamination of the turnout gear, which occurs immediately after a firefighter exits a burning structure. However, this practice is not yet followed across all the departments, and the personnel performing the gross decontamination are typically not wearing respiratory protection. At this point, the gear is still considerably heated from the exposure and could be potentially off-gassing chemicals, which could pose a respiratory hazard for the firefighters. Even though the current research focused on 30 min extraction levels, future studies could focus on shorter time intervals, such as 5–10 min, which would be realistic to the conditions in the field. The trials at 36 and 50 °C showed that volatile compounds, specifically naphthalene and phenol in this study, could be readily removed from the fabric at these relatively low temperatures. With further analysis, it may be possible to generalize these findings to other volatile compounds such as acetic acid, acetone, and benzene, which have also been found on contaminated gear.19
Supplementary Material
Funding
This study was funded as part of the Federal Emergency Management Agency’s (FEMA) Assistance to Firefighters Grant Program, reference EMW-2017-FP-00601. The analytical instruments and materials required for analysis were provided by Textile Protection & Comfort (TPACC) laboratories at North Carolina State University, Raleigh.
ABBREVIATIONS
- HS
headspace sampler
- GC
gas chromatography
- MS
mass spectrometry
- BBP
benzyl butyl phthalate
- DEHP
di-ethyl-hexyl phthalate
- PAH
polycyclic aromatic hydrocarbons
- TCP
tri-chlorophenol
- PCP
pentachlorophenol
Footnotes
The authors declare no competing financial interest.
Complete contact information is available at: https://pubs.acs.org/10.1021/acs.chas.0c00041
Contributor Information
Adhiraj Shinde, Textile Protection and Comfort Center, Wilson College of Textiles, North Carolina State University, Raleigh, North Carolina 27606, United States.
R. Bryan Ormond, Textile Protection and Comfort Center, Wilson College of Textiles, North Carolina State University, Raleigh, North Carolina 27606, United States.
REFERENCES
- (1).Kirk KM; Ridgway M; Splawinski Z Firefighter Exposures to Airborne Contaminants During Extinguishment of Simulated Residential Room Fires; Research Report 2011–01 for Queensland Fire and Rescue Service (QFRS); QFRS Scientific Branch, 2011. [Google Scholar]
- (2).Austin CC; Wang D; Ecobichon DJ; Dussault G Characterization of volatile organic compounds in smoke at municipal structural fires. J. Toxicol. Environ. Health, Part A 2001, 63 (6), 437–458. [DOI] [PubMed] [Google Scholar]
- (3).Fent KW; Evans DE; Booher D; Pleil JD; Stiegel MA; Horn GP; Dalton J Volatile organic compounds off-gassing from firefighters’ personal protective equipment ensembles after use. J. Occup. Environ. Hyg. 2015, 12 (6), 404–414. [DOI] [PubMed] [Google Scholar]
- (4).Technical Overview of Volatile Organic compounds. https://www.epa.gov/indoor-air-quality-iaq/technical-overview-volatile-organic-compounds#definition (accessed June 20, 2020).
- (5).Zhang M; Buekens A; Li X Brominated flame retardants and the formation of dioxins and furans in fires and combustion. J. Hazard. Mater. 2016, 304, 26–39. [DOI] [PubMed] [Google Scholar]
- (6).Kirk KM; Logan MB Structural fire fighting ensembles: accumulation and off-gassing of combustion products. J. Occup. Environ. Hyg. 2015, 12 (6), 376–383. [DOI] [PubMed] [Google Scholar]
- (7).Treitman RD; Burgess WA; Gold A Air contaminants encountered by firefighters. Am. Ind. Hyg. Assoc. J. 1980, 41 (11), 796–802. [DOI] [PubMed] [Google Scholar]
- (8).Baxter CS; Hoffman JD; Knipp MJ; Reponen T; Haynes EN Exposure of firefighters to particulates and polycyclic aromatic hydrocarbons. J. Occup. Environ. Hyg. 2014, 11 (7), D85–D91. [DOI] [PMC free article] [PubMed] [Google Scholar]
- (9).Fent KW; Eisenberg J; Snawder J; Sammons D; Pleil JD; Stiegel MA; Dalton J Systemic exposure to PAHs and benzene in firefighters suppressing controlled structure fires. Ann. Occup. Hyg. 2014, 58 (7), 830–845. [DOI] [PMC free article] [PubMed] [Google Scholar]
- (10).Kirk KM; Logan MB Firefighting instructors’ exposures to polycyclic aromatic hydrocarbons during live fire training scenarios. J. Occup. Environ. Hyg. 2015, 12 (4), 227–234. [DOI] [PubMed] [Google Scholar]
- (11).Waldman JM; Gavin Q; Anderson M; Hoover S; Alvaran J; Ip HSS; Israel L Exposures to environmental phenols in Southern California firefighters and findings of elevated urinary benzophenone-3 levels. Environ. Int. 2016, 88, 281–287. [DOI] [PubMed] [Google Scholar]
- (12).Selala MI; Coucke V; Daelemans F; Musuku A; Jorens P; Beaucourt L; Schepens PJC Fire fighting: how safe are firefighters. Bull. Environ. Contam. Toxicol. 1993, 51 (3), 325–332. [DOI] [PubMed] [Google Scholar]
- (13).Easter E; Lander D; Huston T Risk assessment of soils identified on firefighter turnout gear. J. Occup. Environ. Hyg. 2016, 13 (9), 647–657. [DOI] [PubMed] [Google Scholar]
- (14).Alexander BM Contamination of Firefighter Personal Protective Gear. Doctoral dissertation, University of Cincinnati, 2012. [Google Scholar]
- (15).U.S. National Library of Medicine. https://pubchem.ncbi.nlm.nih.gov/ (accessed June 20, 2020).
- (16).Agents classified by the IARC Monographs, Vol. 1–127. https://monographs.iarc.fr/agents-classified-by-the-iarc (accessed June 20, 2020). [Google Scholar]
- (17).Caroll J Natural Gas Hydrates; Gulf Professional Publishing: Washington DC, 2014; p 16, ISBN 9780128005750. [Google Scholar]
- (18).AOAC Guidelines for single laboratory. http://members.aoac.org/aoac_prod_imis/AOAC_Docs/StandardsDevelopment/SLV_Guidelines_Dietary_Supplements.pdf (accessed June 25, 2020).
- (19).Hakkarainen T et al. Chemical exposure and protection of fire site workers, 937–48; Interflam: Nottingham, 2010. [Google Scholar]
- (20).Keir JL; Akhtar US; Matschke DM; Kirkham TL; Chan HM; Ayotte P; Blais JM Elevated exposures to polycyclic aromatic hydrocarbons and other organic mutagens in Ottawa firefighters participating in emergency, on-shift fire suppression. Environ. Sci. Technol. 2017, 51 (21), 12745–12755. [DOI] [PubMed] [Google Scholar]
- (21).Fent KW; Eisenberg J; Evans DE; Sammons D; Robertson S; Striley C; Stiegel MA Evaluation of dermal exposure to polycyclic aromatic hydrocarbons in fire fighters; Report no. 2010–0156-3196; National Institute for Occupational Safety and Health, 2013. [Google Scholar]
- (22).Willi JM; Horn GP; Madrzykowski D Characterizing a firefighter’s immediate thermal environment in live-fire training scenarios. Fire Technol. 2016, 52 (6), 1667–1696. [Google Scholar]
- (23).Nfpa N Standard on Selection, Care, and Maintenance of Protective Ensembles for Structural Fire Fighting and Proximity Fire Fighting. In NFPA National Fire Codes Online 1851; NFPA, 2019. [Google Scholar]
- (24).Stec AA; Dickens KE; Salden M; Hewitt FE; Watts DP; Houldsworth PE; Martin FL Occupational exposure to polycyclic aromatic hydrocarbons and elevated cancer incidence in firefighters. Sci. Rep. 2018, 8 (1), 1–8. [DOI] [PMC free article] [PubMed] [Google Scholar]
- (25).Laitinen J; Mäkelä M; Mikkola J; Huttu I. Firefighters’ multiple exposure assessments in practice. Toxicol. Lett. 2012, 213 (1), 129–133. [DOI] [PubMed] [Google Scholar]
Associated Data
This section collects any data citations, data availability statements, or supplementary materials included in this article.


