

Abstract
Background:
Individuals with Chronic Obstructive Pulmonary Disease (COPD) often develop anxiety and depression, which worsen illness management and prognosis. Physical and psychological symptoms, contextual and illness-related factors display complex reciprocal interactions, which give rise to heterogeneous presentations. Examining the patterns of association between specific physical and psychological symptoms in patients with COPD may help to focus on the precision of the patient-centred care.
Research question:
We used network analyses to examine the links between symptoms of COPD, depression and anxiety.
Methods:
Data from 1587 individuals with COPD from the COPDGene study were included. We estimated a Bayesian Gaussian Graphical Model to highlight the unique associations between symptoms of COPD (assessed with the COPD Assessment Test), depression and anxiety (assessed with the Hospital Anxiety and Depression Scale (HADS), while examining the role of sociodemographic characteristics, lung function tests, and health status.
Results:
Unique Variable Analysis reduced 14 HADS items to Tension/worry (chronic anxiety), Fear/panic (acute anxiety), Restlessness, Anhedonia, Sadness and Slowing. In network analyses, chest-tightness was related to acute anxiety, while cough and weakness were connected with core depressive symptoms (sadness and lack of pleasure). Chronic anxiety was linked with acute anxiety and depressive symptoms. Findings were confirmed accounting for the role of confounders, including lung function, sex, ethnicity and lifestyle factors. A simulation based on our model yielded distinct predictions about anxiety and depression in two participants with similar COPD severity, but different symptom profiles.
Conclusion:
Network analyses highlighted specific associations between symptoms of COPD, depression and anxiety. Accounting for symptom-level interactions may help to promote personalized treatment approaches.
Keywords: COPD, Depression, Anxiety, Dyspnoea, Panic, Worries, Network analysis
1. Introduction
Depression and anxiety are common in patients with chronic obstructive pulmonary disease (COPD). COPD patients exhibit clinically relevant symptoms of comorbid depression and anxiety [1,2]. Untreated depression and anxiety are associated with increased acute exacerbations (AECOPD) [3,4], emergency health care utilization and hospital readmission [3,4] and premature mortality [5].
The exact reason(s) why patients with COPD manifest elevated rates of depression and anxiety remains unclear. Literature strongly associates the severity of individual COPD symptoms with depressive symptoms and anxiety, more than by traditional measures of classifying severity using pulmonary function impairment [6]. As such, anxiety and depressive symptoms are likely to be influenced by complex interactions between illness chronicity, physical activity limitations, social isolation, physiological effects of COPD on the brain, and genetic factors. These experiences and limitations lead to feeling demoralized with low self-efficacy, paving the way to further development of psychopathology [7]. Furthermore, depression and anxiety symptoms overlap with physical symptoms of COPD [8]. Acute anxiety (fear/panic), for example, may manifest as sudden shortness of breath or tachypnoea, potentially mimicking the presence of acute or chronic dyspnoea. Chronic anxiety is the tenacious feeling of anxiety or dread which can interfere with daily life e.g. unable to engage in social interaction. Depression entails affective, cognitive and neurovegetative symptoms [9], often accompanied by fatigue (weakness) and psychomotor slowing, which also largely overlap with symptoms of COPD. Specific symptoms of anxiety trigger or exacerbate COPD symptoms, and vice versa [4,6,8]. Depression in COPD may amplify social withdrawal, activity limitations or poor compliance to treatment, each of which may lead to lower self-esteem, lower self-management and increased risk of acute exacerbation (AECOPD) [3,4,8]. Because of such complex interactions, depression and anxiety in COPD have extremely heterogeneous clinical presentations.
The network approach is particularly useful to examine multiple, complex relationships between symptoms among individuals with physical illnesses such as COPD [10–12]. The network approach assumes that mental disorders emerge from the reciprocal causation of multiple symptoms. Network analyses identify the most relevant connections between symptoms, estimate their relative importance and groupings, and explore the role of contextual factors, such as demographic variables or biological indices [13–15]. In fact, mental disorders in COPD likely derive from a complex interaction between physical and psychological symptoms, either with a pronounced subjective component (e.g. dyspnoea, anxiety) or due to disease chronicity (e.g. persistent cough with or without phlegm) [16]. To date, only one study utilized network modelling in COPD to examine the inter-relationships of depressive symptoms with dyspnoea. Schuler and colleagues found that dyspnoea frequency and physical functioning related to somatic depressive symptoms (sleep problems, loss of energy), while cognitive/emotional responses associated with cognitive-affective symptoms (feeling down/depressed/hopeless) [17].
This study extends previous findings by identifying unique associations between specific symptoms of COPD and symptoms of depression and anxiety. Moreover, we examined whether such relationships might be affected by sociodemographic characteristics, COPD assessment as an index of severity, lung function tests, comorbidities and health status. Lastly, we examined whether network models could provide testable predictions on the evolution of depression and anxiety in COPD. Given prior literature, we hypothesized that breathlessness would be strongly associated with acute anxiety. Exploring the interactions between clinical and psychological variables in patients with COPD may be particularly useful to elucidate the most frequent clustering of symptoms to identify personalized treatment targets.
2. Methods
We examined data from the previously reported Genetic Epidemiology of COPD (COPDGene) study [18]. COPDGene recruited current and former smokers (≥10 pack-years) from 21 centers across the United States. Our analysis included participants with available Hospital Anxiety and Depression Scale (HADS) and COPD Assessment Test (CAT) data collected during the Phase 2 study visit, the first time that mood measures were administered. The Institutional Review Board of all 21 participating centers approved the study, and participants provided written informed consent.
2.1. Participants
Of the 6718 participants smokers who completed the Phase 2 visit, 4903 were excluded (n = 4347 without COPD and n = 556 without HADS data). Of those diagnosed with COPD (n = 1815), we excluded subjects with missing CAT data (n = 228), leaving a final sample of 1587 participants.
2.2. Assessments
Depression and anxiety were evaluated using the HADS, a 14-item questionnaire rating the severity of anxiety and depressive symptoms on two respective subscales. Both have a score range of 0–21, and a score of ≥8 on either subscale indicates clinically significant anxiety or depressive symptoms [19]. We assessed the severity of COPD symptoms and health status with the CAT, containing eight items assessing cough, phlegm, chest tightness, and breathlessness going uphill/stairs, activity limitations at home, confidence leaving home, sleep and energy. Each item is scored from 0 to 5 with a total score of 0–40, where 20 is the threshold for clinically significant symptoms. Higher scores correspond to poorer health status in COPD patients [20].
We also examined the role of: (1) Sociodemographic variables that could act as confounders, including sex, age, education, ethnicity and income; and (2) Clinical parameters that might influence COPD pathophysiology and/or depression, or be objective indices of COPD severity, including the ratio of the forced expiratory volume in 1 s to the forced vital capacity (FEV1/FVC), resting haemoglobin saturation (SaO2), distance walked in 6 min (feet), body mass index (BMI), number of cigarettes smoked daily, presence of cancer, number of physical comorbidities other than COPD [21] and number of daily COPD medications.
2.3. Data analyses
In a symptom network, each edge weight represents the strength of the partial correlation between two nodes, i.e. the unique shared covariance between pairs of symptoms after adjusting for all other symptoms in the network. Thus, edges can be interpreted as indices of bidirectional causal association between two symptoms, which might depend on various biopsychosocial mechanisms [22]. According to the network theory of psychopathology, each symptom (node) contributes differently to the overall “activation” and maintenance of a network in an active state, depending on the connections with other nodes.
Before estimating the network models, we combined the 14 items of the HADS based on their conceptual similarity, to reduce bias due to topological overlap [14,23]. Using the Unique Variable Analysis (UVA) of the EGAnet R package, 1.0 version, we computed a latent factor from conceptually redundant and highly correlated items [23]. We estimated the Gaussian Graphical Model (GGM) of depressive/anxiety symptoms (derived from the HADS) and COPD symptoms (derived from the CAT) using the non-regularized Bayesian approach implemented in the R package Bayesian Gaussian Graphical Models (BGGM)2.0.2 [24]. The method is based on a Wishart prior distribution for the correlation matrix. Posterior samples are used to estimate credibility intervals on each correlation and allow testing if a parameter is non-zero at the 5% level. The network structure ultimately represents the conditionally dependent relationships between symptoms. This method yields more conservative estimates than regularized methods, reducing the detection of false positive edges [24–26]. Networks are displayed using graph 1.6.5 [27]. Values of edge weights are reported in Weighted Adjacency Matrices (WAMs).
We examined differences in the association of COPD and mood symptoms. We identified the groups of the most inter-related nodes, termed communities, using the Walktrap algorithm of the 0.9.8 EGAnet package [28]. We estimated relevant network indices, i.e. node strength centrality and predictability. Strength centrality is the sum of connection weights of each node, indicating the relative connectedness of each node. Predictability is the variance share (R2) of each symptom explained by neighbouring symptoms. Predictability allows inferences on how self-determined a symptom is, and may contribute to inform intervention strategies [29]. For instance, low predictability values suggest that a symptom might be determined by factors outside the network [24,25].
We conducted sensitivity analyses to evaluate the role of sociodemographic and clinical variables. For categorical variables, we compared the CAT-HADS network structure between the levels of the variable (e.g. network in males vs. in females). Continuous variables were entered as additional nodes in the network.
Lastly, we ran a simulation of the CAT-HADS network model to illustrate the potential for testable predictions about the evolution of depression and anxiety in patients with COPD. We used the CAT scores of two randomly selected subjects to activate the corresponding nodes in the network across simulated timepoints. Finally, we recorded changes in HADS-derived symptoms, to illustrate how initial differences in the COPD symptom profile (e.g. different severity of cough, chest tightness) yield different predictions of the severity of anxiety and depressive symptoms. The supplement reports additional details on network analyses.
3. Results
3.1. Participants’ characteristics
The 1587 participants had almost equal distribution of sexes (Table 1). About a third of patients had clinically significant symptoms of COPD (35% with CAT total score above 20). HADS scores revealed that over one in five subjects had either clinically relevant anxiety or depression, of whom nearly half (174 subjects; 11% of the total) had both depression and anxiety. CAT scores positively correlated with both HADS depression (R = 0.50, p < 0.001) and anxiety (R = 0.39, p < 0.001) subscales (Fig. S1), as well as weakly with BMI (R = 0.11, p < 0.001), number of cigarettes/day (R = 0.17, p < 0.001), number of comorbidities (R = 0.09, p < 0.001) and number of respiratory medications (R = 0.32, p < 0.001). CAT scores negatively associated with age (R = −0.20, p < 0.001), FEV1 (R = −0.15, p < 0.001), oxygen saturation (R = −0.08, p = 0.001), and distance walked (R = −0.37, p < 0.001) (see Table 2).
Table 1.
Characteristics of the study sample (n = 1587).
| Age, mean ± sd | 67.97 ± 8.30 | CAT total score, mean (SD) | 17.23 ± 8.32 |
|---|---|---|---|
|
| |||
| Sex, female, % | 49.5 | CAT item scores, mean (SD) | |
| Ethnicity % | Cough | 2.33 ± 1.41 | |
| African-American | 22.8 | Phlegm | 2.03 ± 1.46 |
| Caucasian | 77.2 | Chest tightness | 1.47 ± 1.42 |
| Education, % | Breathlessness/dyspnea | 3.39 ± 1.58 | |
| 8th grade or less | 2.7 | Activity limitation | 2.41 ± 1.69 |
| High school, no diploma | 9.8 | Lack of confidence going out | 1.26 ± 1.59 |
| High school graduate or GED | 25.8 | Sleep problems | 1.72 ± 1.65 |
| College or technical school, no degree | 28.5 | Low energy | 2.63 ± 1.40 |
| College or technical school graduate | 24.8 | ||
| Master’s or Doctoral degree | 8.4 | HADS anxiety subscale, mean (SD) | 4.98 ± 3.71 |
| Income, % | HADS anxiety ≥8, % | 21.9 | |
| Under $15,000 | 30.5 | HADS depression subscale | 4.52 ± 3.41 |
| $15,000–35,000 | 25.9 | HADS depression ≥8, % | 19.7 |
| $35,000–50,000 | 12.8 | ||
| $50,000–75,000 | 9.8 | HADS items after UVAb, mean (SD) | |
| More than $75,000 | 7.5 | Tension/worries | 0.81 ± 0.61 |
| Decline to answer | 13.5 | Fear-panic | 0.57 ± 0.59 |
| Restlessness | 0.86 ± 0.79 | ||
| FEV1/FVC pre-bronchial | 0.53 ± 0.15 | Anhedonia | 0.58 ± 0.54 |
| Resting_SaO2 | 94.73 ± 3.65 | Sadness | 0.35 ± 0.52 |
| Number of medications for COPD | 2.14 ± 1.57 | Slowing | 1.49 ± 0.85 |
| Count of physical comorbidities, median (IQR)a | 3 (0–15) | ||
| Ever had any type of cancer, % | 25.6% | ||
| BMI, mean (SD) | 28.9 ± 6.7 | ||
| Distance walked (feet), mean (SD) | 1050 ± 427 | ||
From the original set of 14 items, redundant items were combined into six using Unique Variable Analysis (UVA) GED, General Educational Development test; HADS, Hospital Anxiety Depression scale; BMI, Body mass index.
Number of physical comorbidities other than COPD.
Table 2.
Weighed Adjacency Matrix of the network.
| Tension/worry | Fear/panic | Restlessness | Anhedonia | Sadness | Slowing | Cough | Phlegm | Chest tightness | Breathlessness | Activity limitations | Lack of confidence going out | Sleep problems | Low energy | |
|---|---|---|---|---|---|---|---|---|---|---|---|---|---|---|
| Tension/worry | 0.38 | 0.24 | 0.19 | 0.09 | −0.11 | 0.07 | ||||||||
| Fear/panic | 0.38 | 0.17 | 0.23 | 0.09 | ||||||||||
| Restlessness | 0.24 | 0.17 | 0.08 | 0.09 | −0.10 | |||||||||
| Anhedonia | 0.19 | 0.27 | 0.22 | 0.13 | 0.07 | |||||||||
| Sadness | 0.09 | 0.23 | 0.27 | 0.15 | 0.12 | 0.12 | ||||||||
| Slowing | 0.22 | 0.15 | 0.17 | 0.15 | −0.09 | 0.24 | ||||||||
| Cough | 0.12 | 0.59 | 0.07 | 0.10 | −0.09 | 0.14 | ||||||||
| Phlegm | 0.59 | 0.27 | ||||||||||||
| Chest tightness | 0.09 | 0.08 | 0.07 | 0.27 | 0.15 | 0.10 | 0.12 | 0.13 | ||||||
| Breathlessness | 0.17 | 0.10 | 0.15 | 0.39 | 0.09 | |||||||||
| Activity limitations | −0.11 | 0.15 | 0.10 | 0.39 | 0.38 | 0.24 | ||||||||
| Lack of confidence going out | 0.07 | 0.13 | −0.09 | −0.09 | 0.12 | 0.38 | 0.33 | |||||||
| Sleep problems | 0.09 | 0.14 | 0.13 | 0.33 | 0.16 | |||||||||
| Low energy | −0.10 | 0.07 | 0.12 | 0.24 | 0.09 | 0.24 | 0.16 |
Weighted Adjacency Matrix of the network. The cells report the values of edge weights for each pair of nodes. Nodes belonging to the same community are highlighted in the same color. Similarly, cells reporting edge weights of nodes from the same community are highlighted in the same color.
3.2. Network of anxiety, depressive and COPD symptoms
The 14 original HADS items were combined into 6 variables based on their redundancy (tension/worry, fear/panic, restlessness, anhedonia, sadness, slowing) (Table S1). Tension/worry is also termed “chronic anxiety” to underline the temporal and intensity difference with fear/panic (“acute anxiety”).
Nodes representing symptoms of anxiety, depression and COPD constituted a relatively dense network (39 out of 91, 43% of possible edges, Fig. 1). The nodes organized into five highly interconnected communities: 1) anxiety (including tension/worry, fear/panic and restlessness), 2) core depressive symptoms (anhedonia and sadness), 3) physical impairment (psychomotor slowing, low energy, breathlessness and activity limitation), 4) cough (cough and phlegm) and 5) “impact of respiratory problems” (lack of confidence going out, sleep problems and chest tightness). As expected, most connections were positive and strongest within each community. Moreover, nodes and communities representing typical COPD symptoms were highly inter-connected (e.g. symptoms in the physical impairment, cough and severe respiratory problems). In particular, cough and phlegm were closely connected to chest tightness, sleep problems and breathlessness, which in turn linked to items related to physical and activity limitations.
Fig. 1.
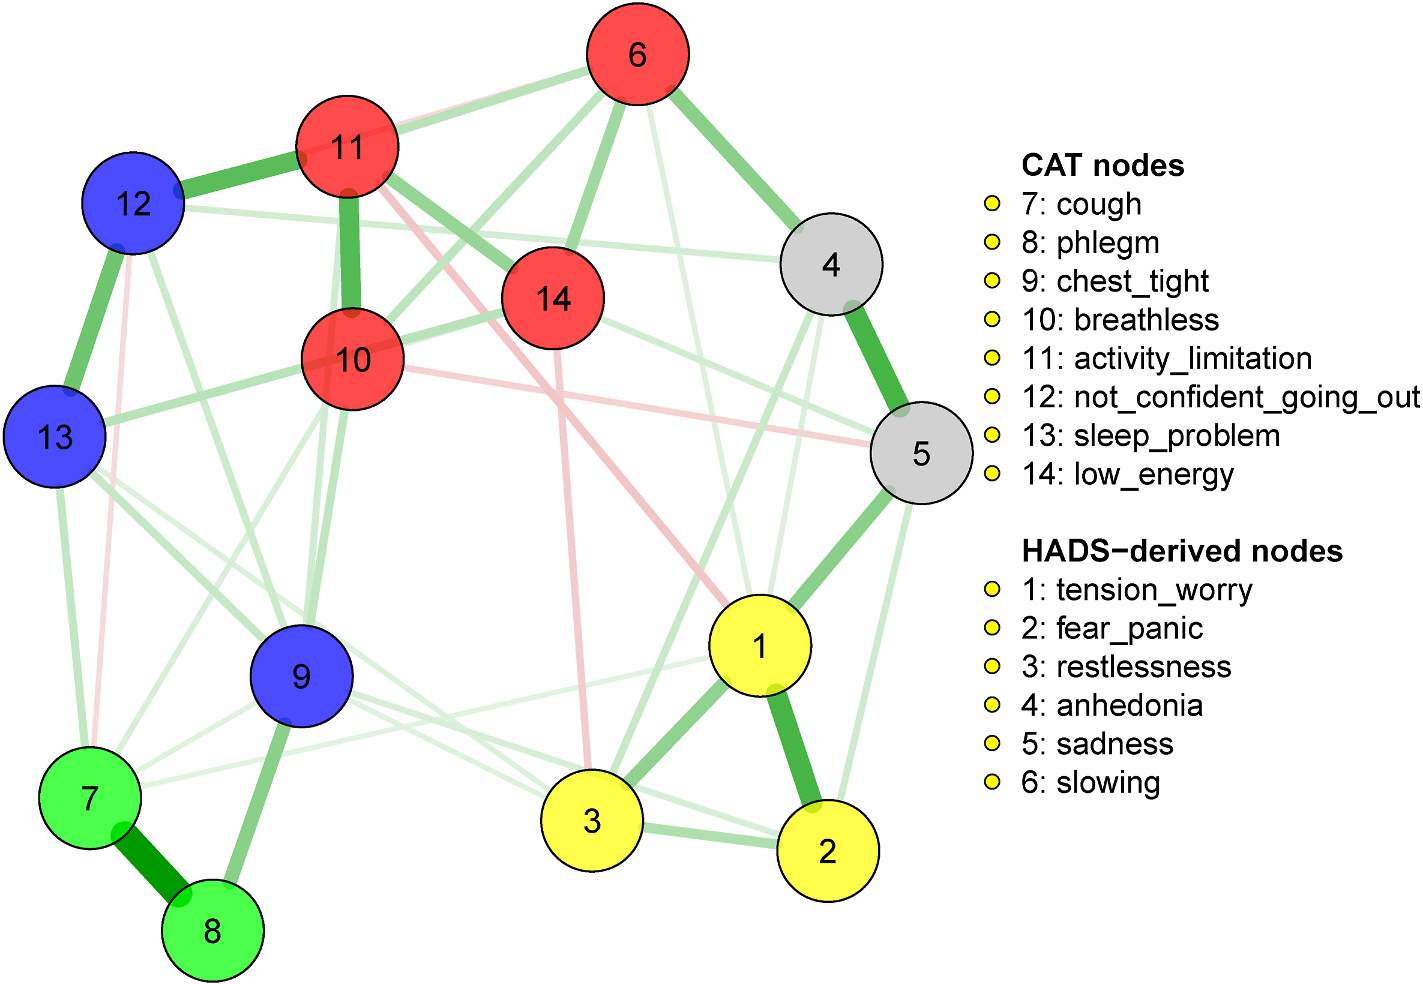
Network of COPD, anxiety and depressive symptoms.
Weighted Adjacency Matrix of the network. The cells report the values of edge weights for each pair of nodes. Nodes belonging to the same community are highlighted in the same color. Similarly, cells reporting edge weights of nodes from the same community are highlighted in the same color.
The most notable connections between COPD symptoms and manifestations of psychological distress was the community of anxiety symptoms strongly connecting with the community of “severe respiratory problems,” mainly through edges between fear/panic and chest tightness, between restlessness and chest tightness, and between restlessness and sleep problems. Core depressive symptoms connected to symptoms of the “physical impairment” community through low energy and slowness, while cough connected with sadness. Anxiety and depressive symptoms strongly reciprocally interconnected through edges between tension/worries and core depressive symptoms, and between fear/panic and sadness. Restlessness and low energy negatively connected, suggesting that among subjects displaying one of the two symptoms, the other was less severe.
The most central nodes in the network, contributing to the network activation, were activity limitation, lack of confidence going out, cough, tension-worry and low energy (Fig. S2). In addition, the network model explained a large share of variance (over 50%) of sadness, lack of confidence going out, activity limitation, chest tightness, and phlegm (Table S2).
3.3. Sensitivity analyses: sociodemographic characteristics and clinical parameters
Adding age, education and yearly income to the network did not affect the connections between anxiety, depressive and COPD symptoms (Table S3). Higher age associated with greater slowing and reduced severity of fear/panic and anhedonia. Higher education positively associated with sadness and slowing, and negatively with tension/worry. Income associated positively with sadness and restlessness, and negatively with fear/panic and anhedonia. In addition, after adjustment for sociodemographic features, chest tightness remained positively associated with fear/panic and restlessness, but a negative connection appeared with sadness.
Dividing the sample by sex yielded small-sized differences in symptom severity. Positive Standardized Mean Differences (SMDs) indicate more severe symptom among women than among men: activity limitations: 0.06; anhedonia: 0.02; breathlessness: 0.23; chest tightness 0.02; cough: 0.04; fear/panic: 0.25; low energy: 0.07; lack of confidence going out: 0.13; phlegm: −0.14; restlessness: −0.06; sadness: 0.07; sleep problems: 0.10; slowing: 0.03; tension/worry: 0.24. Sex was not associated with significant differences in the global network structure (JSD = 0.139, p = 0.196) but yielded a few significant differences in edge strength pairwise comparisons (Fig. 2, Fig. S3, Table S4). In particular, women presented a stronger connection between fear/panic and tension/worry than men. In addition, women presented a positive connection between restlessness and anhedonia, while men did not. Men did not present connections between activity limitations and tension/worry, while women presented a negative edge; men presented a connection between phlegm and low energy, while women did not (see Fig. 2).
Fig. 2.

Sex differences in symptom severity and connections
The left panel represents the mean score of HADS–derived symptoms and CAT symptoms compared by sex. Error bars represent Standard Errors. The right panel represent the sex differences of network structure, i.e. the differences in the strength of association between symptoms (edges connecting nodes). Edge differences represent male minus female edge strength. Thus, green (positive) edges indicate that the connection is significantly stronger in males than in females, while red (negative) edges indicate that the connection is significantly stronger in females than in males. HADS-derived (1–6). 1: tension/worries; 2: fear/panic; 3: restlessness; 4: anhedonia; 5: sadness; 6: slowing. CAT. 7: cough; 8: phlegm; 9: chest tightness; 10: breathlessness; 11: activity limitation; 12: lack of confidence going out; 13: sleep problems; 14: low energy.
Dividing the sample by ethnicity (white vs. African-Americans) yielded significant differences in global network level (JSD = 0.289, p < 0.001) and individual edges (Fig. S4, Table S5). White participants presented a stronger association between tension/worry and restlessness than African-Americans participants. Only African-Americans participants presented a positive connection between tension/worry and slowing and between fear/panic and anhedonia, while only white participants presented a positive connection between slowing and low energy.
Finally, we re-estimated the network adding clinical parameters, producing limited changes in the connections between anxiety, depressive and COPD symptoms (Fig. S5, Table S6). Specifically, the sadness connections with cough, slowing and low energy disappeared. Slowing connected with parameters related to COPD severity (FEV1/FVC and haemoglobin saturation), while cough connected with cigarette smoking. Anhedonia connected with BMI and cigarette smoking.
3.4. Illustrative simulation based on the network model
We used the network model to examine whether different profiles of COPD symptoms could lead to distinct predictions about anxiety or depressive symptoms. We selected the CAT score data from two randomly selected subjects with severe COPD (both with a CAT total score of 30). The first subject (nodes coloured in red) had dyspnoea and chest tightness at baseline, while the other subject (blue nodes) had more severe phlegm, sleep problems and lack of energy. Their data was imputed into the network model, to simulate a spread of activation across ten timepoints (Fig. 3). Higher activation of CAT nodes activated of other nodes in the network, corresponding to HADS symptoms, but with different patterns. After ten simulated timepoints, the first subject developed a profile characterized by slightly higher severity of fear/panic and restlessness, but lower levels of anhedonia and sadness than the second subject did. Thus, given different COPD symptoms, the network model yielded different predictions for the development of distinct anxiety or depressive symptoms.
Fig. 3.

Example of time-dependent changes in symptoms in two patients.
Illustrative example of predictions made using spreading activation in the network model for two distinct individuals (red and blue color) (Fig. 3). The network is “activated” at baseline by a specific profile of severity of COPD symptoms (upper left panel), and transmits the activation to other nodes (lower panels). The simulation runs for ten simulated timepoints (lower panels of the illustration). At the end of the simulation, the patients display distinguishable severity profiles for anxiety and depressive symptoms (upper right panel). Panel A. Network activation with the input CAT symptom profiles of subjects 1 and 2 at time 0. Panel B. Output symptom profile of HADS-derived symptoms at timepoint 10. COPD symptoms: 7: cough; 8: phlegm; 9: chest tightness; 10: breathlessness; 11: activity limitation; 12: lack of confidence going out; 13: sleep problems; 14: low energy. Anxiety and depressive symptoms (1–6): 1: tension/worries; 2: fear/panic; 3: restlessness; 4: anhedonia; 5: sadness; 6: slowing. Lower panel. Activation of the nodes across ten simulated timepoints. For ease of visualization, the figure depicts five timepoints (1, 3, 5, 7, 9) for one patient (red color) and five timepoints for the other (blue).
4. Discussion
This study examined the relationship between symptoms of COPD, anxiety and depression in a large, representative clinical sample, controlling for contextual and pathophysiological factors. Chest tightness linked to fear and panic, as symptoms of acute anxiety, while cough and COPD-related weakness were specifically connected to sadness and anhedonia. Persistent worries, in turn, linked the symptoms of anxiety and depression. Network analysis yielded personalized, testable predictions about symptoms at the interface between physical and mental diseases.
Our study suggests that symptoms of anxiety play a prominent role for COPD patients in terms of psychological distress, although with different patterns for acute or chronic symptoms (fear/panic vs. tension/worries, respectively). Acute anxiety, namely fear or panic, may be the response or trigger of dyspnoea, while chronic worries and tension denote mixed presentations encompassing both depressive and anxiety symptoms [30, 31]. Our findings extend the first network study in COPD, which found an association between the severity of dyspnoea and somatic depression symptoms (sleep problems, loss of energy) and between cognitive/emotional responses to dyspnoea and cognitive-affective depressive symptoms (feeling down/depressed/hopeless) [17]. Another symptom network approach suggested that a respiratory disease (asthma) specifically associated with a physical component of anxiety [11]. Our study employed the assessment of the main facets of anxiety and identified a crucial role for them in the reciprocal pathway between dyspnoea and depression [32]. Panic, in particular, commonly occurs in COPD patients, and derives from the appraisal of cardiorespiratory signals [33]. Interestingly, the relationship between chest tightness and panic in our study did not change when adjusting for objective indices of COPD severity, suggesting the link between dyspnoea and panic in COPD largely depends on subjective sensations [34,35]. Recent studies indeed show that anxiety critically depends on abnormal interoceptive sensitivity and distorted awareness of breathing perceptions, functions that subserved by brain activity in the anterior insula and periaqueductal grey [36,37].
Our findings further articulate the link between COPD and depressive symptoms [32,38]. Activity limitation and lack of confidence going out were highly central and may underlie chronic distress. In this study, activity limitations, lower physical energy levels and cough were the COPD features mostly connected with core depressive symptoms, i.e. sad mood and anhedonia. Adjusting the model for clinical parameters and COPD severity did not affect the link between sadness and anhedonia, but highlighted further connections between anhedonia, high BMI and cigarette use. This is consistent with the known link between anhedonia, metabolic and inflammatory abnormalities [39]. In contrast, the connection between activity limitations and sadness was no longer significant after adjusting for the severity of COPD and other comorbidities. Thus, sadness in COPD may depend on a demoralizing effect of disease severity that act mainly through weakness and disability [40,41]. Our further analysis in sex differences showed that women are most likely to have elevated symptom burden compared to men.
These findings are clinically relevant. The boundaries between physical and psychological symptoms are obscure, especially in patients suffering from chronic diseases such as COPD. Moreover, the link between COPD and psychological distress is bi-directional and implies a substantive worsening in COPD symptoms, and conversely COPD increases the risk of depression and mortality [8,38]. Thus, addressing the complexity of psychosomatic interactions with a symptom-specific network approach seems a crucial step to understand both respiratory and psychological dysfunction in COPD. Our network model findings may be extended to provide individualized predictions, as highlighted by our purposefully selected examples, and this could ultimately result in improvements of treatment choices. According to the predicted symptoms, in fact, one may establish optimal indications to intervene with effective treatments for patients with acute or chronic anxiety, or depression. Given the close relationship with dyspnoea, acute anxiety may preferentially respond to pulmonary rehabilitation protocols [42], or medications to improve lung functions [43]. In contrast chronic anxiety, core depressive symptoms, weakness or activity limitations may benefit more from psychotherapy [44] physical exercise or behavioural activation [45]. Our findings also prompt the need to improve the precision of psychological measurements in COPD patients, especially of symptoms that play a crucial role in the economy of the network. Their assessment should be even more detailed, for instance including instrumental evaluations or tasks based on novel computational paradigms [36].
Our study is strengthened by a large sample size and robust data analysis. Including symptoms of anxiety and relevant covariates allowed the most reliable associations to be identified and used to illustrate clinically relevant predictions. However, the study has limitations. Network analyses conducted on cross-sectional data do not provide indications on the direction of effects. In addition, they represent inter-subject, rather than intra-subject variability. Such associations are consistent with longitudinal observations [46,47], but caution is needed before drawing causal inferences at the individual level [12]. Similarly, our illustrative example must be taken with caution. Future studies should in particular extend the assessments to other clinically relevant dimensions, such as suicidal ideation [48,49] and cognitive dysfunction [50].
In conclusion, network analyses highlighted that chest-tightness specifically related to acute anxiety, while cough and COPD-related weakness connected with core depressive symptoms. Chronic anxiety connected acute anxiety and depressive symptoms. The network approach yields testable predictions about the evolution of anxiety and depression in COPD and could aid clinicians to tailor treatment strategies.
Supplementary Material
Acknowledgements
Guarantor statement:
AMY has full access to all of the data in the study and takes responsibility for the integrity of the data and the accuracy of the data analysis.
Funding
The project described was supported by Award Number U01 HL089897 and Award Number U01 HL089856 from the National Heart, Lung, and Blood Institute. The content is solely the responsibility of the authors and does not necessarily represent the official views of the National Heart, Lung, and Blood Institute or the National Institutes of Health. COPDGene is also supported by the COPD Foundation through contributions made to an Industry Advisory Board that has included AstraZeneca, Bayer Pharmaceuticals, Boehringer-Ingelheim, Genentech, GlaxoSmithKline, Novartis, Pfizer, and Sunovion.
We are most grateful to all the centerers who participated in the data collection for the COPDGene study. http://www.copdgene.org/
Abbreviations:
- AECOPD
Acute Exacerbation of Chronic Obstructive Pulmonary Disease
- BMI
Body Mass Index
- COPD
Chronic Obstructive Pulmonary Disease
- CAT
COPD Assessment Test
- HADS
Hospital Anxiety Depression Scale
- FEV1
Forced Expiratory Volume in One Second
- mMRC
modified Medical Research Council scale
- UVA
Unique Variable Analysis
Footnotes
Declaration of competing interest
AMY, ABM, KFH, EAR, AI, SPB, VK, GLK, RAW, MNE and NAH have no conflict of interest to report in relation to this study.
The COPDGene study (NCT00608764) is also supported by the COPD Foundation through contributions made to an Industry Advisory Committee comprised of AstraZeneca, Boehringer-Ingelheim, GlaxoSmithKline, Novartis, and Sunovion.
Prior abstract publication/presentation
American Thoracic Society 2021 International Conference, 5/17/2021, San Diego, CA.
CRediT authorship contribution statement
Abebaw M. Yohannes: Data curation, Formal analysis, Writing – original draft, Writing – review & editing, has full access to all of the data in the study and takes responsibility for the integrity of the data and the accuracy of the data analysis. Martino Belvederi Murri: Data curation, Formal analysis, have equally contributed to, Conceptualization, of the data analysis plan, wrote the initial draft manuscript preparation, interpretation and the writing-up of the manuscript and reviewing the final submission. ABM performed the data analysis. Nicola A. Hanania: Writing – review & editing, contributed substantially to the study research design, and interpretation, and the writing-up of the manuscript and reviewing the final submission. Elizabeth A. Regan: Writing – review & editing, contributed substantially to the study research design, and interpretation, and the writing-up of the manuscript and reviewing the final submission. Anand Iyer: Writing – review & editing, contributed substantially to the study research design, and interpretation, and the writing-up of the manuscript and reviewing the final submission. Surya P. Bhatt: Writing – review & editing, contributed substantially to the study research design, and interpretation, and the writing-up of the manuscript and reviewing the final submission. Victor Kim: Writing – review & editing, contributed substantially to the study research design, and interpretation, and the writing-up of the manuscript and reviewing the final submission. Gregory L. Kinney: Writing – review & editing, contributed substantially to the study research design, and interpretation, and the writing-up of the manuscript and reviewing the final submission. Robert A. Wise: Writing – review & editing, contributed substantially to the study research design, and interpretation, and the writing-up of the manuscript and reviewing the final submission. Michelle N. Eakin: Writing – review & editing, contributed substantially to the study research design, and interpretation, and the writing-up of the manuscript and reviewing the final submission. Karin F. Hoth: Writing – review & editing, contributed substantially to the study research design, and interpretation, and the writing-up of the manuscript and reviewing the final submission.
Appendix A. Supplementary data
Supplementary data to this article can be found online at https://doi.org/10.1016/j.rmed.2022.106865.
References
- [1].Yohannes AM, Baldwin RC, Connolly MJ, Mood disorders in elderly patients with chronic obstructive pulmonary disease, Rev. Clin. Gerontol. 10 (2) (2000) 193–202, 10.1017/S0959259800002100. [DOI] [Google Scholar]
- [2].Matte DL, Pizzichini MMM, Hoepers ATC, et al. , Prevalence of depression in COPD: a systematic review and meta-analysis of controlled studies, Respir. Med. 117 (2016) 154–161, 10.1016/j.rmed.2016.06.006. [DOI] [PubMed] [Google Scholar]
- [3].Iyer AS, Bhatt SP, Garner JJ, Wells JM, Trevor JL, Patel NM, Kirkpatrick D, Williams JC, Dransfield MT, Depression is associated with readmission for acute exacerbation of chronic obstructive pulmonary disease, Ann.Am. Thorac. Soc. 13 (2) (2016) 197–203. [DOI] [PMC free article] [PubMed] [Google Scholar]
- [4].Singh G, Zhang W, Kuo Y-F, Sharma G, Association of psychological disorders with 30-day readmission rates in patients with COPD, Chest 149 (4) (2016) 905–915. [DOI] [PMC free article] [PubMed] [Google Scholar]
- [5].Vikjord SAA, Brumpton BM, Mai X-M, Vanfleteren L, Langhammer A, The association of anxiety and depression with mortality in a COPD cohort. The HUNT study, Norway, Respir. Med. 171 (2020), 106089. [DOI] [PubMed] [Google Scholar]
- [6].Maurer J, Rebbapragada V, Borson S, et al. , Anxiety and depression in COPD: current understanding, unanswered questions, and research needs, in: Chest, vol. 134, American College of Chest Physicians, 2008, pp. 43S–56S, 10.1378/chest.08-0342, 134 (suppl. 4). [DOI] [PMC free article] [PubMed] [Google Scholar]
- [7].Belvederi Murri M, Triolo F, Coni A, et al. , Instrumental assessment of balance and gait in depression: a systematic review, Psychiatr. Res. 284 (2020. Feb) 112687, 10.1016/j.psychres.2019.112687. [DOI] [PubMed] [Google Scholar]
- [8].Yohannes AM, Alexopoulos GS, Depression and anxiety in patients with COPD, Eur. Respir. Rev. 23 (2014) 345–349. [DOI] [PMC free article] [PubMed] [Google Scholar]
- [9].Fried EI, The 52 symptoms of major depression: lack of content overlap among seven common depression scales, J. Affect. Disord. 208 (2017) 191–197. [DOI] [PubMed] [Google Scholar]
- [10].Borsboom D, A network theory of mental disorders, World Psychiatr. 16 (2017) 5–13, 10.1002/wps.20375. [DOI] [PMC free article] [PubMed] [Google Scholar]
- [11].Isvoranu AM, Abdin E, Chong SA, et al. , Extended network analysis: from psychopathology to chronic illness, BMC Psychiatr. 21 (2021) 1–9, 10.1186/s12888-021-03128-y. [DOI] [PMC free article] [PubMed] [Google Scholar]
- [12].Borsboom D, Deserno MK, Rhemtulla M, et al. , Network analysis of multivariate data in psychological science, Nat Rev Methods Prim 1 (2021), 10.1038/s43586-021-00055-w. [DOI] [Google Scholar]
- [13].Fried EI, von Stockert S, Haslbeck JMB, et al. , Using network analysis to examine links between individual depressive symptoms, inflammatory markers, and covariates, Psychol. Med. (2019) 1–9, 10.1017/s0033291719002770. [DOI] [PubMed] [Google Scholar]
- [14].Robinaugh DJ, Hoekstra RHA, Toner ER, et al. , The network approach to psychopathology: a review of the literature 2008–2018 and an agenda for future research, Psychol. Med. 50 (2020) 353–366, 10.1017/S0033291719003404. [DOI] [PMC free article] [PubMed] [Google Scholar]
- [15].Golino HF, Epskamp S, Exploratory graph analysis: a new approach for estimating the number of dimensions in psychological research, PLoS One 12 (6) (2017. Jun 8), e0174035, 10.1371/journal.pone.0174035. [DOI] [PMC free article] [PubMed] [Google Scholar]
- [16].Triolo F, Harber-Aschan L, Belvederi Murri M, et al. , The complex interplay between depression and multimorbidity in late life: risks and pathways, Mech. Ageing Dev. 192 (2020. Dec), 111383, 10.1016/j.mad.2020.111383. [DOI] [PubMed] [Google Scholar]
- [17].Schuler M, Wittmann M, Faller H, et al. , The interrelations among aspects of dyspnea and symptoms of depression in COPD patients – a network analysis, J. Affect. Disord. 240 (2018) 33–40, 10.1016/j.jad.2018.07.021. [DOI] [PubMed] [Google Scholar]
- [18].Regan EA, Hokanson JE, Murphy JR, et al. , Genetic epidemiology of COPD (COPDGene) study design, COPD 7 (1) (2010) 32–43, 10.3109/15412550903499522. [DOI] [PMC free article] [PubMed] [Google Scholar]
- [19].Bjelland I, Dahl AA, Haug TT, Neckelmann D, The validity of the Hospital Anxiety and Depression Scale: an updated literature review, J. Psychosom. Res. 52 (2) (2002) 69–77, 10.1016/S0022-3999(01)00296-3. [DOI] [PubMed] [Google Scholar]
- [20].Jones PW, Harding G, Berry P, Wiklund I, Chen W-H, Leidy NK, Development and first validation of the COPD assessment test, Eur. Respir. J. 34 (3) (2009) 648–654, 10.1183/09031936.00102509. [DOI] [PubMed] [Google Scholar]
- [21].Putcha N, Puhan MA, Drummond MB, et al. , A simplified score to quantify comorbidity in COPD, PLoS ONE. 9 (12) (2014; Dec 16), e114438, 10.1371/journal.pone.0114438. [DOI] [PMC free article] [PubMed] [Google Scholar]
- [22].Epskamp S, Psychometric network models from time-series and panel data, Psychometrika 85 (1) (2020) 206–231, 10.1007/s11336-020-09697-3. [DOI] [PMC free article] [PubMed] [Google Scholar]
- [23].Christensen AP, Garrido LE, Golino H, Unique variable analysis: a novel approach for detecting redundant variables in multivariate data, PsyArXiv (2020. December 23), 10.31234/OSF.IO/4KRA2. [DOI] [Google Scholar]
- [24].Williams DR, Mulder J, BGGM : a R package for Bayesian Gaussian graphical models, PsyArXiv (2019), 10.31234/osf.io/3b5hf. [DOI] [Google Scholar]
- [25].Williams DR, Bayesian estimation for Gaussian graphical models: structure learning, predictability, and network comparisons, 2018, pp. 1–17, 10.31234/osf.io/x8dpr, 1. [DOI] [PubMed] [Google Scholar]
- [26].Isvoranu A-M, Epskamp S Which estimation method to choose in network psychometrics? Deriving Guidelines for Applied Researchers. PsyArXiv January 26; doi: 10.31234/OSF.IO/MBYCN. [DOI] [PubMed] [Google Scholar]
- [27].Epskamp S, Cramer AOJ, Waldorp LJ, Schmittmann VD, Borsboom D, Qgraph : network visualizations of relationships in psychometric data, J. Stat. Software 48 (4) (2012) 1–18, 10.18637/jss.v048.i04. [DOI] [Google Scholar]
- [28].Golino H, Christensen AP, Golino H, Christensen AP, EGAnet: exploratory Graph Analysis: a framework for estimating the number of dimensions in multivariate data using network psychometrics, R Package Version 0.9.8, https://cran.r-project.org/package=EGAnet, 2021. [Google Scholar]
- [29].Haslbeck JMB, Waldorp LJ, How well do network models predict observations? On the importance of predictability in network models, Behav. Res. Methods 50 (2) (2018) 853–861, 10.3758/s13428-017-0910-x. [DOI] [PMC free article] [PubMed] [Google Scholar]
- [30].Kaiser T, Herzog P, Voderholzer U, Brakemeier EL, Unraveling the comorbidity of depression and anxiety in a large inpatient sample: network analysis to examine bridge symptoms, Depress. Anxiety 38 (3) (2021) 307–317, 10.1002/da.23136. [DOI] [PubMed] [Google Scholar]
- [31].Groen RN, Ryan O, Wigman JTW, et al. , Comorbidity between depression and anxiety: assessing the role of bridge mental states in dynamic psychological networks, BMC Med. 18 (1) (2020), 10.1186/s12916-020-01738-z. [DOI] [PMC free article] [PubMed] [Google Scholar]
- [32].Atlantis E, Fahey P, Cochrane B, Smith S, Bidirectional associations between clinically relevant depression or anxiety and COPD: a systematic review and meta-analysis, Chest 144 (3) (2013) 766–777. [DOI] [PubMed] [Google Scholar]
- [33].Livermore N, Sharpe L, McKenzie D, Panic attacks and panic disorder in chronic obstructive pulmonary disease: a cognitive behavioral perspective, Respir. Med. 104 (9) (2010) 1246–1253, 10.1016/j.rmed.2010.04.011. [DOI] [PubMed] [Google Scholar]
- [34].Chang AS, Munson J, Gifford AH, Mahler DA, Prospective use of descriptors of dyspnea to diagnose common respiratory diseases, Chest 148 (4) (2015) 895–902, 10.1378/chest.15-0308. [DOI] [PubMed] [Google Scholar]
- [35].Miravitlles M, Ribera A, Understanding the impact of symptoms on the burden of COPD, Respir. Res. 18 (1) (2017), 10.1186/s12931-017-0548-3. [DOI] [PMC free article] [PubMed] [Google Scholar]
- [36].Harrison OK, Nanz L, Marino S, et al. , Interoception of breathing and its relationship with anxiety, Neuron 109 (24) (2021) 4080–4093. [DOI] [PMC free article] [PubMed] [Google Scholar]
- [37].Allen M, Varga S, Heck DH. Respiratory rhythms of the predictive mind. PsyArXiv, August 5. doi: 10.31234/osf.io/38bpw. [DOI] [PubMed] [Google Scholar]
- [38].Yohannes AM, Management of anxiety and depression in patients with COPD, Expet Rev. Respir. Med. 2 (3) (2008) 337–347, 10.1586/17476348.2.3.337. [DOI] [PubMed] [Google Scholar]
- [39].Milaneschi Y, Lamers F, Berk M, Penninx BWJH, Depression heterogeneity and its biological underpinnings: toward immunometabolic depression, Biol. Psychiatr. 88 (5) (2020) 369–380, 10.1016/j.biopsych.2020.01.014. [DOI] [PubMed] [Google Scholar]
- [40].Gleason OC, Pierce AM, Walker AE, Warnock JK, The two-way relationship between medical illness and late-life depression, Psychiatr. Clin. 36 (4) (2013) 533–544, 10.1016/j.psc.2013.08.003. [DOI] [PubMed] [Google Scholar]
- [41].Belvederi Murri M, Caruso R, Ounalli H, et al. , The relationship between demoralization and depressive symptoms among patients from the general hospital: network and exploratory graph analysis: demoralization and depression symptom network, J. Affect. Disord. 276 (2020) 137–146, 10.1016/j.jad.2020.06.074. [DOI] [PubMed] [Google Scholar]
- [42].Gordon CS, Waller JW, Cook RM, Cavalera SL, Lim WT, Osadnik CR, Effect of pulmonary rehabilitation on symptoms of anxiety and depression in COPD: a systematic review and meta-analysis, Chest 156 (1) (2019) 80–91, 10.1016/j.chest.2019.04.009. [DOI] [PubMed] [Google Scholar]
- [43].O’Donnell DE, Webb KA, Harle I, Neder JA, Pharmacological management of breathlessness in COPD: recent advances and hopes for the future, Expet Rev. Respir. Med. 10 (7) (2016) 823–834, 10.1080/17476348.2016.1182867. [DOI] [PubMed] [Google Scholar]
- [44].Baraniak A, Sheffield D, The efficacy of psychologically based interventions to improve anxiety, depression and quality of life in COPD: a systematic review and meta-analysis, Patient Educ. Counsel. 83 (1) (2011) 29–36, 10.1016/j.pec.2010.04.010. [DOI] [PubMed] [Google Scholar]
- [45].Alexopoulos GS, Raue PJ, Banerjee S, et al. , Comparing the streamlined psychotherapy “Engage” with problem-solving therapy in late-life major depression. A randomized clinical trial, Mol. Psychiatr. 26 (9) (2021) 5180–5189, 10.1038/s41380-020-0832-3. [DOI] [PMC free article] [PubMed] [Google Scholar]
- [46].L von Klipstein D, Arntz Borsboom, A, The exploratory value of cross-sectional partial correlation networks: predicting relationships between change trajectories in borderline personality disorder, in: Oathes DJ(Ed.), PLoS One 16 (7) (2021), e0254496, 10.1371/JOURNAL.PONE.0254496. [DOI] [PMC free article] [PubMed] [Google Scholar]
- [47].Miers AC, Weeda WD, Blöte AW, Cramer AOJ, Borsboom D, Westenberg PM, A cross-sectional and longitudinal network analysis approach to understanding connections among social anxiety components in youth, J. Abnorm. Psychol. 129 (1) (2020) 82–91, 10.1037/ABN0000484. [DOI] [PubMed] [Google Scholar]
- [48].Belvederi Murri M, Grassi L, Caruso R, et al. , Depressive symptom complexes of community-dwelling older adults: a latent network model, Mol. Psychiatr. (2021), 10.1038/S41380-021-01310-Y. [DOI] [PubMed] [Google Scholar]
- [49].Belvederi Murri M, Amore M, Respino M, et al. , The symptom network structure of depressive symptoms in late-life: results from a European population study, Mol. Psychiatr. (2018) 1, 10.1038/s41380-018-0232-0. [DOI] [PubMed] [Google Scholar]
- [50].Yohannes AM, Cognitive impairment and risk for disability in chronic obstructive pulmonary disease, Ann Am Thorac Soc 11 (9) (2014) 1445–1446, 10.1513/AnnalsATS.201410-444ED. [DOI] [PubMed] [Google Scholar]
Associated Data
This section collects any data citations, data availability statements, or supplementary materials included in this article.