

Abstract
Sulfur has a particularly rich biochemistry, and fills a number of important roles in biology. In situ information on sulfur biochemistry is generally difficult to obtain because of a lack of biophysical techniques that have sufficient sensitivity to molecular form. We have recently reported that sulfur K-edge X-ray absorption spectroscopy can be used as a direct probe of the sulfur biochemistry of living mammalian cells [Gnida et al., (2007) Biochemistry 46, 14735-41]. Here we report an extension of this work and develop sulfur K-edge X-ray fluorescence spectroscopic imaging as an in vivo probe of sulfur metabolism in living cells. For this work we have chosen onion (Allium cepa) as a tractable model system with well developed sulfur biochemistry, and present evidence of the localization of a number of different chemical forms. X-ray absorption spectroscopy of onion sections showed increased levels of lachrymatory factor (LF) and thiosulfinate and decreased levels of sulfoxide (LF precursor) following cell breakage. In intact cells, X-ray fluorescence spectroscopic imaging showed elevated levels of sulfoxides in the cytosol, and elevated levels of reduced sulfur in the central transport vessels and bundle sheath cells.
Biochemistry revolves around the chemistry of carbon (1), but many other elements have vital functions which are now becoming understood. For example, our understanding of the function of phosphorus in cellular processes has been revolutionized by the availability of an elegant spectroscopic probe, 31P NMR. This tool, which can detect the majority of phosphorus species present in living systems, has provided information on metabolic functions of phosphorus in healthy and diseased tissue (2,3), and is now being used in clinical settings (2,3,4).
Sulfur is another vitally important element, with roles in structure, catalysis and metabolism in all organisms. To list just a few specific human examples, taurine is used for osmoregulation (5,6), homocysteinemia, together with low S-adenosyl methionine levels, has been implicated in coronary artery (7,8) and atherosclerotic disease (9), and oxidation of methionine to methionine sulfoxide in lung α2-antiplasmin has been implicated in development of emphysema, particularly in cigarette smokers (10,11). Unfortunately, sulfur lacks a well established spectroscopic probe, and is often called a spectroscopically silent element. The low natural abundance, weak magnetic moment and significant nuclear electric quadrupole moment of 33S combine to make 33S NMR challenging, and it is not widely used (12,13). Fortunately the richness of the sulfur K-edge X-ray absorption near-edge spectroscopy has become apparent, with a chemical shift range spanning more than 14 eV (14). It has been successfully used in speciating complex mixtures of sulfur in fossil fuels (14,15,16) and soils (17,18). In biological systems it has been used to understand sulfur metabolism in bacterial cultures (19,20), as a probe of the electronic structure of sulfur-containing metalloproteins (21), of the biochemistry of ascidian blood (22), of plant and fungal tissues (23,24), of mammalian blood (25), and of cultures of mammalian cells (6). The work described herein seeks to develop sulfur K-edge X-ray fluorescence spectroscopic imaging as an in vivo probe of sulfur metabolism in living cells. While our ultimate goal is to image mammalian systems (6), these represent less than ideal systems for technique development. Therefore we have chosen onion (Allium cepa) as a more tractable model system with well developed sulfur biochemistry (26), yet with some unanswered questions.
The sulfur biochemistry of onion is responsible both for its well-known flavorant chemistry, and for onion’s equally familiar but less desirable lachrymatory properties (26). The latter is due to production of reactive propanethial S-oxide, commonly known as the “lachrymatory factor” or LF, which is produced when cells are broken. Both flavorants and LF arise from the same original precursor molecule (Figure 1), S-(1-propenyl)cysteine sulfoxide. Upon cell breakage and the mixing of the cell compartments, the enzyme alliinase converts the stored precursor to highly reactive 1-propenesulfenic acid. This latter intermediate then decomposes by a number of pathways, producing the milieu of flavorant molecules that give onion its characteristic taste and odor. Interestingly, the LF is not produced from a spontaneous reaction of the sulfenic acid but rather by action of a specific enzyme, LF synthase (27,28). Although the reactions taking place upon cell breakage are well understood (26), the subcellular locations of the precursor sulfoxide and the alliinase enzyme remain a mystery. While clearly partitioned, determining their location is difficult using traditional methods of analysis which can require the breakage of cells after which the reaction proceeds rapidly. Lancaster and Collin (29) have studied isolated protoplasts and cellular vacuoles, and found that the vacuoles exhibited alliinase activity while the alkyl cysteine sulfoxide precursor is present in the protoplasts. This study indicated that the sulfoxide precursor and the alliinase enzyme are located in the cell vacuole and cytosol, respectively. Yamazaki et al. (30) later used immunofluorescent labeling to demonstrate that alliinase is preferentially localized in bundle sheath cells.
Figure 1.

Schematic of onion biochemistry. γ-Glutamyl-(S-1-propenyl)cysteine 1 is converted by oxidation to a stored sulfoxide precursor γ-Glutamyl-(S-1-propenyl)cysteine sulfoxide 2. This is converted via a γ-Glutamyl transpeptidase to S-(1-propenyl)cysteine sulfoxide 3 which in turn is converted by alliinase to 1-propenesulfenic acid 4, which is converted by LF synthase to the lachrymatory factor (propanethial S-oxide) 5.
Here we use X-ray fluorescence spectroscopic imaging to generate maps of different chemical forms of sulfur. The sample is raster scanned in a microfocus X-ray beam at a number of different incident energies to give sensitivity to different sulfur chemical forms (31,32). Chemically sensitive X-ray fluorescence spectroscopic imaging is increasingly used, although most reported work is qualitative and quantitative treatments (31,32) are still uncommon. The sulfur X-ray fluorescence is monitored, and with information about the spectra of standard solution species, the information is converted to quantitative maps of the different chemical forms. To our knowledge, this is the first application of fluorescence X-ray spectroscopic imaging to produce quantitative maps of dilute biological samples at the sulfur K-edge.
MATERIALS AND METHODS
Sample Preparation
Solutions were enclosed in plastic sample holders with 6 μm polypropylene windows. Onion (Allium cepa) specimens (mature yellow onion, red onion and seedling “green” or “spring” onion) were purchased from local markets and stored under ambient conditions; samples were prepared by sectioning with a new microtome blade for each sample. Sections were washed with deionized water to remove the residue of cut cells and sandwiched between two 6 μm polypropylene windows.
Choice of model compounds
Model compounds were either commercially available species or synthesized in Albany. Commercially available species (oxidized and reduced glutathione, methionine, taurine etc.) were the highest available purity reagents available and used as received from the vendor. In some cases the natural products were not readily synthesized. In these cases we selected more readily prepared models which were expected to be spectroscopically similar due to the similarity of the local sulfur environment. Thus, we selected methyl 1-propenyl sulfoxide as an analogue of S-(1-propenyl)cysteine sulfoxide, and methyl methanethiosulfinate as a model for all of the thiosulfinate compounds formed when onion cells are broken. We note that a plethora of other more minor sulfur species are also formed (e.g., zwiebelanes), but all have an S=O bond, and should have similar spectra to methyl 1-propenyl sulfoxide. Standard compounds were prepared as solutions at concentrations between 50 and 100 mM at which level there is negligible spectroscopic distortion from fluorescence self-absorption artifacts (19). Most solutions were aqueous (at neutral pH in appropriate sulfur-free buffers), except for methyl methanethiosulfinate for which acetonitrile was used as the solvent.
Data Acquisition
All sulfur K-edge X-ray absorption data were collected at the Stanford Synchrotron Radiation Lightsource using beamline 6-2 employing a Si(111) double crystal monochromator, as previously described (6). For both bulk and microfocus data the entire beam path from entry to hutch to the fluorescence detector window was purged with helium, with the exception of the space immediately before the sample. The plant samples were maintained in air, with a gap of either 1 mm or 100 μm between the sample and the window of the helium flight path for bulk XAS or imaging experiments, respectively. Placing the samples in air allows normal cell respiration and facilitates rapid sample changes as no additional purging of the helium atmosphere is required. Phase-contrast microscopic examination of the samples following measurements clearly showed cytoplasmic streaming (indicating that the cells were living); however, this was not observed when samples were maintained in helium (indicating dead cells).
Bulk X-ray Absorption Spectroscopy
Sulfur K-edge X-ray absorption near-edge spectra were collected as previously described (6). Briefly, an incident beam size of approximately 1 mm × 8 mm was used and the incident intensity was monitored using an upstream helium-filled ion chamber. The sample was placed at 45° to the incident beam and the fluorescence intensity was measured using a nitrogen-filled Stern-Heald-Lytle fluorescence ion chamber at 90° to the incident beam.
Microfocus Equipment
Sulfur K-edge micro X-ray fluorescent imaging and micro X-ray absorption spectroscopic data were collected using a custom-built microfocus setup (see supplementary material). The optics were enclosed in a helium filled flight path and a microfocus beam of 12 μm diameter was produced using a tapered metal monocapillary optic (33,34). The incident beam intensity was measured upstream of the capillary optic using a helium-filled ion chamber. The sample was placed normal to the incident beam and within about 100 μm of the capillary outlet. A Stern-Heald-Lytle fluorescence ion chamber detector filled with nitrogen gas was placed at approximately 135° to the incident beam to measure the total X-ray emission (fluorescence and scatter) from the front of the sample. An optical microscope was positioned directly in line with the X-ray beam downstream of the sample, so as to view the sample from the rear.
Image Analysis
X-ray fluorescence spectroscopic imaging data acquisition involves recording images at several different energies chosen to be sensitive to different chemical forms within the sample. Here we chose six energies, corresponding to a background intensity (2465.0 eV), a measure of the total sulfur (2495.0 eV) and four energies chosen to be close to the spectral peak of aqueous solutions of oxidized glutathione (representative of organic disulfide, 2469.88 eV), methionine (representative of organic sulfide, 2470.55 eV), methyl 1-propenyl sulfoxide (representative of sulfoxide, 2473.59 eV) and sulfate at 2479.58 eV, respectively (see Figure 2).
Figure 2.

Schematic showing X-ray fluorescence spectroscopic imaging analysis. The upper panel shows the sulfur K-edge spectra of standard solutions used to analyze the data, together with markers are shown at the incident energies for images (a) background, (b) disulfides, (c) sulfides, (d) sulfoxides, (e) sulfate, and (f) total sulfur. The inset shows an expanded energy scale in the region of (b) disulfides and (c) sulfides, illustrating the spectroscopic discrimination between these forms. Raw fluorescence intensity maps F(E), corresponding to the incident energies are shown below the spectra, followed by processed maps showing molar amounts mi of the individual chemical species.
To a reasonable approximation, the observed total intensity T(E) (fluorescence ion chamber normalized to the incident beam intensity) at a given incident X-ray energy E can be simply expressed as the sum of two components, F(E) the fluorescence signal of interest and B(E) a background:
| (1) |
In eq. 1 we assume that energy-dependent processes which might affect the fluorescence intensity, such as depth of penetration of the beam into the sample, or fluorescence yield (20), have negligible variation over the short energy range of the experiment, which in our case is a reasonable assumption. The background B(E) consists of scattered photons (both elastic and inelastic) together with fluorescent photons from lower energy excitations of sulfur (in this specific case), and any excited levels from other elements in the sample (predominantly C, N, O, H). Assuming that the energy range of the experiment does not encompass any absorption edges other than that of the element of interest (in our case sulfur), then the intensities of these background processes vary smoothly as a function of energy and, over the narrow energy range of the near-edge, B(E) can be approximated as a polynomial function of the X-ray energy, E:
| (2) |
where B0, B1 etc are constants. In this experiment the short energy ranges meant that the background is adequately modeled by a straight line, and only the first two terms of the polynomial (eq. 2; B0 and B1) were used, although higher order polynomials could be employed if needed.
In hard X-ray XAS imaging a solid-state energy-dispersive detector is generally used, in which case these background photons are fairly readily separated from the fluorescence of interest. This works well at higher energies because the fluorescent line (usually the Kα) is well separated from the elastic scatter line (31,32), although there may still be overlap with the inelastic scatter, which extends to energies below the elastic scatter. At the lower energy of the sulfur K-edge the separation between elastic scatter and S Kα fluorescence is almost an order of magnitude smaller than with the hard X-ray case, being only about 160 eV which is sufficiently small that the fluorescence and scatter cannot be adequately resolved by conventional solid-state dispersive detectors. Thus these have no advantages at these lower energies and non-dispersive detectors are typically employed.
The fluorescence component at a given energy, F(E), can be viewed as the sum of contributions from all the different forms of sulfur in the sample. The individual contribution of a given sulfur form i will depend on the molar amount (mi) of that sulfur form sampled by the beam. It also depends on Ii(E), the normalized fluorescent intensity of the spectrum of sulfur form i at energy E. The values of Ii(E) are obtained by measuring the X-ray absorption spectrum of dilute aqueous standards of the components i. These standard spectra are then background subtracted and normalized according to established procedures. Including a constant of proportionality ks, the fluorescence component F(E) at a given energy E can be expressed by:
| (3) |
A series of equations (eq. 3) will be expressed, with different values of Ii(E), for each incident energy used. All sulfur forms contribute essentially equally to the intensity at energies that are well above the absorption edge. However, close to or at the absorption edge itself the near-edge structure shows considerable variation and the intensity at a given energy will be different for each component. Below the absorption edge, the fluorescence contribution will be negligible and the intensity equals the value of the background function at that energy B(E).
The equations can be solved by matrix inversion to yield mi, the molar amount of species i present at each pixel, which can then easily be converted to give the fraction fi of each species:
| (4) |
It can be seen that the determination of the molar amount mi is dependent on measurements at all energies, rather than just on the measurement corresponding to the maximum of intensity of that component. This allows the separation of species whose spectra show quite a degree of overlap but which still show enough distinction that energies can be chosen to confer chemical sensitivity (e.g. Figure 2 inset). This method assumes that we know a priori the chemical forms present in a sample, so this type of imaging must always be preceded by careful bulk spectroscopic speciation measurements.
Specialized data acquisition and analysis software were developed for these experiments. The acquisition software is comprised of two programs, a compact data collector program and a more sophisticated graphical user interface (GUI), both of which access the data in shared memory (34). Such architecture is common in modern data analysis and means that the system is essentially crash-proof, so that if the more complex GUI program crashes then the collector will continue unaffected. The GUI program can subsequently be re-launched establish communications with the collector and the experiment will continue. The analysis code is a separate program, which also accesses the data contained in shared memory. This architecture eliminates the need for graphical output, and considerably simplifies the development of analysis code, as this is built in to the GUI program, which can automatically display the output of the analysis. The data acquisition program scans three “axes” — x, y and monochromator energy E. In order to minimize radiation damage we wish to minimize the real time between the measurements of individual pixels at the different X-ray energies. Ideally one would take measurements at all energies before proceeding to the next pixel. However the time needed to move the X-ray monochromator energy E is much greater than that needed to move the sample position x or y, so in practice a compromise data collection strategy is needed. Thus, the program scans the x-rasters at each monochromator energy point before proceeding to the next y point, and repeats until the multi-energy image is complete (34). This method also permits maximum partial completeness of the data during the experiment in case of synchrotron beam dump or other equipment problem. The specialized data analysis code described here will be incorporated into the EXAFSPAK analysis code (http://ssrl.slac.stanford.edu/exafspak.html) and made available to the scientific community.
RESULTS AND DISCUSSION
Bulk X-ray Absorption Spectroscopy
Figure 3 shows sulfur K-edge spectra of a number of biologically relevant standard compounds, clearly illustrating the richness of sulfur K-edge X-ray absorption spectroscopy and its suitability for probing sulfur biochemistry. Figure 4 compares the bulk spectra of yellow onion sections before and after light rubbing with a Teflon coated rod to cause cell breakage. The spectra of solutions of pure sulfoxide precursor and lachrymatory factor (LF) are also compared in Figure 4. Clear changes in the onion tissues can be seen to be induced by cell breakage, with an increase in intensity at ~2470.2 eV corresponding to the release of the LF, together with a decrease in intensity in the sulfoxide region. Quantitative analysis by curve-fitting of the spectra to a linear combination of representative model spectra (6,19,20,23,24) indicates a sulfoxide content of 60% of total sulfur, which is decreased on rubbing to 25%, and the contributions from the LF and thiosulfinate are increased from pre-rubbing values of zero to 23% and 17%, respectively (Table 1). This is consistent with the sulfoxide precursor being converted to LF and then to thiosulfinate or related species. Thus, bulk XAS essentially confirms what has been well understood (26), but using in situ measurements rather than chemical extraction and conventional chemical analyses, reflecting the biochemistry summarized in Figure 1.
Figure 3.

Sulfur K-edge X-ray absorption spectra of solutions of sulfur species relevant to onion, from top to bottom sulfate, taurine, hypotaurine, methyl methanethiosulfinate, methyl 1-propenyl sulfoxide, methionine, reduced glutathione and oxidized glutathione. Spectra have been normalized to the edge-jump which is estimated as previously described (6).
Figure 4.

Sulfur K-edge X-ray absorption spectra of onion tissue before (a) and after (b) rubbing to induce cell breakage. Experimental data are shown as points (● ● ● ●) and the linear combination fits as solid lines ( ). In both (a) and (b) the sulfoxide components of the linear combination fits are shown as broken lines (
 ), and in (b) thiosulfinates a dotted line (
 ) and LF (syn-propanethial S-oxide) as a solid line (
 ). The results of the linear combination analysis are summarized in Table 1.
Table 1.
Analysis of effects of cell breakage on onion tissuesa
| reference compound | before rubbing | after rubbing |
|---|---|---|
|
| ||
| % sulfur |
||
| GSSG | 17(1) | 13(1) |
| GSH | 0(2) | 0(2) |
| methionine | 18(1) | 15(1) |
| sulfoxideb | 60(2) | 25(2) |
| sulfonate (taurine) | 2(1) | 4(1) |
| sulfate | 3(1) | 3(1) |
| lachrymatory factor | — | 23(1) |
| thiosulfinate | — | 17(1) |
Values are estimated by a linear combinations of standard spectra (Figure 2) using the methods and rejection criteria previously described (6). Values in parentheses are the 99% confidence limits estimated from the diagonal elements of the covariance matrix.
Total sulfoxide was modeled by approximating this as a sum of methionine sulfoxide and methyl 1-propenyl sulfoxide in the ratio ⅓:⅔, as this gave superior fits to either methionine sulfoxide and methyl 1-propenyl sulfoxide alone (which have slightly different spectra). Fitting of methionine sulfoxide and methyl 1-propenyl sulfoxide independently gave similar values, but with much higher errors and high mutual correlations between the two sulfoxide components.
Interestingly, bulk XAS spectra of epidermal peels did not show corresponding changes on rubbing (not illustrated), even when this was quite extensive (causing essentially 100% cell breakage), although the features attributable to sulfoxide content were comparable to and slightly more intense than the onion spectra of figure 4. Presumably this lack of reactivity is due to lack of alliinase in the epidermal cell layers, which is consistent with earlier work indicating preferential localization of alliinase in bundle sheath cells (30).
Bulk spectra were also measured for a number of different onion varieties (including red and yellow onion, and species that are thought to produce less lachrymatory factor such as Vidalia onion) but no large systematic differences in the sulfur speciation were observed (not illustrated).
X-ray Fluorescence Spectroscopic Imaging
Results are presented for two selected sectioned onion specimens, namely from a green onion bulb and a red onion leaf near the transport vessels.
Green onion
Figure 5 shows the species specific maps, together with an optical micrograph (Figure 5a) of a section of green onion (Figure 2 shows the corresponding raw images), plus the X-ray scatter image (Figure 5b) which includes both elastic and inelastic X-ray scattering. The area imaged is sectioned through a growing leaf near its tip, with two adjacent leaves top and bottom. Figure 5, c-f shows the chemically specific images of the section. Each map shows the relative amount of each species in different areas. Sulfoxide sulfur (Figure 5d) is the most abundant sulfur species, with combined sulfide (RSR) / thiol (RSH) sulfur (modeled as methionine, Figure 5c) as the other major species. In principal, thiols (e.g. cysteine) and organic sulfides (e.g. methionine) are separable, but the spectra of these are very similar (6); such separation would be quite challenging and was not attempted here. Thiolates (RS-) are spectroscopically quite distinct (25) and are apparently not present at any significant level in the samples. Disulfides and sulfate are minor components, and the intensity scales for these maps have been enhanced to show their location pattern (Figure 5, e and f). Figure 6a shows a map of the fraction of total sulfur present as sulfoxide. This differs from Figure 5d in that the value is normalized to the total sulfur present. Figure 6, b and c show deconvolutions of micro-XAS spectra using the method of linear combination of model spectra (6) from two selected locations in the specimen with low and high sulfoxide, respectively. The results quantitatively confirm the X-ray fluorescence spectroscopic imaging analysis, showing that our deconvolution methodology is working well. We note in passing that the radiation exposure in the imaging experiment is very much less than in a micro-XAS experiment. Thus, the data giving rise to the images in Figures 5 and 6 was collected with a dwell time of 400 ms per pixel per energy (i.e., a total exposure of only 2.4 s per pixel), but the number of energy points in a micro-XAS spectrum is much greater (typically hundreds) and the exposure to the intense microfocused beam correspondingly longer (with a typical scan time of 8 min.). Thus, only a single micro-XAS scan was recorded because in subsequent scans accumulating chemical changes were evident from spectral changes, such as increasing intensity attributable to disulfides and other oxidized products, suggesting some degree of photo-oxidation (not illustrated). We note, however that the micro-XAS spectra recorded were collected after the multi-energy images were complete, and the fact that these are consistent with the images suggests that photo-damage is not an issue, at least under the conditions of the present imaging experiments.
Figure 5.

Sulfur K-edge X-ray fluorescence spectroscopic images of a tranverse section of green onion. (a) Optical micrograph; (b) scattered X-rays; (c)-(f) relative abundance of specific chemical forms of sulfur. Sulfur forms are shown as (c) thiol/sulfide species (modeled as methionine); (d) sulfoxides; (e) disulfides; (f) sulfate. The intensity scales for disulfides and sulfate have been enhanced, as these are very minor components.
Figure 6.
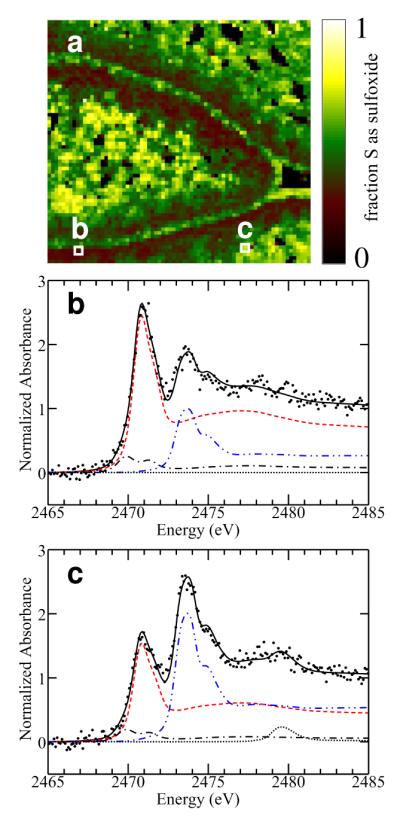
Fraction of total sulfur as sulfoxides. (a) Shows the same data as Figure 5, expressed as a fraction. The highlighted pixels show the locations from which micro-XAS spectra were collected: (b) low sulfoxide and (c) high sulfoxide. The resulting spectra in (b) and (c) have been background-subtracted and normalized and show data (● ● ● ●), fit (black  ), and the components scaled according to their proportions in the fit. These proportions are: (b) 22% sulfoxide (blue
  ), 71% methionine (red
  ), 7% disulfide (black
  ), (sulfate not significant); (c) 46% sulfoxide, 46% methionine, 6% disulfide, 2% sulfate (
 ).
).
From Figures 5 and 6 we can identify three specific regions with differing sulfur distributions within the green onion leaf. (i) The epidermal outermost layer, within 20 μm of the surface, is rich in sulfoxides and low in other sulfur species. (ii) Beneath the epidermal layer is an endodermal layer, about 20-100 μm deep. This region is relatively depleted in sulfoxides and enriched in organic sulfides (RSR) together with a small fraction of sulfate. (iii) Finally, the interior or cortex shows sulfoxides locally enriched within small compartments. Comparison with the optical micrograph indicates that the sulfoxide intensity is not centrally located within the cells. Mature plant cells generally have a large essentially central cell vacuole, and our data show maximal sulfoxide intensity near the periphery of cells and lower intensity near the central part of cells. This is consistent with the previously postulated cytosolic compartmentalization of the sulfoxide precursor (29).
Red onion leaf near transport vessel
Figure 7a-b shows the optical micrograph of the section through the red onion, Figure 7c shows the corresponding X-ray scatter image and Figure 7d shows the total sulfur. In the center of the image is a transport vessel bundle. Figure 7e-h shows the chemically specific maps obtained using our X-ray fluorescence spectroscopic imaging deconvolution methods. Similar to the green onion section (Figure 5), sulfoxides and sulfide/thiol groups are predominant, but unlike the data of Figure 5, disulfides are quite prominent, especially in the region of the transport bundle (Figure 7). In both imaging data sets the total sulfur content is higher near the cellular peripheries and low in the central region of the cells, suggesting that the cellular vacuoles have low sulfur content. Alliinase is rich in both methionine and cystine (disulfide) residues (35,36), and it is possible that locally elevated levels of the enzyme may be reflected in our sulfur maps. For this to be so the levels of alliinase would need to be comparable to the normal cellular sulfur levels (ca. 100 mM), and such high levels of one enzyme seem unlikely. Furthermore, this is inconsistent both with the postulated vacuolar localization of alliinase (29) and our observation of low sulfur in the centre of the cells.
Figure 7.

Sulfur K-edge XAS images of a transverse section of red onion. (a) Wide-view optical micrograph; (b) optical micrograph of region scanned [indicated by the red outline in (a)]; (c) scattered X-rays; (d) total sulfur; (e)-(h) relative abundance of specific chemical forms of sulfur.
Figure 8 shows tricolor maps of the amounts mi and fractions fi of sulfur for three different chemical forms (disulfides, thiols/sulfides and sulfoxides). Three specific regions in the maps can again be identified. (i) The central transport vessels themselves are disulfide rich, indicating a more oxidized environment in this location. (ii) The bundle sheath cells which surround the transport vessels show a higher proportion of thiols/sulfides. (iii) The outer cells or cortex show some sulfoxide in the interiors of the cells and (predominantly) disulfide-rich cell peripheries. The fraction maps (Figure 8) show a uniform fraction of sulfoxide throughout the cortex cells. At first glance this would seem to be consistent with a vacuolar localization of sulfoxide, but, as the vacuole is low in total sulfur (Figure 5, Figure 7) then this is more consistent with a cytosolic sulfoxide location (i.e. sulfoxide in the fraction plot would in fact be from cytosol in front of the vacuole as the limited penetration depth of the X-ray beam at the sulfur K-edge energies means that for the larger cells it will not penetrate to the rear of the cell).
Figure 8.

Tricolor plots superimposing amounts and fractions of the three principal sulfur species (sulfoxide, disulfide and combined thiol/sulfide).
CONCLUDING REMARKS
In the present work we have successfully developed sulfur X-ray fluorescence spectroscopic imaging as a practical tool for investigating in vivo sulfur biochemistry. We anticipate that with a more optimized X-ray microprobe experimental setup both the intensity of the focused beam and the resolution could easily be improved by at least one order of magnitude. Our work demonstrates that sulfur K-edge X-ray fluorescence spectroscopic imaging can be used to identify and quantify the localization of the different sulfur forms present in living tissues. The results were highly reproducible, with essentially identical data being collected over three separate experimental runs spread over 11 months (not illustrated). Our studies of onion showed localization of sulfur species, and in particular that sulfoxides are likely compartmentalized in the cytosol, but most importantly clearly proved the feasibility of the techniques on a biological system.
Although not a problem in the present study, one potential possible problem can occur with self-absorption effects, which have been observed in biological systems (19,20). Here spectroscopic distortions that are manifest as a damping of intense spectral features might cause errors in quantification for certain species. For this reason imaging should generally be accompanied by careful bulk measurements which might betray the presence of distortions due to self-absorption (19,20), and in cases of doubt micro-XAS spectra, should resolve the issue. A more serious potential limitation with future work using more intense or more tightly focused X-ray beams may be radiation damage of the sample. This is more pronounced at low photon energies (such as the sulfur K-edge) than at higher energies (31,32) because almost all of the incident photons are absorbed within 100 μm of the sample surface. While cryoprotection would almost certainly help with this, it would abrogate some of the advantages from investigating living tissues (6).
Obvious future applications of the techniques include micro and sub-micro scale mapping of mammalian cell cultures (6), micro-scale mapping of mammalian tissues (37), and macro-scale mapping of whole mammalian tissues such as human brain (38).
Supplementary Material
ACKNOWLEDGMENT
The authors acknowledge the assistance of the SSRL staff in performing the imaging experiments, and and thank Xiaojie Li (Albany) for synthesis of reference standards.
ABBREVIATIONS
- GSH
(glutathione, reduced)
- GSSG
(glutathione, oxidized)
- LF
(lachrymatory factor)
- XAS
(X-ray absorption spectroscopy)
- SSRL
(Stanford Synchrotron Radiation Lightsource)
Footnotes
This work was supported by grant GM-57375 from the National Institutes of Health. The Stanford Synchrotron Radiation Lightsource is funded by the U.S. Department of Energy, Offices of Basic Energy Sciences and Biological and Environmental Research, with additional support from the National Institutes of Health. Work at the University of Saskatchewan was supported by the Canadian Institutes of Health Research and the Natural Sciences and Engineering Research Council Canada, and by Canada Research Chair awards (G.N.G. and I.J.P.). Work at Albany was supported by grant CHE-0744578 from the National Science Foundation.
SUPPORTING INFORMATION AVAILABLE Figure showing experimental setup (Figure S1). This material is available free of charge via the Internet at http://pubs.acs.org.
REFERENCES
- 1.Voet D, Voet JG. Biochemistry. John Wiley and Sons; New York, Chichester, Brisbane, Toronto, Singapore: 1990. [Google Scholar]
- 2.Bolinger L, Lenkinski RE. Localization in clinical NMR spectroscopy. Biol. Magn. Reson. 1992;11:1–53. [Google Scholar]
- 3.Neubauer S, Horn M, Ertl G, Kochseik K. Clinical significance of cardiac magnetic resonance spectroscopy. Dsch. Med. Wochenschr. 1993;118:1527–1531. doi: 10.1055/s-2008-1059481. [DOI] [PubMed] [Google Scholar]
- 4.Negendank W, Li C-W, Padavic-Shaller K, Murphy-Boesch J, Brown TR. Phospholipid metabolites in 1H-decoupled 31P MRS in vivo in human cancer: implications for experimental models and clinical studies. Anticancer Res. 1996;16:1539–1544. [PubMed] [Google Scholar]
- 5.Huxtable RJ. Physiological actions of taurine. Physiol. Rev. 1992;72:101–163. doi: 10.1152/physrev.1992.72.1.101. [DOI] [PubMed] [Google Scholar]
- 6.Gnida M, Sneeden EY, Whitin JC, Prince RC, Pickering IJ, Korbas M, George GN. Sulfur X-ray absorption spectroscopy of living mammalian cells: an enabling tool for sulfur metabolomics - in situ observation of taurine uptake into MDCK cells. Biochemistry. 2007;46:14735–14741. doi: 10.1021/bi701979h. [DOI] [PubMed] [Google Scholar]
- 7.Loehrer FMT, Angst CP, Haefeli WE, Jordan PP, Ritz R, Fowler B. Low whole-blood S-adenosylmethionine and correlation metween 5-methyltetrahydrofolate and homocysteine in coronary artery disease. Arterioscler. Throm. Vas. 1996;16:727–733. doi: 10.1161/01.atv.16.6.727. [DOI] [PubMed] [Google Scholar]
- 8.Obeid R, Jouma M, Herrmann W. Cobalamin status (holo-transcobalamin, methylmalonic acid) and folate as determinants of homocysteine concentration. Clin. Chem. 2002;48:2064–2065. [PubMed] [Google Scholar]
- 9.van den Berg M, Stehouwer CDA, Bierdrager E, Rauwerda JA. Plasma homocysteine and severity of atherosclerosis in young patients with lower-limb atherosclerotic disease. Arterioscler. Throm. Vas. 1996;16:165–171. doi: 10.1161/01.atv.16.1.165. [DOI] [PubMed] [Google Scholar]
- 10.Stief TW, Aab A, Heimberger N. Oxidative inactivation of purified human alpha-2-antiplasmin, antithrombin III, and C1-inhibitor. Thromb. Res. 1988;49:581–589. doi: 10.1016/0049-3848(88)90255-1. [DOI] [PubMed] [Google Scholar]
- 11.Evans MD, Pryor WA. Cigarette smoking, emphysema and lung damage to alpha-1-proteinase inhibitor. Am. J. Physiol. 1994;266:L593–611. doi: 10.1152/ajplung.1994.266.6.L593. [DOI] [PubMed] [Google Scholar]
- 12.Garner MH, Spector A. Selective oxidation of cysteine and methionine in normal and senile cataractous lenses. Proc. Natl. Acad. Sci. USA. 1980;77:1274–1277. doi: 10.1073/pnas.77.3.1274. [DOI] [PMC free article] [PubMed] [Google Scholar]
- 13.But see:Daunch WA, Rinaldi PL. Natural-abundance solid-state 33S NMR with high-speed magic-angle spinning. J. Magn. Reson. 1996;A123:219–221.
- 14.George GN, Gorbaty ML. Sulfur K edge X-ray absorption spectroscopy of petroleum asphaltenes and model compounds. J. Am. Chem. Soc. 1989;111:3182–3186. [Google Scholar]
- 15.Spiro CL, Wong J, Lytle FW, Greegor RB, Maylotte DH, Lamson SH. X-ray absorption spectroscopic investigation of sulfur sites in coal: organic sulfur identification. Science. 1984;226:48–50. doi: 10.1126/science.226.4670.48. [DOI] [PubMed] [Google Scholar]
- 16.George GN, Gorbaty ML, Kelemen SR, Sansone M. Direct determination and quantification of sulfur forms in coals from the Argonne premium sample program. Energ. Fuel. 1991;5:93–97. [Google Scholar]
- 17.Morra MJ, Fendorf SE, Brown PD. Speciation of sulfur in fulvic and humic acid determined by X-ray absorption near-edge structure (XANES) spectroscopy. Geochim. Cosmochim. Acta. 1997;61:683–688. [Google Scholar]
- 18.Zhao FJ, Lehmann J, Solomon D, Fox MA, McGrath SP. Sulfur speciation and turnover in soils: evidence from sulphur K-edge XANES spectroscopy and isotope dilution studies. Soil Biol. Biochem. 2006;38:1000–1007. [Google Scholar]
- 19.Pickering IJ, George GN, Yu EY, Brune DC, Tuschak C, Overmann J, Beatty JT, Prince RC. Analysis of sulfur biochemistry of sulfur bacteria using X-ray absorption spectroscopy. Biochemistry. 2001;40:8138–8145. doi: 10.1021/bi0105532. [DOI] [PubMed] [Google Scholar]
- 20.George GN, Gnida M, Bazylinski DA, Prince RC, Pickering IJ. X-ray absorption spectroscopy as a probe of microbial sulfur biochemistry: The nature of bacterial sulfur globules revisited. J. Bact. 2008;190:6376–6383. doi: 10.1128/JB.00539-08. [DOI] [PMC free article] [PubMed] [Google Scholar]
- 21.Solomon EI, Hedman B, Hodgson KO, Dey A, Szilagyi RK. Ligand K-edge X-ray absorption spectroscopy: covalency of ligand—metal bonds. Coord. Chem. Rev. 2005;249:97–129. [Google Scholar]
- 22.Frank P, Hedman B, Hodgson KO. Sulfur allocation and vanadium—sulfate interactions in whole blood cells from the tunicate Ascidia ceratodes, investigated using X-ray absorption spectroscopy. Inorg. Chem. 1999;38:260–270. [Google Scholar]
- 23.Yu EY, Pickering IJ, George GN, Prince RC. In situ observation of the generation of isothiocyanates from sinigrin in horseradish and wasabi. Biochim. Biophys. Acta. 2001;1527:156–160. doi: 10.1016/s0304-4165(01)00161-1. [DOI] [PubMed] [Google Scholar]
- 24.Sneeden EY, Harris HH, Pickering IJ, Prince RC, Johnson S, Li X, Block E, George GN. The sulfur chemistry of shiitake mushroom. J. Am. Chem. Soc. 2004;126:458–459. doi: 10.1021/ja039239g. [DOI] [PubMed] [Google Scholar]
- 25.Pickering IJ, Prince RC, Divers T, George GN. Sulfur K-edge X-ray absorption spectroscopy for determining the chemical speciation of sulfur in biological systems. FEBS Lett. 1998;441:11–14. doi: 10.1016/s0014-5793(98)01402-1. [DOI] [PubMed] [Google Scholar]
- 26.Block E. The organosulfur chemistry of the genus Allium - implications for organic sulfur chemistry. Angew. Chem., Int. Ed. Engl. 1992;31:1135–1178. [Google Scholar]
- 27.Imai I, Tsuge N, Tomotake M, Nagatome Y, Sawada H, Nagata T, Kumagai H. Plant biochemistry: an onion enzyme that makes the eyes water. Nature. 2002;419:685. doi: 10.1038/419685a. [DOI] [PubMed] [Google Scholar]
- 28.Eady CC, Kamoi T, Kato M, Porter NG, Davis S, Shaw M, Kamoi A, Imai S. Silencing onion lachrymatory factor synthase causes a significant change in the sulfur secondary metabolite profile. Plant Physiol. 2008;147:2096–2106. doi: 10.1104/pp.108.123273. [DOI] [PMC free article] [PubMed] [Google Scholar]
- 29.Lancaster JE, Collin HA. Presence of alliinase in isolated vacuoles and of alkyl cysteine sulfoxides in the cytoplasm of bulbs of onion (Allium cepa) Plant Sci. Lett. 1981;22:169–176. [Google Scholar]
- 30.Yamazaki M, Sugiyama M, Saito K. Intercellular localization of cysteine synthase and alliinase in bundle sheaths of Allium plants. Plant Biotechnol. 2002;19:7–10. [Google Scholar]
- 31.Pickering IJ, Prince RC, Salt DE, George GN. Quantitative, chemically specific imaging of selenium transformation in plants. Proc. Natl. Acad. Sci. USA. 2000;97:10717–10722. doi: 10.1073/pnas.200244597. [DOI] [PMC free article] [PubMed] [Google Scholar]
- 32.Pickering IJ, Gumaelius L, Harris HH, Prince RC, Hirsch G, Banks JA, Salt DE, George GN. Localizing the biochemical transformations of arsenate in a hyperaccumulating fern. Environ. Sci. Technol. 2006;40:5010–5014. doi: 10.1021/es052559a. [DOI] [PubMed] [Google Scholar]
- 33.Hirsch G. Metal capillary optics: novel fabrication methods and characterization. X-Ray Spectrometry. 2003;32:229–238. [Google Scholar]
- 34.Pickering IJ, Hirsch G, Prince RC, Sneeden EY, Salt DE, George GN. Imaging of selenium in plants using tapered metal monocapillary optics. J. Synch. Rad. 2003;10:289–290. doi: 10.1107/s0909049503003273. [DOI] [PubMed] [Google Scholar]
- 35.Kuettner EB, Hilgenfeld R, Weiss MS. The active principle of garlic at atomic resolution. J. Biol. Chem. 2002;277:46402–46407. doi: 10.1074/jbc.M208669200. [DOI] [PubMed] [Google Scholar]
- 36.Shimon LJ, Rabinkov A, Shin I, Miron T, Mirelman D, Wilchek M, Frolow F. Two structures of alliinase from Alliium sativum L.: apo form and ternary complex with aminoacrylate reaction intermediate covalently bound to the PLP cofactor. J. Mol. Biol. 2007;366:611–625. doi: 10.1016/j.jmb.2006.11.041. [DOI] [PubMed] [Google Scholar]
- 37.Zhang L, Lichtmannegger J, Summer KH, Webb S, Pickering IJ, George GN. Tracing copper-thiomolybdate complexes in a prospective treatment for Wilson’s disease. Biochemistry. 2009;48:891–897. doi: 10.1021/bi801926e. [DOI] [PubMed] [Google Scholar]
- 38.Popescu BFG, George MJ, Bergmann U, Garachtchenko AV, Kelly ME, McCrea RPE, Lüning K, Devon RM, George GN, Hanson AD, Harder SM, Chapman LD, Pickering IJ, Nichol H. Mapping metals in Parkinson’s and normal brain using rapid-scanning X-ray fluorescence. Phys. Med. Biol. 2009;54:651–663. doi: 10.1088/0031-9155/54/3/012. [DOI] [PubMed] [Google Scholar]
Associated Data
This section collects any data citations, data availability statements, or supplementary materials included in this article.