

Abstract
Pepper (Capsicum annuum L.) is an economically important crop containing capsaicinoids in the seed and placenta, which has various culinary, medical, and industrial applications. Late embryogenesis abundant (LEA) proteins are a large group of hydrophilic proteins participating in the plant stress response and seed development. However, to date there have been no genome‐wide analyses of the LEA gene family in pepper. In the present study, 82 LEA genes were identified in the C. annuum genome and classified into nine subfamilies. Most CaLEA genes contain few introns (≤ 2) and are unevenly distributed across 10 chromosomes. Eight pairs of tandem duplication genes and two pairs of segmental duplication genes were identified in the LEA gene family; these duplicated genes were highly conserved and may have performed similar functions during evolution. Expression profile analysis indicated that CaLEA genes exhibited different tissue expression patterns, especially during embryonic development and stress response, particularly in cold stress. Three out of five CaLEA genes showed induced expression upon cold treatment. In summary, we have comprehensively reviewed the LEA gene family in pepper, offering a new perspective on the evolution of this family.
Keywords: cold stress, gene family, late embryogenesis abundant, placental development
Within the Capsicum annuum genome, there exist 82 LEA genes that group into nine different subfamilies, principally playing a role in placental development and the response to cold stress.

Abbreviations
- ABA
abscisic acid
- ASR
abscisic acid‐, stress‐, and ripening‐induced proteins
- DHN
dehydrin
- ET
ethylene
- FPKM
the fragments per kilobase of exon model per million mapped reads
- LEA
late embryogenesis abundant
- MeJA
methyl jasmonate
- MYA
million years ago
- qRT‐PCR
quantitative reverse transcription polymerase chain reaction
- SA
salicylic acid
- SMP
seed maturation protein
The late embryogenesis abundant (LEA) protein is a highly hydrophilic glycine‐rich protein first identified 40 years ago in cotton (Gossypium hirsutum) seeds during late embryonic development [1]. Further studies have shown that LEA proteins are widely distributed in various species, including higher plants, bacteria, certain fungi, and invertebrates [2, 3, 4, 5]. In addition to the seeds, LEA proteins also exist in the leaves, stems, roots, and other plant tissues [6, 7, 8]. Many LEA proteins have been divided into several types based on different criteria in higher plants. Classification based on the similarity between amino acid sequences and conserved motifs available in the Pfam database is currently the most common approach [9, 10]. Based on these criteria, LEA proteins can be divided into nine groups: LEA_1–6, seed maturation protein (SMP), dehydrin (DHN), and abscisic acid‐, stress‐, and ripening‐induced proteins (ASR). ASR was recently identified as a novel LEA protein [10, 11]. Seed size is regulated by complex networks combining multiple developmental and environmental signals [12]. Late embryogenesis abundant proteins are instrumental in seed development in higher plants, and its expression can be considered as a clear indication of seed maturation [13, 14]. Some LEA proteins are crucial for seed longevity, desiccation tolerance, and endosperm quality control [15, 16, 17, 18]. For example, the weight, size, and fatty acid content of Arabidopsis seeds overexpressing LuLEA1 are reduced [19].
Harmful environment can lead to an overall loss of approximately 70% of the yield for key agricultural crops, that is, an average yield of only approximately 30% of the genetic yield potential [20]. Most LEA proteins are highly hydrophilic and intrinsically disordered as they are abundant in charged amino acid residues [3, 6, 21]. Owing to these features, LEA proteins are relatively stable under heat and acid stress [22]. The induction of LEA proteins was considered to be a key component of the trophic desiccation tolerance strategy in resurrection plants [23, 24]. Recently, the functions of LEA proteins in abiotic stress tolerance have been studied. Drought, low temperature, salt stress, and other stressors can induce the expression of LEA genes, which also function under these conditions [13, 25, 26]. For instance, the expression of LEA proteins from Gastrodia elata in Escherichia coli can enhance tolerance to low‐temperature stress [27]. When overexpressing OsLEA3‐2 in Arabidopsis and rice, the growth of transgenic plants was better than that of wild‐type plants under salt and drought conditions [28]. Additionally, the downregulation of LEA_4 subgroup genes results in sensitivity to water deficit in Arabidopsis, which may be related to the maintenance of cellular function by LEA proteins during water deficit [5, 7]. Furthermore, studies have indicated that LEA proteins perform vital functions under stress, acting as free radical scavengers under dry conditions [29, 30], preventing the inactivation of a variety of enzymes, such as lactate dehydrogenase, during water deficit [31, 32], and protecting proteins and membranes from adverse structural changes caused by dehydration [33].
So far, the genome‐wide identification and analysis of the LEA gene families have been conducted in several plant species with sequenced genomes, such as Arabidopsis thaliana, Oryza sativa, Cucumis sativus L., Solanum lycopersicum, Camellia sinensis (L.) O. Kuntze, G. hirsutum, and Salvia miltiorrhiza [9, 13, 25, 26, 34, 35, 36]. Pepper (Capsicum annuum L.), an important cash crop belonging to the Solanaceae family, is cultivated worldwide. Its fruits can be used not only as fresh vegetables and spices but also as raw materials for processing medicine and cosmetics [37]. Until now, studies on the function of CaLEA genes focused on responses to biotic and abiotic stresses. CaLEA73 gene enhances drought and osmotic tolerance modulating transpiration rate in transgenic A. thaliana [38]. CaLEA6 protein plays a protective role in water deficit caused by dehydration and high salinity [39]. CaLEA1 is involved in regulating ABA signaling, drought, and salt stress response [40]. The function of CaDHN5 is related to salt and osmotic stress responses [41]. Although there have been a few studies on the function of LEA gene in pepper, there has not been a comprehensive and systematic identification of CaLEA gene family. In this study, 82 candidate LEA proteins were identified in the genome of C. annuum L. CM334, and their structures, evolution, chromosomal locations, and expression profiles in response to abiotic stresses were analyzed. These results provide a strong platform for identifying the biological functions of CaLEA in pepper plants.
Materials and methods
Identification of CaLEA genes in C. annuum
We downloaded the genome sequence of C. annuum from the C. annuum (cultivar CM334) genome database (http://peppergenome.snu.ac.kr) [37]. Hidden Markov Model profiles of LEA genes were obtained from the Pfam database and used to search the local genome database of C. annuum. All candidate genes were confirmed using the Pfam (http://pfam‐legacy.xfam.org/) [42] and NCBI Conserved Domain Search databases (https://www.ncbi.nlm.nih.gov/Structure/cdd/wrpsb.cgi). Eventually, all the LEA gene family members of pepper (CaLEA) were identified and named according to their positions on the chromosome. The ProtParam online tool (https://web.expasy.org/protparam/) was used [43] to estimate the following physical and chemical properties: grand average hydropathy (GRAVY), isoelectric point (pI), and molecular weight (MW).
Phylogenetic analysis, gene structure and motif distribution and promoter analysis of CaLEA
To reveal the phylogenetic relationships of LEAs among C. annuum L, A. thaliana, Solanum tuberosum, and S. lycopersicum, multiple LEA protein sequences were aligned and a phylogenetic tree in mega 11.0 using the neighbor‐joining (NJ) method [44]. Group patterns were evaluated using bootstraps (1000 replicates) in the phylogenetic tree. tbtools software was used to identify exon–intron structures [45]. Conserved protein motifs were identified using meme (multiple expectation maximization for motif elicitation) (http://meme‐suite.org/tools/meme) [46], and the maximum number of different motifs was 20. Promoter sequences (2000 bp upstream of the translation start site) of CaLEA genes were extracted from the pepper genome dataset (http://peppergenome.snu.ac.kr). The PlantCARE database (http://bioinformatics.psb.ugent.be/webtools/plantcare/html/) was used to search for the cis‐acting elements.
Gene duplication and evolutionary analysis
The CaLEA genes were mapped on the pepper chromosome based on the location information of CaLEA genes in the pepper database (http://peppergenome.snu.ac.kr) [37] and visualized using tbtools [45]. The segment and tandem of the putative duplication of the CaLEAs were constructed using mcscanx software [47], with the following testing parameters: e value of protein ratio less than 1e‐3, number of blast hits more than 10, and CPU for blastp was 2. The non‐synonymous substitution rate (K a) to the synonymous substitution rate (K s) was calculated using tbtools [45]. K a/K s < 1, K a/K s = 1, and K a/K s > 1 represent the purifying selection effects, neutral selection, and positive (or diversifying) selection, respectively. We calculated divergence time using the formula T = K s/2r, where r is 1.5 × 10⁻⁸ synonymous substitutions per site per year [48].
Expression pattern analysis based on the transcriptome data
The following transcriptome data were downloaded from the NCBI Sequence Read Archive (SRA) database (https://www.ncbi.nlm.nih.gov/sra) Reference comparisons were performed using hisat2 [49] software, and the fragments per kilobase of exon model per million mapped reads (FPKM) were calculated using stringtie [50] software. The fold change between the treatment group and the control group was calculated using the formula log2(FPKM(treatment) + 1)/(FPKM(control) + 1) to assess the changes following biotic and abiotic stress treatments. The resulting data were then imported into the r package called pheatmap to generate a heatmap.
RNA isolation and quantitative reverse transcription polymerase chain reaction analysis
Pepper plants were grown under greenhouse conditions: 16 h light/8 h dark, 25–28 °C. When the pepper had 6 true leaves, the experimental group was cold‐treated in an incubator (16 h light/8 h dark, 10 °C), and the leaves were collected at 0, 3, 6, 12, 24, and 72 h after the treatment, immediately frozen, and stored in a −80 °C refrigerator. We used TIANGEN's polysaccharide‐ and polyphenolic‐rich RNAprep pure plant plus kit to extract total RNA from pepper leaves of C. annuum cv. CM334. Reverse transcription was performed using HiScript II Q RT SuperMix for qPCR (+gDNA wiper; R223‐01; Vazyme, Nanjing, China) following the manufacturer's instructions. We selected nine genes whose gene expression increased significantly after cold treatment in transcriptome analysis. The PCR was amplified using gene‐specific primers (Table S5) with ChamQ Universal SYBR qPCR Master Mix (Q711; Vazyme). To normalize the samples, the ubiquitin‐conjugating gene (CaUbi3) was used as an internal control. Each sample was analyzed three times, and the relative gene expression level was calculated using the method.
MicroRNA targeting analysis
Genomic sequences of 9 LEA members shown in Fig. 6 were submitted as candidates to predict of potential miRNAs, using the default parameters of psRNATarget online website (https://www.zhaolab.org/psRNATarget/). The uploaded miRNA sequences and the method of predictive analysis were previously reported [51, 52].
Fig. 6.

qRT‐PCR analysis of the selected CaLEA gene expression under cold stress. Pepper leaves were picked up at 0, 3, 6, 12, 24, and 72 h after 10 °C cold treatments. Data represent the mean ± SD of three independent experiments. The gray lines are the result of trends in the transcriptome data. Error bars indicate standard deviations (SD, n = 3) of independent biological replicates. An asterisk on the bars indicates a significant difference by t‐test. ****P ≤ 0.0001, ***P ≤ 0.001, **P ≤ 0.01, *P ≤ 0.05 in t‐test.
Results
Identification and characteristics of CaLEA genes in C. annuum
We identified 82 CaLEA genes based on a Pfam ID search for C. annuum genome databases and a Pfam domain search for the CDD database using the publicly available genome sequence data of C. annuum. These CaLEAs were named CaLEA1 to CaLEA82 according to their order on chromosomes. To better understand the similarities, differences, and evolutionary relationships among LEA genes, phylogenetic analysis was performed using 302 LEA proteins from A. thaliana, C. annuum, S. lycopersicum, and S. tuberosum (Fig. 1). The results showed that these genes could be divided into nine groups: LEA_1–LEA_6, SMP, DHN, and ASR (Table S1). Based on phylogenetic analysis, we found that the largest group of LEA genes in pepper was LEA_2, which contained 47 members, whereas the smallest group was LEA_6, which had only one member. Additionally, groups LEA_1, LEA_3, LEA_4, LEA_5, DHN, SMP, and ASR contained 3–7 members.
Fig. 1.

Phylogenetic relationships of LEA genes in pepper, tomato, potato, and Arabidopsis. The phylogenetic tree was constructed using mega 11.0, and the nine major groups are marked with differently colored backgrounds. Black, red, green, and white circles represent pepper, tomato, potato, and Arabidopsis, respectively.
Analysis of physiochemical properties revealed that the length of CaLEA proteins varied from 77 to 554 amino acids, and their molecular weights ranged from 8.56 to 57.82 kDa. The theoretical isoelectric points of the CaLEA proteins were between 4.26 and 10.51, of which 54 (66%) were considered basic (pI > 7), and 28 were considered acidic (pI < 7). Ninety percent of LEA_2 proteins and all LEA_3 proteins are basic, while other subgroups of proteins are mostly acidic. Moreover, analysis of the grand average of hydropathicity (GRAVY) index confirmed that except for the hydrophobic and hydrophilic proteins of LEA_2 subgroup, other subgroup proteins are hydrophilic (Table S1).
Gene structure and conserved motifs of CaLEA genes
Gene structure is an important factor in determining gene function. We analyzed the exon–intron structure and conserved motifs of CaLEA genes in pepper plants. Most CaLEA genes contained no introns or one intron, except for CaLEA14, CaLEA21, CaLEA22, CaLEA24, CaLEA31, CaLEA50, CaLEA72, and CaLEA75 with two introns; CaLEA17 and CaLEA66 with three introns; CaLEA56 with five introns; and CaLEA5 with six introns. In general, the exon–intron structure of CaLEA genes in the same group was similar (Fig. 2B), which supports the classification of groups and their phylogenetic relationships.
Fig. 2.

Phylogenetic tree, conserved motifs, and gene structures of CaLEA genes. (A) Conserved motif analysis of CaLEA proteins. Conserved motifs are numbered and indicated in colored boxes. Motif sequences are provided in Table S2. (B) Exon–intron structures of CaLEA genes. Green Bar: exons; black lines: introns.
To investigate the structural features of the CaLEA proteins, we used the MEME software to predict the conserved motifs (Table S2), and the maximum number of different motifs was 20 (Fig. 2A). Generally, most CaLEA protein sequences are highly variable, and different subgroups do not share a common conserved motif. From the motif analysis, it was clear that genes belonging to the same subfamily possessed several group‐specific conserved domains, and closer evolutionary relationships of genes were accompanied by more similar motif numbers. For instance, the LEA_5 and LEA_3 groups each had one specific motif, motif 14, and motif 2, respectively. Previous studies have reported that LEA proteins may require specific motifs for performing their specific functions to recognize and bind specific ligands. The DHN subfamily contains a lysine‐rich K segment (motif 11), which is an important structural basis for hydrophilicity [53]. The number of K segments in different DHN proteins is variable: twice in CaLEA38 and CaLEA73 and once in CaLEA12, CaLEA18, CaLEA19, CaLEA11, and CaLEA78. Furthermore, the Y segments (motif 3) and S segments, a serine (S)‐rich motif (motif 16), were observed only in the seven DHNs mentioned above.
Promoter cis‐element analysis of CaLEA genes
We obtained a 2‐kb upstream region of the translation initiation sites for all CaLEA genes from the pepper genome database in order to investigate promoter cis‐elements among CaLEAs (Fig. S1). Among the subfamilies, the promoter of LEA_2 contains the highest number of cis‐elements, followed by DHN, LEA_1, and LEA_3. The promoters of CaLEAs encompass numerous cis‐acting regulatory elements involved in defense and stress responsiveness, including TC‐rich repeats, DRE, LTR, and MBS. This provides strong evidence that LEA genes are involved in responding to environmental stress. Furthermore, some promoters of CaLEAs also possess cis‐acting regulatory elements associated with seed or endosperm‐specific expression, such as AACA_motif and GCN4_motif.
Chromosome distribution, gene duplication, and synteny analysis of CaLEA genes
We then mapped the chromosomal location of each CaLEA gene to better understand the relationship between genetic divergence, gene duplication, and the loss of the LEA family in C. annuum (Fig. 3A). C. annuum possesses 12 chromosomes, and 72 CaLEA genes are distributed on 10 chromosomes except chromosome 05. Because of incomplete genome sequences of C. annuum, the remaining 11 genes were distributed on unknown chromosomes because of incomplete genome sequences of C. annuum. CaLEA genes were also unevenly distributed among the chromosomes. As shown in Fig. 3A, 12 genes were localized on chromosome 03, whereas only four genes were localized on chromosome 06, possibly because of differences in chromosome size and structure. In addition, nine subfamilies were unevenly distributed in the genome. Members of the LEA_2 subfamily are widely distributed across 10 chromosomes, whereas other LEA subfamilies are mainly distributed on specific chromosomes, such as ASR, which is present only on chromosome 04. This suggests that these genes tend to replicate and evolve more conservatively within the chromosomes.
Fig. 3.

Genomic distribution of CaLEAs on pepper chromosomes. (A) Distribution of CaLEA genes on pepper chromosomes. The nine main groups are marked with differently colored fonts. The red lines indicate tandem duplication genes. (B) Synteny analysis of 71 CaLEAs. The rectangle on the outer ring represents pepper chromosome 01–12. The orange lines on chromosomes represent segmental duplication gene pairs.
Gene duplication also played an important role in the evolution of gene families. We found two pairs of segmental duplication and eight pairs of tandem duplications in the CaLEA gene family (Fig. 3B). Eight tandem duplication pairs were located on chromosomes 01, 04, 06, and 10, which belonged to LEA_1, LEA_2, ASR, and SMP. Interestingly, all ASRs are tandem duplication genes. The two segmental duplication pairs were CaLEA45/CaLEA56 and CaLEA7/CaLEA60. K a/K s ratios were calculated for the replicated CaLEA gene pairs in pepper (Table S3). The results showed that the K a/K s ratios of all gene pairs were < 1, suggesting that CaLEA genes probably underwent a strict purifying selection effect during the evolutionary search. This also implies that the duplication genes are structurally stable, evolutionarily conserved and likely to have consistent functions. The divergence time refers to the approximate date of a duplication event. Eight tandem duplication events occurred 10–115 million years ago (MYA), and the divergence times of the two segmental duplication events were 45 and 149 MYA.
We also conducted synteny analysis between pepper and other species, including Arabidopsis, potato, and tomato (Fig. S2). We identified a total of 29 pairs of homologous genes between pepper and Arabidopsis, 57 pairs between pepper and tomato, and 62 pairs between pepper and potato (Table S4). Remarkably, there is a higher number of LEA homologous gene pairs between pepper and the two other Solanaceae species, tomato and potato, indicating a high level of evolutionary conservation among LEA genes in these species. Additionally, we found that 44 CaLEA genes share one or two homologous gene pairs in tomato and potato, such as CaLEA22 and CaLEA60, suggesting their significant role in the evolution of Solanaceae. Some of these CaLEA genes also have homologous pairs in Arabidopsis, tomato, and potato.
Expression profiles of CaLEA genes in different tissues and organs
To investigate the expression patterns of CaLEA genes in different tissues and organs of pepper plants, systematic analyses of publicly available transcriptome data were performed. Most CaLEA genes exhibited diverse tissue‐specific expression patterns across 17 tissues of pepper, indicating that they are likely to be engaged in diverse developmental processes. The placenta is the part of the plant where the ovules grow. Overall, the expression levels of CaLEAs in the placenta were higher than those in the pericarp, indicating that most CaLEAs play a crucial role in ovule development, particularly during the fruit‐breaking period (Fig. 4). Notably, CaLEA20, CaLEA5, CaLEA50, CaLEA44, CaLEA17, CaLEA21, CaLEA63, CaLEA24, and CaLEA58 from five different subfamilies were highly expressed in flowers, suggesting they may participate in flower development. The mRNA of most members of the LEA_2 group, such as CaLEA15, CaLEA67, and CaLEA41, accumulated in the stems and roots, indicating their involvement in the development of these tissues or organs. Most duplicated gene pairs had relatively similar expression patterns (CaLEA7/CaLEA8, CaLEA39/CaLEA40, CaLEA64/CaLEA65, CaLEA45/CaLEA56, and CaLEA34/CaLEA35/CaLEA36/CaLEA37), although the expression values were different in a single tissue. However, two genes (CaLEA43 and CaLEA58) were silenced in all tested tissues.
Fig. 4.
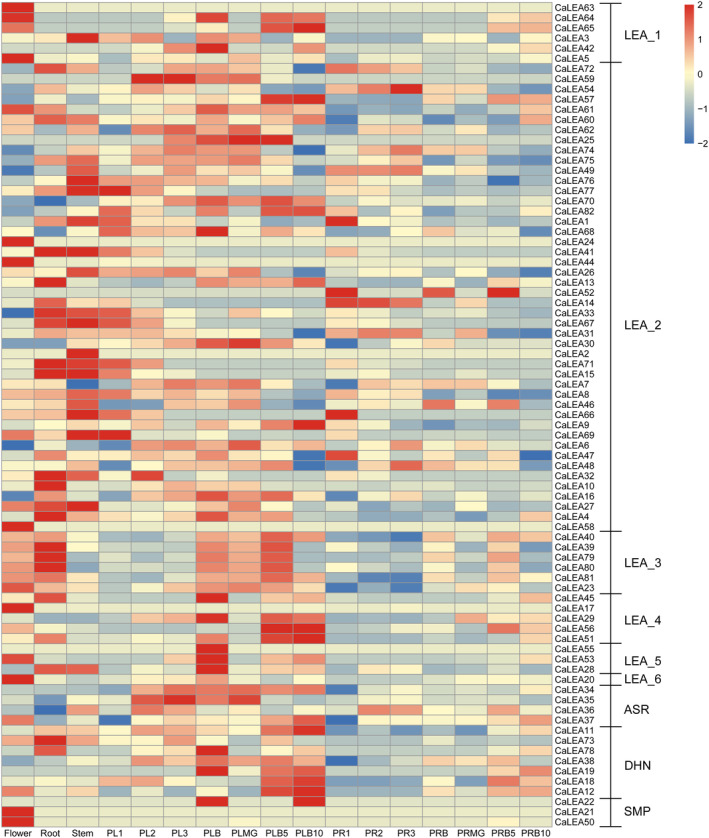
Expression profiles of CaLEA genes in different tissues of pepper. Dynamic expression profiles of CaLEA genes for 15 different development tissues or organ systems according to publicly available transcriptome data. Seven periods (1, 2, 3, mature green, breaker, breaker plus 5 days, breaker plus 10 days) of placenta and pericarp were included in the data.
Expression profiles of CaLEAs under abiotic stresses
Previous studies that LEA genes are induced when plants are exposed to stress such as drought, low temperatures, and osmotic stress [34]. Therefore, the expression profiles of CaLEA genes were examined under abiotic stress responses, including cold, heat, salt, and osmotic stresses, using publicly available transcriptome data (Fig. 5). In addition to CaLEA2, CaLEA24, CaLEA37, CaLEA43, CaLEA50, CaLEA55, and CaLEA58, the remaining CaLEA genes were responsive to at least one stress. It was found that about 3/5 of CaLEA genes were upregulated during 6–72 h of cold stress. CaLEA18, CaLEA65, CaLEA40, CaLEA56, CaLEA12, CaLEA45, CaLEA11, and CaLEA29 exhibited robust responses to cold stress, which were further confirmed through validation using quantitative reverse transcription polymerase chain reaction (qRT‐PCR; Fig. 6). The expression of these nine genes was rapidly upregulated after cold treatment and accumulated to a maximum after 12–72 h. Among them, CaLEA68 and CaLEA40 peaked at 72 h, while CaLEA12, CaLEA18, CaLEA45, CaLEA11, and CaLEA56 all peaked at 24 h. MicroRNAs are important regulators of gene expression. Therefore, predictive analyses were conducted between nine CaLEAs in Fig. 6 and miRNAs (Table S6). The prediction results showed that the gene expression of CaLEA68, CaLEA40, and CaLEA45 might be regulated by miRNAs. Specifically, CaLEA68 may be regulated by three miRNAs, including can‐miRC21‐3p, can‐miR1446a‐5p.2, and can‐miR1446b‐5p.2. We also found that the mRNA levels of most CaLEA genes increased after 24 h of salt stress, especially CaLEA22. Simultaneously, some LEA_1, LEA_2, and ASR genes were repressed under heat stress, whereas other subfamilies did not significantly respond to heat stress. Another promising finding was that most LEA_1, LEA_3, LEA_4, LEA_5, LEA_6, and DHN were induced under drought stress from 12 to 72 h.
Fig. 5.

Expression changes of CaLEA genes in pepper under different abiotic stress treatment in pepper. 3 h, 6 h, 12 h, 24 h, and 72 h represent the fold changes after different stress treatments at 3 h, 6 h, 12 h, 24 h, and 72 h treatments, respectively.
Effect of exogenous hormone treatment on CaLEA expression
To determine whether hormones induce the expression of CaLEAs, we investigated the responses of CaLEAs to four hormones (MeJA, methyl jasmonate; SA, salicylic acid; ET, ethylene; and ABA, abscisic acid) using transcriptome data (Fig. 7). Most LEA_3 genes were significantly upregulated after SA and ET. Some genes showed significant changes in expression levels after 24 h of either ABA or MeJA treatment, such as CaLEA35, CaLEA20, CaLEA56, CaLEA11, and CaLEA20 were upregulated, while CaLEA8 and CaLEA1 were downregulated (Fig. 7). In addition, extremely different expression patterns were observed in several replicated gene pairs. By way of illustration, the maximum accumulation of CaLEA45 occurred 3–6 h after SA treatment, but the expression level of CaLEA56 decreased a little after SA treatment.
Fig. 7.

Expression changes of CaLEA genes in pepper under different phytohormone treatments. 1, 3, 6, 12, and 24 h represent the fold changes after different stress treatments at 1, 3, 6, 12, and 24 h, respectively.
Discussion
Late embryogenesis abundant belongs to a class of proteins that participate in embryonic development and abiotic stress responses. Genome‐wide analyses of LEA genes have been conducted in several species. In this study, we identified 82 LEA genes in the pepper (C. annuum cv. CM334) genome, which were divided into nine subfamilies. The LEA_2 subfamily contained the most genes, accounting for 41% of the CaLEA family. This proportion is similar to that observed in most of the species studied thus far [25, 26, 30, 54, 55]. LEA_6 is the smallest subfamily with only one member, but LEA_6 subfamily is absent in a few species, such as tomato, tea plants, and Ramonda serbica Panc. [13, 30, 36]. The number of CaLEA genes is roughly equal to that of other Solanaceae species such as tobacco [55] and potato [26], and the distribution of the number of subfamily genes is also similar. In addition, the AtM subfamily was not detected in pepper, probably because it is only present in the Cruciferae [9]. These results suggest that there are variations in the LEA gene family in certain plants. Based on our findings, all CaLEA family proteins are hydrophilic, except for 13 members of the LEA_2 subfamily. This result is consistent with those of previous studies on S. tuberosum [26] and A. thaliana [9]. The members of the LEA_2 subfamily have been reported to exhibit distinct characteristics, unique structures, and potentially novel functions. This could be attributed to the fact that genes in the LEA_2 subfamily are heterologous with other LEA subfamilies. Structurally, LEA_2 subfamily proteins are highly hydrophobic, which can be attributed to the presence of the Water stress and Hypersensitive response (WHy) domain in these proteins. Furthermore, it has been observed that some members of the LEA_2 subfamily possess transmembrane helices [56]. There are two pairs of tandem duplication and one pair of segmental duplication belongs to LEA_2, which supports the previous study that duplication contributed to the expansion and diversity of LEA_2 [57].
Analysis of motifs revealed significant differences among different subfamilies, while members within the same subfamily frequently shared similar motifs. This indicates that these conserved motifs play an important role in the evolution of the LEA gene family. Previous studies have reported that LEA proteins may require specific motifs for performing their specific functions to recognize and bind specific ligands. For instance, LEA_5 and LEA_3 groups each owned one specific motif, motif 14, and motif 2. Because of their amino acid composition, LEA proteins are disordered along their sequence [58]. For example, a group of desiccation‐upregulated LEA proteins in R. serbica Panc., particularly LEA_1, LEA_3, DHN proteins, showed the highest propensity for disorder, while members of LEA_2 family showed the lowest disorder propensity [30]. The structural flexibility of LEA proteins is responsible for their interactions with other macromolecules (e.g., membrane proteins), thereby protecting them from stress factors [59]. Under drought stress conditions, DHNs have been suggested to have the ability to bind DNA and chelate metals. On the contrary, other intrinsically disordered LEA proteins may play a role in adopting an amphipathic α‐helical conformation or forming intracellular proteinaceous condensates. These processes could contribute to maintaining cell membrane stability in response to drought stress [30]. The support provided by these proteins to the membranes is achieved through specific structural features. The hydrophobic strip present on the class A α‐helices is positioned in a way that it can interact with the hydrophobic fatty acid tails of the outer plasma membrane, inner mitochondrial membrane, or peroxisomal membrane. Additionally, the positive strip on these α‐helices can form electrostatic interactions with the negatively charged phosphate groups of phospholipids, further contributing to the support and stability of the membranes [30, 60]. According to a previous study, genetic evolution was the reason for the low number of introns. Intron reduction shortens the time from transcription to translation, thus making genes rapidly to produce functional proteins in response to stress [25, 61, 62]. The feature of low intron number was also found in other stress‐related gene families, such as hsp20 [63]. In this study, up to 85.4% of the CaLEA genes contained no intron or only one intron, which provides further evidence that CaLEA is a stress‐response family. Gene duplication is a leading factor in the amplification and evolution of gene families [64]. Two pairs of segmental duplications and eight pairs of tandem duplications were identified in the CaLEA family. Interestingly, most members of the ASRs and SMPs were tandemly duplicated genes, suggesting that tandem replication is the main pathway of amplification in the subfamily.
Typically, further insight into gene function can be obtained from gene expression analysis. Most LEA genes were prominently expressed in the placenta compared with those in the pericarp, reflecting the CaLEA closely associated with seed development [65]. The expression patterns of most CaLEA duplicated gene pairs are relatively similar, suggesting these gene pairs are evolutionarily conserved and may have uniform functions. However, a few duplicated genes showed an obvious divergence in the expression pattern, indicating they may function differently in pepper, which may be the results of evolutionary selection. Previous studies have suggested that LEA proteins are involved in abiotic stresses, including cold, drought, heat, and salt stress [25, 26, 28, 33, 35, 36, 40, 41, 66]. 3/5 CaLEA genes were induced under cold stress, most of which belonged to the LEA_3, LEA_4, DHN, and LEA_2 subfamilies, whereas 1/5 genes were significantly repressed. Furthermore, gene expression in the DHN subgroup was induced under osmotic, salt, and cold stresses. Chen et al. [66] revealed that the expression of CaDHN1 cloned from C. annuum P70 was significantly upregulated following treatment with osmotic stress, salt stress, cold stress, and SA. Sequence similarity between CaLEA38 and CaDHN1 in the DHN subgroup was 97%. CaLEA82, belonging to LEA_2 subfamily, is highly similar to the previously named CaLEA6 with a sequence of more than 200 bp. In transcriptome analysis, the expression of CaLEA82 gene increased significantly under drought and salt stress, but high temperature and low temperature did not affect the expression. This result supports the function of CaLEA6, which was previously studied to play a potentially protective role when dehydration and high salinity caused water deficit [39]. Lim et al. discover that CaDIL1 positively regulates the ABA signaling and drought stress. CaDIL1 corresponds to CaLEA29 in our study, and the transcriptome analysis can also prove the correctness of previous studies [67]. Similar results have been reported in previous studies; LEA_1, LEA_2, LEA_4, and DHN subfamily genes were responsive to salt and drought stress in tomato, and some abiotic stress‐responsive cis‐elements are also found in the upstream sequences of most SlLEAs [36]. In Sa. miltiorrhiza, the majority of SmLEA genes were also induced by drought stress [35]. Specifically, this includes most members of the SmLEA_1, SmLEA_4, and SmSMP subfamilies, as well as all members of the SmLEA_3, SmLEA_5, and SmDHN subfamilies [35]. It is clear that the expression of CaLEA is induced by various abiotic stresses, suggesting that they may regulate plant responses to diverse abiotic stress‐related biological processes.
Conclusions
In the present study, a genome‐wide analysis, including phylogenetic relationships, gene structure, gene duplication, chromosomal location, synteny analysis, and expression profiling of LEA genes, was performed in C. annuum. We identified 82 LEA genes in the C. annuum genome, and these genes were divided into nine subfamilies. Physiochemical properties and motif analyses showed that genes of the same subfamily were similar and conserved, whereas the differences between different subfamilies were very large, reflecting their similar/different functions. We also found that tandem duplication was the main factor in the expansion of the ASR and SMP subfamilies. Because CaLEA expression in the placenta was higher than that in the pericarp, it can be concluded that CaLEA is involved in pepper seed development. From the expression profile analysis, we can infer that most CaLEAs play important roles in abiotic stress. Overall, our results offer meaningful information for future functional studies on CaLEA genes.
Conflict of interest
The authors declare no conflict of interest.
Peer review
The peer review history for this article is available at https://www.webofscience.com/api/gateway/wos/peer‐review/10.1002/2211‐5463.13718.
Author contributions
ZZ, ZL, YZ, FG, XG, YHu, and LF designed the study. ZZ, YZ, YHao, ZD, and WT performed the experiments. YZ, ZD, XW, JL, and LW analyzed the data. YZ, ZZ, ZL, and FG wrote the manuscript. All the authors contributed to the manuscript and approved the submitted version.
Supporting information
Fig. S1. Distribution of major functional cis‐elements in the promoter sequences of the CaLEA genes.
Fig. S2. Synteny analyses of CaLEAs among Arabidopsis thaliana, Capsicum annuum, Solanum lycopersicum, and Solanum tuberosum.
Table S1. Characteristics of genes encoding LEA proteins in C. annuum.
Table S2. Conserved motifs identified by MEME tools in CaLEA proteins.
Table S3. Estimated Ka/Ks ratios and divergence times of duplicated CaLEAs.
Table S4. LEA homologous gene pairs between C. annuum and other species such as Arabidopsis, potato, and tomato.
Table S5. qRT‐PCR primer sequence used in this paper.
Table S6. Putative miRNAs and their potential target of LEA genes.
Acknowledgements
The research was supported by the Project of Central Public‐interest Scientific Institution Basal Research Fund, Grant No: 1630032022009, Project of the PhD Scientific Research and Innovation Foundation of Sanya Yazhou Bay Science and Technology City, Grant No: HSPHDSRF‐2023‐04‐015, Hainan Provincial Natural Science Foundation of China: 320LH002, Project of Sanya Yazhou Bay Science and Technology City, Grant No: SCKJ‐JYRC‐2022‐05 and SCKJ‐JYRC‐2022‐25.
Edited by So Nakagawa
Contributor Information
Fenglin Gu, Email: xiaogu4117@catas.cn.
Ziji Liu, Email: liuziji1982@catas.cn.
Zhiyuan Zhang, Email: 0016829@zju.edu.cn.
Data accessibility
The genome sequences of C. annuum were downloaded from the C. annuum (cultivar CM334) genome database (http://peppergenome.snu.ac.kr). The transcriptome data were downloaded from the NCBI Sequence Read Archive (SRA) database (https://www.ncbi.nlm.nih.gov/sra): gene expression in different tissues (leaves, stems, roots, placenta, and pericarp) of C. annuum (PRJNA223222); the plant in C. annuum response to abiotic stress, including heat, cold, salinity, and osmotic stress (PRJNA525913); and gene expression in C. annuum after hormone treatment (PRJNA634831).
References
- 1. Dure L, Greenway SC and Galau GA (1981) Developmental biochemistry of cottonseed embryogenesis and germination changing messenger ribonucleic acid populations as shown by in vitro and in vivo protein synthesis. Biochemistry 20, 4162–4168. [DOI] [PubMed] [Google Scholar]
- 2. Kikawada T, Nakahara Y, Kanamori Y, Iwata K, Watanabe M, McGee B, Tunnacliffe A and Okuda T (2006) Dehydration‐induced expression of LEA proteins in an anhydrobiotic chironomid. Biochem Biophys Res Commun 348, 56–61. [DOI] [PubMed] [Google Scholar]
- 3. Garay‐Arroyo A, Colmenero‐Flores JM, Garciarrubio A and Covarrubias AA (2000) Highly hydrophilic proteins in prokaryotes and eukaryotes are common during conditions of water deficit. J Biol Chem 275, 5668–5674. [DOI] [PubMed] [Google Scholar]
- 4. Gal TZ, Glazer I and Koltai H (2004) An LEA group 3 family member is involved in survival of C. elegans during exposure to stress. FEBS Lett 577, 21–26. [DOI] [PubMed] [Google Scholar]
- 5. Hand S, Menze MA, Toner M, Boswell L and Moore D (2010) LEA proteins during water stress: not just for plants anymore. Annu Rev Physiol 73, 115–134. [DOI] [PubMed] [Google Scholar]
- 6. Shao HB, Liang ZS and Shao MA (2005) LEA proteins in higher plants: structure, function, gene expression and regulation. Colloids Surf B Biointerfaces 45, 131–135. [DOI] [PubMed] [Google Scholar]
- 7. Olvera‐Carrillo Y, Campos F, Reyes JL, Garciarrubio A and Covarrubias AA (2010) Functional analysis of the group 4 late embryogenesis abundant proteins reveals their relevance in the adaptive response during water deficit in Arabidopsis. Plant Physiol 154, 373–390. [DOI] [PMC free article] [PubMed] [Google Scholar]
- 8. George S, Usha B and Parida A (2009) Isolation and characterization of an atypical LEA protein coding cDNA and its promoter from drought‐tolerant plant Prosopis juliflora . Appl Biochem Biotechnol 157, 244–253. [DOI] [PubMed] [Google Scholar]
- 9. Hundertmark M and Hincha DK (2008) LEA (late embryogenesis abundant) proteins and their encoding genes in Arabidopsis thaliana . BMC Genomics 9, 118. [DOI] [PMC free article] [PubMed] [Google Scholar]
- 10. Hunault G and Jaspard E (2010) LEAPdb: a database for the late embryogenesis abundant proteins. BMC Genomics 11, 221. [DOI] [PMC free article] [PubMed] [Google Scholar]
- 11. Gonzalez RM and Iusem ND (2014) Twenty years of research on Asr (ABA‐stress‐ripening) genes and proteins. Planta 239, 941–949. [DOI] [PubMed] [Google Scholar]
- 12. Li N, Xu R and Li Y (2019) Molecular networks of seed size control in plants. Annu Rev Plant Biol 70, 435–463. [DOI] [PubMed] [Google Scholar]
- 13. Jin XF, Cao D, Wang Z, Ma L, Tian K, Liu Y, Gong Z, Zhu X, Jiang C and Li Y (2019) Genome‐wide identification and expression analyses of the LEA protein gene family in tea plant reveal their involvement in seed development and abiotic stress responses. Sci Rep 9, 14123. [DOI] [PMC free article] [PubMed] [Google Scholar]
- 14. Leprince O, Pellizzaro A, Berriri S and Buitink J (2017) Late seed maturation: drying without dying. J Exp Bot 68, 827–841. [DOI] [PubMed] [Google Scholar]
- 15. Chatelain E, Hundertmark M, Leprince O, Le Gall S, Satour P, Deligny‐Penninck S, Rogniaux H and Buitink J (2012) Temporal profiling of the heat‐stable proteome during late maturation of Medicago truncatula seeds identifies a restricted subset of late embryogenesis abundant proteins associated with longevity. Plant Cell Environ 35, 1440–1455. [DOI] [PubMed] [Google Scholar]
- 16. Miyazaki K, Ohkubo Y, Yasui H, Tashiro R, Suzuki R, Teramura H, Kusano H and Shimada H (2021) Overexpression of rice OsLEA5 relieves the deterioration in seed quality caused by high‐temperature stress. Plant Biotechnol 38, 367–371. [DOI] [PMC free article] [PubMed] [Google Scholar]
- 17. Yang S‐Y, Shih M‐D, Lin T‐P and Y‐IC H (2011) Two soybean (Glycine max L.) GmPM proteins reduce liposome leakage during desiccation. Bot Stud 52, 465–470. [Google Scholar]
- 18. Vidović M, Battisti I, Pantelić A, Morina F, Arrigoni G, Masi A and Jovanović SV (2022) Desiccation tolerance in Ramonda serbica Panc.: an integrative transcriptomic, proteomic, metabolite and photosynthetic study. Plants 11, 1199. [DOI] [PMC free article] [PubMed] [Google Scholar]
- 19. Li Z, Chi H, Liu C, Zhang T, Han L, Li L, Pei X and Long Y (2021) Genome‐wide identification and functional characterization of LEA genes during seed development process in linseed flax (Linum usitatissimum L.). BMC Plant Biol 21, 193. [DOI] [PMC free article] [PubMed] [Google Scholar]
- 20. Zhang H, Zhao Y and Zhu JK (2020) Thriving under stress: how plants balance growth and the stress response. Dev Cell 55, 529–543. [DOI] [PubMed] [Google Scholar]
- 21. Olvera‐Carrillo Y, Luis Reyes J and Covarrubias AA (2011) Late embryogenesis abundant proteins versatile players in the plant adaptation to water limiting environments. Plant Signal Behav 6, 586–589. [DOI] [PMC free article] [PubMed] [Google Scholar]
- 22. Oliveira E, Amara I, Bellido D, Odena MA, Domínguez E, Pagès M and Goday A (2007) LC‐MSMS identification of Arabidopsis thaliana heat‐stable seed proteins: enriching for LEA‐type proteins by acid treatment. J Mass Spectrom 42, 1485–1495. [DOI] [PubMed] [Google Scholar]
- 23. Farrant JM (2007) Mechanisms of desiccation tolerance in angiosperm resurrection plants. In Plant Desiccation Tolerance (Jenks A and Wood AJ, eds), pp. 51–90. CAB International Press, Wallingford. [Google Scholar]
- 24. Dirk LMA, Abdel CG, Ahmad I, Neta ICS, Pereira CC, Pereira FECB, Unêda‐Trevisoli SH, Pinheiro DG and Downie AB (2020) Late embryogenesis abundant protein–client protein interactions. Plan Theory 9, 814. [DOI] [PMC free article] [PubMed] [Google Scholar]
- 25. Magwanga RO, Lu P, Kirungu JN, Lu H, Wang X, Cai X, Zhou Z, Zhang Z, Salih H, Wang K et al. (2018) Characterization of the late embryogenesis abundant (LEA) proteins family and their role in drought stress tolerance in upland cotton. BMC Genet 19, 6. [DOI] [PMC free article] [PubMed] [Google Scholar]
- 26. Chen YK, Li C, Zhang B, Yi J, Yang Y, Kong C, Lei C and Gong M (2019) The role of the late embryogenesis‐abundant (LEA) protein family in development and the abiotic stress response: a comprehensive expression analysis of potato (Solanum tuberosum). Genes 10, E148. [DOI] [PMC free article] [PubMed] [Google Scholar]
- 27. Zeng X, Ling H, Yang J, Li Y and Guo S (2018) LEA proteins from Gastrodia elata enhance tolerance to low temperature stress in Escherichia coli . Gene 646, 136–142. [DOI] [PubMed] [Google Scholar]
- 28. Duan JL and Cai WM (2012) OsLEA3‐2, an abiotic stress induced gene of rice plays a key role in salt and drought tolerance. PLoS One 7, e45117. [DOI] [PMC free article] [PubMed] [Google Scholar]
- 29. Hara M, Terashima S, Fukaya T and Kuboi T (2003) Enhancement of cold tolerance and inhibition of lipid peroxidation by citrus dehydrin in transgenic tobacco. Planta 217, 290–298. [DOI] [PubMed] [Google Scholar]
- 30. Pantelić A, Stevanović S, Komić SM, Kilibarda N and Vidović M (2022) In silico characterisation of the late embryogenesis abundant (LEA) protein families and their role in desiccation tolerance in Ramonda serbica Panc. Int J Mol Sci 23, 3547. [DOI] [PMC free article] [PubMed] [Google Scholar]
- 31. Goyal K, Walton LJ and Tunnacliffe A (2005) LEA proteins prevent protein aggregation due to water stress. Biochem J 388, 151–157. [DOI] [PMC free article] [PubMed] [Google Scholar]
- 32. Reyes JL, Campos F, Wei H, Arora R, Yang Y, Karlson DT and Covarrubias AA (2008) Functional dissection of hydrophilins during in vitro freeze protection. Plant Cell Environ 31, 1781–1790. [DOI] [PubMed] [Google Scholar]
- 33. Kosova K, Vitamvas P and Prasil IT (2007) The role of dehydrins in plant response to cold. Biol Plant 51, 601–617. [Google Scholar]
- 34. Wang XS, Zhu HB, Jin GL, Liu HL, Wu WR and Zhu J (2007) Genome‐scale identification and analysis of LEA genes in rice (Oryza sativa L.). Plant Sci 172, 414–420. [Google Scholar]
- 35. Chen J, Li N, Wang X, Meng X, Cui X, Chen Z, Ren H, Ma J and Liu H (2021) Late embryogenesis abundant (LEA) gene family in Salvia miltiorrhiza: identification, expression analysis, and response to drought stress. Plant Signal Behav 16, 1891769. [DOI] [PMC free article] [PubMed] [Google Scholar]
- 36. Cao J and Li X (2015) Identification and phylogenetic analysis of late embryogenesis abundant proteins family in tomato (Solanum lycopersicum). Planta 241, 757–772. [DOI] [PubMed] [Google Scholar]
- 37. Kim S, Park M, Yeom S‐I, Kim Y‐M, Lee JM, Lee H‐A, Seo E, Choi J, Cheong K, Kim K‐T et al. (2014) Genome sequence of the hot pepper provides insights into the evolution of pungency in Capsicum species. Nat Genet 46, 270–278. [DOI] [PubMed] [Google Scholar]
- 38. Acosta‐Garcia G, Chapa‐Oliver AM, Millán‐Almaraz JR, Guevara‐González RG, Cortez‐Baheza E, Rangel‐Cano RM, Ramírez‐Pimentel JG, Cruz‐Hernandez A, Guevara‐Olvera L, Aguilera‐Bibian JE et al. (2015) CaLEA 73 gene from Capsicum annuum L. enhances drought and osmotic tolerance modulating transpiration rate in transgenic Arabidopsis thaliana . Can J Plant Sci 95, 227–235. [Google Scholar]
- 39. Kim HS, Lee JH, Kim JJ, Kim C‐H, Jun S‐S and Hong Y‐N (2005) Molecular and functional characterization of CaLEA6, the gene for a hydrophobic LEA protein from Capsicum annuum . Gene 344, 115–123. [DOI] [PubMed] [Google Scholar]
- 40. Lim CW, Lim S, Baek W and Lee SC (2015) The pepper late embryogenesis abundant protein CaLEA1 acts in regulating abscisic acid signaling, drought and salt stress response. Physiol Plant 154, 526–542. [DOI] [PubMed] [Google Scholar]
- 41. Luo D, Hou X, Zhang Y, Meng Y, Zhang H, Liu S, Wang X and Chen R (2019) CaDHN5, a dehydrin gene from pepper, plays an important role in salt and osmotic stress responses. Int J Mol Sci 20, 1989. [DOI] [PMC free article] [PubMed] [Google Scholar]
- 42. Finn RD, Mistry J, Tate J, Coggill P, Heger A, Pollington JE, Gavin OL, Gunasekaran P, Ceric G, Forslund K et al. (2010) The Pfam protein families database. Nucleic Acids Res 38, D211–D222. [DOI] [PMC free article] [PubMed] [Google Scholar]
- 43. Gasteiger E, Gattiker A, Hoogland C, Ivanyi I, Appel RD and Bairoch A (2003) ExPASy: the proteomics server for in‐depth protein knowledge and analysis. Nucleic Acids Res 31, 3784–3788. [DOI] [PMC free article] [PubMed] [Google Scholar]
- 44. Kumar S, Stecher G and Tamura K (2016) MEGA7: molecular evolutionary genetics analysis version 7.0 for bigger datasets. Mol Biol Evol 33, 1870–1874. [DOI] [PMC free article] [PubMed] [Google Scholar]
- 45. Chen CJ, Chen H, Zhang Y, Thomas HR, Frank MH, He Y and Xia R (2020) TBtools: an integrative toolkit developed for interactive analyses of big biological data. Mol Plant 13, 1194–1202. [DOI] [PubMed] [Google Scholar]
- 46. Bailey TL, Boden M, Buske FA, Frith M, Grant CE, Clementi L, Ren J, Li WW and Noble WS (2009) MEME SUITE: tools for motif discovery and searching. Nucleic Acids Res 37, W202–W208. [DOI] [PMC free article] [PubMed] [Google Scholar]
- 47. Wang YL, Xiao J, Suzek TO, Zhang J, Wang J, Zhou Z, Han L, Karapetyan K, Dracheva S, Shoemaker BA et al. (2012) PubChem's BioAssay database. Nucleic Acids Res 40, D400–D412. [DOI] [PMC free article] [PubMed] [Google Scholar]
- 48. Lynch M and Conery JS (2000) The evolutionary fate and consequences of duplicate genes. Science 290, 1151–1155. [DOI] [PubMed] [Google Scholar]
- 49. Kim D, Paggi JM, Park C, Bennett C and Salzberg SL (2019) Graph‐based genome alignment and genotyping with HISAT2 and HISAT‐genotype. Nat Biotechnol 37, 907–915. [DOI] [PMC free article] [PubMed] [Google Scholar]
- 50. Pertea M, Pertea GM, Antonescu CM, Chang T‐C, Mendell JT and Salzberg SL (2015) StringTie enables improved reconstruction of a transcriptome from RNA‐seq reads. Nat Biotechnol 33, 290–295. [DOI] [PMC free article] [PubMed] [Google Scholar]
- 51. Qin C, Yu C, Shen Y, Fang X, Chen L, Min J, Cheng J, Zhao S, Xu M, Luo Y et al. (2014) Whole‐genome sequencing of cultivated and wild peppers provides insights into Capsicum domestication and specialization. Proc Natl Acad Sci USA 111, 5135–5140. [DOI] [PMC free article] [PubMed] [Google Scholar]
- 52. Ma J, Zuo D, Ye H, Yan Y, Li M and Zhao P (2023) Genome‐wide identification, characterization, and expression pattern of the late embryogenesis abundant (LEA) gene family in Juglans regia and its wild relatives J. mandshurica . BMC Plant Biol 23, 80. [DOI] [PMC free article] [PubMed] [Google Scholar]
- 53. Koag M‐C, Wilkens S, Fenton RD, Resnik J, Vo E and Close TJ (2009) The K‐segment of maize DHN1 mediates binding to anionic phospholipid vesicles and concomitant structural changes. Plant Physiol 150, 1503–1514. [DOI] [PMC free article] [PubMed] [Google Scholar]
- 54. Altunoglu YC, Baloglu P, Yer EN, Pekol S and Baloglu MC (2016) Identification and expression analysis of LEA gene family members in cucumber genome. Plant Growth Regul 80, 225–241. [Google Scholar]
- 55. Geng W, Wang Y, Zhang J, Liu Z, Chen X, Qin L, Yang L and Tang H (2022) Genome‐wide identification and expression analyses of late embryogenesis abundant (LEA) gene family in tobacco (Nicotiana tabacum L.) reveal their function in abiotic stress responses. Gene 836, 146665. [DOI] [PubMed] [Google Scholar]
- 56. Jaspard E and Hunault G (2014) Comparison of amino acids physico‐chemical properties and usage of late embryogenesis abundant proteins, hydrophilins and WHy domain. PLoS One 9, e109570. [DOI] [PMC free article] [PubMed] [Google Scholar]
- 57. Artur MAS, Zhao T, Ligterink W, Schranz E and Hilhorst HWM (2018) Dissecting the genomic diversification of late embryogenesis abundant (LEA) protein gene families in plants. Genome Biol Evol 11, 459–471. [DOI] [PMC free article] [PubMed] [Google Scholar]
- 58. Dure L, Crouch M, Harada J, Ho TH, Mundy J, Quatrano R, Thomas T and Sung ZR (1989) Common amino acid sequence domains among the lea proteins of higher plants. Plant Mol Biol 12, 475–486. [DOI] [PubMed] [Google Scholar]
- 59. Patil A and Nakamura H (2006) Disordered domains and high surface charge confer hubs with the ability to interact with multiple proteins in interaction networks. FEBS Lett 580, 2041–2045. [DOI] [PubMed] [Google Scholar]
- 60. Bremer A, Kent B, Hauß T, Thalhammer A, Yepuri NR, Darwish TA, Garvey CJ, Bryant G and Hincha DK (2017) Intrinsically disordered stress protein COR15A resides at the membrane surface during dehydration. Biophys J 113, 572–579. [DOI] [PMC free article] [PubMed] [Google Scholar]
- 61. Jeffares DC, Penkett CJ and Bahler J (2008) Rapidly regulated genes are intron poor. Trends Genet 24, 375–378. [DOI] [PubMed] [Google Scholar]
- 62. Lane N and Martin W (2010) The energetics of genome complexity. Nature 467, 929–934. [DOI] [PubMed] [Google Scholar]
- 63. Ji XR, Yu Y‐H, Ni P‐Y, Zhang G‐H and Guo D‐L (2019) Genome‐wide identification of small heat‐shock protein (HSP20) gene family in grape and expression profile during berry development. BMC Plant Biol 19, 433. [DOI] [PMC free article] [PubMed] [Google Scholar]
- 64. Flagel LE and Wendel JF (2009) Gene duplication and evolutionary novelty in plants. New Phytol 183, 557–564. [DOI] [PubMed] [Google Scholar]
- 65. Wilhelm KS and Thomashow MF (1993) Arabidopsis thaliana cor15b, an apparent homolog of cor15a, is strongly responsive to cold and aba, but not drought. Plant Mol Biol 23, 1073–1077. [DOI] [PubMed] [Google Scholar]
- 66. Chen R, Jing H, Guo W, Wang S‐B, Ma F, Pan B‐G and Gong Z‐H (2015) Silencing of dehydrin CaDHN1 diminishes tolerance to multiple abiotic stresses in Capsicum annuum L. Plant Cell Rep 34, 2189–2200. [DOI] [PubMed] [Google Scholar]
- 67. Lim J, Lim CW and Lee SC (2018) The pepper late embryogenesis abundant protein, CaDIL1, positively regulates drought tolerance and ABA signaling. Front Plant Sci 9, 301–308. [DOI] [PMC free article] [PubMed] [Google Scholar]
Associated Data
This section collects any data citations, data availability statements, or supplementary materials included in this article.
Supplementary Materials
Fig. S1. Distribution of major functional cis‐elements in the promoter sequences of the CaLEA genes.
Fig. S2. Synteny analyses of CaLEAs among Arabidopsis thaliana, Capsicum annuum, Solanum lycopersicum, and Solanum tuberosum.
Table S1. Characteristics of genes encoding LEA proteins in C. annuum.
Table S2. Conserved motifs identified by MEME tools in CaLEA proteins.
Table S3. Estimated Ka/Ks ratios and divergence times of duplicated CaLEAs.
Table S4. LEA homologous gene pairs between C. annuum and other species such as Arabidopsis, potato, and tomato.
Table S5. qRT‐PCR primer sequence used in this paper.
Table S6. Putative miRNAs and their potential target of LEA genes.
Data Availability Statement
The genome sequences of C. annuum were downloaded from the C. annuum (cultivar CM334) genome database (http://peppergenome.snu.ac.kr). The transcriptome data were downloaded from the NCBI Sequence Read Archive (SRA) database (https://www.ncbi.nlm.nih.gov/sra): gene expression in different tissues (leaves, stems, roots, placenta, and pericarp) of C. annuum (PRJNA223222); the plant in C. annuum response to abiotic stress, including heat, cold, salinity, and osmotic stress (PRJNA525913); and gene expression in C. annuum after hormone treatment (PRJNA634831).