

Abstract
Prediction of psychosis in patients at clinical high risk (CHR) has become a mainstream focus of clinical and research interest worldwide. When using CHR instruments for clinical purposes, the predicted outcome is but only a probability; and, consequently, any therapeutic action following the assessment is based on probabilistic prognostic reasoning. Yet, probabilistic reasoning makes considerable demands on the clinicians. We provide here a scholarly practical guide summarising the key concepts to support clinicians with probabilistic prognostic reasoning in the CHR state. We review risk or cumulative incidence of psychosis in, person-time rate of psychosis, Kaplan-Meier estimates of psychosis risk, measures of prognostic accuracy, sensitivity and specificity in receiver operator characteristic curves, positive and negative predictive values, Bayes’ theorem, likelihood ratios, potentials and limits of real-life applications of prognostic probabilistic reasoning in the CHR state. Understanding basic measures used for prognostic probabilistic reasoning is a prerequisite for successfully implementing the early detection and prevention of psychosis in clinical practice. Future refinement of these measures for CHR patients may actually influence risk management, especially as regards initiating or withholding treatment.
Introduction
Psychoses, in particular schizophrenia, are still one of the most costly and disabling disorders, despite their low incidence of 0.032 per 100 person-years (95% CI from 0.025 to 0.041 per 100 person-years).1 One cause of poor outcome of psychosis is their often long delay in adequate treatment initiation which his worsening the long-term general symptomatic outcome, positive and negative symptoms, likelihood of remission, social functioning and global outcome.2 Thus, over the past two decades, increasing efforts have been made to detect and treat psychosis early, preferably already during its prodromal phase of often many years in order to reduce the duration of untreated psychosis and improve the clinical outcomes.3 To an indicated prevention of psychosis in persons seeking help already for mental problems, two alternative clinical high risk (CHR) approaches to an early detection were developed: (1) the ultra-high risk (UHR) approach including attenuated psychotic symptoms (APS), brief limited intermittent psychotic symptoms or brief intermittent psychotic symptoms (BLIPS/BIPS) as well as a combination of genetic risk and functional decline (GRFD) and (2) the basic symptom (BS) approach based on subjective, subtle cognitive and perceptive disturbances that form two partly overlapping criteria.4 Both approaches (BS and UHR) as well as the instruments specifically developed for their assessment have shown the ability to detect a considerably increased CHR for psychosis with pooled 1–3-year conversion rates to psychosis ranging from 15% to 29% for UHR5 6 and from 14% to 50%7 for BS criteria, and sufficient prognostic accuracy of their assessment, in particular in ruling out psychosis risk.8 However, these figures are not stable but were shown to vary not only with the follow-up time but also with characteristics of the group in which CHR state is assessed, for example, with age composition9 or main referral source.8 Thus, when using these CHR criteria or instruments for clinical purposes, the predicted outcome is not a certainty but only a probability; and, consequently, any therapeutic action following the assessment is based on probabilistic prognostic reasoning. We present here a comprehensive guide summarising the basic concepts of probabilistic prognostic reasoning for psychosis prediction, illustrated by practical examples from the real world scenario of high-risk services. We hope this manuscript will be of practical utility for clinicians and clinical researchers interested in the early detection of psychosis.
Probabilistic prognostic reasoning
Risk or cumulative incidence of psychosis in CHR samples
As in any preventive approach, the main aim of an indicated prevention is a reduction in the overall morbidity or cumulative incidence of the disease.10 In case of the early detection of psychosis, the main outcome is therefore defined by the transition risk to frank psychosis from a CHR state.11 Thereby, cumulative incidence is usually defined as the probability that a particular event, such as occurrence of a particular disease, has occurred within a given period.12 Synonyms of cumulative incidence include incidence proportion and risk or probability of developing psychosis. It is usually calculated by the following proportion, assuming that all patients with CHR have been followed-up:
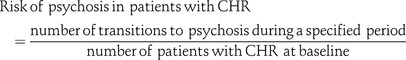 |
Such probabilities are commonly defined as the likelihood of an event with values ranging from 0 or 0% (no expected occurrence of the event in any case) to 1 or 100% (certain of the occurrence of the event in all cases). However, as the risk of psychosis onset in patients with CHR is the probability that psychosis will occur within a defined period of time and, consequently, heavily depends on the observation time, risk of psychosis in patients with CHR always has to be referred to in terms of a specified follow-up period.
Example A: No consideration of potential dropouts
One hundred patients with CHR were followed-up, first for 1 year and then for another 2, that is, altogether 3 years. At the end of 1 year, 15 patients had developed psychosis.
→ 1-year risk of psychosis=15/100=0.15
At the end of 3 years, 14 further patients had developed psychosis, cumulating to altogether 29 cases with a transition to psychosis within 3 years.
→ 3-year risk of psychosis=(15+14)/100=0.29
Person-time or incidence rate of psychosis in CHR
Other than risk or cumulative incidence of psychosis that assumes that the outcome of all patients with CHR at the end of the follow-up period is known, the incidence rate or person-time rate is a measure that incorporates the true observation time directly into the denominator. Thus, it can account for the unfortunately likely persons who dropout during longer observation periods. As for the proportion used to compute the cumulative incidence, the numerator of the person-time rate is the number of transitions to psychosis during the follow-up time. However, the denominator is not the baseline number of patients with CHR but the total of the observation time (commonly given in years) of each patients with CHR (see example B below).
Example B. Consideration of potential dropouts
Again, 100 patients with CHR were followed up annually for 3 years. After 1 year, 15 had developed psychosis but 10 were lost to follow-up. After 2 years, 5 had developed psychosis and 5 were additionally lost to follow-up. After 3 years, another 9 had developed psychosis and 10 were lost to follow-up. To calculate the person-time rate of psychosis, we will assume that patients with CHR with psychosis onset and those lost to follow-up were disease-free for 6 months and thus contribute 0.5 years to the denominator.
→ Person-time rate of psychosis=(15+5+9)/(75+0.5×15+0.5×10)+(65+0.5×5+0.5×5)+(55+0.5×9+0.5×10)=29/222=0.13 per persons-years of follow-up
Thus, the 3-year person time or incidence rate of psychosis with consideration of individual observation times (=3×0.13=0.39) is considerably higher than the 3-year cumulative incidence of Example A (=0.29). This leads to the question, which measure (person-time rate vs cumulative incidence) should followed in clinical practice. Since the cumulative incidence ignores patients lost to follow-up, and conservatively assumes that they remained disease-free over the years, it might actually underestimate the true probability of psychosis transition in CHR samples. Indeed, there is evidence that about 23% of patients with CHR who disengage from CHR services (drop-outs) will later develop psychosis.13 Thus, in practice, the incidence rate relating to person-years should be preferred over the more conservative cumulative incidence or risk.
Kaplan-Meier estimates of psychosis risk in patients with CHR
An even more accurate time-to-event estimate of risk of psychosis, which also deals with incomplete observations is provided by Kaplan-Maier (survival) curves.14 A Kaplan-Maier curve is defined as the probability of surviving in a given length of time, thereby considering time in many small intervals.15 A previous meta-analysis provided a summary Kaplan-Maier estimate of psychosis risk in CHR samples (mainly by UHR criteria), and indicated that most transitions occurred within the first 2 years.5 Owing to this, it may be clinically relevant to know the exact risk of psychosis onset in patients with CHR, given psychosis will occur during this timeframe (this will apply to most transitions although later transitions are also possible, in particular in CHR samples defined by BS criteria).7
Time to transition, given transition will occur in the first 2 years, is depicted in figure 1. Such a figure—or rather such a set of figures, considering the impact of type of risk criteria, age, referral source and possibly other patient characteristics—might be of clinical interest because they might be practically used by CHR clinicians to optimise the timing of their prognostic assessments and treatments accordingly (eg, more frequent CHR reassessments in the first 2 years to not miss the chance to adapt treatment to possible symptom exacerbations16).
Figure 1.

Cumulative chance of transition given transition occurs by 2 years. As many studies assessed transition at 2 years of follow-up,5 we plotted cumulative estimate of transition, given transition occurs by 2 years after presentation. The regression line (solid line) closely fitted the data points (R2=0.995; y=133 (1-e−0.06x)) and indicates that, among ultra-high risk individuals progressing to psychosis in the first 2 years, 25% will develop the disorder by 106 days and 50% by 240 days.
Measures of prognostic accuracy in CHR samples
Next to these risk estimates relating predominately to CHR populations, risk estimates that rather relate to CHR assessments, that is, a test's accuracy measures, are often used in diagnostic decision-making.17 These include a range of measures derived from a 2×2 contingency table, cross-classifying the binary result of a CHR assessment and the binary result of the follow-up gold standard assessment of psychosis (table 1), that will be discussed in the following.
Table 1.
Measures of prognostic accuracy that can be calculated from a 2×2 table showing the cross-classification of a CHR assessment and subsequent gold standard assessment of psychosis
| Population seeking help at CHR services | |||
|---|---|---|---|
| Psychotic disorder as defined with the gold standard ICD/DSM | |||
| Developing psychosis | Not developing psychosis | ||
| CHR assessment outcome | At Risk (CHR+) | CHR+ T (true positive) | CHR+ NT (false positive, type I error) |
| Not At Risk (CHR−) | CHR− T (false negative, type II error) | CHR− NT (true negative) | |
| Pretest probability (x-axis in figure 2) | The probability of developing psychosis before the CHR assessment, also called the prevalence of the disease: (true positive+false negative)/(true positive+false postive+false negative+true negative) | ||
| Sensitivity | Proportion of patients who will develop the psychosis who will have a positive CHR assessment result: true positive/(true positive+false negative} | ||
| Specificity | The proportion of patients without the development of psychosis who will have a negative CHR assessment result: true negative/(true negative+false positive) | ||
| Positive Predictive Value (PPV) | The proportion of patients with a positive CHR assessment result who actually have developed psychosis: true positive/(true positive+false positive) | ||
| Negative predictive value (NPV) | The proportion of patients with a negative CHR assessment result who do not have actually developed psychosis: true negative/(true negative+false negative) | ||
| Accuracy | The proportion of true results among the total number of CHR patients assessed: (true positive+true negative)/(true positive+false positive+true negative+false negative) | ||
| Positive likelihood ratio LR+ (legend to figure 2) |
The probability of a CHR patient who develop psychosis testing positive at the CHR assessment divided by the probability of a person who does not develop the psychosis testing positive at the CHR assessment: sensitivity/(1-specificity) | ||
| Negative likelihood ratio LR− (legend to figure 2) | The probability of a patient who develop psychosis testing negative at the CHR assessment divided by the probability of a patient who does not develop psychosis testing negative at the CHR assessment: (1-sensitivity)/specificity | ||
| Post-test positive probability (red line in figure 2) | The individual probability of developing the disease given a positive prognostic test result: Pretest probability×Sensitivity/((Pretest probability×Sensitivity)+(1−Pretest probability)×(1−Specificity)) | ||
| Post-test negative probability (green line in figure 2) | The individual probability of developing the disease given a negative prognostic test result: (1−Pretest probability)×Specificity/((1−Pretest probability)×Specificity)+Pretest probability×(1−Sensitivity)) | ||
APS, attenuated psychosis symptoms; BIPS, brief intermittent psychotic symptoms; BLIPS, brief limited intermittent psychotic symptoms; BS, basic symptoms. Adapted from;8 CHR, clinical high risk (UHR and/or BS); DSM, Diagnostic and Statistical Manual; GRFD, genetic risk and deterioration syndrome; ICD, International Classification of Diseases; UHR, ultra high risk (including BLIPS/BIPS and/or APS and/or GRFD).
Sensitivity and specificity of CHR assessment
In simple terms, the sensitivity of the CHR assessment is defined as the proportion of patients developing psychosis who have a positive CHR assessment result (CHR+). The specificity of a test is the proportion of patients not developing psychosis who have a negative CHR assessment result (CHR−).
Example C: Sensitivity and specificity of a CHR assessment
A total of 150 patients seeking help at a CHR service undergo CHR assessment. One hundred of them are deemed at CHR+ and of these 29 will develop psychosis at 3 years (CHR+T). Among the 50 not considered at risk, that is, CHR−, 2 will develop psychosis at 3 years (CHR−T) and 48 will not (CHR−NT). Thus, sensitivity and specificity of the CHR assessment at 3-year follow-up are:
→ Sensitivity=(CHR+T)×100/(CHR+T+CHR−T)=29×100/(29+2)=93.5%
→ Specificity=(CHR−NT)×100/(CHR−NT+CHR+NT)=48×100/(48+71)=40.3%
A perfect assessment would have 100% sensitivity and 100% specificity, yet in the likely absence of such perfect values, no clear guidelines to weigh sensitivity against specificity exist but only rules-of-thumb.18 For example, Sackett19 suggested to use the test with the highest sensitivity for ‘ruling out’ and that with the highest specificity for ‘ruling in’ the disease, irrespective of the number of false-positive or false-negative classifications. In contrast, balancing severity of the disorder against risk associated with treatment, McNeil et al20 suggested to use highly sensitive tests, even if of little specificity, when the disorder is severe but its treatment benign and safe; and highly specific tests, even if of little sensitivity, when treatments carry the risk of severe side-effects and long-term consequences.
Furthermore, clinical utility of sensitivity and specificity is limited by the fact that they cannot be directly used to estimate the individual probability of developing psychosis in a patient undergoing CHR assessment. Indeed, high sensitivity and specificity do not ensure that the test will be clinically useful, nor do low sensitivity and specificity render a test useless.21 Sensitivity and specificity may also be instable and affected by factors such as sampling bias, small samples, bias in test scores or errors in selection and use of tests.21
The sensitivity and specificity of CHR assessments have recently been estimated at meta-analytical level. The prognostic sensitivity for psychosis prediction at 38 months was 96% (95%–CI 92% to 98%), while the prognostic specificity for psychosis prediction at 38 months was 47% (95%–CI 38% to 57%).22 These values indicate that CHR assessments have an outstanding ability to rule out psychosis risk and an only modest ability to rule in subsequent psychosis.22
Sensitivity and specificity in ROC curves
Sensitivity and specificity at different data points (eg, sum scores) of continuous data can be plotted in the ROC curves. ROC curves plot (1−specificity) of a test on the x-axis against its sensitivity on the y-axis. The area under this curve (AUC) represents the overall accuracy of a test, with values of 0.9–1.0 (equal to 90–100%) considered outstanding, of 0.8–0.9 excellent and of 0.7–0.8 acceptable.23 The off-diagonal on the graph represents an AUC of 0.5, indicating only random discrimination, that is, a test whose results are no better than tossing a coin. ROC curve for CHR assessment was reported as very good (AUC=0.90; 95% CI 0.87 to 0.93).22
Positive and negative predictive values
Accuracy measures that—other than sensitivity and specificity—are not considered independent of the risk of psychosis in the population to that a particular patient with CHR belongs are the positive and negative predictive values (PPV, NPV).24 The PPV is the proportion of CHR+ patients who actually have developed psychosis (T), whereas NPV is the proportion of CHR− patients who have not developed psychosis (NT).25 The PPV of CHR assessment at different time points has been reported in an earlier meta-analysis, indicating a risk of psychosis onset among CHR+ patients between 18% (95%–CI 12% to 25%) at 6 months, and 36% (95%–CI 24% to 35%) at more than 36 months.5 Coming back to Example C, a CHR test with 93.5% sensitivity and 40.3% specificity at 3 years, the corresponding risk of psychosis, PPV and NPV are:
Risk of psychosis the population assessed=(29+2)×100/150=20.7%
PPV=CHR+T×100/(CHR+T+CHR+NT)=29×100/(29+71)=29.0%
NPV=CHR−NT×100/(CHR−NT+CHR−T)=48×100/(48+2)=96.0%
Example D: Influence of the population's risk of psychosis on PPV and NPV
Let's now assume we assess CHR in a different population of 973 patients, 591 of whom will test CHR+ and 382 CHR−. Among the CHR+, 29 will develop psychosis (CHR+T) and 562 not (CHR+NT); among those CHR−, 2 would develop psychosis (CHR−T) and 380 not (CHR−NT). Sensitivity and specificity would remain the same, sensitivity 93.5% and specificity 40.3%. However, the prevalence of psychosis risk in the population assessed would be lower, impacting in particular on the PPV:
→ Risk of psychosis in the population=(29+2)×100/973=3.2%
→ PPV=2900/(29+562)=4.9%
→ NPV=38000/(380+2)=99.5%
Although PPV and NPV may be used to estimate the individual probabilities of developing psychosis in CHR patients,26 their clinical usefulness is restricted to populations whose prevalence of disease is similar to the one from which they were estimated.26 Recent meta-analyses indicated that the prevalence of psychosis in patients undergoing CHR assessment is of 15%, with high heterogeneity (95% CI 9% to 24%) across individual sites.8
Bayes’ theorem and predictive ability of CHR assessment
Ultimately, the value of a test will depend on its ability to alter a pretest probability of a target condition into a post-test probability that will influence a clinical management decision.25 Pretest and post-test probability of psychosis in CHR patients index an individual's likelihood of the development of psychosis before and after the CHR assessment, respectively. To be clinically useful, the results of the CHR assessment should substantially change the pretest probability of the individual patient to develop the disease, that is, significantly increase or decrease his/her post-test probability.8 These concepts are linked to Bayes’ theorem that describes the probability (P) of an event (eg, transition to psychosis, T), based on conditions that might be related to the event (eg, being CHR+). In case of early detection, Bayes’ theorem can be stated mathematically as:
or in words: The conditional probability of development of psychosis given a positive CHR assessment, P(T|CHR+), is the product of the conditional probability of CHR+ given that psychosis develops, P(CHR+|psychosis), and the probability of psychosis, P(T), divided by the probability of a positive CHR assessment, P(CHR+).
However, P(CHR+) and P(T) and, consequently, their related conditional probabilities are no fixed numbers but depend on sampling biases. For example, P(CHR+) and P(T) as well as P(T|CHR+) were higher in CHR samples recruited from mental health professionals than in those recruited from the community.12 The same was true for predominately or exclusively adult samples compared to child and adolescent samples.7 Thus, it is not only CHR criteria that determine the post-test probability of transition to psychosis but also the recruitment and selection of samples, which might create substantial enrichment in risk.8 These concepts are illustrated in the probability modifying plot (figure 2) which plots pretest probability of developing psychosis before the CHR assessment on the x-axis against the post-test probability of developing psychosis after CHR assessment on the y-axis. The post-test probability in turns can be positive P(T|CHR+) or negative P(T|CHR−). The positive and negative posterior probability curves visually show that CHR assessment has an excellent ability to rule out psychosis, and a modest ability to rule in.
Figure 2.

Meta-analytical probability modifying plot, illustrating the relationship between pretest probability of psychosis onset 38 months and post-test probability of psychosis risk at 38 months based on clinical high risk (CHR) psychometric assessment in patients seeking help at high-risk services, computed as the likelihood of a positive (above diagonal line in red; LR+) or negative (below diagonal line in green, LR−) CHR assessment result over the 0–1 range of pretest probability, adapted from.22 The vertical black line indicates the average pretest probability of psychosis onset in patients referred to high-risk services (15% at 38 months8) which yields a 26% post-test probability of psychosis onset in CHR+ cases and a 1.56% post-test probability of psychosis onset at 38 months in CHR− cases.22 LR, likelihood ratio.
Likelihood ratios
Several authors have suggested the use of positive and negative likelihood ratios (LR+, LR−) instead of sensitivity and specificity24 to better account for differences in the quality between the two and for pretest probabilities. LRs combine the estimates of sensitivity and specificity and offer the advantage of existing guidelines for their quality assessment.27 Thereby, LR+ (=Sensitivity/(1—Specificity)) (table 1) gives the factor by that the pretest probability increases given a positive test result, while LR− (=(1—Sensitivity)/Specificity) gives the fraction to that the post-test probability decreases given a negative test result.
As a rough guide, LR+ >10 and LR−<0.1 generate large and often diagnostically conclusive changes from pretest to post-test probability; LR+ of 5–10 and LR− of 0.1–0.2 produce moderate shifts in probability; LR+ of 2–5 and LR− of 0.2–0.5 result in small (but sometimes important) changes in probability, while LR+ <2 and LR− >0.5 change probability to a very small (and rarely important) degree.24 A graphical presentation of LRs with the probability modifying plot (figure 2) can improve the accuracy of estimated post-test disease probability in clinical practice.17
In a previous meta-analysis, we have shown that current CHR assessment has an excellent ability to rule out psychosis (LR−=0.09), at an expense of their ability to rule in psychosis (LR+=1.82)22 and these LRs are reported in figure 2. In fact, given a pretest probability of 15% in patients referred to high-risk services,8 the post-test probability of psychosis onset at 38 months, given a CHR+ assessment is of 26% (95% CI 23% to 30%)22 and given a CHR− assessment is of 1.56% (95% CI 0.7% to 2.42%).22
Assessing psychosis risk in clinical practice: the potentials and pitfalls of real-life application
While LRs thereby offer a good tool for the probabilistic assessment of individual risk, they were shown to be the least well understood accuracy measures by clinicians.17 28 Yet, probabilistic reasoning makes considerable demands on the clinician even beyond understanding of LRs, for example, estimating an individual's pretest risk of psychosis onset based on available, often heterogeneous and fragmented information on population estimates, as roughly illustrated by table 2. However, probabilistic reasoning in CHR has already been very useful in advising clinicians on the use of CHR assessment. As shown in table 2, probabilistic reasoning shows that CHR assessment should be restricted to populations seeking help at high-risk services (case 3) only, to avoid small and negligible PPVs and NPVs (cases 1 and 2). Unfortunately, the pretest probability of psychosis onset in different subsamples (eg, migrants, substance users) of patients seeking help at high-risk services is still not unknown. Thus, future research should overcome the limited pretest probability data29 by providing CHR clinicians with reliable and simple, yet not over-simplistic information on pretest probabilities in different samples seeking help at high-risk services and LRs that is presented in a well-applicable, for example, graphic form and with good guidelines for their use.
Table 2.
Description of three hypothetical cases, from real-world scenarios, illustrating the impact of different pretest probabilities of psychosis onset related to potential sampling bias on estimated post-test probabilities of psychosis onset after CHR assessment, computed using the LRs indicated in figure 222
| Case 1 | Case 2 | Case 3 | |
|---|---|---|---|
| Population | General population | Genetic high-risk population | Mental health service users |
| Setting | School | Relative's self-support group | CHR service |
| Gender | Male | Female | Male |
| Age | 21 years | 19 years | 20 years |
| Ethnicity | Black Caribbean | White | White |
| Family history of psychosis | No | Mother diagnosed with schizophrenia | No |
| Estimated 3-year risk of psychosis of population ≈ 3-year pretest probability | 0.27% (assuming an annual incidence of schizophrenia in the general population of Black Caribbean migrants of 0.091%30) | 4% (assuming a 3-year risk of psychosis in offspring of mothers with schizophrenia as estimated from the Kaplan-Meier, figure 2 from31) | 15% (assuming a 3-year risk for psychosis of 15% in help-seeking samples referred to CHR services8) |
| Assessment | Interview (CHR assessment) | Interview (CHR assessment) | Interview (CHR assessment) |
| 3-year post-test probability in case of positive result (LR+ 1.82)22 | 0.49% | 7.05% | 26.00% |
| 3-year post-test probability in case of negative result (LR− 0.09)22 | 0.02% | 0.38% | 1.56% |
CHR, clinical high risk; LR, likelihood ratio.
Conclusions
The current reviews illustrated the basic concepts that are necessary for probabilistic reasoning in the CHR state. Understanding basic measures used for prognostic probabilistic reasoning is a prerequisite for successfully improving the prediction of psychosis in clinical practice.8 Future refinement of these measures for CHR patients may actually influence risk management, especially as regards initiating or withholding treatment.17
Footnotes
Competing interests: None declared.
Provenance and peer review: Not commissioned; internally peer reviewed.
References
- 1.Kirkbride JB, Errazuriz A, Croudace TJ, et al. Incidence of schizophrenia and other psychoses in England, 1950–2009: a systematic review and meta-analyses. PLoS ONE 2012;7:e31660. 10.1371/journal.pone.0031660 [DOI] [PMC free article] [PubMed] [Google Scholar]
- 2.Penttila M, Jaaskelainen E, Hirvonen N, et al. Duration of untreated psychosis as predictor of long-term outcome in schizophrenia: systematic review and meta-analysis. Br J Psychiatry 2014;205:88–94. 10.1192/bjp.bp.113.127753 [DOI] [PubMed] [Google Scholar]
- 3.Valmaggia LR, Byrne M, Day F, et al. Duration of untreated psychosis and need for admission in patients who engage with mental health services in the prodromal phase. Br J Psychiatry 2015;207:130–4. 10.1192/bjp.bp.114.150623 [DOI] [PMC free article] [PubMed] [Google Scholar]
- 4.Fusar-Poli P, Borgwardt S, Bechdolf A, et al. The psychosis high-risk state: a comprehensive state-of-the-art review. JAMA Psychiatry 2013;70:107–20. 10.1001/jamapsychiatry.2013.269 [DOI] [PMC free article] [PubMed] [Google Scholar]
- 5.Fusar-Poli P, Bonoldi I, Yung AR, et al. Predicting psychosis: meta-analysis of transition outcomes in individuals at high clinical risk. Arch Gen Psychiatry 2012;69:220–9. 10.1001/archgenpsychiatry.2011.1472 [DOI] [PubMed] [Google Scholar]
- 6.Kempton M, Bonoldi I, Valmaggia L, et al. Speed of psychosis progression in people at ultra high clinical risk: a complementary meta-analysis. JAMA Psychiatry 2015;72:622–3. 10.1001/jamapsychiatry.2015.0094 [DOI] [PubMed] [Google Scholar]
- 7.Schultze-Lutter F, Michel C, Schmidt SJ, et al. EPA guidance on the early detection of clinical high risk states of psychoses. Eur Psychiatry 2015;30: 405–16. 10.1016/j.eurpsy.2015.01.010 [DOI] [PubMed] [Google Scholar]
- 8.Fusar-Poli P, Schultze-Lutter F, Cappucciati M, et al. The dark side of the moon: meta-analytical impact of recruitment strategies on risk enrichment in the clinical high-risk state for psychosis. Schizophr Bull 2015. 20 Nov 2015. pii: sbv162. [Epub ahead of print]. [DOI] [PMC free article] [PubMed] [Google Scholar]
- 9.Schimmelmann B, Michel C, Martz-Irngartinger A, et al. Age matters in the prevalence and clinical significance of ultra-high-risk for psychosis symptoms and criteria in the general population: findings from the BEAR and BEARS-Kid studies. World Psychiatry 2015;14:189–97. 10.1002/wps.20216 [DOI] [PMC free article] [PubMed] [Google Scholar]
- 10.WHO. Prevention of mental disorders. Effective interventions and policy options. Geneva: Department of Mental Health and Substance Abuse, 2004. [Google Scholar]
- 11.Fusar-Poli P, Van Os J. Lost in transition: setting psychosis threshold in prodromal research. Acta Psychiatr Scand 2013;127:248–52. 10.1111/acps.12028 [DOI] [PubMed] [Google Scholar]
- 12.Dodge Y. The Oxford dictionary of statistical terms. 6th edn (1 Aug 2006). Oxford: OUP, 2003. [Google Scholar]
- 13.Green CE, McGuire PK, Ashworth M, et al. Outreach and Support in South London (OASIS). Outcomes of non-attenders to a service for people at high risk of psychosis: the case for a more assertive approach to assessment. Psychol Med 2011;41:243–50. 10.1017/S0033291710000723 [DOI] [PubMed] [Google Scholar]
- 14.Kaplan E, Meier P. Nonparametric estimation from incomplete observations. J Amer Statist Assn 1958;53:457–81. 10.1080/01621459.1958.10501452 [DOI] [Google Scholar]
- 15.Goel MK, Khanna P, Kishore J. Understanding survival analysis: Kaplan-Meier estimate. Int J Ayurveda Res 2010;1:274–8. 10.4103/0974-7788.76794 [DOI] [PMC free article] [PubMed] [Google Scholar]
- 16.Schmidt SJ, Schultze-Lutter F, Schimmelmann BG, et al. EPA guidance on the early intervention in clinical high risk states of psychoses. Eur Psychiatry 2015;30:388–404. 10.1016/j.eurpsy.2015.01.013 [DOI] [PubMed] [Google Scholar]
- 17.Whiting PF, Davenport C, Jameson C, et al. How well do health professionals interpret diagnostic information? A systematic review. BMJ Open 2015;5:e008155. 10.1136/bmjopen-2015-008155 [DOI] [PMC free article] [PubMed] [Google Scholar]
- 18.Boyko EJ. Ruling out or ruling in disease with the most sensitive or specific diagnostic test: short cut or wrong turn? Med Decis Making 1994;14:175–9. 10.1177/0272989X9401400210 [DOI] [PubMed] [Google Scholar]
- 19.Sackett DL. Clinical reality, binary models, babies and bath water. J Clin Epidemiol 1991;44:217–19. 10.1016/0895-4356(91)90271-A [DOI] [PubMed] [Google Scholar]
- 20.McNeil BJ, Keller E, Adelstein SJ. Primer on certain elements of medical decision making. N Engl J Med 1975;293:211–15. 10.1056/NEJM197507312930501 [DOI] [PubMed] [Google Scholar]
- 21.Meehl PE, Rosen A. Antecedent probability and the efficiency of psychometric signs, patterns, or cutting scores. Psychol Bull 1955;52:194–216. 10.1037/h0048070 [DOI] [PubMed] [Google Scholar]
- 22.Fusar-Poli P, Cappucciati M, Rutigliano G, et al. At risk or not at risk? Meta-analysis of the prognostic accuracy of psychometric interviews for psychosis prediction. World Psychiatry 2015;14:322–32. 10.1002/wps.20250 [DOI] [PMC free article] [PubMed] [Google Scholar]
- 23.Hosmer W, Lemeshow S. Applied survival analysis: regression modeling of time to event data. New York, NY: Wiley & Sons, 1999. [Google Scholar]
- 24.Altman DG. Some common problems in medical research. In: Altman DG, ed. Practical statistics for medical research. New York, NY: Chapman and Hall, 1991:396–438. [Google Scholar]
- 25.Florkowski CM. Sensitivity, specificity, receiver-operating characteristic (ROC) curves and likelihood ratios: communicating the performance of diagnostic tests. Clin Biochem Rev 2008;29(Suppl 1):S83–87. [PMC free article] [PubMed] [Google Scholar]
- 26.Akobeng AK. Understanding diagnostic tests 1: sensitivity, specificity and predictive values. Acta Paediatr 2007;96:338–41. 10.1111/j.1651-2227.2006.00180.x [DOI] [PubMed] [Google Scholar]
- 27.Jaeschke R, Guyatt G, Sackett DL. Users’ guides to the medical literature. III. How to use an article about a diagnostic test. A. Are the results of the study valid? Evidence-Based Medicine Working Group. JAMA 1994;271:389–91. 10.1001/jama.1994.03510290071040 [DOI] [PubMed] [Google Scholar]
- 28.Srinivasan P, Westover MB, Bianchi MT. Propagation of uncertainty in Bayesian diagnostic test interpretation. South Med J 2012;105:452–9. 10.1097/SMJ.0b013e3182621a2c [DOI] [PMC free article] [PubMed] [Google Scholar]
- 29.Hall S, Phang SH, Schaefer JP, et al. Estimation of post-test probabilities by residents: Bayesian reasoning versus heuristics? Adv Health Sci Educ Theory Pract 2014;19:393–402. 10.1007/s10459-013-9485-1 [DOI] [PubMed] [Google Scholar]
- 30.Coid JW, Kirkbride JB, Barker D, et al. Raised incidence rates of all psychoses among migrant groups: findings from the East London first episode psychosis study. Arch Gen Psychiatry 2008;65:1250–8. 10.1001/archpsyc.65.11.1250 [DOI] [PubMed] [Google Scholar]
- 31.Niemi LT, Suvisaari JM, Haukka JK, et al. Cumulative incidence of mental disorders among offspring of mothers with psychotic disorder. Results from the Helsinki High-Risk Study. Br J Psychiatry 2004;185:11–17. 10.1192/bjp.185.1.11 [DOI] [PubMed] [Google Scholar]