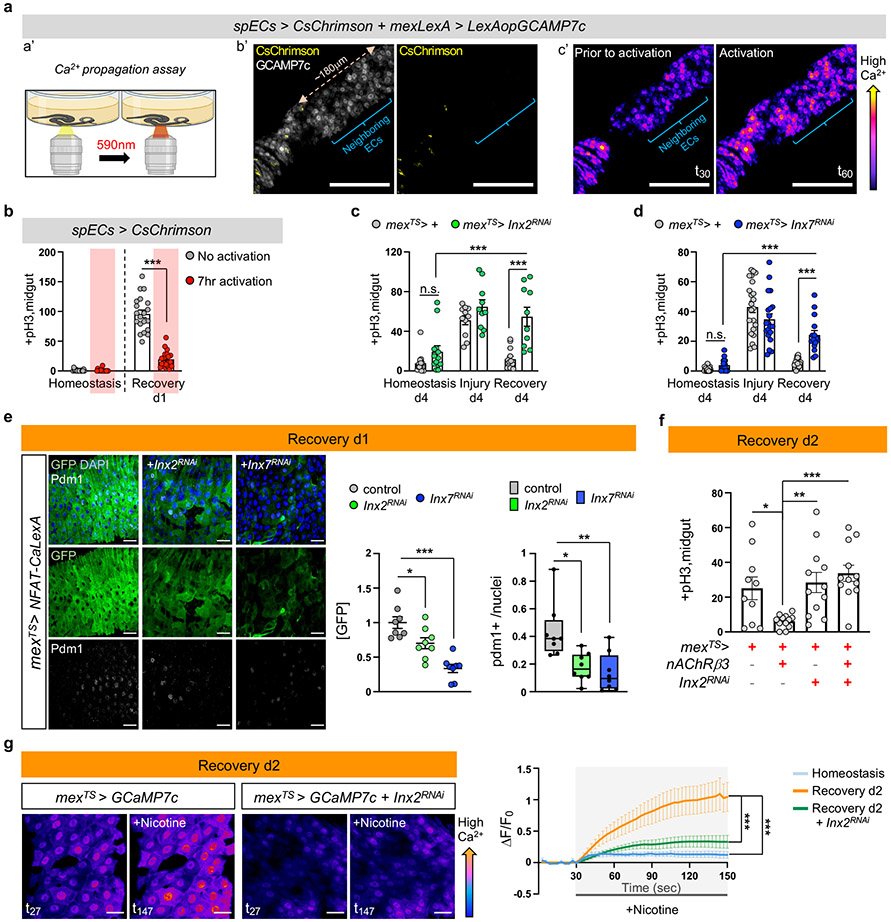
Fig.5 ∣. Ca2+ spreads via Inx2/Inx7 gap junctions.
a, a’: Experimental Illustration. b’: Posterior midgut with CsChrimson in few ECs (spECs, spEC>CsChrimson, yellow) while all ECs express GCAMP7c (mexLexA>LexAopGCAMP7c, grey). Neighboring ECs: no CsChrimson expression. c’: Color-coded sequential frames prior (t30) and during (t60) CsChrimson-activation (Video S8). Images are representative of 3 independent experiments with similar results. Quantifications: Ext. Data Fig.8b. scale bar: 100μm. b, pH3+ counts of spEC>CsChrimson during 7hr opto-activation. No activation: n=17(Hom.), 20(Rec.) ; Activation: n=16(Hom.), n=21(Rec.) guts from 3 independent experiments (two-tailed Mann-Whitney). Conditions: see Methods. c-d, pH3+ counts when reducing Inx2 (mexTS>Inx2RNAi) and Inx7 (mexTS>Inx7RNAi) in ECs. Conditions: Fig. 1e. control: n=13(Hom./c), n=23(Hom./d), n=11(Injury/c), n=22(Injury/d), n=13(Rec./c), n=16(Rec./d); Inx2RNAi: n=13(Hom.), n=10(Injury), n=10(Rec); Inx7RNAi: n=17(Hom.), n=20(Injury), n=15(Rec.) guts from 2 independent experiments (two-way Anova). e, Posterior midgut expressing NFAT-CaLexA in ECs while reducing Inx2 or Inx7 (mexTS>NFAT-CaLexA+Inx2RNAi, mexTS>NFAT-CaLexA+Inx7RNAi). anti-GFP: Ca2+(green), anti-pdm1: ECs(grey). DAPI: nuclei. Scalebar 20μm. Conditions: 4days DSS-food (23°C), 24hrs standard food (29°C). Chart: GFP fold change, Boxplot: pdm1+ ratio (median, quartiles, whiskers: minimum maximum values). n=8 guts per genotype from 2 independent experiments. Tukey’s one-way Anova (p=0.0272; control vs Inx2RNAi; GFP). Dunn’s Kruskal-Wallis test (p=0.024 control vs Inx2RNAi;pdm1+), f, pH3+ counts when overexpressing nAcRβ3 (mexTS>nAcRβ3), reducing Inx2 in ECs (mexTS>Inx2RNAi) and combined (mexTS>nAcRβ3+Inx2RNAi). Conditions: 4days DSS-food (23°C), 48hrs standard food (29°C). n=10(mexTS>+), n=12(mexTS>nAcRβ3, mexTS>Inx2RNAi, mexTS>nAcRβ3+Inx2RNAi) guts from 2 independent experiments. Tukey’s one-way Anova (p=0.0476 control vs nAcRβ3, p=0.0096 nAcRβ3 vs Inx2RNAi). g, Color-coded sequential frames while reducing Inx2 in ECs (mexTS >GCaMP7c+Inx2RNAi) before (t27) and after (t147) nicotine (Videos S9-S10). Graph: average fluorescence intensity (ΔF/F0) per frame (~3sec/fr) and genotype. Individual ΔF/F0: Ext. Data Fig.8k. n= 6(Hom.), n=9(Rec.),n=8(Inx2RNAi) guts from 2 independent experiments (Tukey’s two-way Anova). scale bar: 20μm. Conditions: Fig. 2f. n.s.:non-significant, *: 0.05>p>0.01, **: 0.01<p<0.001, ***: p<0.001. Mean ± SEM. Illustrations with Biorender.com

