

Abstract
Objective:
The capillary zone electrophoresis (CZE) and high-performance liquid chromatography (HPLC) methods were compared in terms of HbA2 measurement for the assessment of hemoglobinopathies.
Materials and Methods:
CZE was compared with HPLC for the evaluation of patients without hemoglobinopathy (n=321), with β-thalassemia trait (n=113), and with common (HbD-Punjab, E, C, S/A, and S/S) and rare (HbS/D, O-Arap, Lepore, G-Coushata, Setif, Hamadan, Q-Iran, and H) variants (n=21). The reference range for HbA2 was determined by CZE.
Results:
Among patients without hemoglobinopathy, the median (2.5th-97.5th percentiles) values were 97.4% (97.0-98.0%) and 97.5% (96.6-98.4%) for HbA (p=0.060) and 2.4% (1.6-3.0%) and 2.5% (1.6-3.1%) for HbA2 (p<0.001) by HPLC and CZE, respectively. The reference range for HbA2 was 1.6-3.1% by CZE. In the comparison of methods for HbA2, there was a constant error of 0.255 (confidence interval: 0.062-0.448) and bias of 0.10% (limit of agreement: 0.33-0.53), and higher values were obtained with CZE. A strong correlation was observed between the methods (r=0.782). Interrater agreement was almost perfect for clinical diagnosis (ϰ=0.911). The two methods detected and identified the common variants similarly. All rare variants, except HbH by HPLC and HbS/D by CZE, were detected as separate peaks by both methods.
Conclusion:
The two methods were in agreement regarding the preliminary identification of β-thalassemia patients. Different Hb variants were detected by both methods but with possible methodological interference for HbA2 measurements. CZE is a reliable and simple alternative for the evaluation of hemoglobinopathies. The standardization of HbA2 measurements should be prioritized as more techniques become available in routine laboratory practice.
Keywords: Other hemoglobinopathies, Thalassemia, Hemoglobin disorders, Anemia
Abstract
Amaç:
Hemoglobinopatilerin değerlendirilmesinde HbA2 ölçümü açısından kapiller zone elektroforezi (CZE) ve yüksek basınçlı sıvı kromatografisi (HPLC) yöntemleri karşılaştırıldı.
Gereç ve Yöntemler:
Hemoglobinopatisi olmayan (n=321), β-talasemi taşıyıcısı (n=113) ve yaygın (Hb D-Punjab, E, C, S/A, S/S) ve nadir (Hb S/D, O-Arap, Lepore, G-Coushata, Setif, Hamadan, Q-Iran ve H) varyantları (n=21) olan hastalarda CZE ile HPLC karşılaştırıldı. HbA2 için referans aralığı CZE tarafından belirlendi.
Bulgular:
Hemoglobinopatisi olmayan hastalarda HPLC ve CZE ile medyan (2,5-97,5 persentil) değerleri HbA için sırasıyla %97,4 (97,0-98,0) ve %97,5 (96,6-98,4) (p=0,060), HbA2 için %2,4 (1,6-3,0) ve %2,5 (1,6-3,1) bulundu (p<0,001). HbA2 için referans aralığı CZE ile %1,6-3,1 idi. HbA2 için yöntem karşılaştırma çalışmasında sabit hata 0,255 (CI; 0,062-0,448) ve Bias %0,10 (LOA; 0,33-0,53) bulundu ve CZE ile daha yüksek sonuçlar elde edildi. Yöntemler arasında güçlü bir korelasyon elde edildi (r=0,782). Klinik tanı açısından iki yöntem mükemmel uyum gösterdi (ϰ=0.911). Her iki yöntem de ortak varyantları tespit etti ve benzer şekilde tanımladı. HPLC ile HbH ve CZE ile HbS/D dışındaki tüm nadir varyantlar, her iki yöntemle de ayrı pikler olarak saptandı.
Sonuç:
β-talasemi hastalarının ön tanımlamasında her iki yöntem de uyum içindeydi. Her iki yöntemle farklı Hb varyantları saptandı, ancak HbA2 ölçümlerinde olası bir metodolojik etkileşim söz konusuydu. CZE, hemoglobinopatilerin değerlendirilmesi için güvenilir ve basit bir alternatiftir. Rutin laboratuvar pratiğinde fazla sayıda teknik mevcut olduğundan, HbA2 ölçümünün standardizasyonuna öncelik verilmelidir.
Introduction
Genetic mutations in the amino acid sequences of the alpha (α) and beta (β) chains that alter their structures or cause a reduction in the amount synthesized, or both, lead to hemoglobinopathies [1,2]. Many of these mutations are silent and do not cause clinical manifestations [3,4].
Cellulose acetate electrophoresis, isoelectric focusing, high-pressure liquid chromatography (HPLC), and capillary zone electrophoresis (CZE) are possible methods that can be readily applied in laboratories [1,5,6,7]. However, the final identification of hemoglobin (Hb) variants can still only be performed by DNA sequencing of the affected globin gene or amino acid sequencing of the abnormal protein, generally by mass spectrometry (MS) [8,9,10].
HbA2 levels may differ only slightly between carriers and non-carriers of β-thalassemia and the performance of HbA2 analyses must be both precise and accurate [11,12]. The accuracy of HbA2 measurements is particularly important in the critical range between 3.0% and 4.0%, and any imprecision should be low enough that a standard deviation (SD) of 0.05 or coefficient of variation (CV) of 2% can be achieved [12].
For more than 30 years, HPLC has been used in clinical laboratories for the evaluation of hemoglobinopathies, and experiences with the retention times of different variants have been satisfactory [13,14]. However, the HbA molecule is quantified along with several post-translational modifications, including glycated forms such as HbA1c and others [13]. Recently, the CZE method has become one of the most commonly used techniques with adequate precision for the determination of HbA2 and HbF [15,16,17]. In comparison studies, CZE and MS/MS showed acceptable analytical and diagnostic performance and were accepted as accurate and appropriate methods for HPLC [18]. By CZE, accurate measurements of HbA2 can be performed without separating the glycated fraction and other Hb adducts in the presence of HbS [19,20]. However, the presumptive identification of variants is related to their migration zones on electropherograms and these zones are less specific than retention time [19].
In this prospective study, we aimed to compare the SEBIA CAPILLARYS 3 OCTO CZE system with Premier Resolution HPLC, which was the routine method in our laboratory for premarital screening tests. The identifications of 5 common (HbD-Punjab, HbE, HbC, HbS/A, and HbS/S) and 8 rare (HbS/D, HbO-Arap, Hb Lepore, HbG-Coushata, Hb Setif, Hb Hamadan, HbQ-Iran, and HbH) Hb variants were also compared.
Materials and Methods
Study Design and Subjects
A total of 455 whole blood samples obtained from patients who were screened for hemoglobinopathy at the University of Health Sciences Türkiye Kartal Dr. Lütfi Kırdar City Hospital between November 2022 and February 2023 were included in the analysis.
The mean age of the patients was 29.6±14.5 years (range: 1-74 years), with 239 female patients (52.5%) and 216 male patients (47.5%). Pregnant women and children <1 year of age were excluded. There were no patients with high HbA1c values in this group according to the chromatograms from the HPLC system. This study was approved by the ethics committee of the relevant institution (11.01.2023, 2022/514/241/1).
Blood Collection
Blood was collected after overnight fasting between 8:00 and 10:00 into Becton Dickinson 3-mL Vacutainer tubes containing 5.4 mg of K2EDTA (Lot 1023106; Becton, Dickinson and Company, Plymouth, UK).
Methods
Complete Blood Count (CBC) Analyses
CBC analyses were performed using the Sysmex XN 9000 system (Sysmex America, Mundelein, IL, USA). The Mentzer index was calculated by dividing the mean corpuscular value by red blood cell count [21].
High-performance Liquid Chromatography (HPLC)
HPLC analysis was performed with the Premier Resolution system (Premier Resolution, Kansas City, KS, USA) using cation exchange chromatography and spectrophotometric detection. The Hb fractions were identified according to their retention times, taking Hb-containing calibrators as reference for HbF, HbA, HbS, and HbC [13]. Screening was performed using the system’s Quick Scan assay (4 min), which measures HbF, HbA2, and HbA0 and flags abnormal peaks. In the presence of abnormal peaks, analysis was repeated with the high-resolution assay (8 min), with the system indicating abnormal hemoglobins for identification. Selected residual samples were reevaluated within 24 h using the CZE system. The adult reference ranges used in our laboratory were 97.0-99.0% for HbA, <2.0% for HbF, and 1.5%-3.5% for HbA2 as recommended by the manufacturer.
Capillary Zone Electrophoresis (CZE)
CZE was performed using the SEBIA CAPILLARYS 3 OCTA system (SEBIA, Lisses, France). The Hb fractions were separated according to their electrical charges in an alkaline buffer, and the instrument recorded Hb migrations on the x-axis from 0 to 300 [19]. The migration position for each Hb was normalized relative to the standardized positions of HbA (position 150) and HbA2 (position 243). In the presence of HbA and/or HbA2, the electrophoretic profile was divided into 15 migration regions and the possible identification of an abnormal fraction was based on the migration site. In the absence of HbA, the sample was mixed at a ratio of 1:1 with a normal patient sample, and the migration positions were normalized by introducing HbA and HbA2 into the test sample [19].
The manufacturer’s suggested reference ranges were HbA of >96.8%, HbF of <0.5%, and HbA2 of 2.2-3.2%.
Imprecision
For imprecision studies, two levels of commercial control materials for both systems were used (Trinity Biotech Premier Resolution A2+F Control for HPLC, lot number 13420, and SEBIA CAPILLARYS HbA2 Control for CZE, lot number 05111/XX). Within-run CVs were determined by analyzing the two levels of HbA and HbA2 in 10 consecutive runs on the same day. Ten replicates of two control materials were analyzed in eight different capillaries for CZE. Between-run CVs were determined by measuring two commercially available control materials on 10 consecutive days. The mean, standard deviation (SD), and CV values were calculated.
Reference Range
A reference range study was performed for HbA2 using CZE. A total of 321 samples with HbA, HbA2, and HbF values within the reference ranges of the HPLC system were evaluated. The reference ranges were derived with a non-parametric method and reported as the 2.5th and 97.5th percentiles according to the recommendations of the International Federation of Clinical Chemistry (CLSI C28-A3) [22].
Statistical Analysis
Statistical analysis was carried out using MedCalc statistical software (version 12, MedCalc Software, Mariakerke, Belgium). The distribution of the data was assessed with the Shapiro-Wilk test and results were expressed as mean ± SD or median (2.5th-97.5th percentile) according to the distribution. Continuous variables were compared with the Wilcoxon rank sum test. Deming regression analysis, Spearman correlation analysis, and Bland-Altman analysis were used in the comparison of the methods. The agreement of the methods in HbA2 interpretation was expressed with the kappa (ϰ) coefficient. Statistical significance was set at p<0.05.
Results
Imprecision Study
The mean ± SD values for HbA (%) and HbA2 (%) and within-run and between-run CVs are given in Table 1.
Table 1. Precision study for HPLC and CZE methods.

Reference Range for HbA2 for CZE
The reference range showed a modest shift with a normal HbA2 level of 1.6-3.1%.
HbA2 Levels of Patients Without Hemoglobin Variants
A total of 321 patients with HbA, HbA2, and HbF values within the manufacturer-recommended reference ranges according to HPLC were evaluated. This study group was matched in terms of sex (p=0.911). The median (2.5th-97.5th percentile) values for HbA were 97.4% (97.0-98.0%) and 97.5% (96.6-98.4%) for the HPLC and CZE methods, respectively (p=0.060). The median (2.5th-97.5th percentile) values for HbA2 were 2.4% (1.6-3.0%) and 2.5% (1.6-3.1%) for the HPLC and CZE methods, respectively (p<0.001) (Table 2). In method comparison studies for HbA2, higher results were obtained with CZE with a bias of 0.10% for limit of agreement of 0.33-0.53 and a constant error of 0.255 [confidence interval (CI): 0.062-0.448] with a strong correlation of 0.782 (CI: 0.735-0.821) between the methods (Figure 1A).
Table 2. Characteristics of the study population.

Figure 1.
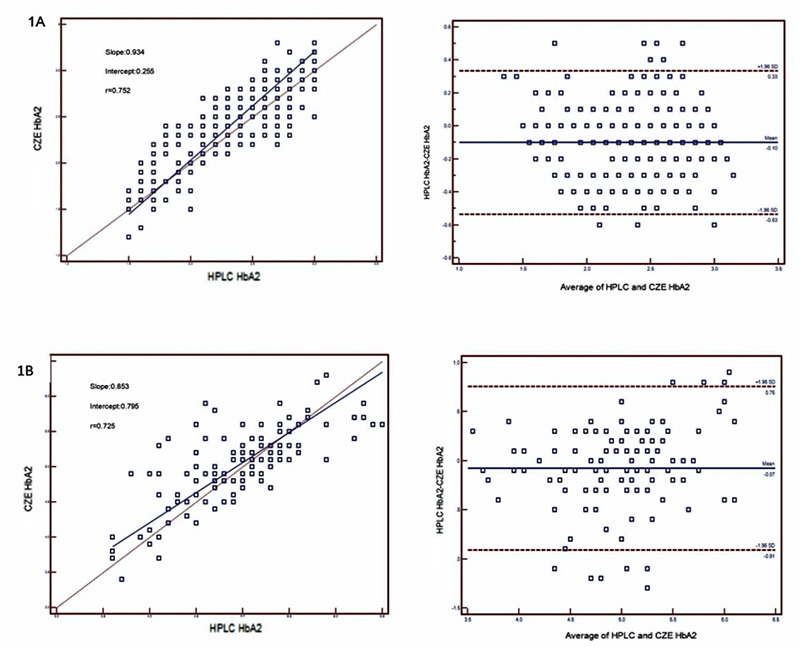
Deming regression and Bland-Altman analyses for HbA2 at 209x297 mm (300x300 DPI).
HbA2 in Patients with β-Thalassemia Trait
A total of 113 patients with HbA2 values that were above the manufacturer’s recommended reference range (>3.5%) according to HPLC were evaluated. The median (2.5th-97.5th percentile) values for HbA2 were 5% (3.6-6.3%) and 5.1% (3.7-5.9%) for the HPLC and CZE methods, respectively (p=0.1831) (Table 2). In method comparison studies for HbA2, higher values were obtained with CZE with a bias of 0.07% (LOA: 0.76-0.91) and a constant error of 0.795 (0.083-1.506) with a strong correlation of 0.725 (CI: 0.623-0.802) between the methods (Figure 1B).
The CBC values of patients without hemoglobin variants and with the β-thalassemia trait are given in Table 3.
Table 3. Complete blood count analyses for healthy individuals and patients with β-thalassemia.

Agreement of Methods in the Interpretation of HbA2 with the ϰ Coefficient
Using the newly determined reference ranges for HbA2 by CZE, the two methods similarly identified 113 patients with β-thalassemia trait. The methods showed almost perfect interrater agreement (ϰ=0.911).
Analysis of Common β-Chain Hb Variants (HbD-Punjab, HbE, HbC, HbS/A, HbS/S)
The HbA2 and Hb variant values of the patients with HbD-Punjab, HbE, HbC, HbS/A, and HbS/S are given in Table 4. These methods similarly detected and identified the common variants.
Table 4. Patients with common and rare hemoglobin variants.

HbA2 in the Presence of HbD-Punjab: For four patients with HbD-Punjab, lower HbA2 values were observed using the HPLC system. The mean HbA2 values in these cases were 2.4% (range: 2.1-3.0%) and 3.0% (range: 2.8-3.2%) for HPLC and CZE, respectively.
HbA2 in the Presence of HbE: For one patient with HbE, the HPLC system could not clearly distinguish HbE and HbA2, while these were adequately separated by CZE. The HbA2 values were 3% and 3.2% with the HPLC and CZE systems, respectively.
HbA2 in the Presence of HbC: For one patient with HbC, the CZE system could not clearly distinguish HbC and HbA2, while these were adequately separated by HPLC. The HbA2 results were 3.3% and 3.7% with the HPLC and CZE systems, respectively.
HbA2 in the Presence of Heterozygous HbS: For five patients with heterozygous HbS, higher HBA2 values were obtained with the HPLC method. The mean HbA2 values were 3.4% and 3.1% with HPLC and CZE, respectively.
HbA2 in the Presence of Homozygous S: For a patient with homozygous S, the HbS and HbF values were higher by CZE (HbF: 9% vs. 3.8% and HbS: 87.3% vs. 78.6 by CZE and HPLC, respectively).
Analysis of Rare Variants
All rare variants except HbS/D by CZE and HbH by HPLC were detected as separate peaks with both methods. For one patient, a 77.2% Hb variant was detected in the D zone, with overlapping migration zones of the HbS and HbD variants by CZE. In this sample, HPLC distinguished 39.6% HbD and 33.3% HbS variants. For two patients with HbO-Arap, HbA2 could not be quantified by CZE because it co-eluted with the variant. Hb Lepore, HbG-Coushata, Hb Setif, Hb Hamadan, and Hb Q-Iran were detected by both methods and all except Hb Lepore were confirmed by DNA analysis because of limitations of the libraries of both systems (Table 4). A comparison of the results of HPLC and CZE for HbH, HbS/D, and HbO-Arap are given in Figure 2. Results of the HPLC, CZE, and DNA analyses for rare α-chain Hb variants Hb Setif and HbQ-Iran are given in Figure 3.
Figure 2.
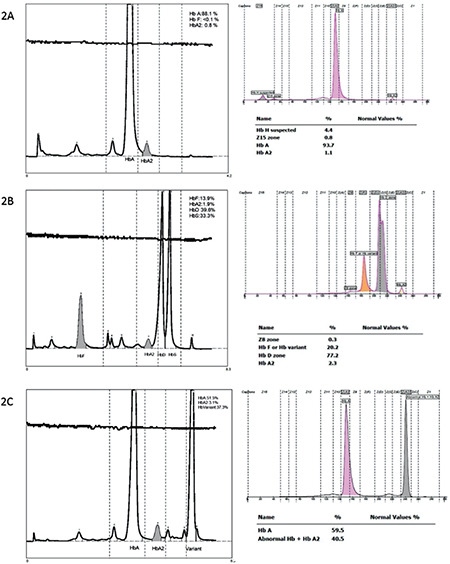
Comparison of HPLC and CZE reports for the rare Hb variants. A) Hb H: Migrated at zone 15 with CZE but was not detected by HPLC. B) Hb S/D: Hb D (39.6%) and HbS (33.3%) were detected with HPLC while 77.2% Hb variant was detected in the D zone with CZE. C) Hb-O-Arap: Migrated at zone A2 with CZE.
Figure 3.
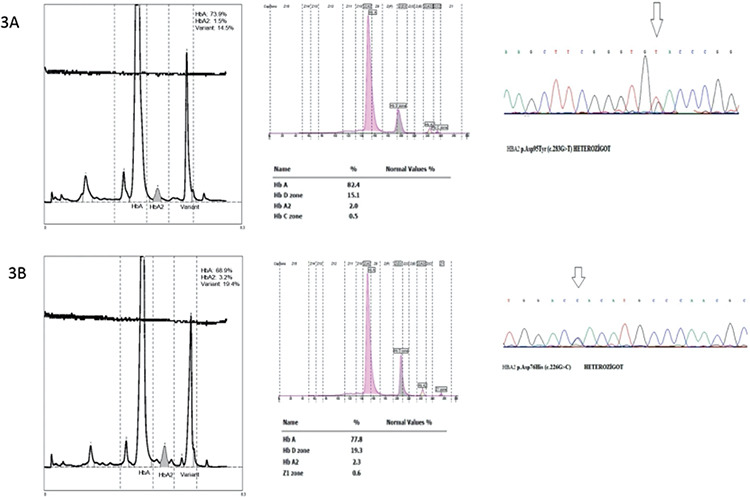
HPLC, CZE, and DNA analyses for the rare α-chain Hb variants. A) Hb Setif: p.Asp95Tyr (c.283G>T); 14.5% and 15.1% variant Hb was detected by HPLC and CZE, respectively. B) HbQ-Iran: p.Asp76His (c.226G>C); 19.4% and 19.3% variant Hb was detected by HPLC and CZE, respectively.
Discussion
This study aimed to compare CZE with HPLC in the evaluation of hemoglobinopathies. For patients without hemoglobinopathies, HbA values were generally in agreement between the two methods but HbA2 values were higher by CZE (bias: 0.10%), which is consistent with the findings of previous studies [16,17]. For the β-thalassemia trait, a negative bias of 0.07% was observed. Thus, it seems that good agreement was achieved with these methods, especially considering the clinical cut-off levels used to diagnose β-thalassemia. A good correlation was obtained between the methods for patients with and without thalassemia. For HbA2, correlation coefficients between 0.55 and 0.999 have been reported in the literature. These differences could be attributed to the study populations (with or without Hb variants) or the performance characteristics of the systems used [15,16,23].
In this study, the within-run and between-run CVs for HbA2 were higher than the recommended maximum imprecision of 2% with both methods [12]. This target could not be established in any previous studies; in the quality control program organized by the Italian Society of Haemoglobinopathy, normal, borderline, and pathological HbA2 results were distinguished with HPLC in all participating laboratories, but the overall interlaboratory CV was between 4% and 8.2% [24]. In the survey results from CAP 2008, HbA2 values showed bias values between 0.31% and 0.93% between different methods, suggesting that there was no standardization of HbA2 measurements [15]. Thus, it is crucial to standardize and improve the analytical quality of HbA2 measurements. In this study, individuals with values within the normal range for the HPLC method fell below the lower reference range for CZE, suggesting that HbA2 reference ranges should be determined accordingly. The lower cut-off value for HbA2 determined in this study (1.6%) was more consistent with the HPLC results.
In this study, HbD-Punjab, HbE, HbC, HbS/A, and HbS/S were identified similarly using the two considered methods with different interferences at HbA2 levels. Lower HbA2 levels were found for HbD-Punjab with the HPLC system and this was attributed to baseline noise errors rather than a real decrease. In individuals with coinheritance of HbD-Punjab and β-thalassemia, quantification of HbA2 by HPLC presents a challenge [15,16]. A clear separation and reliable estimation of HbA2 could not be achieved since HbE co-eluted with HbA2 in the HPLC system, as was also reported in previous studies [15].
On the other hand, the HbA2 results for heterozygous HbC were higher with the CZE system because the peaks of the HbC and HbA2 curves slightly overlapped, interfering with the quantification of both HbC and HbA2 [18,25]. In cases of heterozygous HbS, higher HbA2 values were found with the HPLC method because of the co-elution of glycated HbS and various HbS adducts, such as carbamylated α chains and βS chains [15,26].
For a patient with homozygous S, higher HbF levels were found with CZE, and co-migration of post-translationally modified HbF or degraded HbS with HbF may have been the reason [24]. All rare variants, except HbH by HPLC and HbS/D by CZE, were detected as separate peaks with both methods. HbH could not be detected because of its very fast elution by HPLC.
The discrepancy in identifying HbA2 values in the presence of HbS, HbC, HbD, and HbE may be attributed to different methodological techniques [14]. With HPLC, the Hb fractions were identified according to their retention times, taking specific variant Hb-containing calibrators as references. By CZE, the identification of variants is related to their migration positions on the electropherogram, taking HbA and HbA2 as references [19].
Within the time frame of the research presented here, we had a small number of results with comparable HbF values, which may be considered as a limitation of this study.
In this large-scale study, we compared hemoglobin screening results obtained by HPLC and CZE using 455 samples. A total of 13 different Hb variants were identified in the course of the study and the migration patterns of 4 of them, including HbG-Coushata, Hb Setif, Hb Hamadan, and HbQ-Iran, were identified using CZE for the first time and confirmed genetically.
Conclusion
Both of the methods applied in this study were in agreement regarding the preliminary identification of β-thalassemia patients. Different Hb variants were detected by both methods but with possible methodological interference for HbA2 measurements. CZE is a reliable and simple alternative for the evaluation of hemoglobinopathies, and standardization of HbA2 measurements should be prioritized as more techniques become available in routine laboratory practice.
Footnotes
Ethics
Ethics Committee Approval: This study was approved by the ethics committee of the relevant institution (11.01.2023, 2022/514/241/1).
Informed Consent: Written informed consent was obtained from patients undergoing genetic studies.
Authorship Contributions
Concept: Ö.Ç.M., Ö.H., F.E.; Design: Ö.Ç.M., Ö.H., A.O.; Data Collection or Processing: Ö.Ç.M., Ö.H., A.O., F.E.; Analysis or Interpretation: Ö.Ç.M., A.O., F.E.; Literature Search: Ö.Ç.M., Ö.H., A.O.; Writing: Ö.Ç.M., A.O.
Conflict of Interest: No conflict of interest was declared by the authors.
Financial Disclosure: The reagents for CAPILLARYS 3 OCTA were provided by SEBIA (Medisis Medical Systems, İstanbul, Türkiye).
References
- 1.Clarke GM, Higgins TN. Laboratory investigation of hemoglobinopathies and thalassemias: review and update. Clin Chem. 2000;46:1284–1290. [PubMed] [Google Scholar]
- 2.Giambona A, Passarello C, Renda D, Maggio A. The significance of the hemoglobin A2 value in screening for hemoglobinopathies. Clin Biochem. 2009;42:1786–1796. doi: 10.1016/j.clinbiochem.2009.06.026. [DOI] [PubMed] [Google Scholar]
- 3.Poventud-Fuentes I, Garnett E, Vispo B, Elghetany MT, Devaraj S. Hemoglobin fractionation by Sebia Capillarys 2 Flex Piercing System as primary method for evaluation of hemoglobinopathies. Clin Chim Acta. 2021;519:193–197. doi: 10.1016/j.cca.2021.04.023. [DOI] [PubMed] [Google Scholar]
- 4.Wajcman H, Préhu C, Bardakdjian-Michau J, Promé D, Riou J, Godart C, Mathis M, Hurtrel D, Galactéros F. Abnormal hemoglobins: laboratory methods. Hemoglobin. 2001;25:169–181. doi: 10.1081/hem-100104026. [DOI] [PubMed] [Google Scholar]
- 5.Hempe JM, Craver RD. Quantification of hemoglobin variants by capillary isoelectric focusing. Clin Chem. 1994;40:2288–2295. [PubMed] [Google Scholar]
- 6.Joutovsky A, Hadzi-Nesic J, Nardi MA. HPLC retention time as a diagnostic tool for hemoglobin variants and hemoglobinopathies: a study of 60000 samples in a clinical diagnostic laboratory. Clin Chem. 2004;50:1736–1747. doi: 10.1373/clinchem.2004.034991. [DOI] [PubMed] [Google Scholar]
- 7.Higgins T, Mack M, Khajuria A. Comparison of two methods for the quantification and identification of hemoglobin variants. Clin Biochem. 2009;42:701–705. doi: 10.1016/j.clinbiochem.2009.01.004. [DOI] [PubMed] [Google Scholar]
- 8.Kleinert P, Schmid M, Zurbriggen K, Speer O, Schmugge M, Roschitzki B, Durka SS, Leopold U, Kuster T, Heizmann CW, Frischknecht H, Troxler H. Mass spectrometry: a tool for enhanced detection of hemoglobin variants. Clin Chem. 2008;54:69–76. doi: 10.1373/clinchem.2007.089961. [DOI] [PubMed] [Google Scholar]
- 9.Harteveld CL. State of the art and new developments in molecular diagnostics for hemoglobinopathies in multiethnic societies. Int J Lab Hematol. 2014;36:1–12. doi: 10.1111/ijlh.12108. [DOI] [PubMed] [Google Scholar]
- 10.Ryan K, Bain BJ, Worthington D, James J, Plews D, Mason A, Roper D, Rees DC, de la Salle B, Streetly A; British Committee for Standards in Haematology. Significant haemoglobinopathies: guidelines for screening and diagnosis. Br J Haematol. 2010;149:35–49. doi: 10.1111/j.1365-2141.2009.08054.x. [DOI] [PubMed] [Google Scholar]
- 11.Ke P, Liu J, Chao Y, Wu X, Xiong Y, Lin L, Wan Z, Wu X, Xu J, Zhuang J, Huang X. Measurement of HbA1c and HbA2 by Capillarys 2 Flex Piercing HbA1c programme for simultaneous management of diabetes and screening for thalassemia. Biochem Med (Zagreb) 2017;27:030704. doi: 10.11613/BM.2017.030704. [DOI] [PMC free article] [PubMed] [Google Scholar]
- 12.Stephens AD, Colah R, Fucharoen S, Hoyer J, Keren D, McFarlane A, Perrett D, Wild BJ; International Council for Standardization in Haematology (ICSH) ICSH recommendations for assessing automated high-performance liquid chromatography and capillary electrophoresis equipment for the quantitation of HbA2. Int J Lab Hematol. 2015;37:577–582. doi: 10.1111/ijlh.12413. [DOI] [PubMed] [Google Scholar]
- 13.Keren DF, Hedstrom D, Gulbranson R, Ou CN, Bak R. Comparison of Sebia Capillarys capillary electrophoresis with the Primus high-pressure liquid chromatography in the evaluation of hemoglobinopathies. Am J Clin Pathol. 2008;130:824–831. doi: 10.1309/AJCPQY80HZWHHGZF. [DOI] [PubMed] [Google Scholar]
- 14.Greene DN, Pyle AL, Chang JS, Hoke C, Lorey T. Comparison of Sebia Capillarys Flex capillary electrophoresis with the BioRad Variant II high pressure liquid chromatography in the evaluation of hemoglobinopathies. Clin Chim Acta. 2012;413:1232–1238. doi: 10.1016/j.cca.2012.03.027. [DOI] [PubMed] [Google Scholar]
- 15.Higgins TN, Khajuria A, Mack M. Quantification of HbA2 in patients with and without beta-thalassemia and in the presence of HbS, HbC, HbE, and HbD Punjab hemoglobin variants: comparison of two systems. Am J Clin Pathol. 2009;131:357–362. doi: 10.1309/AJCP28QKSOPHYOBC. [DOI] [PubMed] [Google Scholar]
- 16.Cotton F, Lin C, Fontaine B, Gulbis B, Janssens J, Vertongen F. Evaluation of a capillary electrophoresis method for routine determination of hemoglobins A2 and F. Clin Chem. 1999;45:237–243. [PubMed] [Google Scholar]
- 17.Oyaert M, Van Laer C, Claerhout H, Vermeersch P, Desmet K, Pauwels S, Kieffer D. Evaluation of the Sebia Minicap Flex Piercing capillary electrophoresis for testing. Int J Lab Hematol. 2015;37:420–425. doi: 10.1111/ijlh.12305. [DOI] [PubMed] [Google Scholar]
- 18.Lippi G, Plebani M. Capillary electrophoresis for the screening and diagnosis of inherited hemoglobin disorders. Ready for prime time? Clin Chem Lab Med. 2016;54:5–6. doi: 10.1515/cclm-2015-0545. [DOI] [PubMed] [Google Scholar]
- 19.Riou J, Szuberski J, Godart C, Wajcman H, Oliveira JL, Hoyer JD, Bardakdjian-Michau J. Precision of CAPILLARYS 2 for the detection of hemoglobin variants based on their migration positions. Am J Clin Pathol. 2018;149:172–180. doi: 10.1093/ajcp/aqx148. [DOI] [PubMed] [Google Scholar]
- 20.Yang Z, Chaffin CH, Easley PL, Thigpen B, Reddy VV. Prevalence of elevated hemoglobin A2 measured by the CAPILLARYS system. Am J Clin Pathol. 2009;131:42–48. doi: 10.1309/AJCPD0PJGFT0SXMK. [DOI] [PubMed] [Google Scholar]
- 21.Mentzer WC Jr. Differentiation of iron deficiency and thalassemia. Lancet. 1973;21:882. doi: 10.1016/s0140-6736(73)91446-3. [DOI] [PubMed] [Google Scholar]
- 22.CLSI, IFCC. C28-A3 Document: Defining, Establishing, and Verifying RIs in the Clinical Laboratory: Approved Guideline-Third Edition. Wayne (PA), CLSI, 2008. [Internet]
- 23.Ercan Karadağ M, Akbulut ED, Avcı E, Fırat Oğuz E, Kader S, Abuşoğlu G, Serdar M, Yılmaz FM. Evaluation of four different HPLC devices for hemoglobinopathy screening. Turkish Journal of Biochemistry. 2020;46:39–44. [Google Scholar]
- 24.Paleari R, Giambona A, Cannata M, Leto F, Maggio A, Mosca A. External quality assessment of hemoglobin A2 measurement: data from an Italian pilot study with fresh whole blood samples and commercial HPLC systems. Clin Chem Lab Med. 2007;45:88–92. doi: 10.1515/CCLM.2007.002. [DOI] [PubMed] [Google Scholar]
- 25.Greene DN, Vaughn CP, Crews BO, Agarwal AM. Advances in detection of hemoglobinopathies. Clin Chim Acta. 2015;439:50–57. doi: 10.1016/j.cca.2014.10.006. [DOI] [PubMed] [Google Scholar]
- 26.Zurbriggen K, Schmugge M, Schmid M, Durka S, Kleinert P, Kuster T, Heizmann CW, Troxler H. Analysis of minor hemoglobins by matrix-assisted laser desorption/ionization time-of-flight mass spectrometry. Clin Chem. 2005;51:989–996. doi: 10.1373/clinchem.2005.047985. [DOI] [PubMed] [Google Scholar]