Abstract
Objective:
This study examined the implementation of a Doppler sonography imaging protocol to assess intraneural blood flow, within the median nerve, in healthy individuals.
Materials and Methods:
A total of 176 participants were examined, and this involved 717 retrospective observations of the images collected. The implemented imaging protocol was assessed, and the data that were collected were cleaned and checked for fidelity and validity.
Results:
A large percentage of missing evidence (11%–35%) across proximal, mid, and distal carpal tunnel locations. Only a quarter of cases with evidence of intraneural blood flow had the strongest evidence of a power Doppler video clip, of which only three-quarters were valid. The study identified potential areas for improving the imaging protocol to reduce missing data and improve data quality.
Conclusion:
This study demonstrates the significance of a standardized imaging protocol to guide the sonographic acquisition of Doppler images and provides important insights into potential issues with data quality. The recommendations have the potential to help future studies assess intraneural blood flow in healthy populations in a more rigorous and reliable way. Incorporating the study’s recommendations into a standardized protocol, there is potential to enhance the diagnostic accuracy of carpal tunnel syndrome and improve diagnosis and treatment.
Keywords: carpal tunnel syndrome, intraneural blood flow, median nerve, sonography
Intraneural blood flow is a biomarker that can potentially be used to document physiological and pathological changes occurring within the median nerve.1–3 Recently, Doppler has been used to examine the vascularization within the median nerve, and the biomarker of intraneural blood flow has been evaluated for use in the early diagnosis of median nerve pathologies such as carpal tunnel (CT) syndrome.1,4–9 Previous studies have found that CT syndrome patients have more intraneural blood flow than healthy people,4–6,10 identified the associations between CT syndrome severity and median nerve vascularization,8 and demonstrated the diagnostic value of the biomarker of intraneural blood flow examined by Doppler.9,11
Because sonography is highly dependent on the operator, examinations are guided by detailed standardized imaging protocols to improve reliability across users of sonography. Such protocols often describe the evaluation of the entire targeted region with instructions on the sequenced examination of the structures and clearly describe pitfalls, things to be noted, and common pathology that might be identified. The study has shown that the adoption of a standardized imaging protocol by first-year fellows improved the accuracy of the echocardiographic reports, with more quantitative measurements of ventricular function incorporated.12 Because examining intraneural blood flow with Doppler is an emerging technique, no standardized protocol has been described in detail. Instead, examinations are being conducted at various locations (e.g., at proximal CT,6 at middle CT),13 in different planes (e.g., the cross-sectional plane6,14 and the longitudinal plane),15,16 and with varied equipment system settings.
To explore the potential magnitude of measurement error due to a non-standardized imaging protocol, a retrospective analysis was conducted using data from a longitudinal cohort study that deployed an image acquisition and analysis protocol designed for assessing intraneural blood flow within the median nerve. The purpose of this retrospective data analysis was to identify potential barriers to conducting rigorous Doppler evaluation of the median nerve and guide the development of a standardized image acquisition and analysis protocol for the assessment of intraneural blood flow.
Materials and Methods
A longitudinal study was conducted to examine the predictive validity of sonography as an early detection measure for median nerve pathology; although numerous data points were obtained as part of the longitudinal study, the data examined in this report are limited to participant demographics and Doppler findings. In this study, students who were in occupational therapy (OT) or dental hygiene (DH) programs were recruited at the beginning of their 2-year academic program. Demographics, including age, gender, ethnicity, and race, were collected by self-reported surveys at baseline. Sonography was used to evaluate the distal portion of the median nerve, which included an investigation of intraneural blood flow in the CT region. Images were collected at baseline and at approximately 5-month intervals for DH students for a total of 5 visits and at 10–12-month intervals for OT students for a total of 3 visits. Data collection was completed from July 2016 to June 2019. The study was approved by the Ohio State University’s Social and Behavioral institutional review board, and written informed consent was obtained from all participants.
Image Acquisition Protocol
Sonography images were collected using a Logiq-e portable sonography machine (GE Healthcare, Milwaukee, WI) with a 12-MHz linear array transducer. Participants sat facing the sonographer with their supinated forearms comfortably resting on the table and the wrist and fingers in a relaxed position. Along with a full regional scan of the median nerve from the distal forearm to the distal CT using grayscale imaging as part of the primary study (see Figure 1), power Doppler and spectral Doppler were performed to examine the vascularization of the median nerve within the CT region (see Figures 2 and 3). Doppler examinations were conducted in the long axis of the median nerve at three locations: proximal CT, mid-CT, and distal CT (see Figure 4). The proximal CT included the portion of the median nerve over the distal end of the radius and radio-carpal joint. The mid-CT included the area of the median nerve directly superficial to the lunate and capitate bones on the longitudinal image. The distal CT was identified as the segment of the median nerve in the region immediately distal of the capitate bone.
Figure 1.
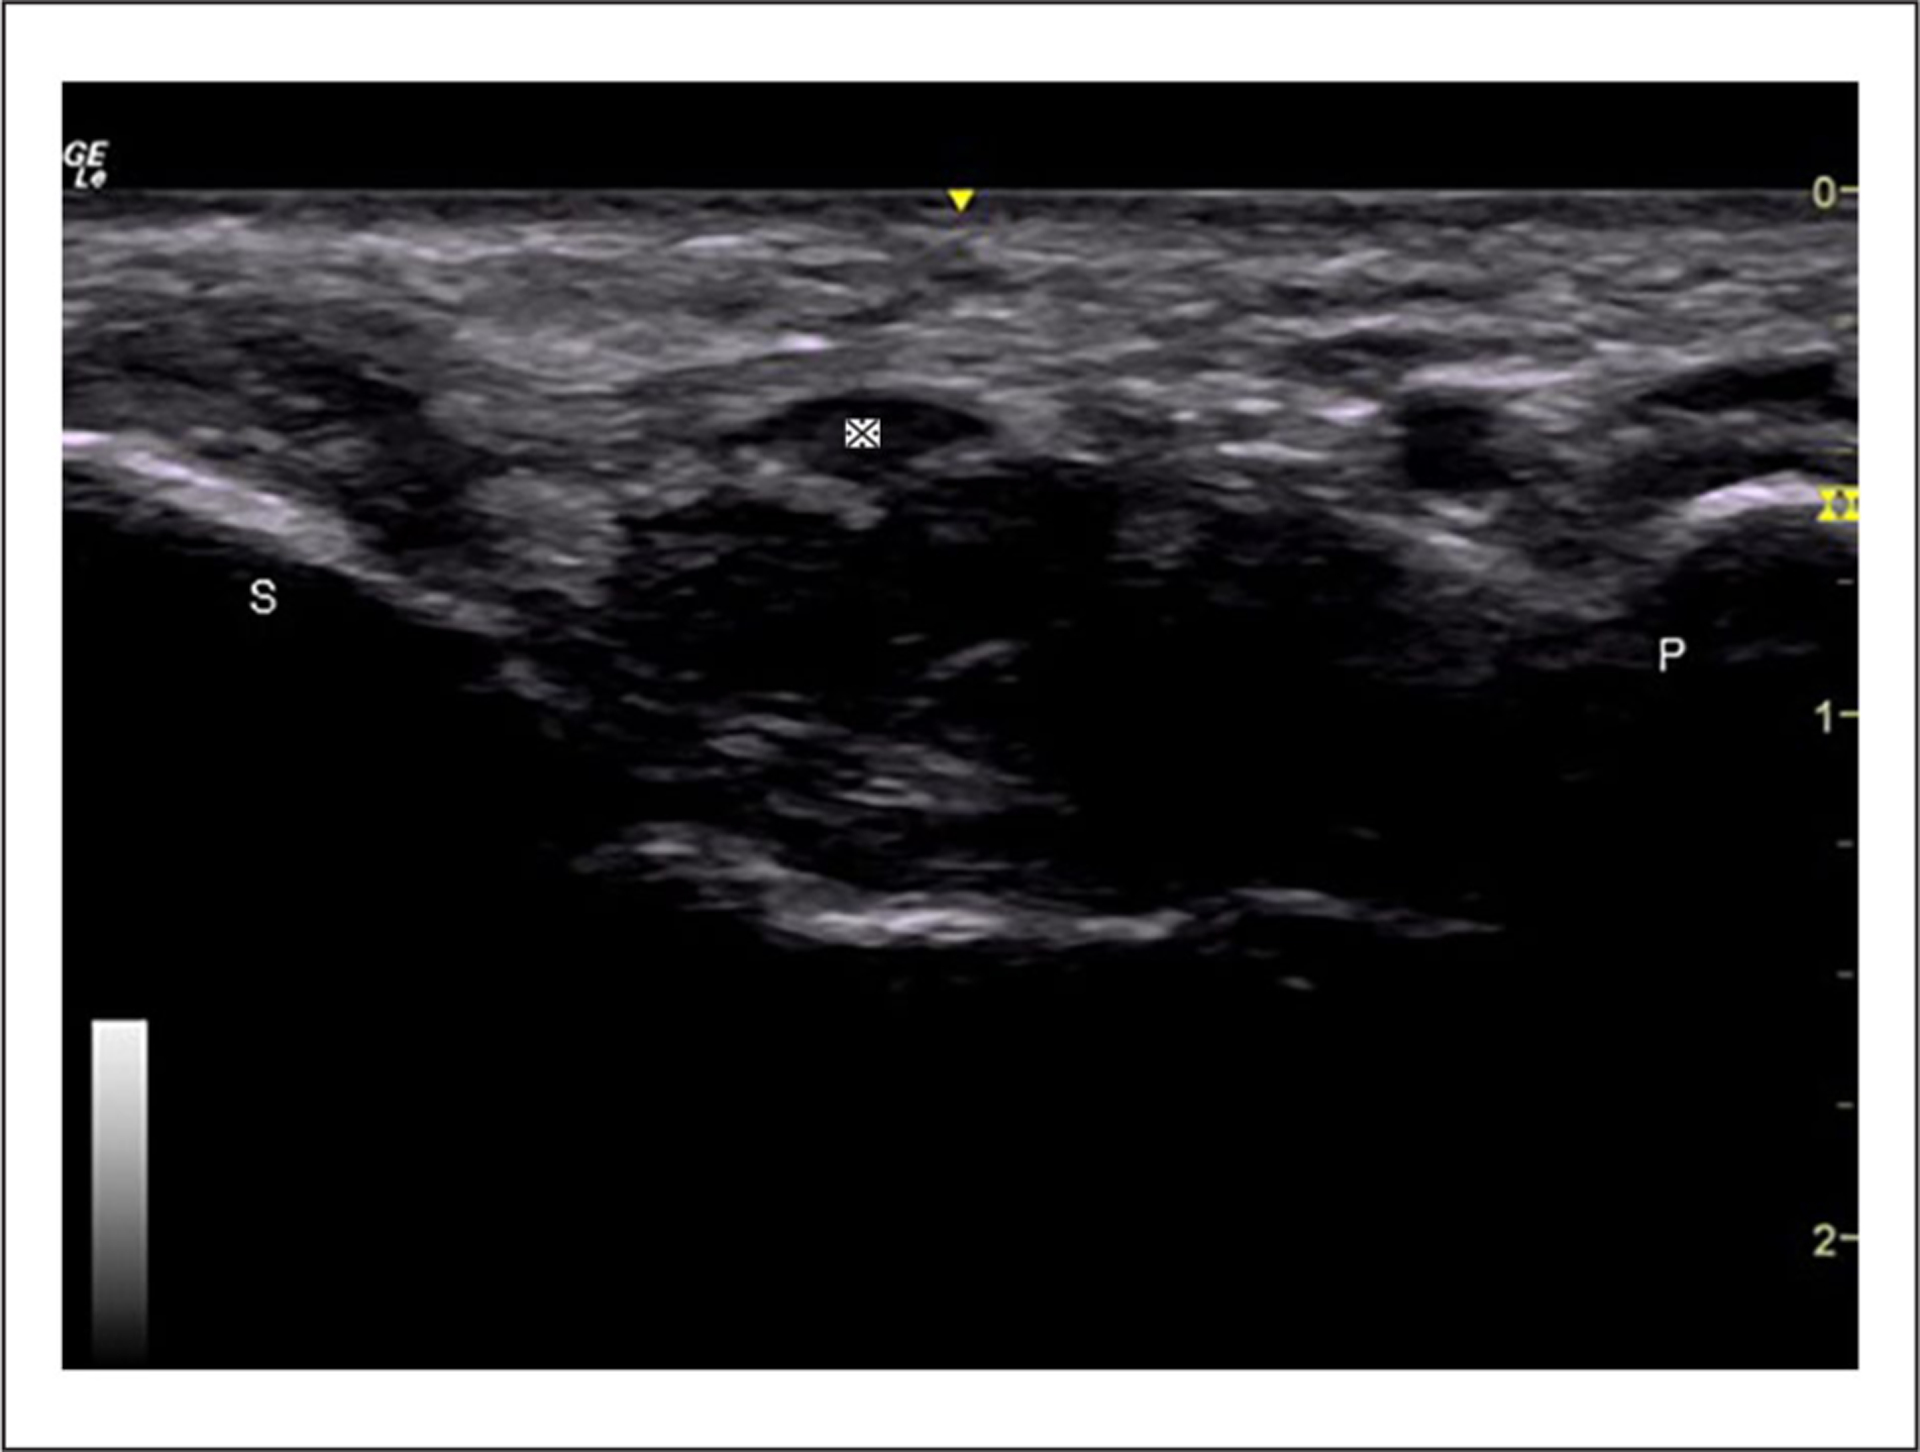
The cross-sectional view of the median nerve at the pisiform and scaphoid levels. ※, median nerve; P, pisiform; S, scaphoid.
Figure 2.
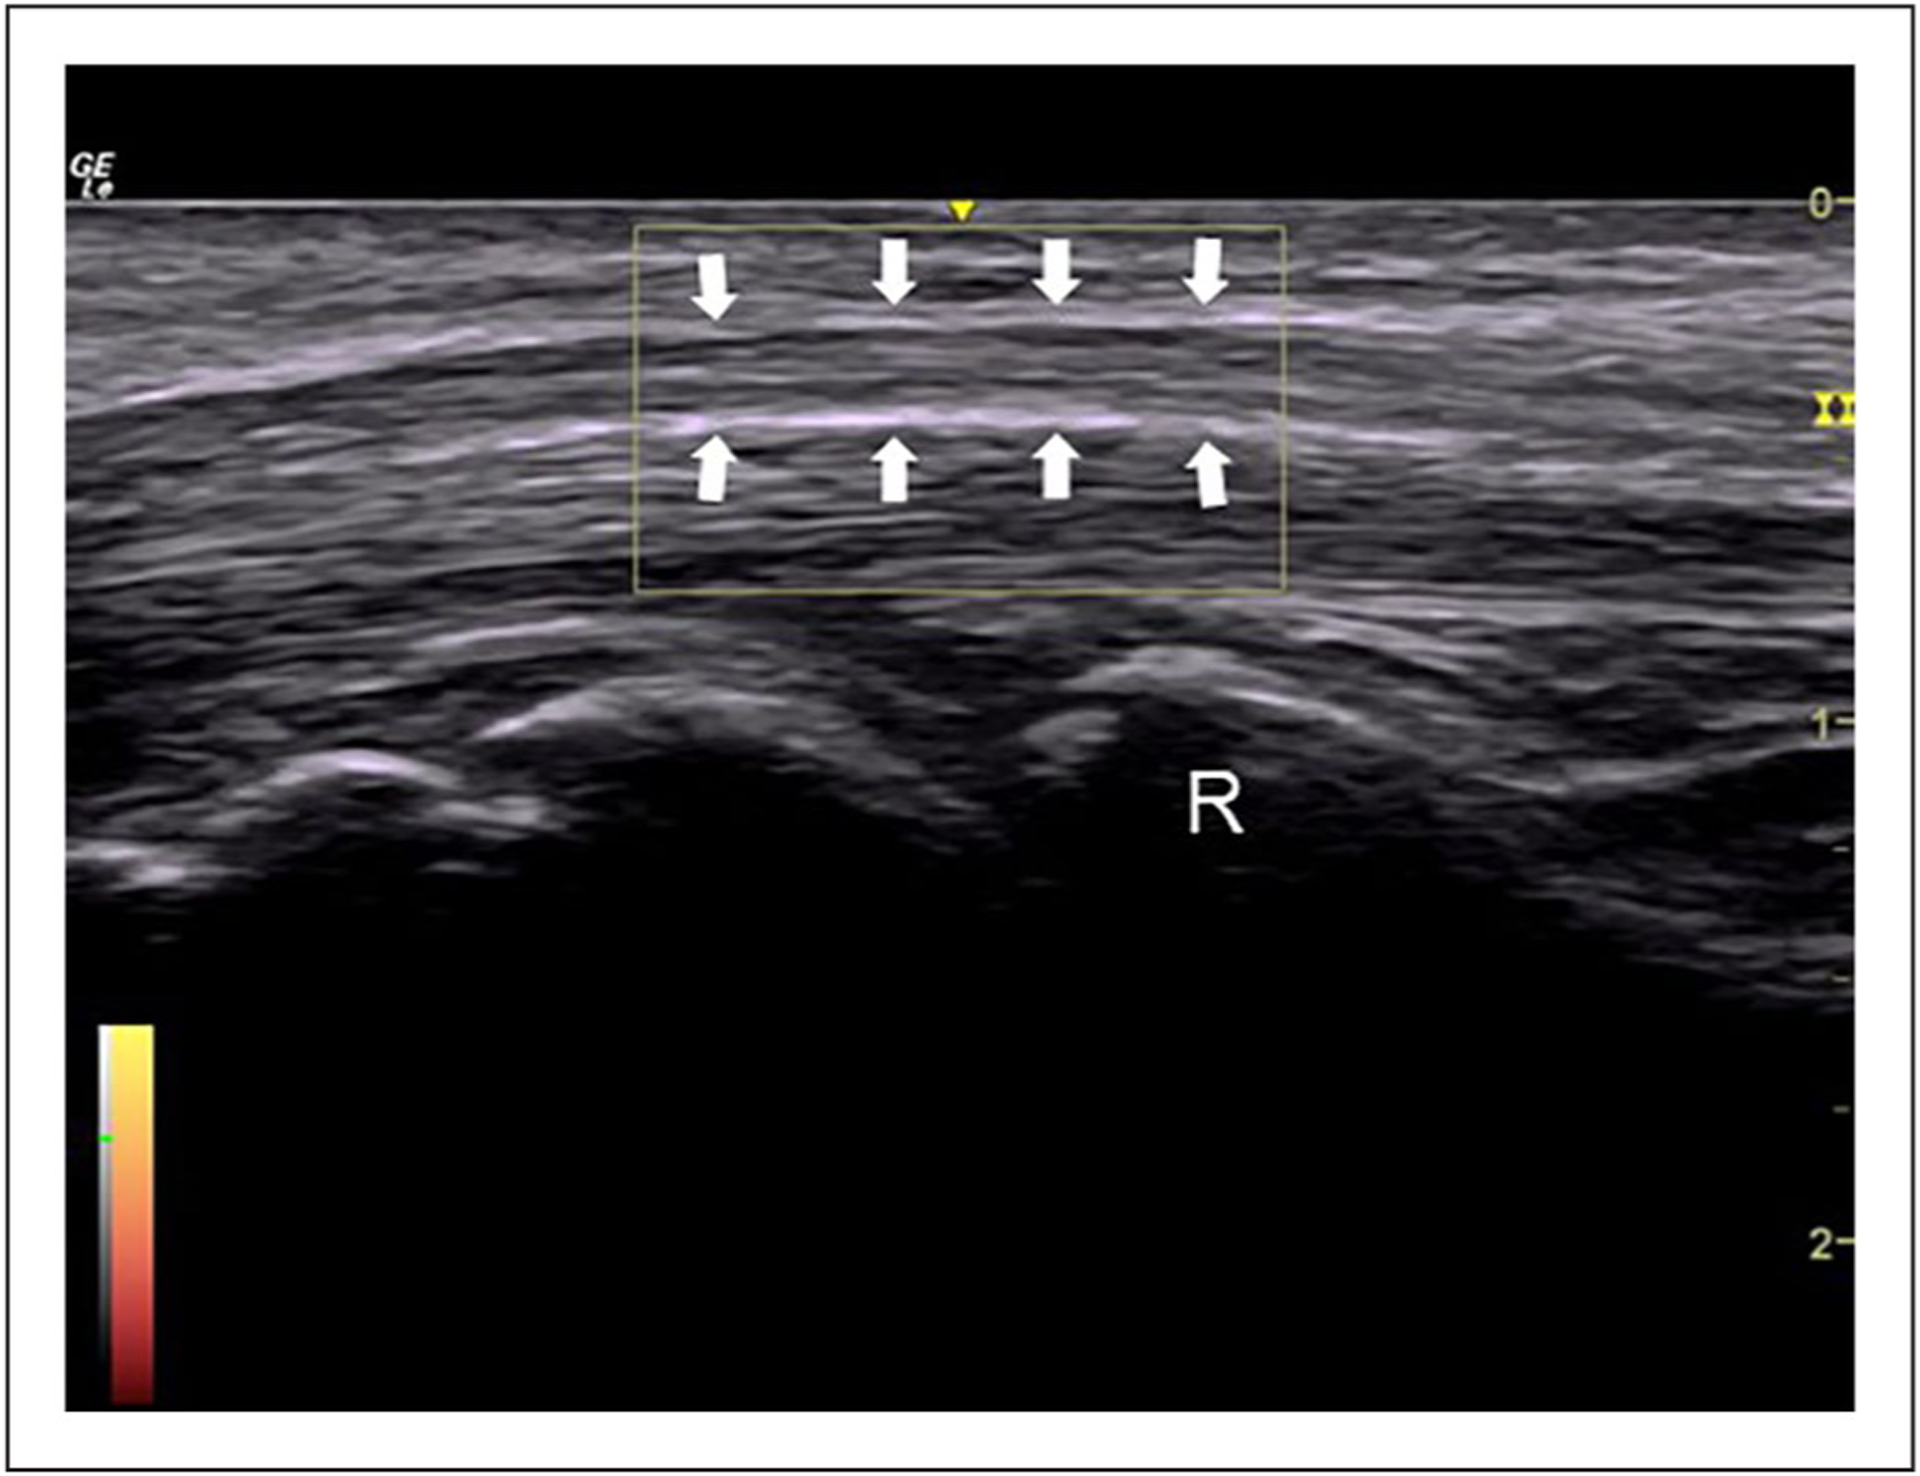
An example of the power Doppler image of the median nerve at the level of the mid-carpal tunnel. Arrows, median nerve; R, head of the radius.
Figure 3.
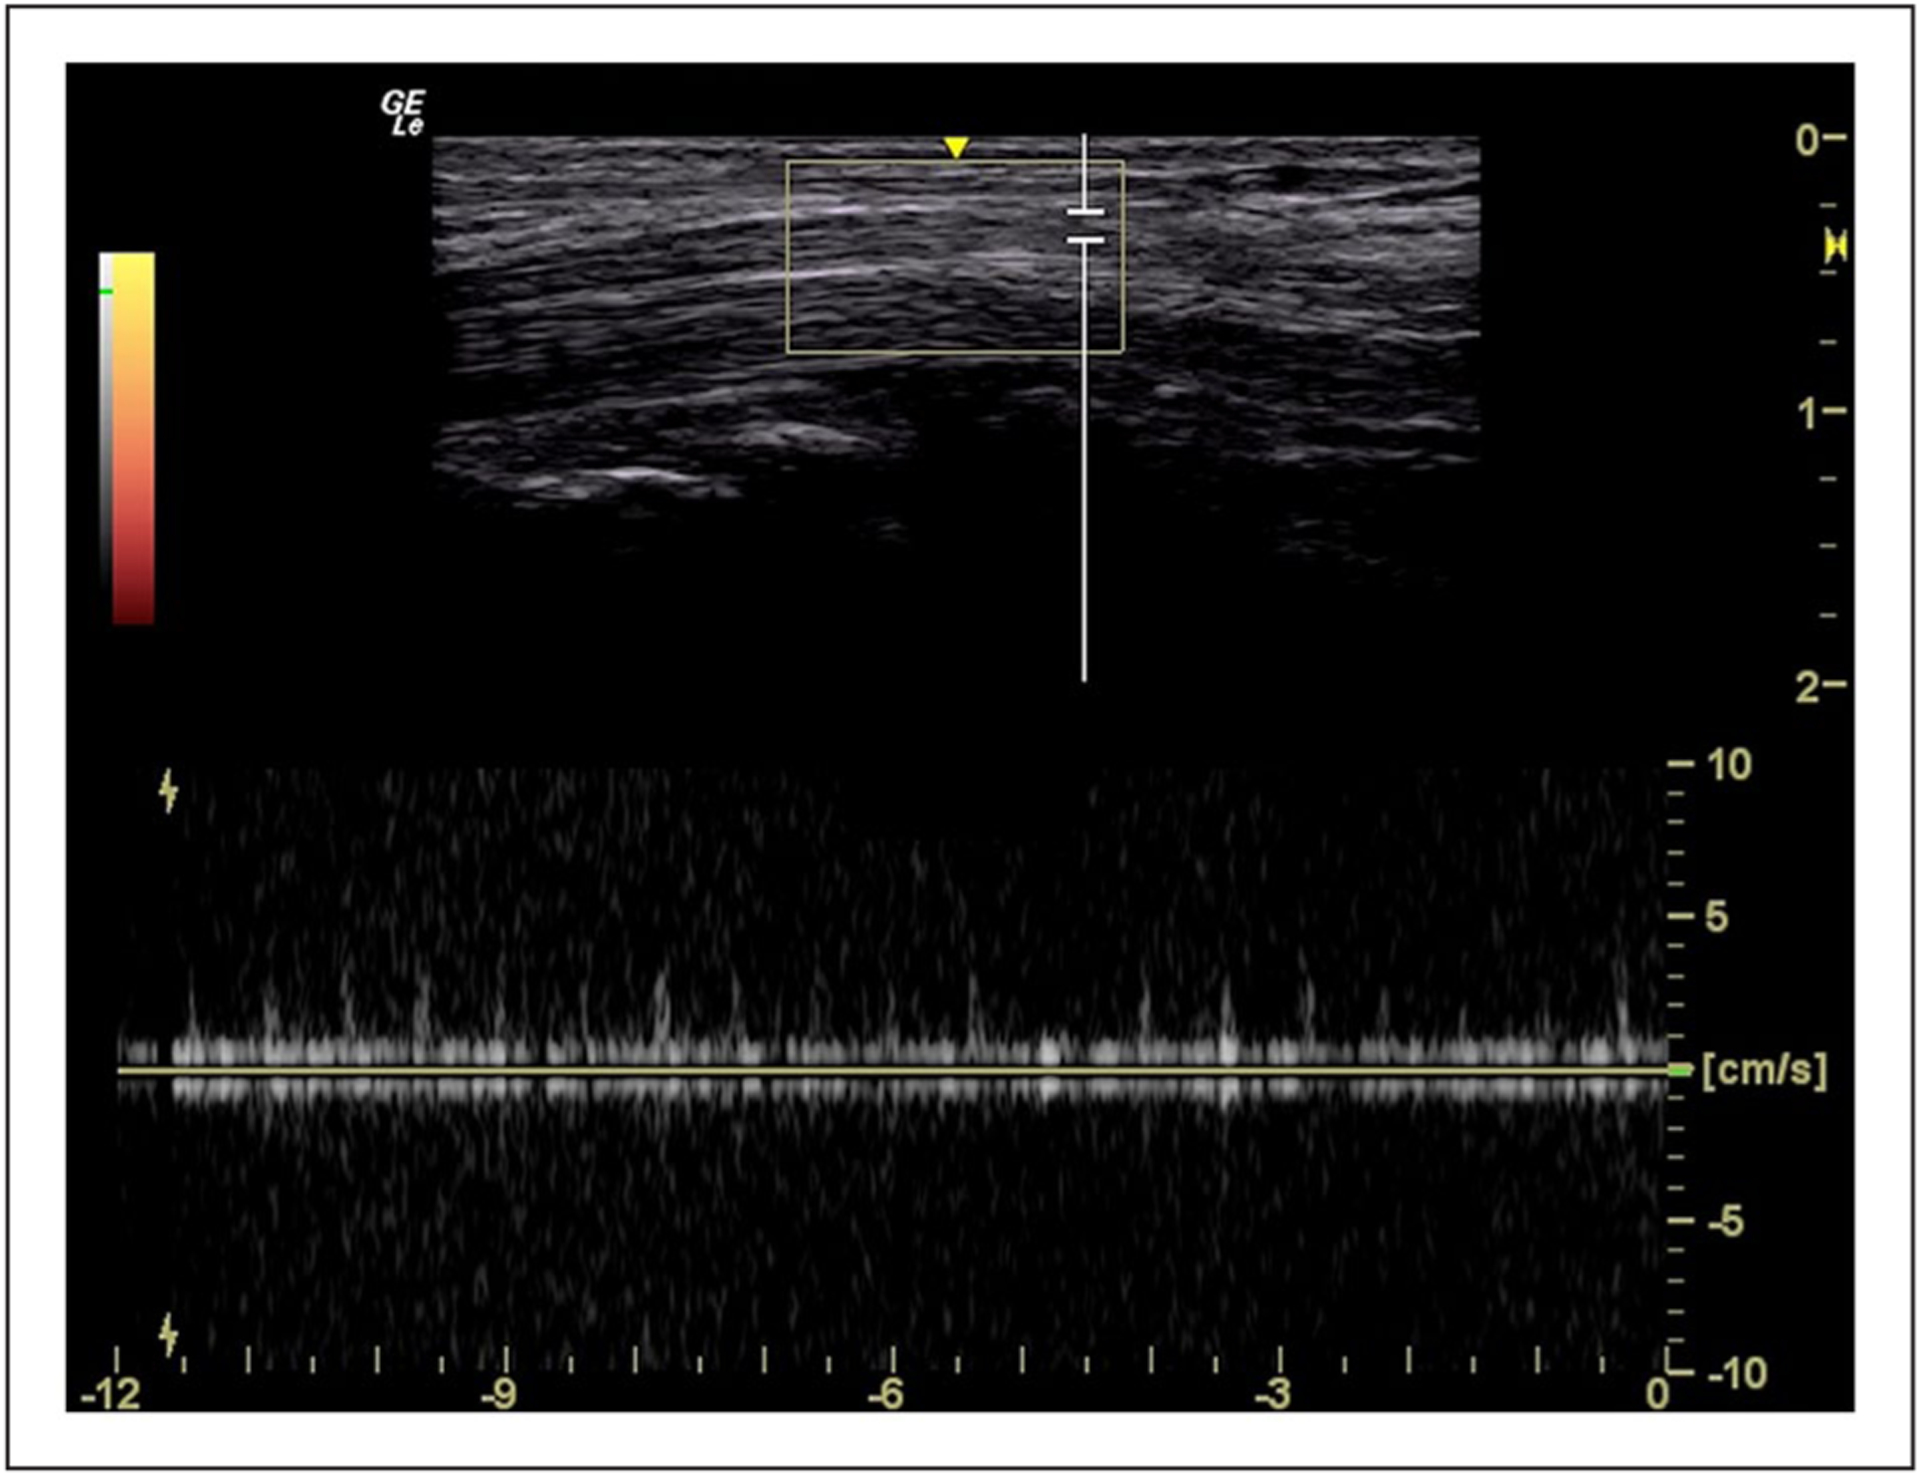
An example of the spectral Doppler inspection of intraneural blood flow of the median nerve at the level of the mid-carpal tunnel.
Figure 4.
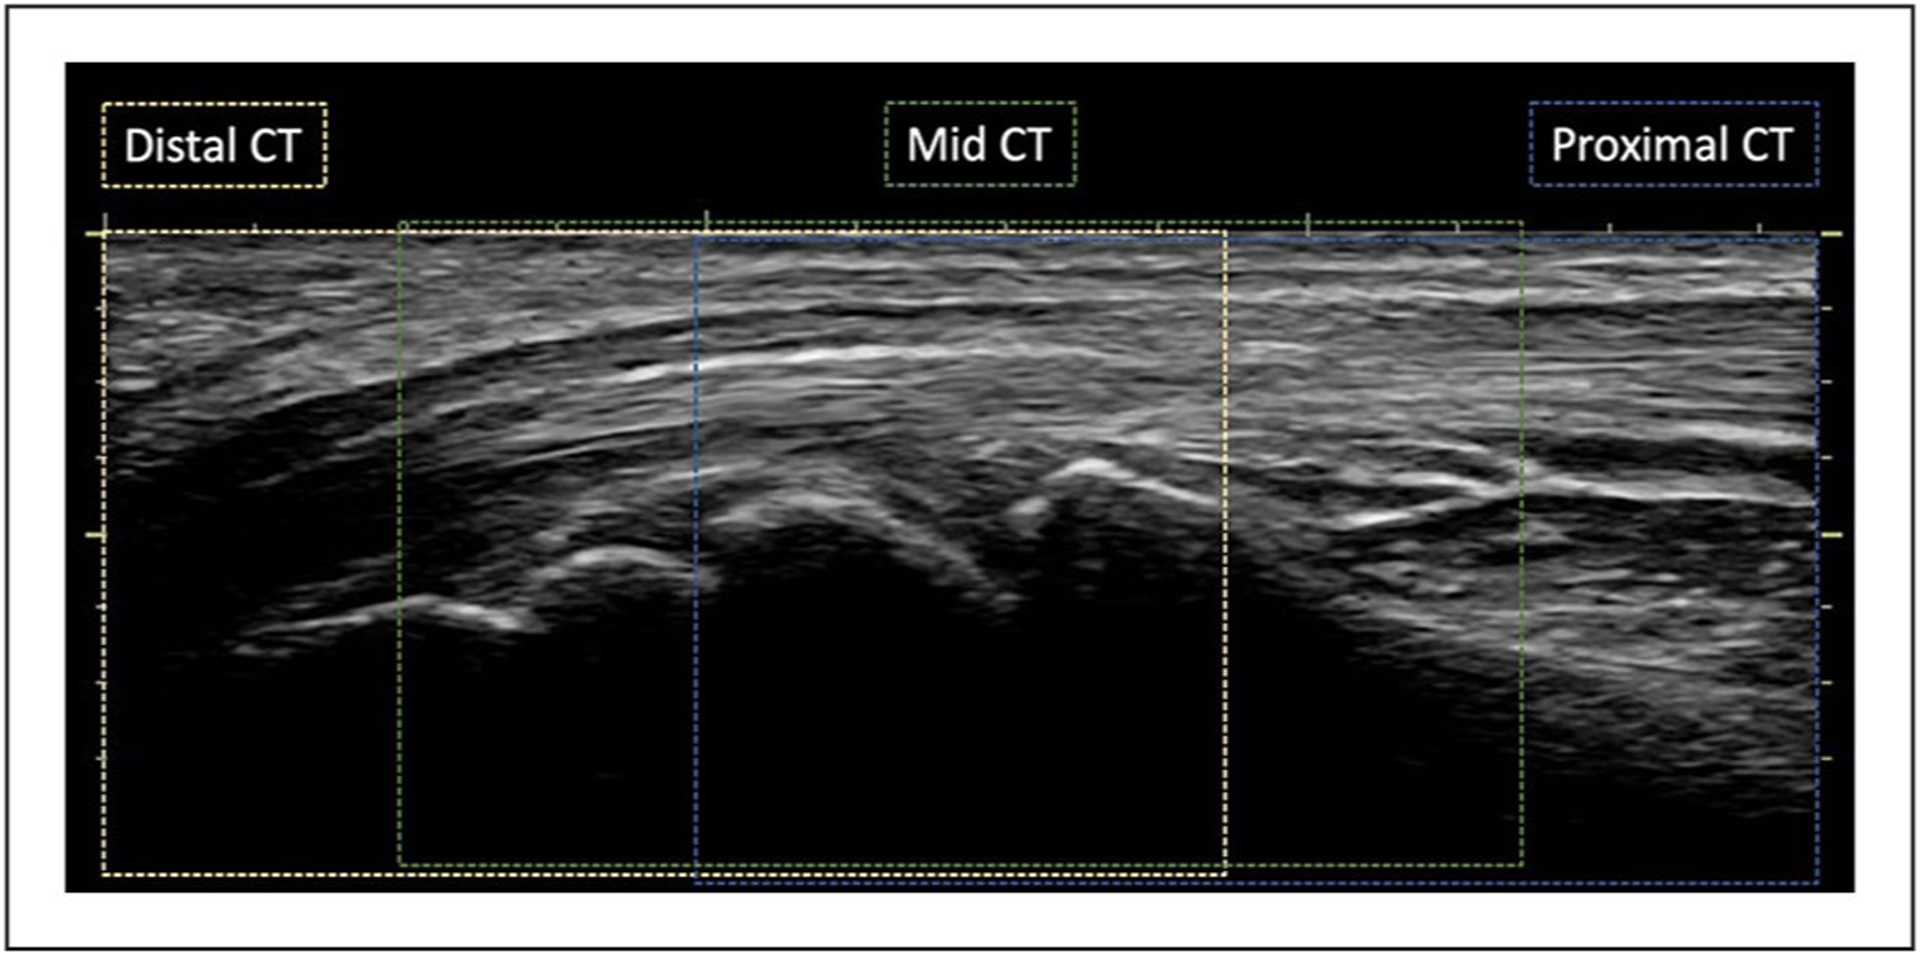
The longitudinal plane of the median nerve. The locations for proximal CT, mid-CT, and distal CT are demonstrated in blue, green, and yellow dotted lines, respectively. CT, carpal tunnel.
The vascularity assessment began with a power Doppler screening by slowly moving the transducer through the three CT regions from proximal to distal with intermittent pauses to observe for blood flow signals within the median nerve. The Doppler region of interest was sized with a height as small as possible on the machine and approximately one-third the width of the image. A preset pulse repetition frequency at 0.6 kHz and gain at 7.5 dB served as the baseline for all examinations. These power Doppler settings were adjusted throughout each examination to simultaneously minimize flash artifacts and maximize sensitivity for the detection of pulsatile signals indicative of low-flow blood vessels. The sonographer was instructed to document the presence or absence of blood flow using an image or cine clip. When a pulsatile signal was observed, spectral Doppler was used to generate waveforms of the identified blood vessels, showing the spectrum of blood flow velocity over time. The preset for spectral Doppler included pulse repetition frequency at 1.7 kHz, acoustic output at 100%, and gain at 19 dB. The spectral Doppler gate width was 2.0 mm. Angle correction was not performed due to the orientation of the arteriole being unknown by only one pulsatile power Doppler signal.
Examination of Protocol Implementation
A valid data set was created by identifying missing participant visits and excluding data points that were not eligible for this analysis. Specifically, evidence of a bifid median nerve or a persistent median artery anywhere between the distal forearm to the CT made all data obtained from a participant’s wrist ineligible for inclusion in the data set. The existence of a bifid median nerve or a persistent median artery was confirmed through a review of all grayscale and Doppler images, or cine clips included in the participant’s case file as part of the full regional evaluation. The exclusion was at the wrist level, which meant that, for example, if a participant had a bifid median nerve on the left hand but not the right hand, then only the images collected from the left hand were excluded, and the images collected from the right hand were retained in the data set. Using this imaging data set, a two-step image review process was used to examine the fidelity and validity of the imaging protocol implementation at individual time points within each of the three CT regions for every wrist.
Fidelity Check
Fidelity was examined by counting the number of evidenced cases compared with cases lacking complete documentation. If the imaging protocol was correctly followed, a complete case for a wrist would include evidence that directly documented the presence or absence of the median nerve intraneural blood flow within each of the three anatomic regions: proximal CT, mid-CT, and distal CT. Three types of data were considered appropriate to document the presence or absence of the median nerve intraneural blood flow: (1) a power Doppler video clip, (2) a still-frame power Doppler image, or (3) a spectral Doppler waveform image. If there was either a video clip, a still-frame image, or a waveform image, the case for the anatomic region was counted as an evidenced case. If none of the three data types were included in the anatomic region, then, the case was marked as having missing documentation. Two assumptions could be applied to missing cases. First, the data were missing due to the sonographer not examining this region, or second, the sonographer did not find any evidence of blood flow and was documenting by exclusion.
Validity Check
This step of the analysis examined the quality of the data included in evidenced cases to determine how many cases could be validly considered in a quantitative analysis of blood flow. A power Doppler video clip was considered the strongest evidence of either the presence or absence of intraneural flow. The valid presence of the intraneural blood based on video evidence had three quality requirements:
The signal(s) were located within the median nerve or its hyperechoic border. If the blood flow signal was in the hyperechoic border, it was required that at least 50% of the signal pixels were at or within the hyperechoic border for that blood flow signal to be counted as an intraneural blood flow signal.
The signal was not a flash artifact.
The signal had at least three pulsatile cycles.
For still-frame images, the valid presence of the intraneural blood flow had to meet the first two requirements for the video clips. The absence of blood flow was considered valid when a video or image was provided with no color pixels within the median nerve, and no spectral tracings existed in the case file for the given region. Finally, three quality requirements were applied to establish the validity of spectral waveforms:
The gate location was positioned within the median nerve or its hyperechoic border. If the gate was in the hyperechoic border, it was required that at least 50% of the gate length was at or within the hyperechoic border for that waveform to be counted as intraneural blood flow.
The waveforms had more signal than noise.
The spectral tracing had at least three consistent waveforms that represented pulsatile blood flow.
Data Analysis and Synthesis
The demographic characteristics of the included participants were summarized by group (i.e., DH and OT) separately and together. The continuous variable of age was presented as mean and standard deviation, and the categorical variables of gender, race, and ethnicity were presented as frequency and percentage. A comparison of the demographics between the two groups was done using a two-sample t-test and chi-squared tests as appropriate. A P value of .05 was identified as statistically significant. These data analyses were performed using STATA.
Flow charts were created for data from the left and right wrists to depict the results of the fidelity and validity check processes for each CT region (see Figures 5 and 6). First, the frequencies of total possible cases for each CT region were denoted in the flow chart as red boxes. Of these total possible cases, it was identified as either “evidence missing” as denoted as the orange hexagons in the flow chart or “evidenced cases” as the blue boxes in the flow chart. Data fidelity was represented as the incidence of missing data, which was calculated by dividing the number of missing cases (orange hexagons) by the number of total possible cases (red boxes).
Figure 5.
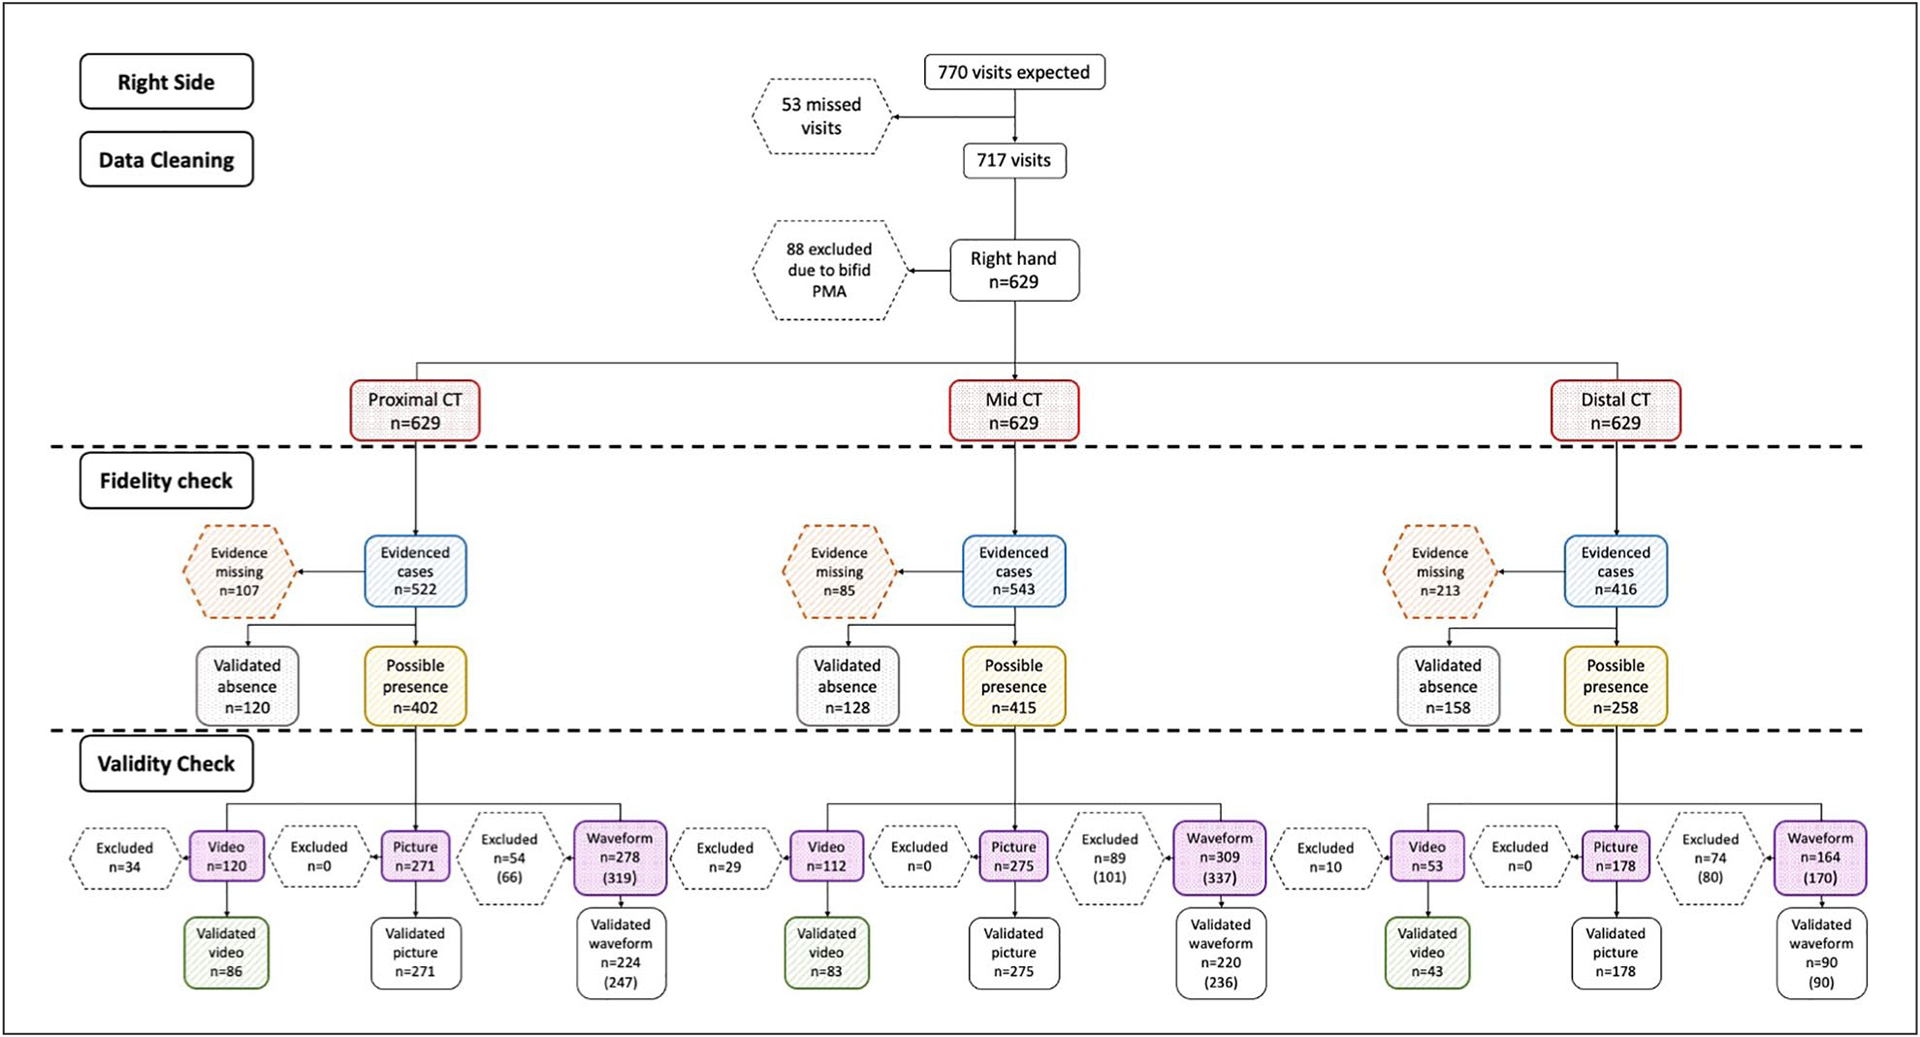
The flow chart of all observations on the right side. The red boxes indicate the frequencies of total possible cases; the orange boxes indicate the cases where evidence was missing; the blue boxes indicate the cases with evidence documenting the presence or absence of intraneural blood flow; the gray boxes denote the number of cases that had validated absence of intraneural blood flow; the yellow boxes show the cases with the possible presence of intraneural blood flow; the purple boxes indicate the frequency of cases that had either a video, a picture, or a waveform; and the green boxes demonstrate the number of validated videos. CT, carpal tunnel.
Figure 6.
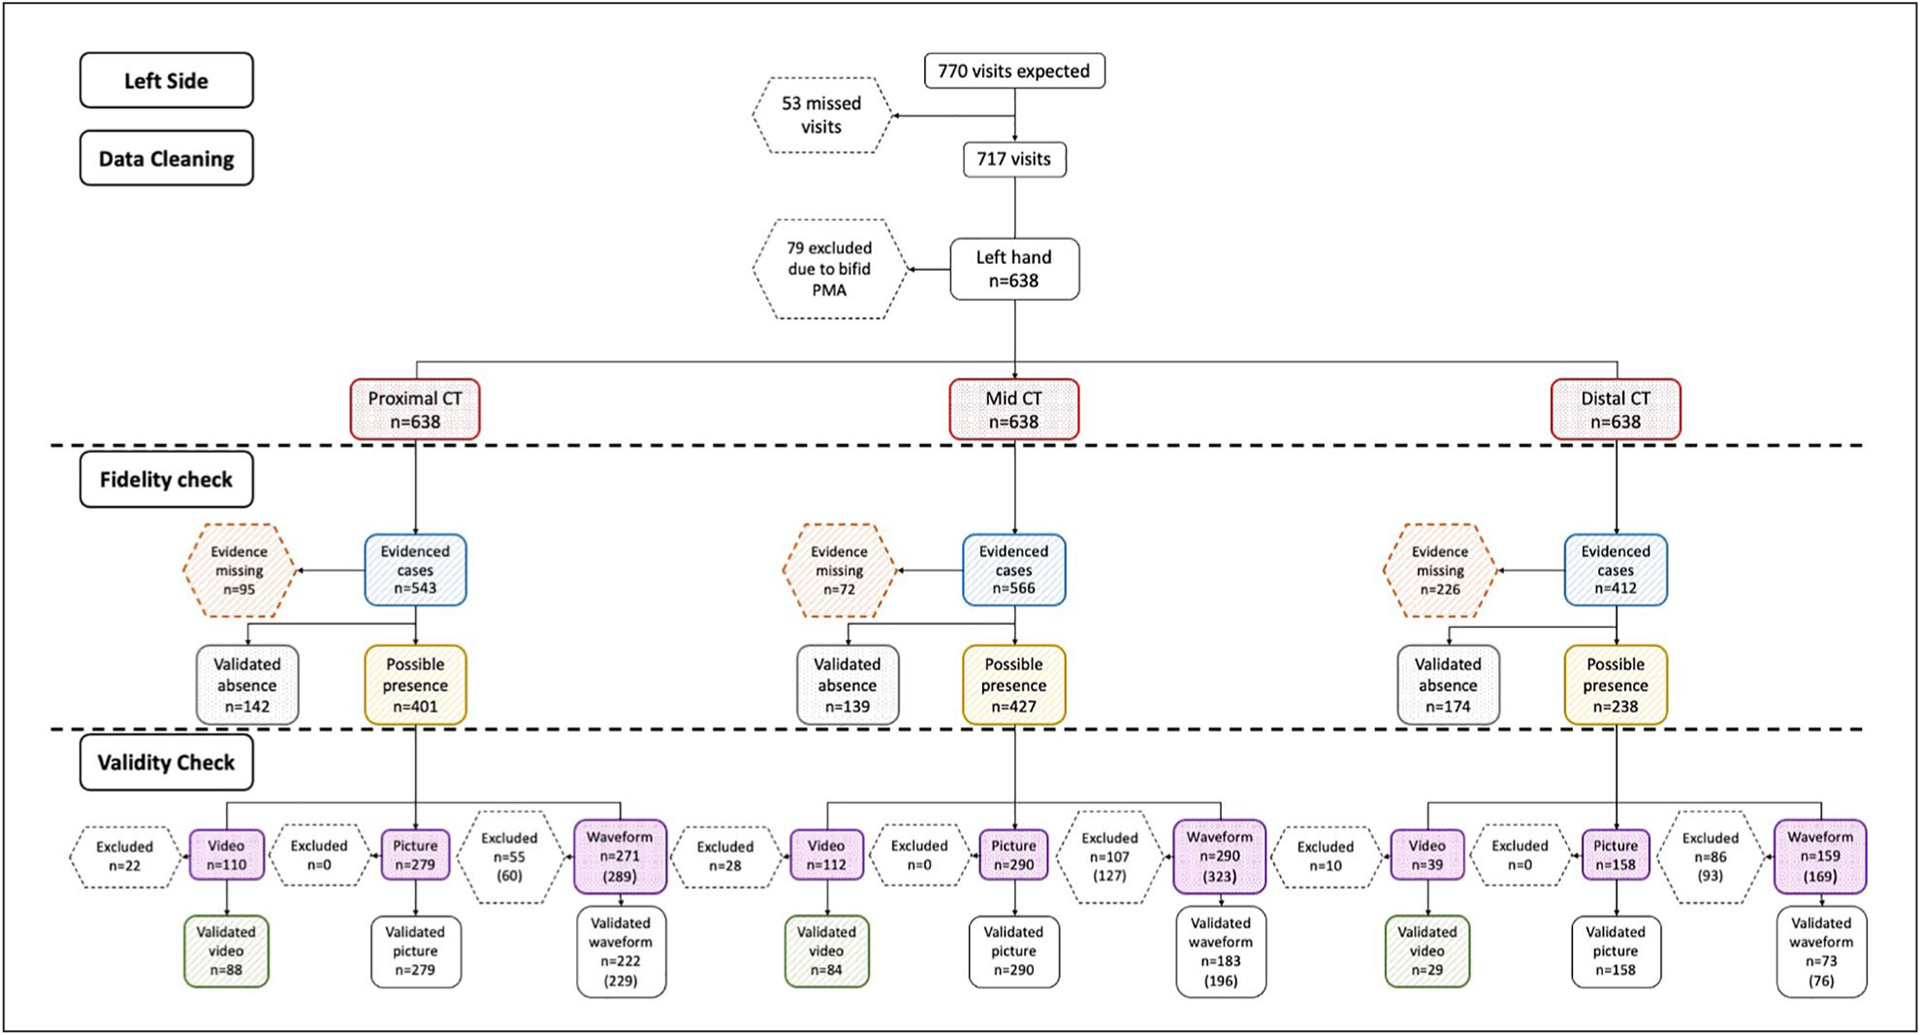
The flow chart of all observations on the left side. The red boxes indicate the frequencies of total possible cases; the orange boxes indicate the cases where evidence was missing; the blue boxes indicate the cases with evidence documenting the presence or absence of intraneural blood flow; the gray boxes denote the number of cases that had validated absence of intraneural blood flow; the yellow boxes show the cases with the possible presence of intraneural blood flow; the purple boxes indicate the frequency of cases that had either a video, a picture, or a waveform; and the green boxes demonstrate the number of validated videos. CT, carpal tunnel.
Then, among the evidenced cases (blue boxes), the frequencies of the validated absence of intraneural blood flow were presented in gray boxes, and the cases with the possible presence of intraneural blood flow were included in the yellow boxes. Among the evidenced cases that documented the presence of intraneural blood flow (gray boxes), the frequency of cases that had documented video clips, still-frame pictures, or spectral waveforms were counted and reported in the purple boxes. Of these documented video clips, pictures, and waveforms, the frequency of cases that had a validated presence of intraneural blood was counted. A validated video clip was considered the strongest evidence for the presence of blood flow and was denoted in the green boxes.
Using the fidelity and validity classifications, we examined how the inclusion or exclusion of missing or invalid cases within the same data set could affect the analysis and reporting of intraneural blood flow prevalence. Prevalence within the subject populations (i.e., DH and OT) at individual time points were calculated in two ways for the CT regions in each wrist. First, we calculated confirmed prevalence by using only validated cases that included either the documented absence of blood flow (gray boxes) or the presence of intraneural blood flow validated by high-quality video clips (green boxes). The confirmed prevalence was calculated by dividing the number of cases with validated presence by the total number of cases with either validated presence or absence of blood flow. Second, we examined assumed prevalence that used the full data set of all cases but relied on two assumptions that are often applied in research or clinical reports: (1) the missing cases (orange hexagons) were due to the sonographer observing no blood flow and documenting the lack of flow by exclusion, and (2) any evidence of possible presence (yellow boxes) assumed the sonographer observed intraneural blood flow regardless of the quality of the evidence. Using these data, the assumed prevalence of intraneural blood flow was calculated by dividing the assumed presence of blood flow (yellow boxes) by all available cases that included both evidenced and missing cases (red boxes).
Results
A total of 176 participants were enrolled in the study, including 121 DH students and 55 OT students. The demographic characteristics by group and overall are summarized in Table 1. The 2 groups of participants had similar demographic characteristics with an overall mean age of 24.6 years and mostly female (85%). No statistically significant differences were identified in the two groups of participants.
Table 1.
Demographics of the Participants (n = 176).
| DH (n = 121) | OT (n = 55) | All (n = 176) | P Value | |
|---|---|---|---|---|
| Age | 24.5 (3.6) | 24.8 (2.6) | 24.6 (3.3) | .46 |
| Gender, female | 101 (83.5) | 49 (89.1) | 150 (85.2) | .33 |
| Race | .09 | |||
| American Indian/Alaska Native | 2 (1.7) | 0 (0) | 2 (1.1) | |
| Asian | 38 (31.4) | 29 (52.7) | 67 (38.1) | |
| Black | 1 (0.8) | 0 (0) | 1 (0.6) | |
| Native Hawaiian/Pacific Islander | 2 (1.7) | 2 (3.6) | 4 (2.3) | |
| White | 57 (47.1) | 19 (34.6) | 76 (43.2) | |
| Other | 21 (17.4) | 5 (9.1) | 26 (14.8) | |
| Ethnicity, Hispanic | 34 (28.1) | 8 (14.6) | 42 (23.9) | .05 |
Abbreviations: DH, dental hygiene; OT, occupational therapy.
Given the number of participants in each group, a total of 770 observations were expected; however, there were 53 missing participant visits, resulting in a total of 717 observations for analysis (see Table 2). The flow of these 717 observations through the process of data cleaning, fidelity checks, and validity checks (see Figures 5 and 6). Through the data cleaning process, 11%–12% of observations were excluded due to the presence of a bifid median nerve or a persistent median artery on either the right or left side. Thus, after data cleaning and excluding cases that were not eligible, a total of 629 evidenced cases from the right and 638 evidenced cases from the left were expected at each anatomic location.
Table 2.
Numbers of Observations at Different Times Across the Longitudinal Study by Participant Group.
| Baseline | 5–6 months | 10–12 months | 15–16 months | 20–22 months | Total Observations | |
|---|---|---|---|---|---|---|
| DH | 121 | 117 | 114 | 109 | 96a | 557 |
| OT | 55 | NA | 52 | NA | 53 | 160 |
| Total | 176 | 117 | 166 | 109 | 149 | 717 |
Abbreviations: COVID-19, coronavirus disease; DH, dental hygiene; NA, not applicable; OT, occupational therapy.
Seventeen of the observations in the DH group were missed due to the impact of COVID-19.
The results of the fidelity check demonstrated that about 11%–17% of cases had missing evidence at the proximal CT and mid-CT, while the missing cases in the distal CT were more than double of the other regions at almost 35%. For those cases where data were present (i.e., blue boxes), it appeared that the sonographer provided data evidence meant to document the prevalence of blood flow in approximately half to three-quarters (58%–77%) of the cases across the various regions. These cases, as denoted by the yellow boxes in the flow chart, represented an estimate of the possible presence of intraneural blood flow. Among these evidenced cases that documented the presence of intraneural blood flow, about one-quarter (ranging from 16%–30%) had video clips, approximately two-thirds (ranging from 66%–70%) had still-frame pictures, and spectral waveforms existed in about two-thirds of the case files (ranging from 64%–69%).
The remaining 23%–42% of the evidenced cases clearly documented the absence of any blood flow; these cases, as denoted by the gray boxes in the flow chart, were considered validated cases for the absence of intraneural blood flow. As the strongest evidence for the presence of blood flow, only about three-fourths (72%–81%) of cases with video clips met the quality criteria; these cases, as denoted by the green boxes in the flow chart, were considered validated cases for the presence of intraneural blood flow. The distribution of 133 video clips by the reason for exclusion is shown in Table 3. The most common reason that a video clip was excluded was the lack of three or more consistent pulsatile cycles, even though the signal was located within the median nerve, and it was clearly a signal rather than a flash artifact.
Table 3.
The Excluded Reasons for Invalid Video Clips.
| Right | Left | ||||||
|---|---|---|---|---|---|---|---|
| Proximal (n= 34) | Mid (n = 29) | Distal (n = 10) | Proximal (n = 22) | Mid (n = 28) | Distal (n = 10) | Total | |
| No signal within nerve | 12 (35.3) | 5 (17.2) | 1 (10.0) | 9 (40.9) | 5 (17.9) | 3 (30.0) | 35 (26.4) |
| Flash artifacts | 0 (0) | 1 (3.5) | 0 (0) | 0 (0) | 1 (3.6) | 0 (0) | 2 (1.5) |
| Less than three pulsatile cycles | 22 (64.7) | 23 (79.3) | 9 (90.0) | 13 (59.1) | 22 (78.6) | 7 (70.0) | 96 (72.2) |
Similar to the findings of the video quality check, about three-quarters (63%–81%) of the spectral waveforms were identified as valid at the proximal and mid-CT, with only about half (46%–55%) identified as valid at distal CT. Across all regions, a total of 1477 cases had spectral waveform data, of which 465 (31%) cases did not have at least 1 valid waveform. Since for each case, there was sometimes more than one waveform within an anatomic region, a larger number of waveforms were evaluated than eligible cases. The distribution of invalid waveforms by exclusion reason across the anatomic regions is shown in Table 4. About a quarter (26.2%) of the waveforms were excluded due to the lack of consistent blood flow signals across at least 3 cycles. A more common cause for excluding a blood flow waveform was that the blood flow signal was too weak to differentiate the blood signal from the background noise, which accounted for almost two-thirds of the invalid waveforms (61.3%).
Table 4.
The Excluded Reasons for Invalid Waveforms.
| Right | Left | ||||||
|---|---|---|---|---|---|---|---|
| Proximal (n = 66) | Mid (n = 101) | Distal (n = 80) | Proximal (n = 60) | Mid (n = 127) | Distal (n = 93) | Total | |
| Gate not within the nerve | 27 (40.9%) | 7 (6.9%) | 4 (5.0%) | 16 (26.7%) | 4 (3.1%) | 8 (8.6%) | 66 (12.5%) |
| More noise than signal | 21 (31.8%) | 59 (58.4%) | 62 (77.5%) | 24 (40.0%) | 85 (66.9%) | 72 (77.4%) | 323 (61.3%) |
| Less than three pulsatile cycles | 18 (27.3%) | 35 (34.7%) | 14 (17.5%) | 20 (33.3%) | 38 (29.9%) | 13 (14.0%) | 138 (26.2%) |
A descriptive comparison of the assumed prevalence of intraneural blood flow based on cases with any evidence of such within the full data set compared with the confirmed prevalence among only the validated case, within the partial data set is depicted in Figure 7. When comparing the right and left sides within the assumed and confirmed data sets (i.e., A vs. B, and C vs. D), there were only a few small differences in prevalence between the sides, which primarily occurred in the prevalence metrics in the distal CT of the DH group. When comparing between assumed and confirmed prevalence within a side (i.e., A vs. C and B vs. D), numerous differences were noted. Of note, the prevalence values among assumed cases tended to fall within a narrow range (i.e., primarily between 20% and 40%), whereas prevalence across all groups, times, and locations was more widespread among validated cases (i.e., falling between 5% and 75%). These differences were even noted within specific sub-sets of data, with the largest occurring across the baseline measures in the OT group where prevalence among validated cases ranged from 60%–78% compared with only 22%–25% in the assumed data.
Figure 7.
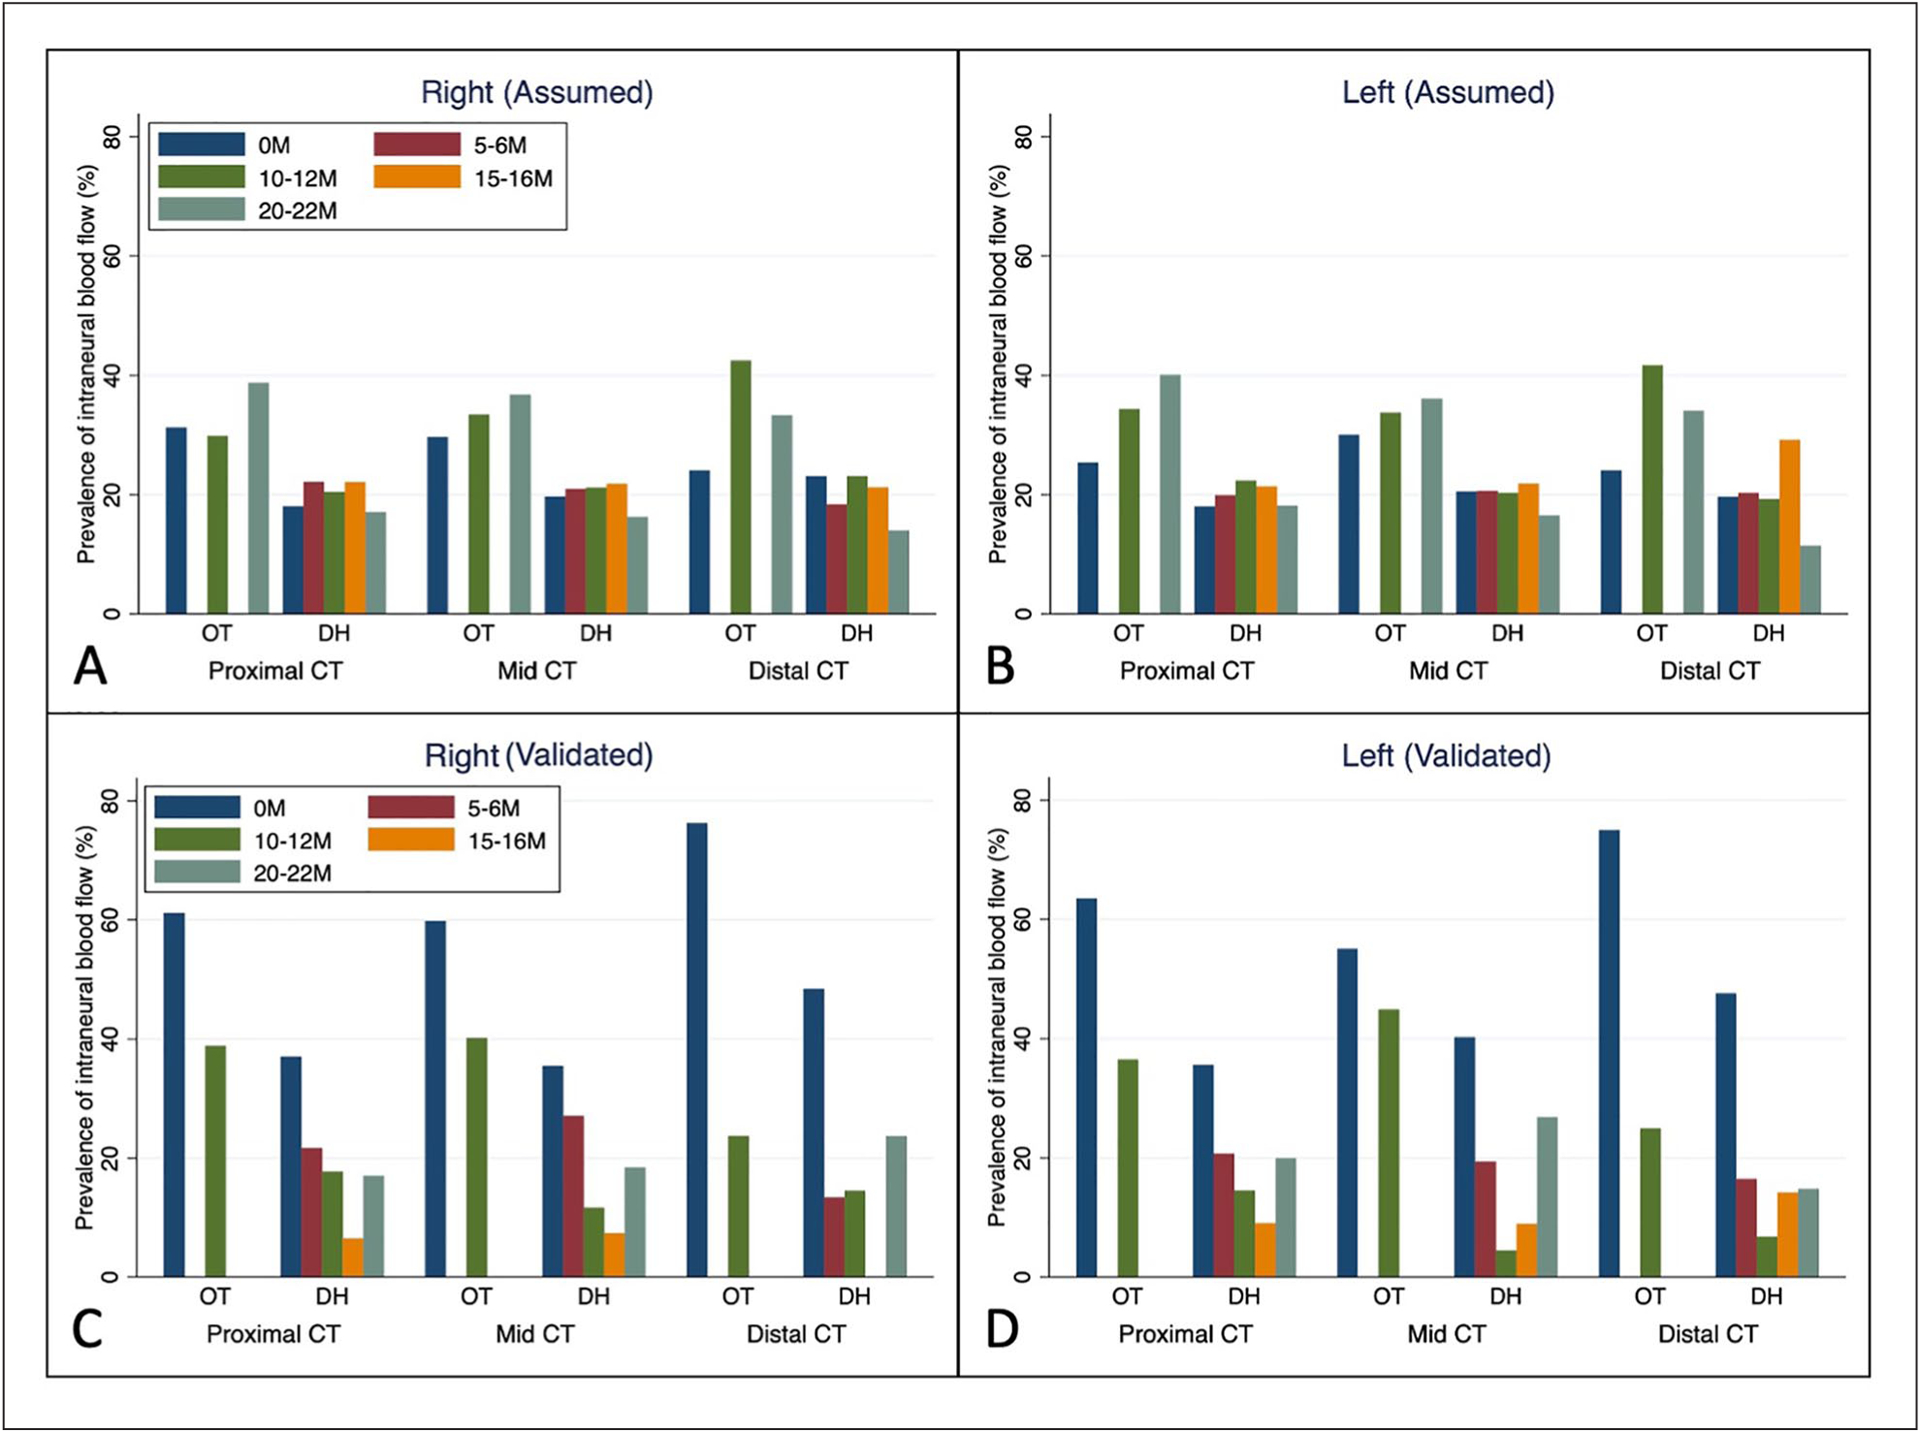
Estimated prevalence of intraneural blood flow in different regions of the CT across time from baseline (0M) to 22 months (22M) within the two participant groups by wrist based on assumed prevalence using all cases (A and B) and confirmed prevalence using only validated cases (C and D). CT, carpal tunnel; DH, dental hygiene; OT, occupational therapy.
The trends of intraneural blood flow prevalence across time were compared between the full data set and the partial, validated data set to determine if there would be a difference in mixed-effect model outcomes for change of intraneural blood flow over time. As can be seen in Figure 7, the trends of intraneural blood flow were different, which would result in different findings depending on which data were used in a comparative or predictive analysis. Within the assumed data (i.e., A and B), the percentage of participants who demonstrated the presence of intraneural blood flow increased over time for OT students while remaining similar with a potential slight decrease at the final time point for DH students. Alternatively, the trends over time were different within the validated data (i.e., C and D). Within the OT students, the percentage of participants with the validated presence of intraneural blood flow decreased over time, whereas, for DH students, the percentage of individuals with intraneural blood flow generally decreased until the third visit and then increased to the last visit.
Discussion
This study examined the implementation of a Doppler imaging protocol assessing the intraneural blood flow of the median nerve from proximal CT to distal CT. In a longitudinal study with 717 observations, a large percentage of cases had missing evidence, ranging from 11%–35% across proximal CT, mid-CT, and distal CT. The missing evidence case percentage at the distal CT almost doubled the number at the proximal and mid-CT. Of the evidenced cases with the presence of intraneural blood flow, only a quarter of them had the strongest evidence of a power Doppler video clip, of which only three-quarters were valid. There were apparent differences in the trends of the confirmed prevalence and the assumed prevalence of intraneural blood flow between the two methods, with one method using a partial data set with only validated cases and another method using a full data set with all cases.
Several issues were identified regarding the fidelity and validity of the data when auditing and analyzing the sonographic images of this study. Of all the cases across the longitudinal study, about 11%–17% of cases had missing evidence at the proximal CT and mid-CT, while almost 35% of the cases had missing evidence at distal CT. A higher number of missing data were observed at the distal CT, nearly twice the amount found at the proximal CT and mid-CT. The absence of a specified procedure for when median nerve intraneural blood flow was not detected in the protocol may have contributed to the large percentage of missing observations. It is recommended that sonographers be instructed to save a power Doppler image displaying the lack of intraneural blood flow when median nerve intraneural blood flow is not detected. Additionally, sonographers should be encouraged to conduct evaluations sequentially to include distal CT in their sonographic imaging.
In addition to incomplete data, another primary concern was the small number of cases that had valid data to confirm that the flow was present. Specifically, only one-quarter of the cases included a video, of which only three-quarters were valid. Additionally, only half of the spectral Doppler waveforms met the quality criteria to be useful in image analysis. Many of the video clips and the waveforms were excluded because they did not show at least three consistent cycles. Valid videos and waveforms are important because when retrospectively analyzing the images, a qualified video or waveform with clear signals and more than three consistent cycles is helpful for identifying the pixels in the power Doppler images and the peak systolic velocity in the waveform. Using invalid videos or waveforms undermines the accuracy of the image analysis. This indicates the importance of a clear protocol to guide sonographers to obtain high-quality images.
Despite the limited valid data set, the results of this study provide some useful insights into differences in the vascularization of the median nerve at different locations. In our validated sample, the proximal CT and mid-CT had an average prevalence of intraneural blood flow of 40% and 38%, while the mean prevalence for the distal CT was 18% across all 5 time points. Previous studies have mainly examined the mid-CT and the proximal CT; rarely was the distal CT examined in the literature.6 For example, Dejaco et al. found that 7 wrists (18%) out of 40 had intraneural blood flow at the proximal CT (CT inlet at the proximal margin of the flexor retinaculum) and the mid-CT (at the level of scaphoid and pisiform bone).6 There are also studies that reported the results of intraneural blood flow without a clear description of the targeted imaging location (e.g., only described as the wrist area).17
Although there has not been a recommended location for the examination of intraneural blood flow in the literature, the findings in this study illuminate a potential need for a comprehensive examination of the median nerve including the proximal CT, mid-CT, and distal CT, as the estimation for mid-CT is not necessarily representative of all three locations. Furthermore, there might be a value of combining all three locations, which might be more indicative of the median nerve physiological or pathological status. Future studies could examine the correlations of median nerve intraneural blood flow at different locations and their associations with median nerve physiology or pathology.
This work demonstrated the discrepancy in the trends of the confirmed prevalence of intraneural blood flow using the partial data set with only validated cases and the assumed prevalence of intraneural blood flow using the full data set with all cases. This discrepancy in the two methods demonstrates the importance of amending the current protocol to guide the operators to complete the examination for the entire region to reduce missing cases. More importantly, the protocol should be clearer on the validity criteria for the recorded videos or waveforms, so that the operators could document images and videos that meet the strict quality standards. Future studies aiming to determine the longitudinal trend of intraneural blood flow should follow a high-quality, standardized imaging protocol to avoid similar issues.
Based on the implication of this study, the imaging protocol used in this study was modified. The modified imaging protocol aims to provide detailed instructions for sonography operators to obtain intraneural blood flow information of the median nerve at the wrist area in a standardized and rigorous way. First, if a blood signal is identified in power Doppler, it is recommended to save a video clip for at least three consecutive pulsatile signals of the blood flow. Second, if a blood flow signal is identified in the mode of power Doppler, it is always recommended to also perform spectral Doppler at the same position. If no blood flow spectral waveform could be identified, still, an image with a flat waveform should be saved to demonstrate the fact that no blood flow could be identified at that position. Similarly, if the sonographer does not see any blood flow signals at either of the examination location, then an image should be saved at that position to demonstrate the fact that no blood flow could be found at that position. It is important to record the findings of median nerve blood flow correctly and fully, including the presence and the absence of the blood flow, throughout the examination process. With these instructions to improve the protocol, hopefully, future studies that adopted such protocol could obtain a data set with less missing data points.
Limitations
As a retrospective study, this work is constrained by the unavailability of information on variability among the sonographers, making it impossible to assess the fidelity and validity of the data collection at this level. Despite the limitation, this study underscores the significance of developing a standardized protocol to guide the sonographic acquisition of Doppler images to examine intraneural blood flow of the median nerve at the wrist area. As the first study to adopt this imaging protocol, it was important to have identified and discussed several limitations and potential sources of error, such as a high percentage of missing data points and invalid images.
Conclusion
By incorporating the suggested amendments to the current imaging protocol based on this audit of the collected images, a more effective imaging protocol can be developed to assist future studies in rigorously assessing intraneural blood flow in healthy populations.
The findings of this study have implications not only for researchers but also for sonographers involved in routine clinical health care and the field of Doppler sonography. These results underscore the significance of employing a standardized Doppler image acquisition method to ensure accurate and reliable outcomes. Given the expanding diagnostic role of Doppler sonography in CT syndrome, the incorporation of the recommended amendments from this study into a standardized protocol holds potential benefits for health care practitioners in improving the diagnostic accuracy of CT syndrome.
Funding
The authors disclosed receipt of the following financial support for the research, authorship, and/or publication of this article: This study was funded by grant number R01 OH010665 from the Centers for Disease Control (CDC), National Institute for Occupational Safety and Health. The content is solely the responsibility of the authors and does not necessarily represent the official views of the CDC.
Footnotes
Declaration of Conflicting Interests
The authors declared no potential conflicts of interest with respect to the research, authorship, and/or publication of this article.
Ethical Approval
Ethical approval for this study was obtained from the University of Southern California’s institutional review board (IRB #HS-15–00004).
Informed Consent
Written informed consent was obtained from all participants.
Animal Welfare
Guidelines for humane animal treatment did not apply to this study because no animals were used.
References
- 1.Issar T, Walker S, Arnold R, Poynten AM, Endre ZH, Krishnan AV: Peripheral nerve morphology and intraneural blood flow in chronic kidney disease with and without diabetes. Muscle Nerve. 2022;65(5):603–607. doi: 10.1002/mus.27513 [DOI] [PMC free article] [PubMed] [Google Scholar]
- 2.Gamil AM, Shalaby MH, Shehata KA, El Deeb AM: Value of grayscale and power Doppler high-resolution ultrasound in assessment of patients with clinically suspected carpal tunnel syndrome. J Ultrasound Med. 2020;39(6):1155–1162. doi: 10.1002/jum.15200 [DOI] [PubMed] [Google Scholar]
- 3.Ghasemi-Esfe AR, Khalilzadeh O, Vaziri-Bozorg SM, et al. : Color and power Doppler U.S. for diagnosing carpal tunnel syndrome and determining its severity: a quantitative image processing method. Radiology. 2011;261(2):499–506. doi: 10.1148/radiol.11110150 [DOI] [PubMed] [Google Scholar]
- 4.Lin TY, Chang KV, Wu WT, Özçakar L: Ultrasonography for the diagnosis of carpal tunnel syndrome: an umbrella review. J Neurol. 2022;269(9):4663–4675. doi: 10.1007/s00415-022-11201-z [DOI] [PubMed] [Google Scholar]
- 5.Borire AA, Visser LH, Padua L, et al. : Utility of maximum perfusion intensity as an ultrasonographic marker of intraneural blood flow. Muscle Nerve. 2017;55(1):77–83. doi: 10.1002/mus.25200 [DOI] [PubMed] [Google Scholar]
- 6.Dejaco C, Stradner M, Zauner D, et al. : Ultrasound for diagnosis of carpal tunnel syndrome: comparison of different methods to determine median nerve volume and value of power Doppler sonography. Ann Rheum Dis. 2013;72(12):1934–1939. doi: 10.1136/annrheumdis-2012-202328 [DOI] [PubMed] [Google Scholar]
- 7.Evans KD, Volz KR, Pargeon RL, Fout LT, Buford J, Roll SC: Use of contrast-enhanced sonography to investigate intraneural vascularity in a cohort of Macaca fascicularis with suspected median mononeuropathy. J Ultrasound Med. 2014;33(1):103–109. doi: 10.7863/ultra.33.1.103 [DOI] [PMC free article] [PubMed] [Google Scholar]
- 8.Kutlar N, Bayrak AO, Bayrak İK, Canbaz S, Türker H: Diagnosing carpal tunnel syndrome with Doppler ultrasonography: a comparison of ultrasonographic measurements and electrophysiological severity. Neurol Res. 2017;39(2):126–132. doi: 10.1080/01616412.2016.1275455 [DOI] [PubMed] [Google Scholar]
- 9.Vanderschueren GA, Meys VE, Beekman R: Doppler sonography for the diagnosis of carpal tunnel syndrome: a critical review. Muscle Nerve. 2014;50(2):159–163. doi: 10.1002/mus.24241 [DOI] [PubMed] [Google Scholar]
- 10.Akcar N, Ozkan S, Mehmetoglu O, Calisir C, Adapinar B: Value of power Doppler and gray-scale U.S. in the diagnosis of carpal tunnel syndrome: contribution of cross-sectional area just before the tunnel inlet as compared with the cross-sectional area at the tunnel. Korean J Radiol. 2010;11(6):632–639. doi: 10.3348/kjr.2010.11.6.632 [DOI] [PMC free article] [PubMed] [Google Scholar]
- 11.Joy V, Therimadasamy AK, Chan YC, Wilder-Smith EP: Combined Doppler and B-mode sonography in carpal tunnel syndrome. J Neurol Sci. 2011;308(1–2):16–20. doi: 10.1016/j.jns.2011.06.042 [DOI] [PubMed] [Google Scholar]
- 12.White BR, Ho DY, Rogers LS, Natarajan SS: A standardized imaging protocol improves quality and reduces practice variability in echocardiographic assessment of ventricular function by first-year pediatric cardiology fellows. Echocardiography. 2019;36(8):1515–1523. doi: 10.1111/echo.14441 [DOI] [PMC free article] [PubMed] [Google Scholar]
- 13.Mohammadi A, Ghasemi-Rad M, Mladkova-Suchy N, Ansari S: Correlation between the severity of carpal tunnel syndrome and color Doppler sonography findings. AJR Am J Roentgenol. 2012;198(2):W181–W184. doi: 10.2214/AJR.11.7012 [DOI] [PubMed] [Google Scholar]
- 14.Cartwright MS, White DL, Demar S, et al. : Median nerve changes following steroid injection for carpal tunnel syndrome. Muscle Nerve. 2011;44(1):25–29. doi: 10.1002/mus.22067 [DOI] [PMC free article] [PubMed] [Google Scholar]
- 15.Ehmke S, Farias Zuniga A, Keir PJ: Effect of force, posture, and repetitive wrist motion on intraneural blood flow in the median nerve. J Ultrasound Med. 2021;40(5):939–950. doi: 10.1002/jum.15467 [DOI] [PubMed] [Google Scholar]
- 16.Yildiran G, Seher N, Sutcu M, Nayman A, Akdag O, Tosun Z: Median nerve’s microcirculation in carpal tunnel syndrome: superb microvascular imaging. Plast Reconstr Surg. 2021;147(6):1355–1360. doi: 10.1097/PRS.0000000000007940 [DOI] [PubMed] [Google Scholar]
- 17.Houben MPWA, Maars M, Beekman R: High prevalence of increased nerve vascularization in healthy individuals. Muscle Nerve. 2015;51(6):938–939. doi: 10.1002/mus.24655 [DOI] [PubMed] [Google Scholar]


