

Abstract

o-Phenylenediamine (OPD) is commonly used as a reliable signaling agent for colorimetric assays via oxidative dimerization to 2,3-diaminophenazine (DAP) (λmax = 425 nm), which is catalyzed by conventional horseradish peroxidase (HRP) or its nanoparticle mimics. Recently, it has been reported that catalytic and electrochemical oxidation of OPD produces a mixture of polymerized OPD molecules (polyOPDs), which could potentially affect the colorimetric signal due to the difference in optical properties between DAP and polyOPDs. In our study, we present for the first time that the gold nanoparticle-catalyzed oxidation of OPD could exhibit nonmonotonic extinction transitions at 425 nm. Using various spectroscopic and microscopic techniques such as UV–vis spectroscopy, transmission electron microscopy, dynamic light scattering (DLS), and Fourier transform infrared (FT-IR) spectroscopy, we verify that the production of polyOPDs is specifically responsible for the unexpected decrease in extinction at 425 nm. This discovery presents a potential challenge to the conventionally accepted role of OPD as a signaling agent. Furthermore, we find that the modification of reaction variables, including reactant concentrations, anion types, and temperature, determines how nonmonotonic the extinction transition could be. Lastly, we develop an OPD-based colorimetric DNA detection scheme using DNA-functionalized gold nanoparticles to demonstrate the potential problems in accurately quantifying the target. Our proposal of using NaNO3 instead of NaCl to provide the desired ionic strength could be a suitable solution to overcome the obstacles of detection.
Introduction
o-Phenylenediamine (OPD) is an aromatic diamine in which the amine groups are in the ortho position.1 OPD is often used as a precursor of heterocyclic compounds whose aromatic rings exhibit distinctive physical properties such as absorption in the visible range and electrical conductivity. Based on such properties, OPD has been intensively studied for its wide applications such as colorimetric and photothermal signaling agents in biosensing systems,2−8 organic electrode material,9,10 and corrosion inhibitor.11 In particular, colorimetric quantification of specific targets has taken advantage of the color changes of OPD from colorless to yellow, where the wavelength at which the maximum absorption occurs (λmax) is 425 nm. These changes are induced by the oxidative dimerization of OPD to 2,3-diaminophenazine (DAP), catalyzed by conventional horseradish peroxidase (HRP).12,13 In a typical assay scheme, the enzymatic oxidation of OPD is designed to be quantitatively controlled by the concentration of the target, leading to kinetic and thermodynamic changes in color. Recently, catalytic nanoparticles, or nanozymes, have emerged as a replacement for HRP due to their versatile surface chemistry, controllable catalytic activity, high stability, recyclability, ease of mass production, and low cost, all of which are highly attractive for precise and practical applications.14−17 To date, nanoparticles made of a variety of noble metals such as Au, Ag, Pt, Pd, and Cu have been demonstrated for the quantitative catalytic oxidation of OPD, thus becoming a classic part of the strategies for colorimetric detection.18−22
Despite the widespread use of OPD in combination with catalytic nanoparticles, its chemical mechanism of oxidation has not been carefully evaluated until recently.23 In fact, the products of nanoparticle-induced OPD oxidation have been spectroscopically determined to be a mixture of polymers (polyOPDs) with different oxidation states and different degrees of polymerization.9,23 Interestingly, this result contradicts the conventional view that the nanoparticle-catalyzed oxidation product of OPD is solely DAP, which is responsible for the yellow color with absorption at 425 nm.12,13,23 However, unlike DAP, polyOPDs rarely have a specific absorption band in the entire visible range, appearing almost colorless with the concentration-dependent minor scattering.9,24−26 Importantly, we speculate that this complexity of the products would lead to nonmonotonic, arbitrary changes in absorbance at 425 nm during the oxidation process, which would be particularly a significant problem for target quantification in detection schemes. In addition, polyOPDs are observed to coat the surface of the nanoparticles during the oxidation process, which may interfere with their catalytic properties.23 These recent studies inspired us to raise serious questions about the role of OPD as a signaling agent in the context of nanoparticle-catalyzed OPD oxidation. To the best of our knowledge, however, such anomalous and arbitrary absorption changes have not been clearly reported in association with the catalytic oxidation of OPD. Moreover, such unexpected absorbance changes, if they exist, need to be thoroughly investigated in terms of the causal reaction conditions in combination with the reaction kinetics.
Herein, we report for the first time the nonmonotonic extinction transition during the oxidation of OPD as a result of its simultaneous dimerization and polymerization. Key reaction conditions responsible for the anomaly were kinetically investigated. Based on the analysis, an overview of nanoparticle-catalyzed OPD oxidation is provided.
Results and Discussion
We began the investigation by analyzing the spectral properties of the two potential products resulting from the OPD oxidation: DAP and polyOPDs. Figure 1A illustrates the UV–vis spectra of OPD, DAP, and polyOPDs. The spectrum of OPD was observed to be almost flat near the x-axis in the visible range because it is colorless and transparent. The absorption of DAP was observed to be the largest at 425 nm but gradually decreased to nearly 0 as the wavelength increased. On the other hand, polyOPDs did not exhibit any local maximum in extinction (=absorption + scattering),27 and its extinction gradually decreased as the wavelength increased. Even at a longer wavelength (∼700 nm), however, polyOPDs still exhibited a certain degree of extinction, which is a common characteristic of polymeric materials owing to their scattering. After the spectral analysis of OPD, DAP, and polyOPDs, we investigated the catalytic oxidation kinetics of OPD by monitoring the extinction at 425 nm.28 Gold nanoparticles (AuNPs) were used as catalysts. A typical reaction condition was selected from multiple references, including the [OPD], [AuNP], and H2O2 concentrations at 2 mM, 1 nM, and 9 wt %, respectively.6,23,29−31 For protection under oxidative conditions, the AuNPs were coated with thiolated DNA (DNA-AuNPs) before they were used as catalysts.32 As the oxidation of OPD proceeded, the extinction at 425 nm significantly increased by 20 min, indicating the production of DAP (Figure 1B, black curve). Even though the slope gradually decreased after 20 min, the extinction continued to increase, which was the typical monotonic curve as previously reported.2,3,6,23,33−35 In the presence of NaCl (0.5 M), however, the optical properties of the reaction mixture changed in a different manner (Figure 1B, red curve). The extinction increased at a slower pace for the first 27 min (phase 1) and then declined abruptly for 11 min (phase 2). After this intermediate decline, the extinction slowly increased again, with a slope similar to that of the curve obtained without NaCl (phase 3). Owing to the consecutive changes in slope, two stationary points (Figure 1B, blue and cyan circles) were observed when the phases shifted. Importantly, this result is the first observation of a nonmonotonic kinetic transition in extinction during the nanoparticle-catalyzed oxidation of OPD, which is similarly obtained with NaF and NaBr (Figure S1, Supporting Information). Previously, the decrease in fluorescent signal intensity of DAP owing to its polymerization was reported.8 This finding raises questions about the quantitative use of OPD as a signaling agent in bioanalysis. To understand the sudden decrease in extinction, we analyzed the UV–vis spectra of OPD during its oxidation in each phase. In phase 1, the extinction at 425 nm increased as predicted, while the plasmon absorption band centered around 525 nm, which is based on the localized surface plasmon resonance (LSPR) of the DNA-AuNPs, remained intact (Figure 1C). This finding suggests that the DNA-AuNPs were almost uniformly dispersed without aggregation during the OPD oxidation, most likely owing to the effective protection of DNA against highly reactive H2O2. In phase 2, however, there was a decrease at 425 nm, and a parallel increase in extinction over 600 nm was also observed (Figure 1D). We reasoned that the concentration of DAP decreased due to its polymerization into polyOPDs and that the scattering of polyOPDs resulted in the parallel increase of longer wavelengths (>600 nm).9,24−26 While the aggregation of the destabilized DNA-AuNPs could have caused red shifts of the plasmon absorption band, they were not observed. Finally, in phase 3, a gradual increase in extinction was observed across the entire spectral range (350 and 700 nm) (Figure 1E). This increase is due to the growing amount of polyOPDs and the consequently increased scattering. In contrast, the spectral analysis of the OPD oxidation without NaCl suggests that DAP, a product primarily formed due to the OPD dimerization, is the major product with negligible increases in longer wavelengths (>600 nm) (Figure 1F).
Figure 1.

(A) UV–visible spectra of polyOPDs, DAP, and OPD. The photos of polyOPD and DAP solutions are shown in the inset. (B) Time-dependent extinction transitions at 425 nm of the reaction mixtures (catalytic oxidation of OPD) without NaCl and with 0.5 M NaCl. P1, P2, and P3 denote phases 1, 2, and 3, respectively. The first and second stationary points (SPs) of the extinction transition curves are marked on the extinction transition curve. The reaction mixtures at the beginning of the reaction (T0) and at the end of each phase 1 (P1), phase 2 (P2), and phase 3 (P3) are shown in the inset. Note that T0 appears pale red owing to the presence of the DNA-AuNPs. (C–F) UV–visible spectral changes of the reaction mixtures with 0.5 M NaCl in (C) phase 1, (D) phase 2, (E) phase 3, and (F) without NaCl as the reaction proceeded. Rxn. Time is an abbreviation for the reaction time.
The transmission electron microscopy (TEM) analysis confirmed the spectral speculation of the oxidation products. The analysis addressed two issues: the presence of polyOPDs with and without NaCl in each phase and the morphological association of polyOPDs with the DNA-AuNP catalysts. When NaCl was absent, polyOPDs were rarely observed regardless of the phase (phases 1, 2, and 3) (Figure 2A). This observation aligns with the UV–vis spectra presented in Figure 1F, demonstrating a greater prevalence of the dimerization of the OPD into DAP than the polymerization into polyOPDs in the absence of NaCl. Furthermore, the TEM images show that the DNA-AuNPs form an almost uniform monolayer on the grid, suggesting their stability and even dispersion throughout the entire reaction process. This stability is likely due to the presence of the protective DNA on the AuNP surfaces, which helped to maintain consistent reaction conditions. In the presence of NaCl, only dispersed DNA-AuNPs were observed until the completion of phase 1 (Figure 2B). When magnified, however, it was noticed that the DNA-AuNPs were slightly coated with an organic layer. Such “local” polymerization suggests that the OPD polymerization is closely linked to the catalytic properties of the DNA-AuNPs. As the reaction proceeded, polyOPDs became more visible in phase 2, as anticipated from the elevated scattering in the longer wavelengths of the UV–vis spectrum (Figure 1D). To confirm the chemical identity of polyOPDs in comparison to monomeric OPD, the analysis of its Fourier transform infrared (FT-IR) spectrum was conducted. Characteristic peaks corresponding to the unique molecular structures of OPD and polyOPDs were identified (Figure S2, Supporting Information). The peaks observed at 3386 and 3183, 1633, 1590, 1500, and 1152 cm–1 in the FT-IR spectrum of OPD correspond to N–H stretching vibrations, N–H deformation vibrations of amine, C–N stretching vibrations, C–C symmetric stretching vibrations and aromatic and plane C–H deformation vibrations of 1,2-disubstitution of benzene ring, respectively.36−38 In comparison, the peaks observed at 1630, 1530, 1369, and 1243 cm–1 with polyOPDs are due to C=C stretching vibrations of quinoid and benzoid rings and C–N stretching vibrations of quinoid and benzoid imine units, respectively. The broader and overlapping nature of the peaks in the spectrum is attributed to the polymeric molecular structure of polyOPD, which contrasts sharply with the distinct peaks of monomeric OPD. The observation of such “global” polymerization is supported by the autocatalysis of the OPD oxidation process and the synergistic effect of hydrogen bonding and π–π stacking on the surface of the DNA-AuNPs coated with polyOPDs, resulting in their thickening.23 Phase 3 shows the growth of the composites of the DNA-AuNPs and polyOPDs into larger domains, as evidenced by the increased scattering of the UV–vis spectrum (Figure 1E). Notably, polyOPDs predominantly formed composites with the DNA-AuNPs, and regions lacking the DNA-AuNPs were barely observed (Figure S3, Supporting Information). To examine that the local and global polymerization of OPD took place overall in the entire reaction mixture, the size distribution of polyOPDs was obtained as a function of the reaction time using dynamic light scattering (DLS) (Figure S4, Supporting Information). As observed using TEM, the average size increase of polyOPDs was more dramatic in the presence of NaCl, indicating that NaCl is the critical determinant for the polymerization of OPD. The observation of OPD with electron microscopy provides evidence for the OPD polymerization in relation to the reaction time and the presence of NaCl. This result supports the nonmonotonic extinction transition observed through UV–vis spectral analysis.
Figure 2.
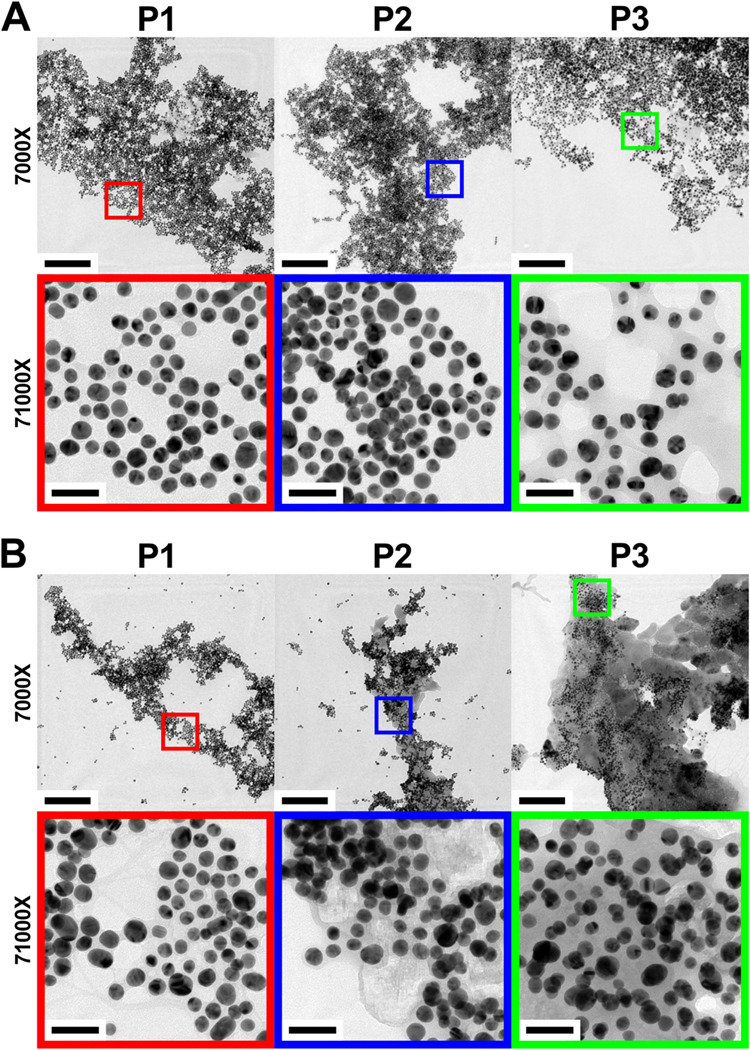
TEM images of DNA-AuNPs and polyOPDs under the conditions (A) without NaCl and (B) with 0.5 M NaCl at the end of phase 1 (P1), phase 2 (P2), and phase 3 (P3), respectively. The 71 000× images are obtained by magnifying the color box-designated area of the 7000× images. All scale bars are 500 nm in the 7000× images and 50 nm in the 71 000× images.
We investigated reaction conditions to control the nonmonotonic extinction transition of catalytic OPD oxidation and their effect on oxidation kinetics. Specifically, we analyzed the initial slope of the extinction transition curve and the two stationary points before and after the abrupt drop in extinction, which were examined as a function of the concentrations of H2O2, OPD, and NaCl. We also investigated how the reaction temperature and the type of the coexisting ions impacted the oxidation reactions. Increasing the concentrations of H2O2 and OPD resulted in higher initial slopes of the time-dependent extinction transition curves (Figures 3A,B and S5A,B). The first and second stationary points were observed earlier due to the increased reactant concentrations, which indicates an increase in the overall reaction kinetics involving the OPD polymerization. It is noteworthy that, at lower [OPD]s (0.05, 0.1, and 0.3 mM), the extinction transition curves were monotonic without any intermediate drop, indicating that a certain level of [OPD] was necessary for the initiation of OPD polymerization. The catalytic reaction became faster at higher temperatures due to the increased production of hydroxyl radicals (Figures 3C and S5C),39 whose Arrhenius plot demonstrated an excellent linear correlation between the natural logarithm of the initial slope and the reciprocal of the temperature (Figure S6, Supporting Information; R2 = 0.96). The increase in temperature caused a higher reaction rate, leading to larger stationary points. This indicates a slower initiation of the polymerization process. The dimerization and polymerization of OPD demonstrate an inverse correlation that is dependent on temperature. This may be due to their competition under specific conditions with limited amounts of reactants. Note that two additional stability points were observed at 30 °C during the transition from lower to higher temperatures. Finally, the effect of coexisting salts, including their concentrations and types, on the oxidation of OPD was investigated. As observed in Figure 1B, NaCl is expected to slow down the dimerization of OPD into DAP, while promoting the polymerization of OPD and DAP into polyOPDs, whose dependence on [NaCl] is demonstrated in Figure 3D (Figure S5D, Supporting Information). For instance, the polymerization was not observed below a NaCl concentration of 0.15 M. Furthermore, the initial slope markedly dropped from 0.45 to 0.19 min–1 as the [NaCl] increased from 0 to 0.15 M NaCl. As the [NaCl] increased from 0.15 M, the initial slope decreased more slowly from 0.19 min–1, while the polymerization that occurred at 70 min began to take place earlier. The role of NaCl in the OPD polymerization is comparable to the Cl–-boosted aniline polymerization; as observed in the latter, a high ionic strength supports radical cation coupling of monomers even without catalysts.40,41 As the precise contribution of Cl– to the catalytic oxidation of OPD is yet to be fully understood, we broadened our focus to include a range of alkali metal chlorides including LiCl, KCl, RbCl, and CsCl. We also examined inorganic, organic, and polymeric non-halide anions such as nitrate (NO3–), sulfate (SO42–), acetate (CH3COO–), and poly(4-styrenesulfonate) (PSS–) ions to determine their potential effects. The cation type exhibited minimal alterations in the initial slopes (Figure 3E) and two stationary points (Figure 3F), potentially indicating the limited involvement of alkali metal ions as spectators in polymerization (Figure S5E, Supporting Information). When the non-halide anions substituted for Cl– of NaCl, however, the initial slopes (3.8, 4.0, 4.2, and 4.7 times with PSS–, CH3COO–, SO42–, and NO3–, respectively) increased significantly. Moreover, nitrate (NO3–) and sulfate (SO42–) ions also increased the time to polymerization (i.e., two stationary points). As observed with temperatures, this inverse correlation could indicate the competition between the reaction rates of the OPD dimerization and polymerization, where the hydroxyl radical initially avoids reacting with highly stable anions such as nitrate, sulfate, and PSS– but rather reacts with OPD for its dimerization.
Figure 3.

Initial slopes and the first and second stationary points (SPs) of the extinction transition curves as a function of each experimental parameter: (A) H2O2 concentration, (B) [OPD], (C) temperature, (D) [NaCl], and (E, F) type of salt. In (A) to (D), the left-hand side y-axis represents the initial slope and the right-hand side y-axis represents the stationary point. The yellow boxes in (B), (D), and (F) indicate the conditions where the SPs are not determined. Note that during the temperature control (C), the third (blue circle) and fourth (cyan circle) stationary points were additionally obtained at 30 °C. (E) The blue dashed line shows the initial slope of the extinction transition curve obtained without any salt; the green dashed line shows the average initial slope of the extinction transition curves obtained in the presence of the alkali chlorides. Note that Ac– stands for acetate anion.
Based on our thorough investigation of DNA-AuNP-catalyzed oxidation under various reaction conditions, we designed a new exemplary DNA detection scheme utilizing the use of OPD as a signaling agent. Crucially, we demonstrated what should be carefully considered to obtain quantitative correlations between [target DNA] and signal intensity and to avoid the possible nonmonotonic extinction transition of OPD. The detection method utilized in this study is based on the concept that the total exposed surface area of the probe DNA-AuNPs is inversely correlated with the [target DNA] and the degree of aggregation involved, resulting in the delayed color change from colorless to yellow (Scheme 1). To begin, we hybridized two types of probe DNA-AuNPs with target DNA at various molar concentrations ranging from 1 to 50 nM ([NaCl] = 0.5 M). Specifically, we monitored the hybridization of the DNA-AuNP probes and target DNA at 525 nm by using UV–vis spectroscopy over time. Our results suggested that approximately 3 h was an appropriate reaction time to complete the assembly of the DNA-AuNPs (Figure S7A, Supporting Information). The assembled DNA-AuNPs exhibited optical properties that indicated a proportional degree of assembly formation to [target DNA]. This was evidenced by a gradual red shift of the plasmon absorption band and a decrease in maximum extinction in the visible range (Figure S7B, Supporting Information). Additionally, we used DLS to confirm the increase in the average size distribution of the DNA-AuNP assemblies with z-averages that ranged from 30 to 6300 nm as the level of [target DNA] increased (Figure 4A). To improve the limit of detection (LOD) estimated from Figure S7 (ca. 10–15 nM; Supporting Information), we then combined these hybridized DNA-AuNPs with OPD and H2O2 for analysis (see the Experimental Section). To maintain the duplex of the DNA-AuNPs and target DNA strands, the whole process was performed at a specific ionic strength using NaCl ([NaCl] = 0.5 M). After obtaining the kinetic transitions of the reaction mixtures (Figure S8A, Supporting Information), we quantitatively analyzed their initial slopes and two stationary points as a function of the [target DNA] (Figure 4B). With the increase in [target DNA], the reaction rate decreased, evident from the decrease in slope and increment in stationary points. This outcome aligns well with the overall size distribution of the DNA-AuNP assemblies and their expected total surface area, as shown in Figure 4A. While the [target DNA] could be quantified in terms of the initial reaction slope, the absorbance of DAP at a specific reaction time may be a more useful measure because it is more intuitive based on the one-time observation, possibly using bare eyes. To evaluate this hypothesis, we obtained the extinction of the reaction mixture with the target DNA (0–10 nM) at 425 nm at each reaction time from 10 to 110 min and correlated it with the [target DNA] to analyze the possibility of quantification (Figure 4C). In the early stages (10 and 20 min), an inverse correlation was clearly observed between the extinction at 425 nm and the [target DNA], indicating that DAP absorbance is a viable measure for quantifying the target DNA. After 30 min, however, the curves were no longer inversely linear, likely owing to the drops in absorbance at 425 nm during phases 2 and 3 (Figure S8A, Supporting Information). This observation highlights for the first time the potential quantification problem of using an OPD as a signaling agent for colorimetric detection schemes, especially if either the assay or the signal measurement is performed in such a way as to cause unexpected sudden drops in extinction owing to its unwanted polymerization. One quick solution proposed for this issue is to use NaNO3 or other non-halide salt instead of conventional NaCl to reach the desired ionic strength of the reaction mixture as demonstrated in Figure 4D (Figure S8B, Supporting Information). The LOD of the assay was estimated to be ∼1 nM. As observed in Figure 3E,F, the absence of Cl– resulted in significantly delayed drops in extinction, maintaining the linearity of the reaction system for at least 2 h, which is more than sufficient time for detection in general.
Scheme 1. Schematic Illustration of the DNA Detection Scheme Based on the Assembly-Dependent Catalytic Oxidation of OPD That Was Used as a Signaling Agent.

Figure 4.

(A) DLS analysis to obtain the z-average and (inset) the hydrodynamic diameter distribution of the DNA-AuNP aggregates as a function of [target DNA]. (B) Initial slopes and stationary points (SPs) of the extinction transition curves as a function of the [target DNA]; the left-hand side y-axis represents the initial slope, and the right-hand side y-axis represents the stationary point. (C, D) Extinction at 425 nm as a function of the [target DNA] was obtained at 10, 20, 30, 40, 50, and 110 min of the reaction time; NaCl and NaNO3 were used as the salts at 0.5 M in (C) and (D), respectively.
Conclusions
OPD has long been a preferred colorimetric signaling agent for researchers in numerous sensitive and selective detection schemes. Recently, however, the intricate chemistry of nanoparticle-catalyzed oxidation of OPD has been studied in relation to its dimerization and polymerization.9,23 Importantly, we demonstrated that commonly used NaCl could induce the unwanted polymerization of OPD in the middle of its oxidative dimerization, unexpectedly leading to a dramatic decrease in extinction at 425 nm. Several reaction parameters, such as the concentrations of H2O2, OPD, and NaCl, the reaction temperature, and the type of anion were investigated as major determinants of OPD dimerization and polymerization. Furthermore, a hybridization-based colorimetric DNA detection scheme using DNA-AuNPs was designed, which demonstrated the potential problems and proposed solutions for DNA quantification using OPD as a signaling agent. This study holds significance for the following reasons. First, the time-dependent nonmonotonic optical properties of OPD related to its uncontrolled oxidation were reported and discussed for the first time as potential obstacles to accurate quantification. Second, the thorough investigation of the oxidation conditions of OPD proposes various potential approaches to overcome such obstacles for the use of OPD as a reliable signaling agent. Lastly, this study places a strong emphasis on the accurate chemical control of the oxidation or reduction of other signaling agents such as 4-nitrophenol, 2,2′-azinobis(3-ethylbenzthiazoline-6-sulfonate) (ABTS) and 3,3′,5,5′-tetramethylbenzidine (TMB) and other catalytic nanoparticles in association with color changes, especially when such reactions involve complex formation and multiple intermediates, reaction steps and routes.18−22,42−45
Experimental Section
Materials
Gold(III) chloride trihydrate (HAuCl4·3H2O; Cat. #520918), sodium citrate tribasic dihydrate (Cat. #S4641), dithiothreitol (DTT; Cat. #43815), sodium phosphate monobasic dihydrate (Cat. #71505), sodium phosphate dibasic (Cat. #S7907), sodium chloride (NaCl; Cat. #S7653), Tween 20 (Cat. #P9416), o-phenylenediamine (OPD; Cat. #P23938), 2,3-diaminophenazine (DAP; Cat. #661376), hydrogen peroxide solution (H2O2; 30 wt % Cat. #H1009), lithium chloride (LiCl; Cat. #L9650), potassium chloride solution (KCl; Cat. #60142), rubidium chloride (RbCl; Cat. #R2252), cesium chloride (CsCl; Cat. #289329), sodium nitrate (NaNO3; Cat. #S8170), sodium sulfate (Na2SO4; Cat. #239313), sodium acetate (CH3COONa; Cat. #241245), poly(sodium 4-styrenesulfonate) (MW = 70 000; Cat. #434574), sodium fluoride (NaF; Cat. #S7920), and sodium bromide (NaBr; Cat. #S4547) were purchased from Sigma-Aldrich (St. Louis, MO). Illustra NAP-5 columns were purchased from Cytiva (Little Chalfont, U.K.). Monothiol-modified and unmodified DNA sequences such as probe 1: T10 3′ (5′ CTTTTGTTC-T10-SH 3′), probe 2: T10 5′ (5′ HS-T10-GATTTTCTTC 3′), and target DNA (5′ GAACAAAAGGAAGAAAATC 3′) were purchased from Bioneer (Daejeon, Republic of Korea).
Instrumentation
In each experiment, ultrapure water was used, which was obtained from a Direct-Q3 system (Millipore, Billerica, MA). To analyze the optical properties of o-phenylenediamine (OPD), dimerized and polymerized OPD (DAP and polyOPDs, respectively), and gold nanoparticles (AuNPs), a Cary 100 UV–vis spectrophotometer (Agilent Technologies; Santa Clara, CA) and an Agilent 8453 spectrophotometer (Agilent Technologies; Santa Clara, CA) were employed. A nanodrop 2000 spectrophotometer (Thermo Fisher Scientific, Inc.; Waltham, MA) was used to determine the concentration of DNA. For measuring the hydrodynamic diameter and ζ potential, a Zetasizer Nano ZS90 (Malvern Panalytical; Malvern, U.K.) analyzer was used. To observe the morphology and association of the DNA-AuNPs and polyOPD, transmission electron microscopy (TEM; Tecnai 20 (FEI; Hillsboro, OR)) operated at 200 kV was used.
Synthesis of AuNPs
The citrate-capped AuNPs (15 nm in diameter) were synthesized by the Turkevich-Frens method with some modifications.46 In brief, 49 mL of water was heated to 100 °C, and then aqueous solutions of HAuCl4 (1 mL, 12.7 mM) and sodium citrate (0.94 mL, 38.8 mM) were quickly added and stirred in boiling water. After 5 min, the solution changed from yellow to red, indicating the successful synthesis of the AuNPs. The AuNPs solution was cooled to 25 °C with stirring and stored in the dark until use.
Functionalization of AuNPs with Thiol-DNA (DNA-AuNPs)
The functionalization of the AuNPs began with the deprotection of the monothiol modifier of the thiolated DNA sequences. The monothiol DNA sequences were dissolved in a dithiothreitol solution (0.10 M in 170 mM phosphate buffer, pH 8.0) for 20 min for the cleavage of the protecting disulfide bond. After the deprotection, the DNA sequences were purified by using a NAP-5 column and combined with the citrate-capped AuNP solution (final [DNA] = 6 μM). The pH of the mixture solution was adjusted to 7.4 using a phosphate buffer (pH 7.4, 10 mM phosphate, 0.01 wt % Tween 20) and the [NaCl] was set to 0.15 M. The mixture solution was incubated for 12 h at 25 °C. After incubation, the mixture solution was centrifuged at 13 000 rpm for 20 min, the supernatant was removed, and the centrifuged AuNPs were redispersed in water. This washing process was repeated three times. The purified DNA-AuNPs were stored in the dark until use.
Kinetic Observation of Catalytic Oxidation of OPD
The catalytic oxidation of OPD was conducted by mixing the solutions of the DNA-AuNPs (5 nM, 500 μL), OPD (0.02 M, 250 μL), NaCl (5 M, 250 μL), Tween 20 (1 wt %, 10 μL), phosphate buffer (1 M, 250 μL; pH 7.4), and water (490 μL). Then, the mixture solution was equilibrated to the desired reaction temperature (25 °C) and combined with H2O2 (30 wt %, 750 μL). The final concentrations of DNA-AuNPs, OPD, NaCl, and H2O2 were 1 nM, 2 mM, 0.5 M, and 9 wt %, respectively. The total volume of the solution is 2.5 mL. The extinction of the mixture was monitored at 425 nm with a time interval of 1 min by using UV–vis spectroscopy. For the investigation of the reaction parameters, the final concentrations of OPD (0.05–3.5 mM), NaCl (0–0.7 M), and H2O2 (1–9 wt %); the type of salt such as NaF, NaCl, NaBr, LiCl, KCl, RbCl, CsCl, NaNO3, Na2SO4, CH3COONa, and poly(sodium 4-styrenesulfonate) (MW 70 000); and the reaction temperature (20–45 °C) were changed as required. The initial slope of the extinction transition curve was obtained from the initial 10 min of the curve. The stationary points preceding and following the sudden decrease in extinction were determined by analyzing the change in the slope sign of the extinction transition curve.
New Exemplary DNA Detection Scheme by Hybridizing DNA-Functionalized AuNPs
Two types of DNA-AuNPs (5 nM, 250 μL) having different functionalized surface DNA were combined using target DNA at concentrations ranging from 1 to 10 nM. This combination took place in a buffered solution with phosphate (10 mM), Tween 20 (0.01 wt %), and NaCl (0.5 M) or NaNO3 (0.5 M) at pH 7.4. The total volume of the solution is 1 mL. The hybridization process lasted 3 h. After the hybridization process was completed, the oxidation of OPD was catalyzed under the following conditions: OPD (2 mM), NaCl (0.5 M) or NaNO3 (0.5 M), phosphate buffer (100 mM) and H2O2 (9 wt %) in a 2.5 mL solution at pH 7.4. Note that it is necessary to maintain a constant salt concentration during mixing to prevent dehybridization of the DNA-AuNPs.
TEM Observation
The solid product of the OPD oxidation was obtained at the end of each phase. The reaction mixture was extracted (500 μL) and diluted with water (4.5 mL) to quench the reaction. The diluted mixture was then centrifuged at 13 000 rpm for 20 min, the supernatant was removed, and the centrifuged DNA-AuNPs and polyOPDs were redispersed in water. This washing procedure was repeated three times. The solution (3 μL) was then dropped onto the TEM grid and dried in a vacuum incubator for 1 day.
Acknowledgments
This work was supported by BK21 FOUR Program through the National Research Foundation of Korea (NRF) funded by the Ministry of Education (4199990514635) and by the NRF grant funded by the Ministry of Science and ICT (RS-2023-00207833 and NRF-2021R1A2C1012917). Transmission electron microscopy images were obtained from the Seoul Center of the Korea Basic Science Institute (KBSI, Republic of Korea).
Supporting Information Available
The Supporting Information is available free of charge at https://pubs.acs.org/doi/10.1021/acsomega.3c07669.
FT-IR spectra, additional TEM images, DLS analysis, additional time-dependent extinction transitions, Arrhenius plot, and UV–vis spectra (PDF)
The authors declare no competing financial interest.
Supplementary Material
References
- Li X.-G.; Huang M.-R.; Duan W.; Yang Y.-L. Novel Multifunctional Polymers from Aromatic Diamines by Oxidative Polymerizations. Chem. Rev. 2002, 102, 2925–3030. 10.1021/cr010423z. [DOI] [PubMed] [Google Scholar]
- Deng L.; Liu Q. Q.; Lei C. Y.; Zhang Y. Y.; Huang Y.; Nie Z.; Yao S. Z. Fluorometric and Colorimetric Dual-Readout Assay for Histone Demethylase Activity Based on Formaldehyde Inhibition of Ag+-Triggered Oxidation of o-Phenylenediamine. Anal. Chem. 2020, 92, 9421–9428. 10.1021/acs.analchem.0c01927. [DOI] [PubMed] [Google Scholar]
- Wang J. H.; Li H.; Cai Y. H.; Wang D. J.; Bian L.; Dong F. Q.; Yu H. L.; He Y. Direct Blue Light-Induced Autocatalytic Oxidation of o-Phenylenediamine for Highly Sensitive Visual Detection of Triaminotrinitrobenzene. Anal. Chem. 2019, 91, 6155–6161. 10.1021/acs.analchem.9b00759. [DOI] [PubMed] [Google Scholar]
- Singh S.; Tripathi P.; Kumar N.; Nara S. Colorimetric Sensing of Malathion Using Palladium-Gold Bimetallic Nanozyme. Biosens. Bioelectron. 2017, 92, 280–286. 10.1016/j.bios.2016.11.011. [DOI] [PubMed] [Google Scholar]
- Ye Q. X.; Ren S. F.; Huang H.; Duan G. G.; Liu K. M.; Liu J. B. Fluorescent and Colorimetric Sensors Based on the Oxidation of o-Phenylenediamine. ACS Omega 2020, 5, 20698–20706. 10.1021/acsomega.0c03111. [DOI] [PMC free article] [PubMed] [Google Scholar]
- Chen C. Y.; Tan Y. Z.; Hsieh P. H.; Wang C. M.; Shibata H.; Maejima K.; Wang T. Y.; Hiruta Y.; Citterio D.; Liao W. S. Metal-Free Colorimetric Detection of Pyrophosphate Ions by Inhibitive Nanozymatic Carbon Dots. ACS Sens. 2020, 5, 1314–1324. 10.1021/acssensors.9b02486. [DOI] [PubMed] [Google Scholar]
- Li Y. C.; Wang P.; Huang L.; et al. Schiff-Base Chemistry-Coupled Catechol Oxidase-Like Nanozyme Reaction as a Universal Sensing Mode for Ultrasensitive Biosensing. Anal. Chem. 2023, 95, 3769–3778. 10.1021/acs.analchem.2c04897. [DOI] [PubMed] [Google Scholar]
- Li S.; Wei Z. Y.; Xiong L.; Xu Q.; Yu L.; Xiao Y. X. In Situ Formation of o-Phenylenediamine Cascade Polymers Mediated by Metal-Organic Framework Nanozymes for Fluorescent and Photothermal Dual-Mode Assay of Acetylcholinesterase Activity. Anal. Chem. 2022, 94, 17263–17271. 10.1021/acs.analchem.2c04218. [DOI] [PubMed] [Google Scholar]
- Zhang X.; Li G. F.; Wang J. X.; Chu J.; Wang F.; Hu Z. J.; Song Z. P. Revisiting the Structure and Electrochemical Performance of Poly(o-Phenylenediamine) as an Organic Cathode Material. ACS Appl. Mater. Interfaces 2022, 14, 27968–27978. 10.1021/acsami.2c06208. [DOI] [PubMed] [Google Scholar]
- Cheng Y.; Li Y. X.; Yang L. Y.; Yin S. G. Poly(o-Phenylenediamine)-Decorated V4C3Tx Mxene/Poly(o-Phenylenediamine) Blends as Electrode Materials to Boost Storage Capacity for Supercapacitors and Lithium-Ion Batteries. ACS Appl. Nano Mater. 2023, 6, 9186–9196. 10.1021/acsanm.3c00624. [DOI] [Google Scholar]
- Rajasekar A.; Ting Y. P. Inhibition of Biocorrosion of Aluminum 2024 Aeronautical Alloy by Conductive Ladder Polymer Poly(o-Phenylenediamine). Ind. Eng. Chem. Res. 2011, 50, 2040–2046. 10.1021/ie101678x. [DOI] [Google Scholar]
- Fornera S.; Walde P. Spectrophotometric Quantification of Horseradish Peroxidase with o-Phenylenediamine. Anal. Biochem. 2010, 407, 293–295. 10.1016/j.ab.2010.07.034. [DOI] [PubMed] [Google Scholar]
- Liu H.; Wang Z.; Liu Y.; Xiao J.; Wang C. Enthalpy Change and Mechanism of Oxidation of o-Phenylenediamine by Hydrogen Peroxide Catalyzed by Horseradish Peroxidase. Thermochim. Acta 2006, 443, 173–178. 10.1016/j.tca.2006.01.005. [DOI] [Google Scholar]
- Wu J. J. X.; Wang X. Y.; Wang Q.; Lou Z. P.; Li S. R.; Zhu Y. Y.; Qin L.; Wei H. Nanomaterials with Enzyme-Like Characteristics (Nanozymes): Next-Generation Artificial Enzymes (II). Chem. Soc. Rev. 2019, 48, 1004–1076. 10.1039/C8CS00457A. [DOI] [PubMed] [Google Scholar]
- Liang M. M.; Yan X. Y. Nanozymes: From New Concepts, Mechanisms, and Standards to Applications. Acc. Chem. Res. 2019, 52, 2190–2200. 10.1021/acs.accounts.9b00140. [DOI] [PubMed] [Google Scholar]
- Li X.; Zhu H. J.; Liu P.; Wang M. Z.; Pan J. M.; Qiu F. X.; Ni L.; Niu X. H. Realizing Selective Detection with Nanozymes: Strategies and Trends. TrAC, Trends Anal. Chem. 2021, 143, 116379 10.1016/j.trac.2021.116379. [DOI] [Google Scholar]
- Zandieh M.; Liu J. W. Nanozyme Catalytic Turnover and Self-Limited Reactions. ACS Nano 2021, 15, 15645–15655. 10.1021/acsnano.1c07520. [DOI] [PubMed] [Google Scholar]
- Wu Z.-S.; Zhang S.-B.; Guo M.-M.; Chen C.-R.; Shen G.-L.; Yu R.-Q. Homogeneous, Unmodified Gold Nanoparticle-Based Colorimetric Assay of Hydrogen Peroxide. Anal. Chim. Acta 2007, 584, 122–128. 10.1016/j.aca.2006.11.003. [DOI] [PubMed] [Google Scholar]
- Yang X.; Wang E. A Nanoparticle Autocatalytic Sensor for Ag+ and Cu2+ Ions in Aqueous Solution with High Sensitivity and Selectivity and Its Application in Test Paper. Anal. Chem. 2011, 83, 5005–5011. 10.1021/ac2008465. [DOI] [PubMed] [Google Scholar]
- Bonet-Aleta J.; Garcia-Peiro J. I.; Irusta S.; Hueso J. L. Gold-Platinum Nanoparticles with Core-Shell Configuration as Efficient Oxidase-Like Nanosensors for Glutathione Detection. Nanomaterials 2022, 12, 755 10.3390/nano12050755. [DOI] [PMC free article] [PubMed] [Google Scholar]
- Liu Y.; Lopes R. P.; Lüdtke T.; Di Silvio D.; Moya S.; Hamon J.-R.; Astruc D. Click” Dendrimer-Pd Nanoparticle Assemblies as Enzyme Mimics: Catalytic o-Phenylenediamine Oxidation and Application in Colorimetric H2O2 Detection. Inorg. Chem. Front. 2021, 8, 3301–3307. 10.1039/D1QI00427A. [DOI] [Google Scholar]
- Maity S.; Bain D.; Chakraborty S.; Kolay S.; Patra A. Copper Nanocluster (Cu23 NC)-Based Biomimetic System with Peroxidase Activity. ACS Sustainable Chem. Eng. 2020, 8, 18335–18344. 10.1021/acssuschemeng.0c07431. [DOI] [Google Scholar]
- Cheng L.; Wu F. X.; Bao H. B.; Li F. H.; Xu G. B.; Zhang Y. J.; Niu W. X. Unveiling the Actual Catalytic Sites in Nanozyme-Catalyzed Oxidation of o-Phenylenediamine. Small 2021, 17, 2104083 10.1002/smll.202104083. [DOI] [PubMed] [Google Scholar]
- Khokhar D.; Jadoun S.; Surabhi S.; Morales D. V.; Jeong J.-R. An Experimental and Theoretical Study of Copolymerization of o-Phenylenediamine and Thiophene. Eur. Polym. J. 2022, 176, 111423 10.1016/j.eurpolymj.2022.111423. [DOI] [Google Scholar]
- Khokhar D.; Jadoun S.; Arif R.; Jabin S.; Budhiraja V. Copolymerization of o-Phenylenediamine and 3-Amino-5-Methylthio-1h-1,2,4-Triazole for Tuned Optoelectronic Properties and Its Antioxidant Studies. J. Mol. Struct. 2021, 1228, 129738 10.1016/j.molstruc.2020.129738. [DOI] [Google Scholar]
- Riaz U.; Jadoun S.; Kumar P.; Kumar R.; Yadav N. Microwave-Assisted Facile Synthesis of Poly(Luminol-co-Phenylenediamine) Copolymers and Their Potential Application in Biomedical Imaging. RSC Adv. 2018, 8, 37165–37175. 10.1039/C8RA08373H. [DOI] [PMC free article] [PubMed] [Google Scholar]
- Jain P. K.; Lee K. S.; El-Sayed I. H.; El-Sayed M. A. Calculated Absorption and Scattering Properties of Gold Nanoparticles of Different Size, Shape, and Composition: Applications in Biological Imaging and Biomedicine. J. Phys. Chem. B 2006, 110, 7238–7248. 10.1021/jp057170o. [DOI] [PubMed] [Google Scholar]
- We will use the term “extinction” instead of “absorbance” because the mixtures described henceforth contain molecular dyes, AuNPs and large polymer aggregates
- Zhou Y.; Ma Z. F. Fluorescent and Colorimetric Dual Detection of Mercury (Ii) by H2O2 Oxidation of o-Phenylenediamine Using Pt Nanoparticles as the Catalyst. Sens. Actuator, B 2017, 249, 53–58. 10.1016/j.snb.2017.04.076. [DOI] [Google Scholar]
- Lian J. J.; Yin D. X.; Zhao S.; Zhu X. X.; Liu Q. Y.; Zhang X. X.; Zhang X. Core-Shell Structured Ag-CoO Nanoparticles with Superior Peroxidase-Like Activity for Colorimetric Sensing Hydrogen Peroxide and o-Phenylenediamine. Colloid Surf., A 2020, 603, 125283 10.1016/j.colsurfa.2020.125283. [DOI] [Google Scholar]
- Vetr F.; Moradi-Shoeili Z.; Ozkar S. Oxidation of o-Phenylenediamine to 2,3-Diaminophenazine in the Presence of Cubic Ferrites MFe2O4 (M = Mn, Co, Ni, Zn) and the Application in Colorimetric Detection of H2O2. Appl. Organomet. Chem. 2018, 32, e4465 10.1002/aoc.4465. [DOI] [Google Scholar]
- Cutler J. I.; Auyeung E.; Mirkin C. A. Spherical Nucleic Acids. J. Am. Chem. Soc. 2012, 134, 1376–1391. 10.1021/ja209351u. [DOI] [PubMed] [Google Scholar]
- Sun J.; Wang B.; Zhao X.; Li Z. J.; Yang X. R. Fluorescent and Colorimetric Dual-Readout Assay for Inorganic Pyrophosphatase with Cu2+-Triggered Oxidation of o-Phenylenediamine. Anal. Chem. 2016, 88, 1355–1361. 10.1021/acs.analchem.5b03848. [DOI] [PubMed] [Google Scholar]
- Shen Y. Z.; Wei Y. L.; Gao X.; Nie C.; Wang J. L.; Wu Y. N. Engineering an Enzymatic Cascade Catalytic Smartphone-Based Sensor for Onsite Visual Ratiometric Fluorescence-Colorimetric Dual-Mode Detection of Methyl Mercaptan. Environ. Sci. Technol. 2023, 57, 1680–1691. 10.1021/acs.est.2c07899. [DOI] [PubMed] [Google Scholar]
- Liang J. K.; Li H.; Wang J. R.; Yu H. L.; He Y. Cascade Chromogenic System with Exponential Signal Amplification for Visual Colorimetric Detection of Acetone. Anal. Chem. 2020, 92, 6548–6554. 10.1021/acs.analchem.0c00149. [DOI] [PubMed] [Google Scholar]
- Li X. G.; Huang M. R.; Yang Y. L. Synthesis and Characterization of o-Phenylenediamine and Xylidine Copolymers. Polymer 2001, 42, 4099–4107. 10.1016/S0032-3861(00)00661-3. [DOI] [Google Scholar]
- Wang Z. F.; Liao F. Synthesis of Poly(Ortho-Phenylenediamine) Fluffy Microspheres and Application for the Removal of Cr(VI). J. Nanomater. 2012, 2012, 682802 10.1155/2012/682802. [DOI] [Google Scholar]
- Sayyah S. M.; Khaliel A. B.; Aboud A. A.; Mohamed S. M. Chemical Polymerization Kinetics of Poly-o-Phenylenediamine and Characterization of the Obtained Polymer in Aqueous Hydrochloric Acid Solution Using K2Cr2O7 as Oxidizing Agent. Int. J. Polym. Sci. 2014, 2014, 520910 10.1155/2014/520910. [DOI] [Google Scholar]
- Lee C. H.; Yoon J. Y. Temperature Dependence of Hydroxyl Radical Formation in the hv/Fe3+/H2O2 and Fe3+/H2O2 Systems. Chemosphere 2004, 56, 923–934. 10.1016/j.chemosphere.2004.04.047. [DOI] [PubMed] [Google Scholar]
- Surwade S. P.; Agnihotra S. R.; Dua V.; Manohar N.; Jain S.; Ammu S.; Manohar S. K. Catalyst-Free Synthesis of Oligoanilines and Polyaniline Nanofibers Using H2O2. J. Am. Chem. Soc. 2009, 131, 12528–12529. 10.1021/ja905014e. [DOI] [PubMed] [Google Scholar]
- Papammagari L.; Agnihotra S. R.; Manohar N.; Bouldin R. M.; Manohar S. K. Nanostructured Polyanilines Using the H2O2/CaCl2 Oxidant System. Macromolecules 2021, 54, 1507–1516. 10.1021/acs.macromol.0c01241. [DOI] [Google Scholar]
- Strachan J.; Barnett C.; Masters A. F.; Maschmeyer T. 4-Nitrophenol Reduction: Probing the Putative Mechanism of the Model Reaction. ACS Catal. 2020, 10, 5516–5521. 10.1021/acscatal.0c00725. [DOI] [Google Scholar]
- Kong X.; Zhu H.; Chen C.; Huang G.; Chen Q. Insights into the Reduction of 4-Nitrophenol to 4-Aminophenol on Catalysts. Chem. Phys. Lett. 2017, 684, 148–152. 10.1016/j.cplett.2017.06.049. [DOI] [Google Scholar]
- Christopher L. P.; Yao B.; Ji Y. Lignin Biodegradation with Laccase-Mediator Systems. Front. Energy Res. 2014, 2, 12 10.3389/fenrg.2014.00012. [DOI] [Google Scholar]
- Metelitza D. I.; Karasyova E. I.; Grintsevich E. E.; Thorneley R. N. F. Peroxidase-Catalyzed Co-Oxidation of 3,3′,5,5′-Tetramethylbenzidine in the Presence of Substituted Phenols and Their Polydisulfides. J. Inorg. Biochem. 2004, 98, 1–9. 10.1016/j.jinorgbio.2003.10.007. [DOI] [PubMed] [Google Scholar]
- Frens G. Controlled Nucleation for the Regulation of the Particle Size in Monodisperse Gold Suspensions. Nat. Phys. Sci. 1973, 241, 20–22. 10.1038/physci241020a0. [DOI] [Google Scholar]
Associated Data
This section collects any data citations, data availability statements, or supplementary materials included in this article.