

Abstract
Microplastics require a risk assessment framework that takes their multidimensionality into account while exclusively considering robust data. Therefore, effect tests should use a diverse, environmentally relevant microplastic (ERMP) standard material that adheres to high-quality requirements. In this study, we provide chronic dose–effect relationships and effect thresholds for 16 benthic species exposed to ERMP. The ERMP was created from plastic items collected from natural sources and cryogenically milled to represent the diversity of microplastics. The test design met 20 previously published quality assurance and quality control criteria. Adverse effect thresholds (EC10) were determined at ERMP concentrations of 0.11 ± 0.17% sediment dry weight (Gammarus pulex, growth), 0.49 ± 0.68% sediment dry weight (Lumbriculus variegatus, growth), and 1.90 ± 1.08% sediment dry weight (L. variegatus, reproduction). A positive effect of microplastics, such as decreased mortality, was observed for Cerastoderma edule (EC10 = 0.021 ± 0.027% sediment dry weight) and Sphaerium corneum (EC10 = 7.67 ± 3.41% sediment dry weight), respectively. Several of these laboratory-based single-species effect thresholds for ERMP occurred at concentrations lower than those found in the environment. For other species, no significant effects were detected up to an ERMP dose of 10% dry weight.
Keywords: risk assessment, reference material, standard test, benthic species, freshwater, marine
Short abstract
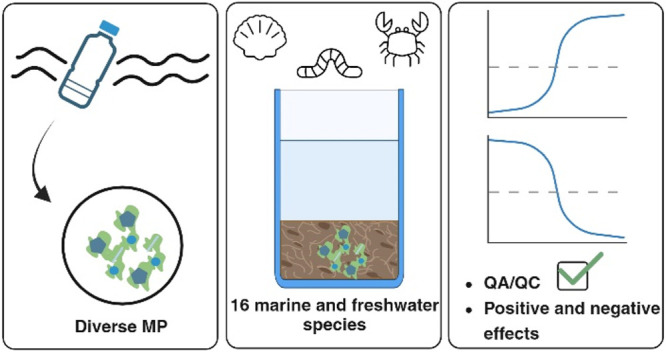
Effects of microplastics are assessed for a range of 16 benthic invertebrate species using strict quality criteria and an environmentally relevant standard microplastic test material.
Introduction
In recent years, research into microplastics has increased significantly as a result of growing concerns within the public, political, and scientific communities. It is well-known now that microplastics can be found anywhere and could potentially lead to negative impacts on aquatic ecosystems.1−3 Although sediments are considered sinks for microplastics, most research to date has focused on pelagic exposure scenarios. Moreover, not much is known about differences between habitats (marine versus freshwater) or about the implications of species traits on the toxicity of microplastics. Prospective risk assessments show that it is only a matter of time until the risk of adverse effects on the ecosystem function will increase and that this is already the case for some hotspot sites, such as the Mediterranean, the Yellow Sea, and several highly polluted freshwater sites.4−7 The results of these risk assessments should however be regarded as preliminary because they were not performed in a regulatory context and the ecotoxicological data used are surrounded with uncertainties.1,6,8 Many researchers acknowledge that methodologies in plastic research need improvement and harmonization.1,4,9−13 Moreover, there is an urgent need to deal with the complexity of microplastics as a diverse contaminant, varying in size, shape, and polymer type, and to elucidate the underlying mechanisms of effects to explain conflicting results.14,15 Recently developed species sensitivity distributions (SSDs) contain ecotoxicological data that do not test microplastics in their diversity as one would encounter in the aquatic environment.4,5,8,16 Because data points in these SSDs relate to different particle types, results from such SSDs are fundamentally flawed. Rescaling methods have been developed that solve the problem of this misalignment,6,17 and these have been applied to derive management thresholds for the first time in a regulatory context.18,19 While elegant and efficient and considered the best option at the moment, they use several approaches and assumptions that introduce new uncertainties.6 In addition, they often have to use relatively poor-quality input data,19 a problem that cannot be completely solved by scaling or alignment methods. We propose that, to increase the realism of risk assessments, exposure and effect threshold data should be used that meet the highest quality assurance and quality control (QA/QC) standards and that relate to environmentally relevant standard microplastic mixtures that reflect the full multidimensionality of the material.3,17 More specifically, for effect tests, microplastic mixtures used should provide a valid representation of the distribution of polymer types, shapes, and sizes as found in nature,1 so that as little extrapolation via rescaling as possible is needed.
This study aimed to provide threshold effect concentrations for a range of benthic species with different feeding traits and habitats for risk assessment purposes. To achieve this aim, we first prepared an environmentally relevant microplastic (ERMP) mixture and then tested 16 invertebrate species using that mixture while fulfilling strict QA/QC criteria.1 For instance, key features of the quality assurance were that ERMP was characterized extensively, contamination was minimized, exposure concentrations were homogeneous and verified, natural particles were included, biofouling of microplastics was allowed to increase environmental relevance,20,21 environmentally relevant concentrations were used, and six replicated doses were used to enable dose–response modeling to detect and report effect thresholds. Effect data were analyzed using dose–response models, and generalized linear mix models were applied to explore differences in effects between marine versus freshwater species and between feeding traits.
Materials and Methods
Quality Assurance and Quality Control (QA/QC)
Test design, materials, handling of materials, control of background contamination, and exposure conditions fulfilled the 20 QA/QC criteria as defined by de Ruijter et al. A summary of how these criteria were met is provided in Table S1 of the Supporting Information. Additionally, a detailed description of how the criteria verification of the exposure concentration and background contamination were met is provided on pages S2 and S3 of the Materials and Methods of the Supporting Information.
Preparation of Environmentally Relevant Microplastics
Microplastic particles with varying polymer types, sizes, shapes, and colors were created in the laboratory. In brief, naturally aged macroplastics were collected from the river banks of the National Park Biesbosch (Netherlands), analyzed with attenuated total reflectance Fourier transform infrared spectroscopy (ATR–FTIR) to determine the polymer identity, and subsequently cryogenically milled (Figures S1–S4 of the Supporting Information). Sieve fractions of the milling product were combined in such a way that the final mixture demonstrably resembles ERMP occurring in sediments (Figure S5 of the Supporting Information).1,22 The result was an ERMP standard test mixture, with polymer weight percentages of irregular polyethylene (PE) fragments (34%), irregular polypropylene (PP) fragments (15.9%), PP fibers (10.5%), irregular polyethylene terephthalate (PET) fragments (20.6%), and irregular polystyrene (PS) fragments (19%). These proportions are similar to those found in the environment.22 Moreover, the ERMP test mixture had a size range between 9 and 5386 μm and a power law slope α (α = 3.28 ± 0.02) (Figure S5) equal to the slope found for microplastic mixtures in freshwater sediments (α = 3.25 ± 0.19).17 A detailed description of the preparation and characterization of the ERMP test mixture is provided on pages S4 and S5 of the Materials and Methods and Figures S5 and S6 of the Supporting Information.
Test Organisms
A total of 16 benthic invertebrate species, comprising 9 freshwater and 7 marine species, were tested in this study. Freshwater species selected were Gammarus pulex, Hyalella azteca, Asellus aquaticus, Sphaerium corneum, Corbicula fluminalis, Potamopyrgus antipodarum, Tubifex spp., Lumbriculus variegatus, and Chironomus riparius. Organisms were selected to differ in their feeding and living behavior; however, they are all connected to the benthic environment (Table S2 of the Supporting Information). Marine species selected were Alitta virens, Limecola balthica, Corophium volutator, Arenicola marina, Cerastoderma edule, Porcellana platycheles, and Mytilus edulis (Table S3). A detailed description of the origin and collection of the test organisms is provided on page S6 of the Materials and Methods of the Supporting Information.
Sediment
Clean freshwater sediments were collected from the experimental field station of Wageningen University (Sinderhoeve, Renkum, Netherlands). Marine sediments were collected from Oesterput and Roelshoek (Eastern Scheldt, Netherlands) and mixed with a ratio of 1:4.23 For a detailed description of the collection and preparation of the sediments, see page S7 of the Materials and Methods of the Supporting Information.
Experimental Setup
The systematic testing approach in this study is similar to that followed by Redondo-Hasselerharm et al., with a few adjustments.23 Sediment–microplastic mixtures were added to sediment at concentrations of 0, 0.1, 0.3, 1.0, 2.5, 5.0, and 10.0% dry weight (dw). This translated to a particle concentrations of 5.9 × 10⁶, 1.8 × 10⁷, 5.9 × 10⁷, 1.5 × 10⁸, 2.9 × 10⁸, and 5.9 × 10⁸/kg of dw sediment, respectively. In total, 17 chronic, single-species bioassays were performed. The systematic testing approach in this study is similar to that followed by Redondo-Hasselerharm et al.; however, in the previous study, the sediment that originated from a non-contaminated ditch in Veenkampen (Wageningen, Netherlands) had a total organic matter (TOM) content of 31.6 ± 3.5% (n = 4).23 While environmentally relevant, this high TOM content could mask the adverse effects of microplastics. After all, negative effects observed in aquatic organisms have been explained by the inhibition of food assimilation and/or decreased nutritional value of food, more commonly referred to as “food dilution”.1 Hence, we chose sediment with a lower, more common TOM content. To verify comparability between our testing approaches and implement a positive control, we repeated the previous experiment by Redondo-Hasselerharm et al. with G. pulex: once with the lower TOM content sediment and PS fragments as used by Redondo-Hasselerharm et al. and once with the lower TOM content and with ERMP instead of PS fragments. For experiments 1 and 2, experimental units were made by either adding PS fragments or ERMP without PS fragments to sediment (Tables S2 and S3 of the Supporting Information) in the following concentrations 0, 0.5, 1, 3, 5, 10, and 20 wt %. For experiments 3–17, ERMP including PS fragments (Tables S2 and S3 of the Supporting Information) was added to the sediment in the following concentrations 0, 0.1, 0.3, 1.0, 2.5, 5.0, and 10.0 wt %. Concentrations ranging from environmentally relevant (0–1.0%)24−26 to high concentrations (2.5–20%) were included to cover criteria related to relevance as well as statistical rigor in finding an effect threshold.1
Sediment–microplastic mixtures were manually homogenized with a stainless-steel spoon. Consequently, Dutch standard water (DSW) or filtered seawater was gently added at a 3:1 water/sediment ratio. Experimental units were made in quadruplicate, and four blanks (containing only DSW or seawater) were added to measure background microplastic contamination, e.g., from air fallout. Systems were randomized and left to acclimatize to allow for biofilm formation for 2 weeks before adding the organisms.20,27−30 Experimental units received 11–22 organisms depending upon the size of the organisms (Tables S2 and S3 of the Supporting Information). Exposure lasted 28 days. Dissolved oxygen, pH, temperature, conductivity/salinity, and NH3 concentrations were measured twice a week, and DSW and seawater were refreshed periodically (Tables S4 and S5 of the Supporting Information). For a detailed description of the experimental design, the reader is referred to page S8 of the Materials and Methods of the Supporting Information.
End Point Mortality, Reproduction, Growth, Feeding Rate, Emergence, and Development Rate
After 28 days, organisms were sieved, counted, and transferred to clean DSW or seawater to clear their gut for 24 h. Consequently, organisms were rinsed with Milli-Q water and microplastic particles in their gut contents, and body tissues were stored separately at −20 °C for later microplastic analysis. Findings related to microplastic ingestion will be detailed in a companion paper. Organisms were photographed, and either their length was measured using ImageJ31 or they were weighed per replica. The emergence of C. riparius was counted daily. The feeding rate (mg of dw of leaf organism–1 day–1) of G. pulex was calculated from the loss of poplar leaves (equation S1 of the Supporting Information). An overview of end points measured per organism is provided in Tables S2 and S3 of the Supporting Information.
Data Analysis
Selection of the best fitting dose–response models and detection of statistically significant EC50 threshold effect concentrations were done using the dose–response curve (DRC) package in R.32 The significance of ERMP dose dependence (pnoEffect) was assessed using a log-likelihood ratio test using the best fit dose–response model compared to a linear regression model with a slope of 0, representing the absence of dose dependency.
To explore whether the effects of the ERMP concentration on mortality were different for the freshwater versus marine species tested, a generalized linear mixed model (GLMM) was used. Similarly, a GLMM was used to explore whether the effects of ERMP on mortality were different for the feeding traits (filter feeders, sediment/deposit feeders, sediment grazers, and facultative deposit feeders). All statistical analyses and graphs were performed in RStudio.33 For a detailed description of the statistical approach, the reader is referred to pages S9 and S10 of the Materials and Methods of the Supporting Information.
Results and Discussion
Mortality, Emergence, and Reproduction
The mortality in the controls was 20.0% on average across all tests, ranging from 0.0% (P. platycheles and C. fluminalis) to 75.0% (C. edule), with a median mortality of 9.5% (Tables S2 and S3 of the Supporting Information). The mean total number of C. riparius that did not emerge was 40%. Additionally, L. variegatus had a mean reproduction factor of 2.9, which is more than acceptable.34 Some marine species were never tested before, making control mortality less predictable and, in some cases, less ideal in the context of effect testing for regulatory purposes. Error in replicated treatments was fairly high in some cases. We observed a cascading phenomenon in the test systems of C. edule, P. platycheles, A. marina, and M. edulis, implying that the death and decay of only one individual resulted in a decline in water quality, which, in turn, resulted in the death of more individuals. Note that the effect thresholds derived from effect tests with high mortalities in the controls are not fit for regulatory purposes. Nevertheless, sediments were non-toxic, water quality parameters were good (Tables S5 and S6 of the Supporting Information), and 80% of all individuals tested survived 28 days of exposure, illustrating that test conditions were generally sufficient.
There was no statistically significant effect threshold found for mortality of G. pulex after chronic exposure to ERMP without PS fragments with concentrations up to 20% dw (Figure 1 and Table S7 of the Supporting Information). There were no statistically significant effect thresholds found for the marine and freshwater species H. azteca, A. aquaticus, C. fluminalis, P. antipodarum, Tubifex spp., A. virens, L. balthica, C. volutator, A. marina, P. platycheles, or M. edulis after chronic exposure to ERMP with concentrations up to 10% dw in sediment (Figures 1 and 2 and Tables S7 and S8 of the Supporting Information). Statistically significant effect thresholds were found for mortality for the species G. pulex after chronic exposure to PS; however, the dose–response curve was not significant (Figure 1 and Table S7 of the Supporting Information). Moreover, a significant effect threshold was found after chronic exposure to ERMP with concentrations up to 10% dw in sediment for the emergence of C. riparius; however, the dose–response curve was not significant (Figure 1 and Table S7 of the Supporting Information). A significant dose–response curve, however, was found for the reproduction of L. variegatus (p = 0.009; Table S7 of the Supporting Information and Figure 1). Dose–response curve fitting yielded a significant EC50 value of 2.51 ± 0.44% (p = 0.002) for L. variegatus (Figure 1, Table S7 of the Supporting Information, and Table 1).
Figure 1.

Mean mortality [±standard deviation (sd)] expressed in proportion (dead/start population) of (A) G. pulex exposed to PS and (B) G. pulex exposed to ERMP with concentrations up to 20% in dw sediment, (C) H. azteca, (D) A. aquaticus, (E) S. corneum, (F) C. fluminalis, (G) P. antipodarum, and (H) Tubifex spp. exposed to ERMP + PS with concentrations up to 10% in dw sediment, (I) mean reproduction factor (±sd) of L. variegatus exposed to ERMP + PS, and (J) mean total emergence (±sd) of C. riparius exposed to ERMP + PS. The exposure time for all freshwater species was 28 days. Three- and four-parameter log–logistic dose–response models were plotted for (E) S. corneum and (I) L. variegatus, respectively. Concentrations are on a log scale. The zero concentration has been converted to 0.01 to allow for plotting on the log scale.
Figure 2.

Mean mortality (±sd) expressed in proportion (dead/start population) of (A) A. virens, (B) A. marina, (C) C. volutator, (D) L. balthica, (E) C. edule, (F) P. platycheles, and (G) M. edulis exposed to ERMP + PS with concentrations up to 20% in dw sediment. The exposure time for all marine species was 28 days. A three-parameter Weibull (type 1) model was plotted for (E) C. edule. Note that concentrations are on a log scale. Additionally, the zero concentration has been converted to 0.01 to allow for plotting on the log scale.
Table 1. Overview of Detected EC50 and EC10 [±Standard Error (SE)] Threshold Effect Concentrationsa.
| organism | aquatic environment | end point | adverse effect | type of DRCa fitted | EC10 ± SE (%) | EC10 microplastics/kg of dw sediment | EC50 ± SE (%) | EC50 microplastics/kg of dw sediment | p value effect thresholdb | p value log-likelihood ratio test |
|---|---|---|---|---|---|---|---|---|---|---|
| Gammarus pulex (ERMP–PS)c | freshwater | growth | yes | LL.2 | 0.11 ± 0.17 | 6.48 × 10⁶ | 2.85 ± 1.39 | 1.68 × 10⁸ | 0.050* | 6.28 × 10⁻⁴*** |
| Sphaerium corneum | freshwater | mortality | no | LL.3 | 7.67 ± 3.41 | 4.52 × 10⁸ | 9.88 ± 0.68 | 5.82 × 10⁸ | 2.0 × 10⁻¹⁶*** | 0.013* |
| Lumbriculus variegatus | freshwater | reproduction factor | yes | LL.4 | 1.90 ± 1.08 | 1.12 × 10⁸ | 2.51 ± 0.44 | 1.48 × 10⁸ | 0.002** | 0.009** |
| Lumbriculus variegatus | freshwater | growth | yes | W1.4 | 0.49 ± 0.68 | 2.88 × 10⁷ | 0.77 ± 0.14 | 4.53 × 10⁷ | 0.007** | 2.32 × 10–03** |
| Cerastoderma edule | marine | mortality | no | W1.3 | 0.021 ± 0.027 | 1.24 × 10⁶ | 1.01 ± 0.45 | 5.95 × 10⁷ | 0.003** | 3.22 × 10⁻¹⁵*** |
The dose–response curve package in R provides the following models: Weibull type I model (W1.x) and log logistic (LL.x), with x giving the number of parameters fitted.
Significant findings (p < 0.05) are highlighted in bold. Significance codes: “∗∗∗”, <0.001; “∗∗”, <0.01; and “∗”, <0.05.
For G. pulex exposed to ERMP–PS, a high mortality of 40.9% was found in the control. The effect thresholds for this species is, therefore, fit for regulatory purposes.
We emphasize that it is challenging to compare these results to previous literature data because, unlike the present study, previous data were obtained with microplastics that are not environmentally relevant and previous effect tests often failed to meet sufficient QA/QC criteria. In this sense, the current data can be considered the first of its kind and can only be compared to previous test results with caution.
Nevertheless, our results do not completely contradict previous microplastic experiments with benthic macroinvertebrates in terms of mortality.23,35−37 For instance, Imhof and Laforsch tested an environmentally relevant mixture of irregular PA, PET, PC, PS, and polyvinyl chloride (PVC) particles ranging from 4.64 to 602 μm and did not find any effects on morphological or life history parameters of the mud snail Potamopyrgus antipodarum.36 Additionally, Redondo-Hasselerharm et al. tested a wide size range of irregular PS fragments on G. pulex, H. azteca, A. aquaticus, and Tubifex spp. with a dose up to 40% in sediment dw and reported no effects on mortality. Interestingly, they also reported no effects on the reproduction factor of L. variegatus, whereas we detected effects in the present study. Several factors may explain the difference. First of all, our present study used a more realistic microplastic mixture with a more diverse polymer composition, whereas shapes were also more diverse, e.g., including fibers and irregularly shaped PE, PP, and PET fragments ranging from 9 to 5386 μm. The inclusion of fibers associated with a longer gut retention time in the current study may increase the impact of microplastics, as also seen in other studies.38,39 Second, our present study used sediment with a lower organic matter content (6.8 ± 0.42%) compared to the sediment used by Redondo-Hasselerharm et al. (31.6 ± 3.5%). This suggests that the inclusion of naturally occurring organic particles can lower the impact of microplastics significantly or even mask adverse effects, as also observed in other studies.20,21,40,41
However, these explanations of observed differences in adverse effects remain speculative, and the ingestion of ERMP by the organisms as well as effects at different food quality levels need further study to be conclusive. Nevertheless, the present study underlines the importance of testing a set of diverse microplastics to make accurate predictions at the population level. For instance, Silva et al. did not find any adverse effects on the reproduction of L. variegatus after long-term exposure to solely irregular-shaped PE, suggesting no negative impacts on L. variegatus population fitness.42 However, using a diverse suite of environmentally relevant microplastics, we show that the organism L. variegatus is likely to be affected at the population level (EC10 = 1.90 ± 1.08%; p = 8.1 × 10⁻⁶; Table 1).
Remarkably, a significant positive effect on survival was found for the marine clam C. edule (EC50 = 1.01 ± 0.45%; p = 0.003) and the freshwater clam S. corneum (EC50 = 9.88 ± 0.68%; p = 2.0 × 10⁻¹⁶; Tables S7 and S8 of the Supporting Information and Table 1). Note that mortality in the controls was high for C. edule (75%), meaning that the control, unlike those for the other species, was not representative of a habitat with optimal conditions. It does however indicate that, with an increasing concentration of ERMP in the sediment, the mortality decreased and a habitat quality for these species increased with the concentration given in the test conditions. C. edule and S. corneum inhabit the surface of sediments, burrowing to a depth up to 8 cm.43 A possible explanation is that the sediment was too compact for these species, causing resistance for burrowing in the top sediment layer. The microplastic amendments may have loosened sediment consolidation, reducing the energy required for digging. It remains unclear to what extent this effect would be detectable in nature, where sediment top layers are more dynamic as a result of bioturbation and wind- or wave-induced pressure gradients. Moreover, on an intertidal flat in nature, C. edule would be able to move to a location with more optimal sediment.
Growth and Feeding Activity
The growth of marine and freshwater organisms was assessed using length after 28 days and the length of the population at the start. For the worm species Tubifex spp., L. variegatus, A. virens, and A. marina, growth is expressed in weight (mg of dw) and showed relatively high variability among replicates (Figures 3 and 4). As for the other organisms, G. pulex, H. azteca, A. aquaticus, S. corneum, C. fluminalis, P. antipodarum, C. riparius, C. volutator, L. balthica, C. edule, P. platycheles, and M. edulis, growth is expressed in length (mm) and variability among replicates was relatively low (Figures 3 and 4).
Figure 3.

Mean growth (±sd) expressed in length (mm) of (A) G. pulex exposed to PS and (B) G. pulex exposed to ERMP with concentrations up to 20% in dw sediment, mean growth (±sd) expressed in millimeters or milligrams of (C) H. azteca, (D) A. aquaticus, (E) S. corneum, (F) C. fluminalis, (G) P. antipodarum, (H) Tubifex spp., and (I) L. variegatus exposed to ERMP + PS with concentrations up to 10% in dw sediment, and mean development rate (±sd) of (J) C. riparius exposed to ERMP + PS with concentrations up to 10% in dw sediment. The exposure time for all freshwater species was 28 days. A two-parameter log–logistic dose–response model was plotted for (B) G. pulex exposed to ERMP–PS, respectively. A four-parameter Weibull (type 1) model was plotted for (I) L. variegatus. Note that concentrations are on a log scale. Additionally, the zero concentration has been converted to 0.01 to allow for plotting on the log scale.
Figure 4.

Mean growth (±sd) expressed in either length (mm) or weight (mg) of (A) A. virens, (B) A. marina, (C) C. volutator, (D) L. balthica, (E) C. edule, (F) P. platycheles, and (G) M. edulis exposed to ERMP + PS with concentrations up to 20% in dw sediment. No statistically significant effect thresholds were found. The exposure time for all marine species was 28 days. Note that concentrations are on a log scale. Additionally, the zero concentration has been converted to 0.01 to allow for plotting on the log scale.
For the marine and freshwater species H. azteca, A. aquaticus, S. corneum, C. fluminalis, P. antipodarum, Tubifex spp., C. riparius, A. virens, A. marina, C. volutator, C. edule, P. platycheles, or M. edulis, no statistically significant effect thresholds were found after chronic exposure to ERMP with concentrations up to 10% dw in sediment for growth (Figures 3 and 4 and Tables S9 and S10 of the Supporting Information). For L. balthica, a significant effect threshold was found (p = 0.002); however, the dose–response curve was not significant, as also apparent by visual inspection (pnoEffect = 0.126). Additionally, for G. pulex exposed to PS fragments, a significant effect threshold was found (p = 0.006); however, the dose–response curve was not significant (pnoEffect = 0.332). For G. pulex, a reduction in growth was observed after chronic exposure to ERMP without PS fragment sediment (EC50 = 2.85 ± 1.39%; p = 0.050) with concentrations up to 20% in dw (Table S9 of the Supporting Information, Figure 3, and Table 1). Note that this effect threshold is not fit for regulatory purposes, because the control mortality was too high (40.9%). Additionally, for L. variegatus, a statistically significant adverse effect was found for growth (EC50 = 0.77 ± 0.14%; p = 0.007; pnoEffect = 2.32 × 10³; Table S9 of the Supporting Information, Figure 3, and Table 1). Finally, no effect threshold was found for the feeding rate of G. pulex after a 28 day exposure to PS fragments. For the feeding rate of G. pulex exposed to ERMP without PS fragments, a significant effect threshold was found (p = 2.16 × 10⁻¹⁶). However, the effect threshold concentration was not physically realistic; moreover, the dose–response curve was not significant (pnoEffect = 0.980), as also apparent by visual inspection (Table S9 and Figure S8 of the Supporting Information).
Our findings of G. pulex exposed to ERMP without PS are in accordance with the study done by Redondo-Hasselerharm et al.23 Also here, a reduction of growth on G. pulex was reported after exposure to PS, with a similar effect threshold (EC50 = 3.57%). As discussed previously, almost identical systematic approaches were used; however, in the present study, we used a more commonly occurring sediment with a lower TOM content and an even higher diversity of microplastic particles. The masking hypothesis previously mentioned does, however, not seem to apply to G. pulex from the study of Redondo-Hasselerharm et al.,23 suggesting a certain species-specific trait. Of all of the species tested and considering the results of the various tests done with G. pulex, this species seems to be the most sensitive to adverse effects of microplastics (Table 1).
For L. variegatus a significant negative effect was found for growth (EC50 = 0.77 ± 0.14%; p = 0.007). This is in contrast to the finding reported by other studies.23,42 For instance, Silva et al. reported on sub-organismal effects, such as depletion of energy reserves of L. variegatus; however, no adverse effects were found on biomass when exposed to only irregularly shaped PE. The differences in effects are likely due to the different types, shapes, sizes, and aging processes of the microplastics used. Again, to be conclusive about the latter, the ingestion of ERMP by L. variegatus would need to be studied.
No differences on feeding activity in the studies done for G. pulex (experiments 1 and 2) were found after a 28 day exposure to ERMP. This is similar to the results found in previous chronic exposure studies.23,35 Although testing solely PS and PET, respectively, these studies also did not find any effect on the feeding rate of G. pulex. These results show that the reduction in growth cannot be explained by the reduction in food uptake because this stays constant throughout treatment concentrations.23 Moreover, Straub et al. showed that, after chronic exposure to poly(methyl methacrylate) (PMMA) and polyhydroxy butyrate (PHB) in Gammarus fossarum, the assimilation efficiency and wet weight gain decreased; however, the feeding rate was not affected. It is likely that the decrease in growth can be explained by the mechanism inhibition of food assimilation and/or decreased nutritional value of food but also obstruction in the gut.1,44
Different Responses to Microplastic Exposure for Marine versus Freshwater Species
After discussing the results at the single-species level, we look here and in the next section at differences between species categories. For instance, we tested whether the mortality response of marine species to an increasing dose of microplastics is different from that of the freshwater species. Interestingly, GLMM showed that the mortality risk for marine species decreases more rapidly as the concentration of microplastics increases compared to freshwater species (GLMM; p = 2.51 × 10⁻⁵; Table S11 of the Supporting Information). We consider these results to be preliminary. This is the first time that such a direct comparison between marine and freshwater species has been made, albeit with a limited amount of organisms, and more data should be considered to substantiate the detected trend. If further substantiated, such results are highly relevant for assessing risks using, for example, SSDs, often combining data on freshwater and marine species.19 A difference in the sensitivity between the habitats means that separate SSDs must be used. It is important to see whether the difference is present for all species or whether the significance level is dominated by a few species. In this regard, we mention the marine species C. edule. For this species, the mortality decreased with an increasing concentration, which partly determines the result for the entire group.
Different Responses to Microplastic Exposure for Groups of Species with Different Feeding Traits
We also tested whether the responses of species to an increasing dose of microplastics are different for groups of species with different feeding traits. We distinguished four types of main feeding traits: filter feeders, sediment/deposit feeders, sediment grazers, and facultative deposit feeders (Table S12 of the Supporting Information). For mortality, no significant differences were found, except for the group of species feeding in the water column (filter feeders). Increasing exposure to microplastics has a greater effect on organisms exposed to water than on organisms in any of the other feeding guilds (GLMM; p < 3.90 × 10⁻⁵; parts a–d of Table S13 of the Supporting Information). Here too, C. edule falls within the deviant group, a species whose mortality decreases with increasing concentration. Again, we can only speculate about possible explanations for the aberrant exposure from the aqueous phase. One possible explanation is that species that feed on the water above the sediment have a higher general sensitivity to particulate matter than species that are naturally more closely associated with sediment because that is their natural habitat.
Limitations and Recommendations for Future Work
Here, we have provided 17 dose–response relationships consisting of 5 effect threshold concentrations for 16 freshwater and marine benthic macroinvertebrate species using an environmentally relevant mixture of microplastic particles, demonstrating that this can be done under the strictest methods of quality assurance. Nevertheless, some species (G. pulex, H. azteca, A. aquaticus, S. corneum, and C. edule) exhibited high mortality rates in their control groups, rendering these results less suitable for regulatory considerations. Although these results have given us valuable insight, we suggest that these particular species be re-evaluated in future studies.
Earlier studies did not test such a wide range of species under the same conditions, were less reliable, and/or were less fit for the purpose concerning risk assessment.1 Rescaling and alignment methods have been developed to correct for differences among studies that target different microplastic size ranges, densities, or shape categories.6,17 However, the present effect data would require no or only a very limited level of corrections because microplastic particles were already close to those occurring in (aquatic) environmental samples. This enables direct use of the present data in risk assessment without the need for mathematical alignments. Furthermore, for the present microplastic mixture used, a probability density function (PDF) for size was provided, thus still allowing alignments to microplastic exposure conditions that would deviate from those represented by our tested mixture. We propose that PDFs are always provided when microplastic particles are used in tests, so that users can translate the test results into other conditions. Examples of how the results of these types of complex exposures can be applied to risk assessments have been outlined in recent literature.19,24
We did not find statistically significant effects on mortality or emergence for the freshwater and marine species G. pulex, H. azteca, A. aquaticus, C. fluminalis, P. antipodarum, Tubifex spp., C. riparius, A. virens, L. balthica, C. volutator, A. marina, P. platycheles, or M. edulis (Tables S7 and S8 of the Supporting Information). Additionally, chronic exposure to ERMP with concentrations up to 10% dw in sediment caused no significant effect on growth for the marine and freshwater species H. azteca, A. aquaticus, S. corneum, C. fluminalis, P. antipodarum, Tubifex spp., C. riparius, A. virens, A. marina, C. volutator, L. balthica, C. edule, P. platycheles, M. edulis (Tables S9 and S10 of the Supporting Information). Ideally, SSDs used for ecological risk assessment contain data on end points that are directly relevant to the population level, like reproduction, mortality, and growth. Here, we only considered such relevant end points, which implies that it is legitimate to speculate on implications for risks of microplastics in aquatic sediments based on our data. We detected the number concentration effect threshold EC10 for adverse effects for two freshwater species: 6.48 × 10⁶ number/kg (growth of G. pulex exposed to ERMP without PS) and 2.88 × 10⁷ and 1.12 × 10⁸ number/kg (growth and reproduction of L. variegatus). When these effect threshold concentrations were compared to rescaled measured environmental concentrations (MECs) for Liangfeng River sediments in China of 2.21 × 10⁸ number/kg of dw26,24 or for Menomonee River sediments in the U.S.A. of 1.73 × 10⁸ number/kg,24,25 it becomes apparent that risks would be indicated for G. pulex and L. variegatus and sufficiently similar species if our test conditions would be sufficiently representative of in situ exposure conditions.
Interestingly, we detected positive effects of microplastics on habitat quality for two species, C. edule and S. corneum, besides negative effects for several other species. The simultaneous existence of effect mechanisms that lead to a decline of the population density for some species and to a lesser decrease in population density for some other species has crucial implications for understanding the effects of microplastics on the community level. Previously, an analysis of community effects after long-term exposure to nano- and microplastics has revealed that the abundance of some species decreased, whereas the abundance of other species increased, indicating either direct or indirect positive effects on the species level.45 Another example of this is that the increase in microplastic concentrations in the oceans has reduced substrate limitation for oviposition for the pelagic insect Halobates sericeus,46 which also constitutes a positive effect on the population level. Additionally, Canniff and Hoang showed in an algal experiment that microplastics enhanced the growth of Raphidocelis subcapitata and suggested that, when ingested by daphnids, they could provide a possible food source.47 Recently, Amariei et al. reported a negative effect of microplastic ingestion by daphnids as a result of food dilution; however, a positive effect on the population was observed when that same microplastic was carrying a nutritious biofilm, which is the default situation in nature.20 Obviously, these observations should not be taken as a reason to scale down the problem of microplastic particles in the environment. However, a thorough understanding of multifarious effects, including negative as well as positive population effects, is required to be able to understand and model secondary effects on the food web and ecosystem level.48
Acknowledgments
The authors acknowledge financial support from the European Chemical Industry Council (CEFIC) Long Range Research Initiative (LRI), Project ECO49—Microplastics Effect Threshold for Aquatic Species (METAS). The authors thank Frits Gillissen, Dorine Dekkers, Marie-Claire Boerwinkel, Pim van Dalen, Wouter Suykerbuyk, Emiel Brummelhuis, and Jennifer Chin for their practical assistance. Additionally, the authors thank Svenja Mintenig for her help with the development of a protocol for FTIR analysis and Clara Delecroix, Edwin Peeters, and Noël Diepens for their assistance with the statistical analysis.
Supporting Information Available
The Supporting Information is available free of charge at https://pubs.acs.org/doi/10.1021/acs.est.3c06829.
Detailed description of the Materials and Methods (pages S2–S11), QA/QC criteria score (Table S1), plastic items collected in Biesbosch, Netherlands (Figure S1), microplastics produced from grinded plastic items (Figure S2), high-resolution pictures of PS fragments and ERMP (Figures S3 and S4), particle length distribution of ERMP with PS fragments (Figure S5), size distribution of PS fragments (Figure S6), overview of tested freshwater and marine benthic macroinvertebrates (Tables S2 and S3), microplastic analysis of background contamination (Table S4), mean water quality parameters of freshwater and marine experiments (Tables S5 and S6), verification of exposure concentrations using loss on ignition (LOI) (Figure S7), statistical results of dose–response models (Tables S7–S10), results of GLMM (Table S11, Table S12, and parts a–d of Table S13), and mean feeding rate of G. pulex (Figure S8) (PDF)
The authors declare no competing financial interest.
Supplementary Material
References
- de Ruijter V. N.; Redondo-Hasselerharm P. E.; Gouin T.; Koelmans A. A. Quality Criteria for Microplastic Effect Studies in the Context of Risk Assessment: A Critical Review. Environ. Sci. Technol. 2020, 54 (19), 11692–11705. 10.1021/acs.est.0c03057. [DOI] [PMC free article] [PubMed] [Google Scholar]
- Science Advice for Policy by European Academies (SAPEA) . A Scientific Perspective on Microplastics in Nature and Society; SAPEA: Berlin, Germany, 2019; 10.26356/microplastics. [DOI] [Google Scholar]
- Koelmans A. A.; Redondo-Hasselerharm P. E.; Mohamed Nor N. H.; de Ruijter V. N.; Mintenig S. M.; Kooi M. Risk assessment of microplastic particles. Nat. Rev. Mater. 2022, 7 (2), 138–152. 10.1038/s41578-021-00411-y. [DOI] [Google Scholar]
- Everaert G.; De Rijcke M.; Lonneville B.; Janssen C. R.; Backhaus T.; Mees J.; van Sebille E.; Koelmans A. A.; Catarino A. I.; Vandegehuchte M. B. Risks of floating microplastic in the global ocean. Environ. Pollut. 2020, 267, 115499. 10.1016/j.envpol.2020.115499. [DOI] [PubMed] [Google Scholar]
- Adam V.; Yang T.; Nowack B. Toward an ecotoxicological risk assessment of microplastics: Comparison of available hazard and exposure data in freshwaters. Environ. Toxicol. Chem. 2019, 38 (2), 436–447. 10.1002/etc.4323. [DOI] [PMC free article] [PubMed] [Google Scholar]
- Koelmans A. A.; Redondo-Hasselerharm P. E.; Mohamed Nor N. H.; Kooi M. Solving the Nonalignment of Methods and Approaches Used in Microplastic Research to Consistently Characterize Risk. Environ. Sci. Technol. 2020, 54 (19), 12307–12315. 10.1021/acs.est.0c02982. [DOI] [PMC free article] [PubMed] [Google Scholar]
- Coffin S.; Weisberg S. B.; Rochman C.; Kooi M.; Koelmans A. A. Risk Characterization of Microplastics in San Francisco Bay, California. Microplast. Nanoplast. 2022, 2, 19. 10.1186/s43591-022-00037-z. [DOI] [Google Scholar]
- Everaert G.; Van Cauwenberghe L.; De Rijcke M.; Koelmans A. A.; Mees J.; Vandegehuchte M.; Janssen C. R. Risk assessment of microplastics in the ocean: Modelling approach and first conclusions. Environ. Pollut. 2018, 242 (Part B), 1930–1938. 10.1016/j.envpol.2018.07.069. [DOI] [PubMed] [Google Scholar]
- Karami A. Gaps in aquatic toxicological studies of microplastics. Chemosphere 2017, 184, 841–848. 10.1016/j.chemosphere.2017.06.048. [DOI] [PubMed] [Google Scholar]
- Burns E. E.; Boxall A. B. Microplastics in the aquatic environment: Evidence for or against adverse impacts and major knowledge gaps. Environ. Toxicol. Chem. 2018, 37 (11), 2776–2796. 10.1002/etc.4268. [DOI] [PubMed] [Google Scholar]
- Connors K. A.; Dyer S. D.; Belanger S. E. Advancing the quality of environmental microplastic research. Environ. Toxicol. Chem. 2017, 36 (7), 1697–1703. 10.1002/etc.3829. [DOI] [PubMed] [Google Scholar]
- Cowger W.; Booth A. M.; Hamilton B. M.; Thaysen C.; Primpke S.; Munno K.; Lusher A. L.; Dehaut A.; Vaz V. P.; Liboiron M.; Devriese L. I.; Hermabessiere L.; Rochman C.; Athey S. N.; Lynch J. M.; De Frond H.; Gray A.; Jones O. A. H.; Brander S.; Steele C.; Moore S.; Sanchez A.; Nel H. Reporting guidelines to increase the reproducibility and comparability of research on microplastics. Appl. Spectrosc. 2020, 74 (9), 1066–1077. 10.1177/0003702820930292. [DOI] [PMC free article] [PubMed] [Google Scholar]
- Gouin T.; Becker R. A.; Collot A. G.; Davis J. W.; Howard B.; Inawaka K.; Lampi M.; Ramon B. S.; Shi J.; Hopp P. W. Toward the Development and Application of an Environmental Risk Assessment Framework for Microplastic. Environ. Toxicol. Chem. 2019, 38 (10), 2087–2100. 10.1002/etc.4529. [DOI] [PMC free article] [PubMed] [Google Scholar]
- Bucci K.; Tulio M.; Rochman C. What is known and unknown about the effects of plastic pollution: A meta-analysis and systematic review. Ecol. Appl. 2020, 30 (2), e02044 10.1002/eap.2044. [DOI] [PubMed] [Google Scholar]
- Paul-Pont I.; Tallec K.; Gonzalez-Fernandez C.; Lambert C.; Vincent D.; Mazurais D.; Zambonino-Infante J.-L.; Brotons G.; Lagarde F.; Fabioux C.; Soudant P.; Huvet A. Constraints and Priorities for Conducting Experimental Exposures of Marine Organisms to Microplastics. Front. Mar. Sci. 2018, 5, 252. 10.3389/fmars.2018.00252. [DOI] [Google Scholar]
- Besseling E.; Redondo-Hasselerharm P.; Foekema E. M.; Koelmans A. A. Quantifying ecological risks of aquatic micro- and nanoplastic. Crit. Rev. Environ. Sci. Technol. 2019, 49 (1), 32–80. 10.1080/10643389.2018.1531688. [DOI] [Google Scholar]
- Kooi M.; Primpke S.; Mintenig S. M.; Lorenz C.; Gerdts G.; Koelmans A. A. Characterizing the multidimensionality of microplastics across environmental compartments. Water Res. 2021, 202, 117429. 10.1016/j.watres.2021.117429. [DOI] [PubMed] [Google Scholar]
- Coffin S.; Bouwmeester H.; Brander S.; Damdimopoulou P.; Gouin T.; Hermabessiere L.; Khan E.; Koelmans A. A.; Lemieux C. L.; Teerds K.; Wagner M.; Weisberg S. B.; Wright S. Development and application of a health-based framework for informing regulatory action in relation to exposure of microplastic particles in California drinking water. Microplast. Nanoplast. 2022, 2 (1), 12. 10.1186/s43591-022-00030-6. [DOI] [PMC free article] [PubMed] [Google Scholar]
- Mehinto A. C.; Coffin S.; Koelmans A. A.; Brander S. M.; Wagner M.; Thornton Hampton L. M.; Burton A. G.; Miller E.; Gouin T.; Weisberg S. B.; Rochman C. M. Risk-based management framework for microplastics in aquatic ecosystems. Microplast. Nanoplast. 2022, 2 (1), 17. 10.1186/s43591-022-00033-3. [DOI] [Google Scholar]
- Amariei G.; Rosal R.; Fernandez-Pinas F.; Koelmans A. A. Negative food dilution and positive biofilm carrier effects of microplastic ingestion by D. magna cause tipping points at the population level. Environ. Pollut. 2022, 294, 118622. 10.1016/j.envpol.2021.118622. [DOI] [PubMed] [Google Scholar]
- Aljaibachi R.; Callaghan A. Impact of polystyrene microplastics on Daphnia magna mortality and reproduction in relation to food availability. PeerJ. 2018, 6, e4601 10.7717/peerj.4601. [DOI] [PMC free article] [PubMed] [Google Scholar]
- Kooi M.; Koelmans A. A. Simplifying Microplastic via Continuous Probability Distributions for Size, Shape, and Density. Environ. Sci. Technol. Lett. 2019, 6 (9), 551–557. 10.1021/acs.estlett.9b00379. [DOI] [Google Scholar]
- Redondo-Hasselerharm P. E.; Falahudin D.; Peeters E. T.; Koelmans A. A. Microplastic Effect Thresholds for Freshwater Benthic Macroinvertebrates. Environ. Sci. Technol. 2018, 52 (4), 2278–2286. 10.1021/acs.est.7b05367. [DOI] [PMC free article] [PubMed] [Google Scholar]
- Redondo-Hasselerharm P. E.; Rico A.; Koelmans A. A. Risk assessment of microplastics in freshwater sediments guided by strict quality criteria and data alignment methods. J. Hazard. Mater. 2023, 441, 129814. 10.1016/j.jhazmat.2022.129814. [DOI] [PubMed] [Google Scholar]
- Lenaker P. L.; Baldwin A. K.; Corsi S. R.; Mason S. A.; Reneau P. C.; Scott J. W. Vertical Distribution of Microplastics in the Water Column and Surficial Sediment from the Milwaukee River Basin to Lake Michigan. Environ. Sci. Technol. 2019, 53 (21), 12227–12237. 10.1021/acs.est.9b03850. [DOI] [PubMed] [Google Scholar]
- Xia F.; Yao Q.; Zhang J.; Wang D. Effects of seasonal variation and resuspension on microplastics in river sediments. Environ. Pollut. 2021, 286, 117403. 10.1016/j.envpol.2021.117403. [DOI] [PubMed] [Google Scholar]
- Ramsperger A. F.; Stellwag A. C.; Caspari A.; Fery A.; Lueders T.; Kress H.; Löder M. G.; Laforsch C. Structural diversity in early-stage biofilm formation on microplastics depends on environmental medium and polymer properties. Water 2020, 12 (11), 3216. 10.3390/w12113216. [DOI] [Google Scholar]
- Vroom R. J. E.; Koelmans A. A.; Besseling E.; Halsband C. Aging of microplastics promotes their ingestion by marine zooplankton. Environ. Pollut. 2017, 231 (Part 1), 987–996. 10.1016/j.envpol.2017.08.088. [DOI] [PubMed] [Google Scholar]
- Lobelle D.; Cunliffe M. Early microbial biofilm formation on marine plastic debris. Mar. Pollut. Bull. 2011, 62 (1), 197–200. 10.1016/j.marpolbul.2010.10.013. [DOI] [PubMed] [Google Scholar]
- Diepens N. l. J.; Dimitrov M. R.; Koelmans A. A.; Smidt H. Molecular assessment of bacterial community dynamics and functional end points during sediment bioaccumulation tests. Environ. Sci. Technol. 2015, 49 (22), 13586–13595. 10.1021/acs.est.5b02992. [DOI] [PubMed] [Google Scholar]
- Schneider C. A.; Rasband W. S.; Eliceiri K. W. NIH Image to ImageJ: 25 years of image analysis. Nat. Methods 2012, 9 (7), 671–675. 10.1038/nmeth.2089. [DOI] [PMC free article] [PubMed] [Google Scholar]
- Ritz C.; Baty F.; Streibig J. C.; Gerhard D. Dose-response analysis using R. PLoS One 2015, 10 (12), e0146021 10.1371/journal.pone.0146021. [DOI] [PMC free article] [PubMed] [Google Scholar]
- RStudio . RStudio: Integrated Development Environment for R; RStudio: Boston, MA, 2021; http://www.rstudio.com/ (accessed Nov 2, 2023).
- Organisation for Economic Co-operation and Development (OECD) . Test No. 225: Sediment-Water Lumbriculus Toxicity Test Using Spiked Sediment. OECD Guidelines for the Testing of Chemicals, Section 2; OECD: Paris, France, 2007; https://www.oecd-ilibrary.org/content/publication/9789264067356-en (accessed Nov 2, 2023).
- Weber A.; Scherer C.; Brennholt N.; Reifferscheid G.; Wagner M. PET microplastics do not negatively affect the survival, development, metabolism and feeding activity of the freshwater invertebrate Gammarus pulex. Environ. Pollut. 2018, 234, 181–189. 10.1016/j.envpol.2017.11.014. [DOI] [PubMed] [Google Scholar]
- Imhof H. K.; Laforsch C. Hazardous or not—Are adult and juvenile individuals of Potamopyrgus antipodarum affected by non-buoyant microplastic particles?. Environ. Pollut. 2016, 218, 383–391. 10.1016/j.envpol.2016.07.017. [DOI] [PubMed] [Google Scholar]
- Mateos-Cardenas A.; Scott D. T.; Seitmaganbetova G.; Frank N. A. M. V.; John O.; Marcel A. K. J. Polyethylene microplastics adhere to Lemna minor (L.), yet have no effects on plant growth or feeding by Gammarus duebeni (Lillj.). Sci. Total Environ. 2019, 689, 413–421. 10.1016/j.scitotenv.2019.06.359. [DOI] [PubMed] [Google Scholar]
- Ziajahromi S.; Kumar A.; Neale P. A.; Leusch F. D. L. Impact of Microplastic Beads and Fibers on Waterflea (Ceriodaphnia dubia) Survival, Growth, and Reproduction: Implications of Single and Mixture Exposures. Environ. Sci. Technol. 2017, 51 (22), 13397–13406. 10.1021/acs.est.7b03574. [DOI] [PubMed] [Google Scholar]
- Au S. Y.; Bruce T. F.; Bridges W. C.; Klaine S. J. Responses of Hyalella azteca to acute and chronic microplastic exposures. Environ. Toxicol. Chem. 2015, 34 (11), 2564–2572. 10.1002/etc.3093. [DOI] [PubMed] [Google Scholar]
- Scherer C.; Brennholt N.; Reifferscheid G.; Wagner M. Feeding type and development drive the ingestion of microplastics by freshwater invertebrates. Sci. Rep. 2017, 7 (1), 17006. 10.1038/s41598-017-17191-7. [DOI] [PMC free article] [PubMed] [Google Scholar]
- Rist S.; Baun A.; Hartmann N. B. Ingestion of micro- and nanoplastics in Daphnia magna—Quantification of body burdens and assessment of feeding rates and reproduction. Environ. Pollut. 2017, 228, 398–407. 10.1016/j.envpol.2017.05.048. [DOI] [PubMed] [Google Scholar]
- Silva C. J.; Patricio Silva A. L.; Campos D.; Soares A. M.; Pestana J. L.; Gravato C. Lumbriculus variegatus (oligochaeta) exposed to polyethylene microplastics: Biochemical, physiological and reproductive responses. Ecotoxicol. Environ. Saf. 2021, 207, 111375. 10.1016/j.ecoenv.2020.111375. [DOI] [PubMed] [Google Scholar]
- McMahon R. F.; Wilson J. G. Seasonal respiratory responses to temperature and hypoxia in relation to burrowing depth in three intertidal bivalves. J. Therm. Biol. 1981, 6 (4), 267–277. 10.1016/0306-4565(81)90015-2. [DOI] [Google Scholar]
- Straub S.; Hirsch P. E.; Burkhardt-Holm P. Biodegradable and Petroleum-Based Microplastics Do Not Differ in Their Ingestion and Excretion but in Their Biological Effects in a Freshwater Invertebrate Gammarus fossarum. Int. J. Environ. Res. Public Health 2017, 14 (7), 774. 10.3390/ijerph14070774. [DOI] [PMC free article] [PubMed] [Google Scholar]
- Redondo-Hasselerharm P.; Gort G.; Peeters E.; Koelmans A. Nano-and microplastics affect the composition of freshwater benthic communities in the long term. Sci. Adv. 2020, 6 (5), eaay4054 10.1126/sciadv.aay4054. [DOI] [PMC free article] [PubMed] [Google Scholar]
- Goldstein M. C.; Rosenberg M.; Cheng L. Increased oceanic microplastic debris enhances oviposition in an endemic pelagic insect. Biol. Lett. 2012, 8 (5), 817–820. 10.1098/rsbl.2012.0298. [DOI] [PMC free article] [PubMed] [Google Scholar]
- Canniff P. M.; Hoang T. C. Microplastic ingestion by Daphnia magna and its enhancement on algal growth. Sci. Total Environ. 2018, 633, 500–507. 10.1016/j.scitotenv.2018.03.176. [DOI] [PubMed] [Google Scholar]
- Kong X.; Koelmans A. A. Modeling Decreased Resilience of Shallow Lake Ecosystems toward Eutrophication due to Microplastic Ingestion across the Food Web. Environ. Sci. Technol. 2019, 53 (23), 13822–13831. 10.1021/acs.est.9b03905. [DOI] [PubMed] [Google Scholar]
Associated Data
This section collects any data citations, data availability statements, or supplementary materials included in this article.