

Abstract
Patients with coronavirus disease 2019 (COVID-19) present increased risk for ischemic cardiovascular complications up to 1 year after infection. Although the systemic inflammatory response to severe acute respiratory syndrome coronavirus 2 (SARS-CoV-2) infection likely contributes to this increased cardiovascular risk, whether SARS-CoV-2 directly infects the coronary vasculature and attendant atherosclerotic plaques remains unknown. Here we report that SARS-CoV-2 viral RNA is detectable and replicates in coronary lesions taken at autopsy from severe COVID-19 cases. SARS-CoV-2 targeted plaque macrophages and exhibited a stronger tropism for arterial lesions than adjacent perivascular fat, correlating with macrophage infiltration levels. SARS-CoV-2 entry was increased in cholesterol-loaded primary macrophages and dependent, in part, on neuropilin-1. SARS-CoV-2 induced a robust inflammatory response in cultured macrophages and human atherosclerotic vascular explants with secretion of cytokines known to trigger cardiovascular events. Our data establish that SARS-CoV-2 infects coronary vessels, inducing plaque inflammation that could trigger acute cardiovascular complications and increase the long-term cardiovascular risk.
Coronavirus disease 2019 (COVID-19), caused by severe acute respiratory syndrome coronavirus 2 (SARS-CoV-2), is uniquely marked by extraordinary tissue tropism and an array of clinical presentations from asymptomatic infection to acute respiratory distress, multiorgan failure and death1. Ischemic cardiovascular events such as acute myocardial infarction (AMI) and stroke, due to the underlying disruption of a chronically inflamed atherosclerotic plaque2, are established clinical complications of COVID-191,3. AMI and stroke can be triggered by several acute respiratory viral infections, including influenza virus4. However, patients with COVID-19 are >7-fold more likely to have a stroke than patients with influenza5, and their risk for both AMI and stroke remains high for up to 1 year after infection6. The extreme inflammatory response that occurs in severe cases of COVID-19, also known as cytokine storm7, is likely a contributor to the increased risk for AMI and stroke. Yet the possibility that SARS-CoV-2 directly affects the coronary vasculature, as documented for other distant organs (e.g., kidney, gut, brain, adipose tissue, and myocardium)8, remains largely unexplored. In the lungs, tissue damage is aggravated by potent inflammasome activation in macrophages sensing SARS-CoV-2 virus9. A similar response in macrophages infiltrating arterial vessels affected by the virus could boost plaque inflammation and risk for AMI and stroke in COVID-19 patients. Here we show in coronary autopsy specimens from COVID-19 patients that infiltrating macrophages were infected by SARS-CoV-2. Lipid-laden macrophages (foam cells), a hallmark of atherosclerosis at all stages of the disease10, were more susceptible to SARS-CoV-2 infection than other macrophages and this was dependent on the receptor neuropilin-1 (NRP-1). SARS-CoV-2 induced a strong pro-atherogenic inflammatory response in both macrophages and foam cells, which was largely recapitulated in an ex-vivo SARS-CoV-2 infection of human vascular explants. This response may contribute to the ischemic cardiovascular complications in COVID-19 patients.
Spatial AI detects SARS-CoV-2 RNA in coronary macrophages
We analyzed coronary autopsy specimens (n=27) from 8 patients with RT-PCR confirmed diagnosis of COVID-19 between May 2020 and May 2021. Demographics and clinical characteristics, including past medical history, cardiovascular risk factors and other relevant clinical information, were obtained from the patients’ electronic medical records and autopsy reports (IRB i21-01587) (Figure 1a; Supplementary Table 1–2). Mean age was 69.6 (median 71; 59–84) and 75% of patients were male (6/8). Patients had coronary artery disease (8/8), 3 or more cardiovascular risk factors such as hypertension (8/8), overweight or obesity (7/8), hyperlipidemia (7/8), type 2 diabetes (6/8) and chronic kidney disease (4/8), and some had a history of either myocardial infarction (1/8) or ischemic stroke (1/8) (Figure 1a; Supplementary Table 1). Acute myocardial ischemia was diagnosed during hospitalization in 3 patients, one developed stroke and 4 were found to have coronary stenosis (>50%) at autopsy. The patients, with the exception of one pronounced dead before admission, were hospitalized for an average of 17.6 days (range 8–31) (Supplementary Table 2). One patient (Pt. 1), was hospitalized three times (for a total of 31 days) following the first diagnosis. Pt.1 developed acute myocardial infarction and died during the third hospitalization approximately 140 days after testing negative for COVID-19 (Figure 1a; Supplementary Table 2). The clinical presentation, in hospital course of the disease, COVID-19 treatments, as well as macroscopic and microscopic autopsy pathology obtained from hospital medical records and autopsy reports are summarized in Supplementary Table 2.
Figure 1: SARS-CoV-2 viral RNA in human coronary arteries from deceased individuals with COVID-19 is identified using artificial intelligence-based spatial analysis.
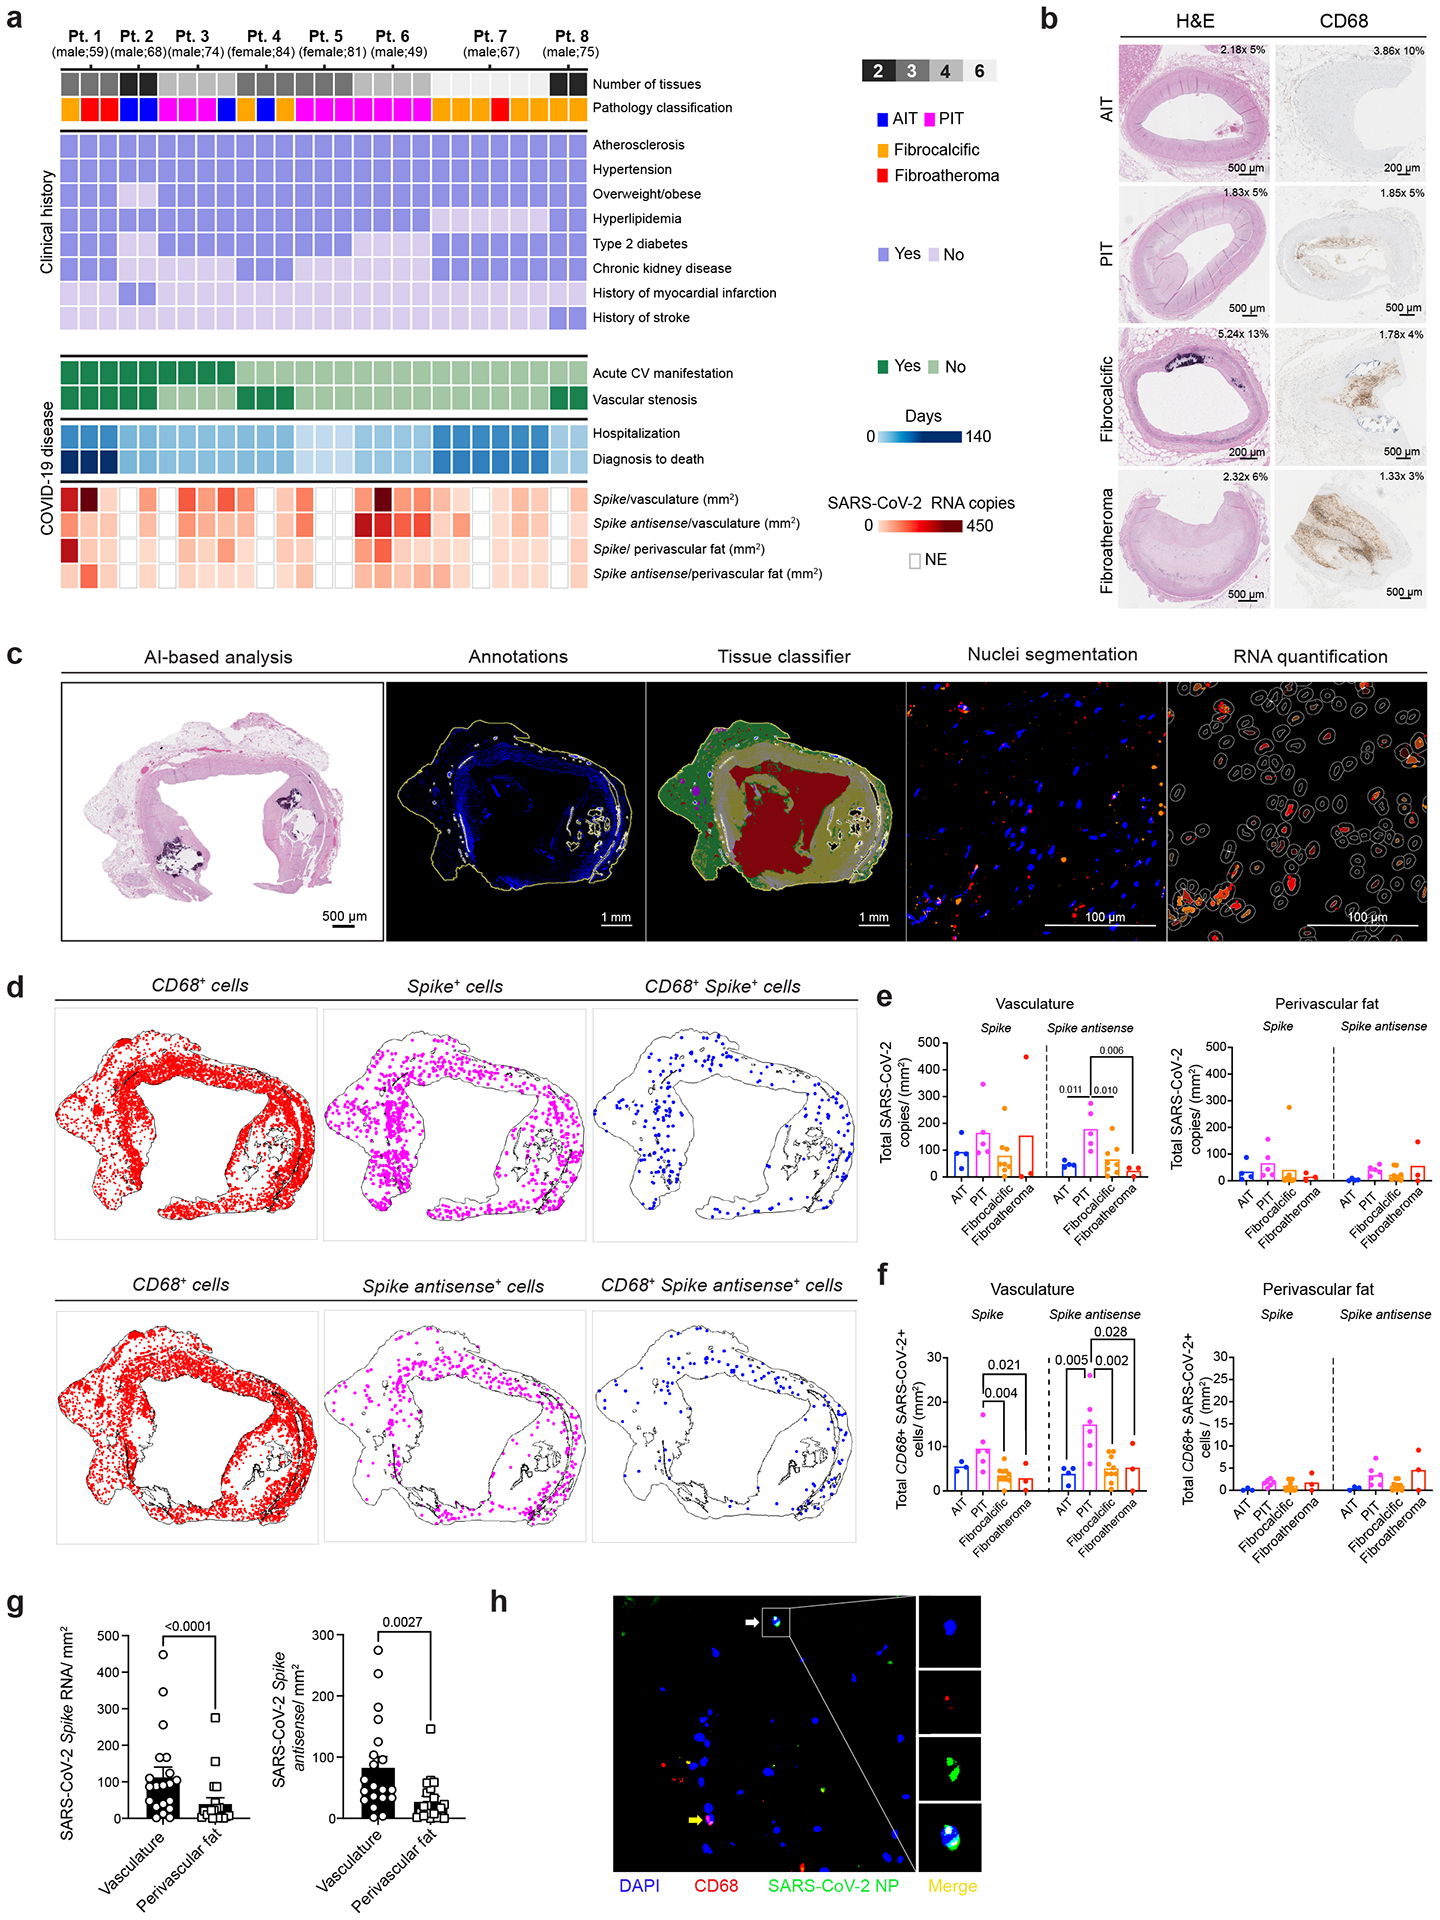
a, Categorical heat map of coronary autopsy specimens (n = 27) from deceased individuals with COVID-19 (n = 8) displays their sex, age and pathology classification into AIT, PIT, fibrocalcific plaques and fibroatheromas. The clinical history for each patient is shown. Summary of acute cardiovascular (CV) manifestations during COVID-19 disease progression, coronary stenosis (no: <50%; yes: >50%), hospitalization duration and time to death after COVID-19 diagnosis are also depicted. RNA copy numbers of S and S antisense vRNA normalized to vasculature and perivascular fat area (mm2) are shown. NE, not evaluated. b, Representative images of coronary samples stained with H&E and CD68 staining for each pathological classification. c, Representative images of in situ RNA-FISH AI-based analysis. After semi-automatic annotations, an AI-based neural network was used to classify the vasculature (yellow) and perivascular fat (green). Background and artifacts (red) were removed from the analysis. Next, nuclei segmentation classifier analysis and RNA quantification were performed using HALO AI and spatial analysis workflow. d, Representative images of spatial analysis showing the location of CD68 RNA, SARS-CoV-2 S+ or S antisense+ cells and CD68+ SARS-CoV-2 RNA double-positive cells. e, Bar plots showing total SARS-CoV-2 vRNA copies of S and S antisense normalized by tissue area (mm2) in AIT (n = 4), PIT (n = 5), fibrocalcific (n = 8) and fibroatheroma (n = 3) coronary samples. f, Bar plots showing total CD68+ SARS-CoV-2 S+ or S antisense+ cells in the vasculature or perivascular fat regions normalized by tissue area (mm2) in AIT (n = 4), PIT (n = 5), fibrocalcific (n = 10) and fibroatheroma (n = 3) coronary samples. One-way analysis of variance (ANOVA) statistical analysis with post hoc Tukey’s test for multiple comparisons was performed. g, SARS-CoV-2 S and S antisense quantification in vasculature and perivascular fat normalized by tissue area (mm2). Wilcoxon matched-pairs signed-rank test was performed (n = 20 per group). h, Representative images of of SARS-CoV-2 NP, CD68 and merge in human coronary. White arrow indicates CD68+ SARS-CoV-2 NP+ cell, and yellow arrow indicates CD68+ cell. Pt., patient.
Sections of coronary arteries from all autopsies were stained with hematoxylin and eosin (H&E) and classified by a clinical cardiovascular pathologist (N.N.) as adaptive intimal thickening (AIT; n=4), pathological intimal thickening with macrophage infiltration (PIT; n=10), fibrocalcific plaque (n=10) and fibroatheroma (n=3) (Figure 1a–b; Extended Data Figure 1a; Supplementary Figure 1; Supplementary Table 3) according to established criteria11,12. Detailed pathological features, including presence of lipid pool, necrotic core, and adventitial inflammation, were noted (Extended Data Figure 1a). Immunohistochemical staining for CD68+ cells showed that CD68+ cell count and frequencies were not significantly different between PIT, fibrocalcific lesions and fibroatheromas, whereas a larger positive stained area that corresponded to the necrotic cores was seen in fibroatheromas (Figure 1b, Extended Data Figure 1b–c, Supplementary Table 3).
To identify SARS-CoV-2 viral RNA (vRNA) in the autoptic coronary vasculature from patients with COVID-19, we performed RNA fluorescence in-situ hybridization (RNA-FISH) analysis for the viral RNA encoding the spike (S) protein. To establish whether SARS-CoV-2 infected the human coronary vasculature, we also probed the antisense strand of the S gene (S antisense), which is only produced during viral replication. A CD68 probe was used to identify macrophages infiltrating the coronary vessels in the same sections and establish the cellular localization of SARS-CoV-2 vRNA. Given the ability of SARS-CoV-2 to infect fat depots and accumulate vRNA in adipose tissue to trigger a strong proinflammatory response13,14, we used a neural network artificial intelligence (AI) approach to classify the coronary arterial wall and perivascular fat in each sample and nuclei segmentation to quantify the RNAscope probes in cells infiltrating the two tissues (Figure 1c–d). In the coronary arterial wall, vRNA encoding S protein and the antisense strand of the S gene were detected to different degrees in all the sections from all patients indicating the presence of vRNA and replicative activity of the virus. SARS-CoV-2 S gene copy number was similar across AI, PIT, fibrocalcific and fibroatheroma coronary lesions (Figure 1e). However, PIT coronaries showed a significantly higher copy number of the antisense strand of the S gene (S antisense), indicating higher viral replication in the vascular wall of these lesions (Figure 1e). In particular, CD68+ cells expressing both the SARS-CoV-2 S and the antisense strand of S were significantly higher in the vasculature of PIT coronaries vs other pathologies (Figure 1f). In perivascular fat, vRNA encoding S protein was detected in 20 of the 21 sections and the S antisense in 19 of the 21 sections (Figure 1a). Overall, each patient presented at least one section positive for S and S antisense vRNA (Figure 1a and e–f). Notably, the amount of S and S antisense strand vRNA was significantly lower in perivascular fat than in the corresponding arterial wall across all samples (Figure 1g). The accumulation of viral protein material in the coronaries was confirmed by immunofluorescence (Figure 1h).
PIT arterial lesions, which appeared more susceptible to SARS-CoV-2 infection, contained significantly more cells than other types of lesions, and 4.8-fold more cells than corresponding perivascular tissue (2691.8±288.7 vs 697.6±159.3 cells/ mm2; P value<0.0001) (Extended Data Figure 1d). The number of CD68 RNA+ cells in the coronary vasculature was significantly higher in both PIT and fibroatheromas than other lesions (Extended Data Figure 1e), which corresponded to a higher number of CD68 RNA+ cells in perivascular fat of PIT lesion than fibrocalcific lesions and similar to fibroatheromas (Extended Data Figure 1e), suggesting a contributory role of direct infection of macrophages in the coronary susceptibility to SARS-CoV-2 infection. This possibility was further suggested by the significantly higher frequency of CD68+ cells expressing the S antisense strand of vRNA in PIT lesions and the corresponding perivascular fat (Extended Data Figure 1f), as well as the significant association between SARS-CoV-2 vRNA copies with CD68 copy number in both arterial wall and perivascular fat (Extended Data Figure 1g). The accumulation of SARS-CoV-2 vRNA encoding S protein was higher in both the whole tissue and in the coronary wall from COVID-19 patients with acute cardiovascular manifestations (Extended Data Figure 1h).
To investigate the potential extension of SARS-CoV-2 infection to other cells, we focused on vascular smooth muscle cells (VSMC), based on the spatial distribution of most SARS-CoV-2+ cells within the arterial wall of the coronaries, and conducted additional RNAscope analyses that were guided by analyses of human and mouse scRNA-seq datasets. An analysis, using scRNA-seq data from diseased human coronaries (GEO: GSE131780)15, revealed VSMCs express significantly higher levels of ACTA2 compared to myeloid cells, whereas CD68 expression was specific to macrophages (Extended Data Figure 2a). Additionally, we analyzed scRNA-seq data of lineage-tagged SMC-derived cells (VSMCs), isolated from the atherosclerotic aortic arches of ApoE−/− Tomato mice16. This analysis revealed that VSMCs in atherosclerotic lesions did not express significant levels of Cd68 and maintained a high level of Acta2 expression, although its expression was reduced compared to non-atherosclerotic conditions (Extended Data Figure 2b). Based on these results, we utilized ACTA2 probes to identify VSMCs and macrophages of vascular smooth muscle cell (VSMC) origin as ACTA2+, and included probes for the S and S antisense vRNA in the analysis to identify ACTA2+ infected cells. Notably, this analysis identified S+ACTA2+ cells and S antisense+ACTA2+ in human coronaries (Extended Data Figure 2c); however, the median of the frequency of SARS-COV-2 infected VSMCs (≈0.14%) in human coronary was ≈8 times lower than that of infected macrophages (≈1.2%). these results show that although SARS-CoV-2 can infect vascular smooth muscle cells (VSMCs), the number of infected VSMCs in human coronaries was lower compared to the number of infected macrophages. To further investigate SARS-CoV-2 infection of VSMCs and lipid-laden VSMCs, which are associated with atherosclerosis17–20, we infected primary human aortic VSMCs, and VSMCs loaded with cyclodextrin-cholesterol complexes (Extended Data Figure 2d), with the SARS-CoV-2 USA WA1/2020 isolate. Approximately 18% of cultured VSMCs and 13% of cholesterol-loaded VSMCs were spike+, and the frequency of spike antisense+ACTA2+ cells, indicating viral replication, was ≈2.6% (Extended Data Figure 2d–e). Taken together with our in vitro findings, which indicate that more than 79% of macrophages and over 90% of foam cells are spike+, along with the discovery that more than 40% of both cell types are spike antisense+, these results show that although SARS-CoV-2 can infect vascular smooth muscle cells (VSMCs), macrophages are infected at a higher rate.
SARS-CoV-2 infection of human macrophages and foam cells
The accumulation of cholesterol-laden macrophages (foam cells) is a hallmark of atherosclerosis at all stages of the disease from early PIT to late fibroatheroma lesions10,12. To investigate SARS-CoV-2 infection of both macrophages and foam cells, we differentiated human monocytes derived from human peripheral blood mononuclear cells (PBMCs) into macrophages and treated them with oxidized low-density lipoprotein (LDL) complexed with Dil dye (Dil-Ox-LDL) to differentiate them into foam cells. To experimentally confirm our observation that SARS-CoV-2 can infect human plaque macrophages, macrophages and foam cells were infected either with icSARS-CoV-2 mNeonGreen (mNG) reporter virus, a modified virus that allows the use of mNG fluorescence as a surrogate readout for viral replication21 or SARS-CoV-2 USA WA1/2020 isolate. mNG expression confirmed the ability of SARS-CoV-2 to replicate in both cell types, although replication was higher in foam cells (Figure 2A; Extended Data Figure 3a). The significantly higher accumulation of nucleoprotein (NP) in foam cells compared to macrophages infected with SARS-CoV-2 USA WA1/2020 isolate (Figure 2b; Extended Data Figure 3b) confirmed a higher susceptibility of foam cells to the virus. In fact, although the frequency of NP+ foam cells fell between 24 hours post-infection (hpi) and 48 hpi, the proportion of SARS-CoV-2 nucleoprotein (NP)+ foam cells remained significantly higher than that of NP+ macrophages (Figure 2b). Foam cells also accumulated more SARS-CoV-2 S vRNA than macrophages (Figure 2c). SARS-CoV-2 vRNA genome was detectable in both macrophages and foam cells as early as 2 hpi, remained high up to 24 hpi, but was reduced at 48 hpi in both cell types (Figure 2d; Extended Data Figure 3d). Notably, the expression of SARS-CoV-2 genes declined significantly faster in macrophages than foam cells with significantly lower vRNA at 48hpi (Figure 2e). This dynamic temporal decay in vRNA levels indicates that macrophages are able to clear faster the virus than foam cells. Regardless, albeit being susceptible, both macrophages and foam cells did not sustain a productive formation of infectious viral particles as demonstrated by the results of plaque assay using modified Vero E6 cells expressing the transmembrane protease serine 2 and human angiotensin-converting enzyme 2 (Vero E6-TMPRSS2-T2A-ACE2). This assay showed a progressive decline of viral titer conditioned media from infected macrophages and foam cells (Figure 2f; Extended Data Figure 3c). These results are consistent with abortive infection, a common outcome of many viral infections, with infected cells not producing replication competent virus despite the production of viral RNA22–26.
Figure 2: Differential interferon response and virus clearance dynamics in human macrophages and foam cells after SARS-CoV-2 in-vitro infection.
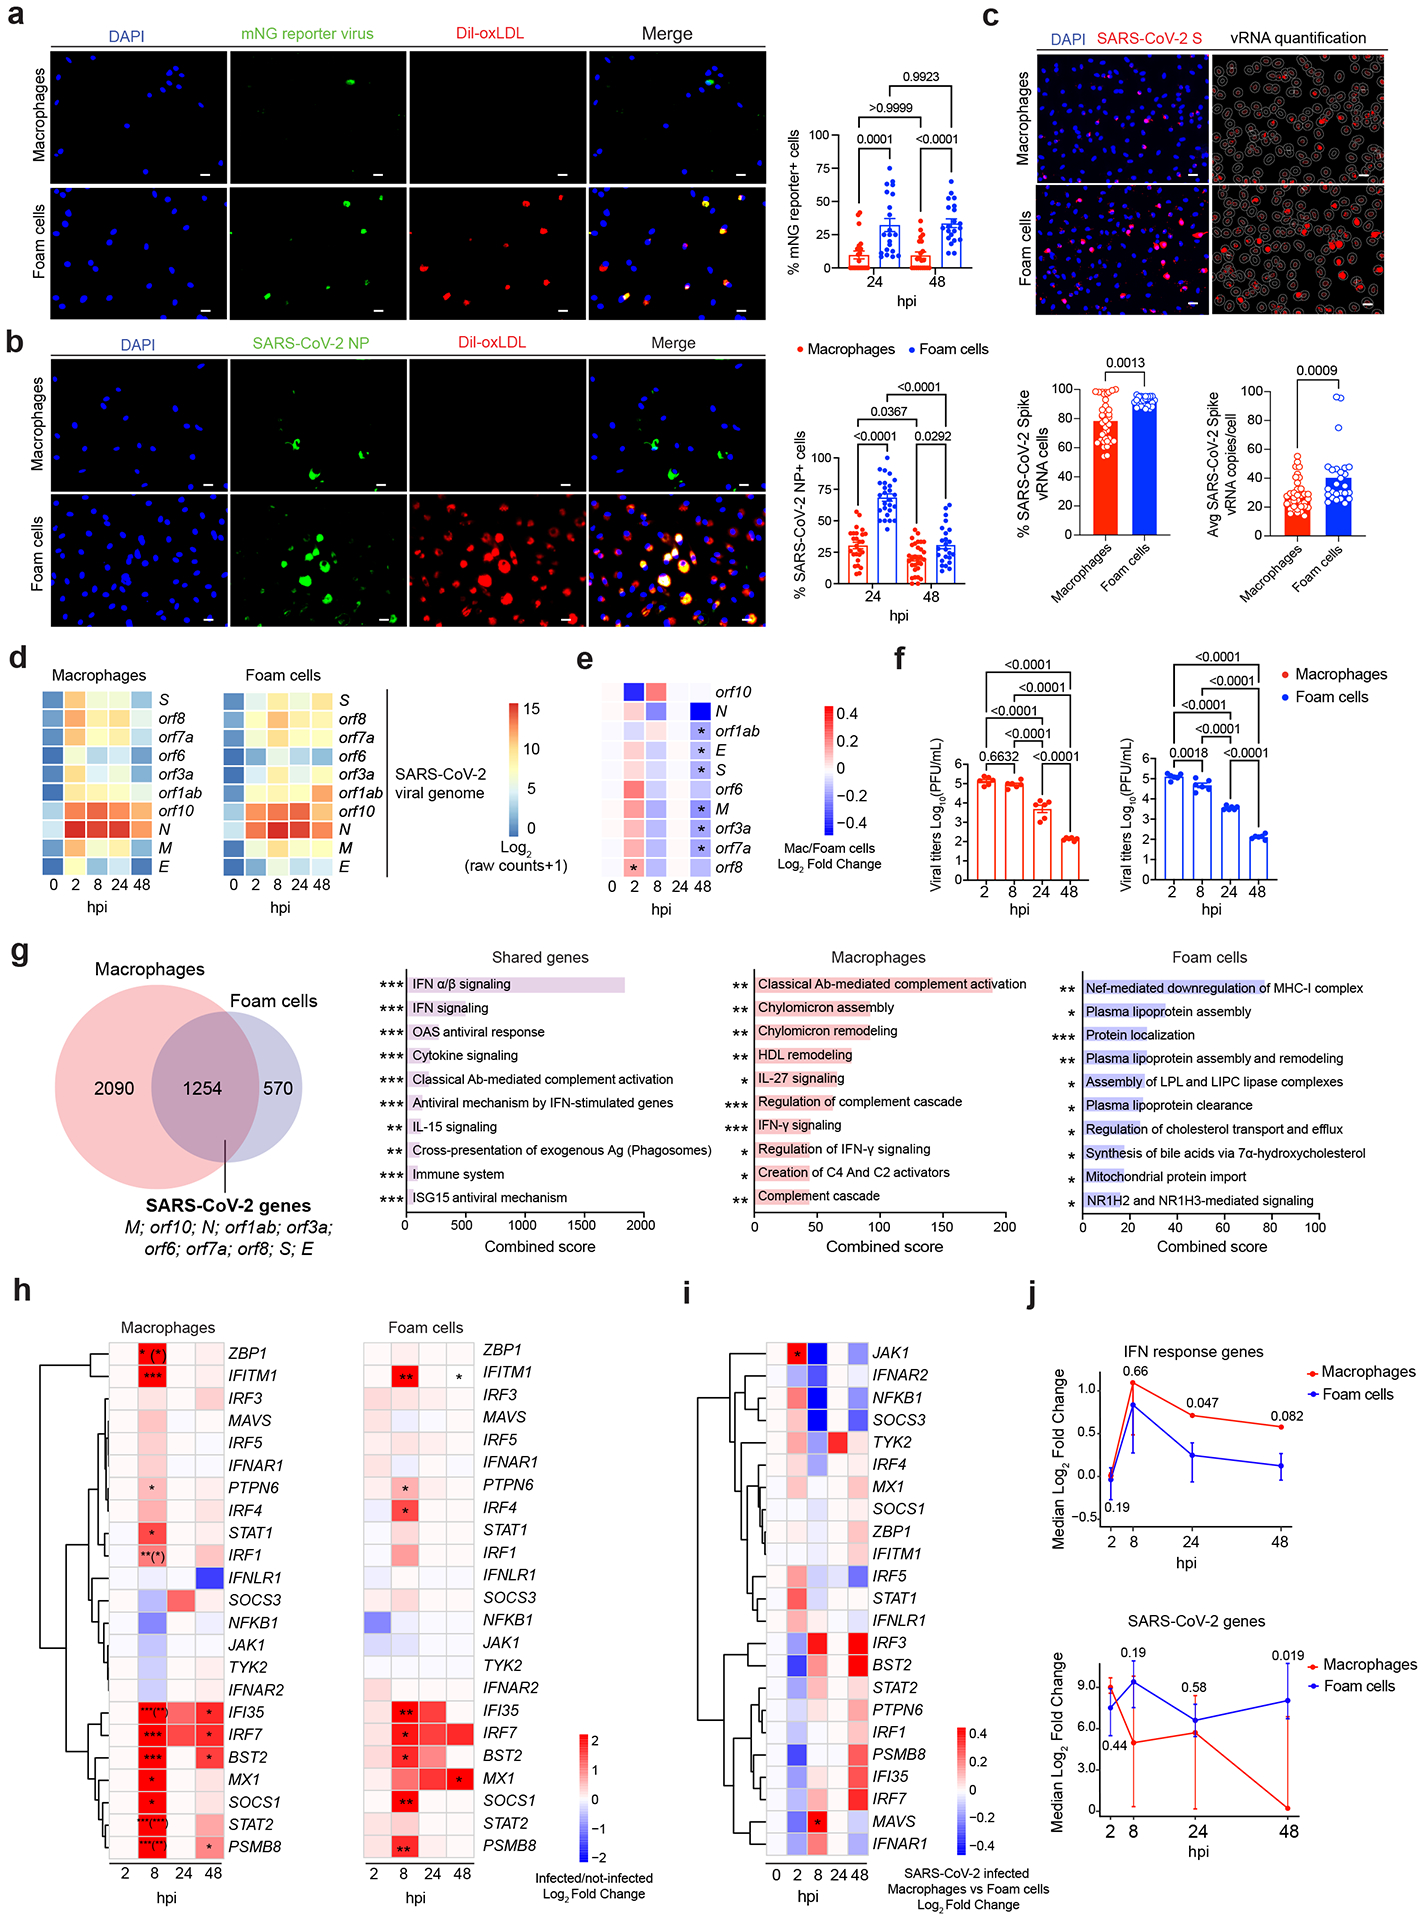
a) Quantification of mNG reporter-positive macrophages and foam cells (n = 21 images per condition). b) Quantification of SARS-CoV-2-infected macrophages (24 hpi, n = 20; 48 hpi, n = 24) and foam cells (24 hpi, n = 20; 48 hpi, n = 18). Representative images for a and b show results at 48 hpi. Scale bars, 20 μm. One-way ANOVA with post hoc Tukey’s test was performed. Data are presented as mean values ± s.e.m. c) RNA-FISH quantification of SARS-CoV-2 vRNA+ cell copies and frequency in macrophages (n = 37) and foam cells (n = 26). Data are presented as mean values ± s.e.m. Scale bars, 20 μm. Mann–Whitney U-test was performed. d) Heat map of SARS-CoV-2 viral genes reads in macrophages and foam cells. e) Heat map of log2FC of SARS-CoV-2 viral genes in macrophages versus foam cells. The Wald test from the DESeq2 package was used to test for significance. Adjusted P values < 0.05 (FDR = 1%) were considered significant. f) Viral titer quantification of SARS-CoV-2-infected macrophages and foam cell culture supernatants (n = 6). Data are presented as mean values ± s.e.m. One-way ANOVA followed by Tukey’s post hoc test was performed. g) Venn diagram of DEGs in infected versus non-infected macrophages, foam cells and shared genes. The Wald test from the DESeq2 package was used to test for significance. Bar plots show upregulated signaling pathways ranked by their combined score. *P < 0.05; **P < 0.01; ***P < 0.001. h) Heat maps of log2FC of IFN response genes in macrophages and foam cells. The Wald test from the DESeq2 package was used to test for significance. Adjusted P values < 0.05 (FDR = 10%) were considered significant. Asterisk in parenthesis indicates the comparison of interaction between infection and timepoint terms of the model. *P < 0.05; **P < 0.01; ***P < 0.001. i) Heat map of log2FC of SARS-CoV-2-infected macrophages versus foam (n = 3 biological replicates). The Wald test from the DESeq2 package was used to test for significance. Adjusted P values < 0.05 (FDR = 10%) were considered significant. j) Longitudinal kinetic plots of combined IFN response and SARS-CoV-2 genes scores. Data are presented as median and 25th–75th quartile log2FCs of SARS-CoV-2-infected versus non-infected cells. Hypothesis testing was performed using the Wilcoxon rank-sum test.
SARS-CoV-2 triggers proatherogenic inflammatory responses
Based on the observation that SARS-CoV-2 replication was abortive in macrophages and foam cells and the evidence that the over-reactive inflammatory response to SARS-CoV-2 is orchestrated by macrophages in other tissues9,14,27, we investigated the immune response of macrophages and foam cells to SARS-CoV-2. Differential gene expression analysis of RNA-seq data from infected macrophages and foam cells identified shared and unique transcriptional signatures (Figure 2g). As expected, the 1254 shared genes included the SARS-CoV-2 viral genes. Other commonly upregulated genes were involved with antiviral responses and SARS-CoV-2 infection including interferon (IFN) signaling pathways and antiviral processes by type I and II IFN signaling, OAS antiviral response, negative regulation of viral replication and viral life cycle as well as complement activation and cytokine signaling. ISG15 antiviral signaling, which dampens IFN signaling and has been implicated in the hyperinflammatory response associated with COVID-19 severity27,28, was also upregulated in both cell types (Figure 2g; Extended Data Figure 3e). Infected macrophages expressed a unique transcriptional signature associated with classical complement cascade activation, complement cascade (Figure 2g; Extended Data Figure 3f) as well as IFN-γ signaling and its regulation, and IL-27 signaling, which induces IFN/STAT1-dependent genes29 and regulation of cytokine pathways (Figure 2g). We also observed a significant upregulation of certain lysosomal genes in infected macrophages compared to foam cells at 2 and 8 hpi (Extended Data Figure 3g–h), revealing a more robust lysosomal response in macrophages that can contribute to the more efficient viral clearance observed in macrophages. Our analysis showed a significant increase in genes encoding proteins involved in lipid uptake in infected macrophages versus foam cells (Figure 2g; Extended Data Figure 3i). These included CD36, encoding for the CD36 receptor for oxidized low-density lipoprotein (oxLDL), as well as LDLR, encoding low-density lipoprotein receptor which is the primary cholesterol-carrying lipoprotein in plasma and facilitates the uptake of LDL into cells through endocytosis. In contrast, genes encoding proteins associated with lipid efflux (i.e., ABCG1 and ABCA1) were significantly downregulated in infected macrophages compared to foam cells (Extended Data Figure 3i). Lipids and lipid droplets play crucial roles in viral life cycle, including SARS-CoV-230–32. By promoting lipid uptake and accumulation in macrophages, SARS-CoV-2 may create a cellular environment that is favorable for viral infection.
The unique infected foam cell transcriptional signature included 570 genes (Figure 2g; Extended Data Figure 2e). The top upregulated signaling pathways involved the downregulation of MHC-I, a response induced by many viruses to evade immune recognition33,34. Infected foam cells also upregulated processes and signaling pathways involved in the regulation of lipid metabolism, that may facilitate viral entry and replication32.
The activation of a type I IFN response in both of SARS-CoV-2-infected macrophages and foam cells was consistent with the upregulation of several genes, with the strongest response observed at 8 hpi (Figure 2h; Extended Data Figure 3e). In macrophages, significantly upregulated genes included IRF1, a transcriptional activator of IFN alpha and beta as well as genes induced by IFN alpha, beta, and gamma; MX1, encoding a GTP-binding protein Mx1 that has antiviral activity against RNA viruses including SARS-CoV-235,36; as well as STAT1 and STAT2. IRF7, known to induce type I IFN responses, and the viral restriction factor IFITM137 were also upregulated in SARS-CoV-2-infected macrophages (Figure 2h). The IFN response in SARS-CoV-2-infected foam cells was similar, although there was a delayed upregulation of MX1 that occurred only at 48 hpi, consistent with the higher viral RNA and protein accumulation seen in foam cells, and only foam cells upregulated IRF4, which inhibits MyD88 signaling and is expressed in M2-like macrophages38. Moreover, the expression of STAT1 and STAT2 were not significantly increased (Figure 2h), suggesting a distinct IFN-induced JAK/STAT signaling regulation in infected macrophages. A direct comparison between infected macrophages and infected foam cells confirmed a stronger IFN response in macrophages compared to foam cells with a significant upregulation of JAK1 at 2 hpi, and of MAVS, encoding Mitochondrial antiviral-signaling protein that is essential for antiviral innate immunity39–41, at 8hpi (Figure 2i).
The analysis of the dynamic changes in the IFN-I response between macrophages and foam cells using an IFN and SARS-CoV-2 gene signature scoring method (see Methods) revealed important kinetic differences in the IFN response and SARS-CoV-2 gene expression between macrophages and foam cells (Figure 2J). Although from 2 to 24 hpi there was no significant difference in the SARS-CoV-2 genome score between infected macrophages and foam cells, at 48 hpi a significant reduction in the SARS-CoV-2 genome score was observed in macrophages but not in foam cells, indicative of differential viral RNA stability. In parallel, the IFN-I score increased in both infected macrophages and foam cells, but foam cells displayed a significant decline in the IFN-I score at 24 and 48 hpi. As it is well-established that type I interferon reduces SARS-CoV-2 infection and replication, thereby promoting viral clearance42–45, the robust and sustained type I IFN response in macrophages likely contributes to decreased viral persistence. In addition, macrophages and foam cells did not show differences in apoptotic pathways activation such as Caspase-8 secretion (Extended Data Figure 3j). Several pro-inflammatory and proatherogenic cytokine and chemokine genes were significantly upregulated in both infected macrophages and foam cells (Extended Data Figure 4a–b). These included CCL7, TNFSF10 (also known as TRAIL), CXCL10, and CCL3. Infected macrophages uniquely upregulated CXCL9, CXCL12, and CLEC11A, whereas foam cells upregulated genes included TNFA, CCL5 and CCL2.
To further investigate the inflammatory profile of macrophages and foam cells in response to SARS-CoV-2 infection, we quantified the secretion of cytokines and chemokines for up to 48 hpi (Figure 3; Extended Data Figure 4b). Several pro-inflammatory and pro-atherogenic cytokines (e.g., IL-6, CCL7, IL-1β, β-NGF, IL-3, LIF, MIF, CXCL-9, IFN-α and IFN-γ) were released by both infected macrophages and foam cells (Figure 3a). Among these are key cytokines known to trigger ischemic cardiovascular events, including IL-6, a candidate therapeutic target in ongoing clinical trials46 and IL-1β, whose inhibition reduced secondary cardiovascular events in high-risk post-myocardial infarction patients47 (Figure 3b). Moreover, the release of macrophage migration inhibitory factor (MIF), a pro-atherogenic and inflammatory cytokine that has been implicated in intima-media thickening, lipid deposition and plaque instability48, was increased in both cell types after infection. This analysis also revealed differential expression patterns of secreted cytokines by macrophages and foam cells in response to SARS-CoV-2 infection, suggesting distinct inflammatory responses between macrophages and foam cells. For example, the proatherogenic cytokine IL-1849 was significantly released by infected macrophages but not foam cells, whereas IFN-α2, a type I IFN response cytokine which inhibits viral replication50, was significantly released by infected foam cells but not macrophages (Extended Data Figure 4b). Importantly, we detected significant differences in release of many of these cytokines over time between uninfected macrophage and foam cells, suggesting that differences in the baseline inflammatory status of each cell type influence their responses to the virus (Figure 3b; Extended Data Figure 4b).
Figure 3: Analysis of cytokine release dynamics after SARS-CoV-2 infection.
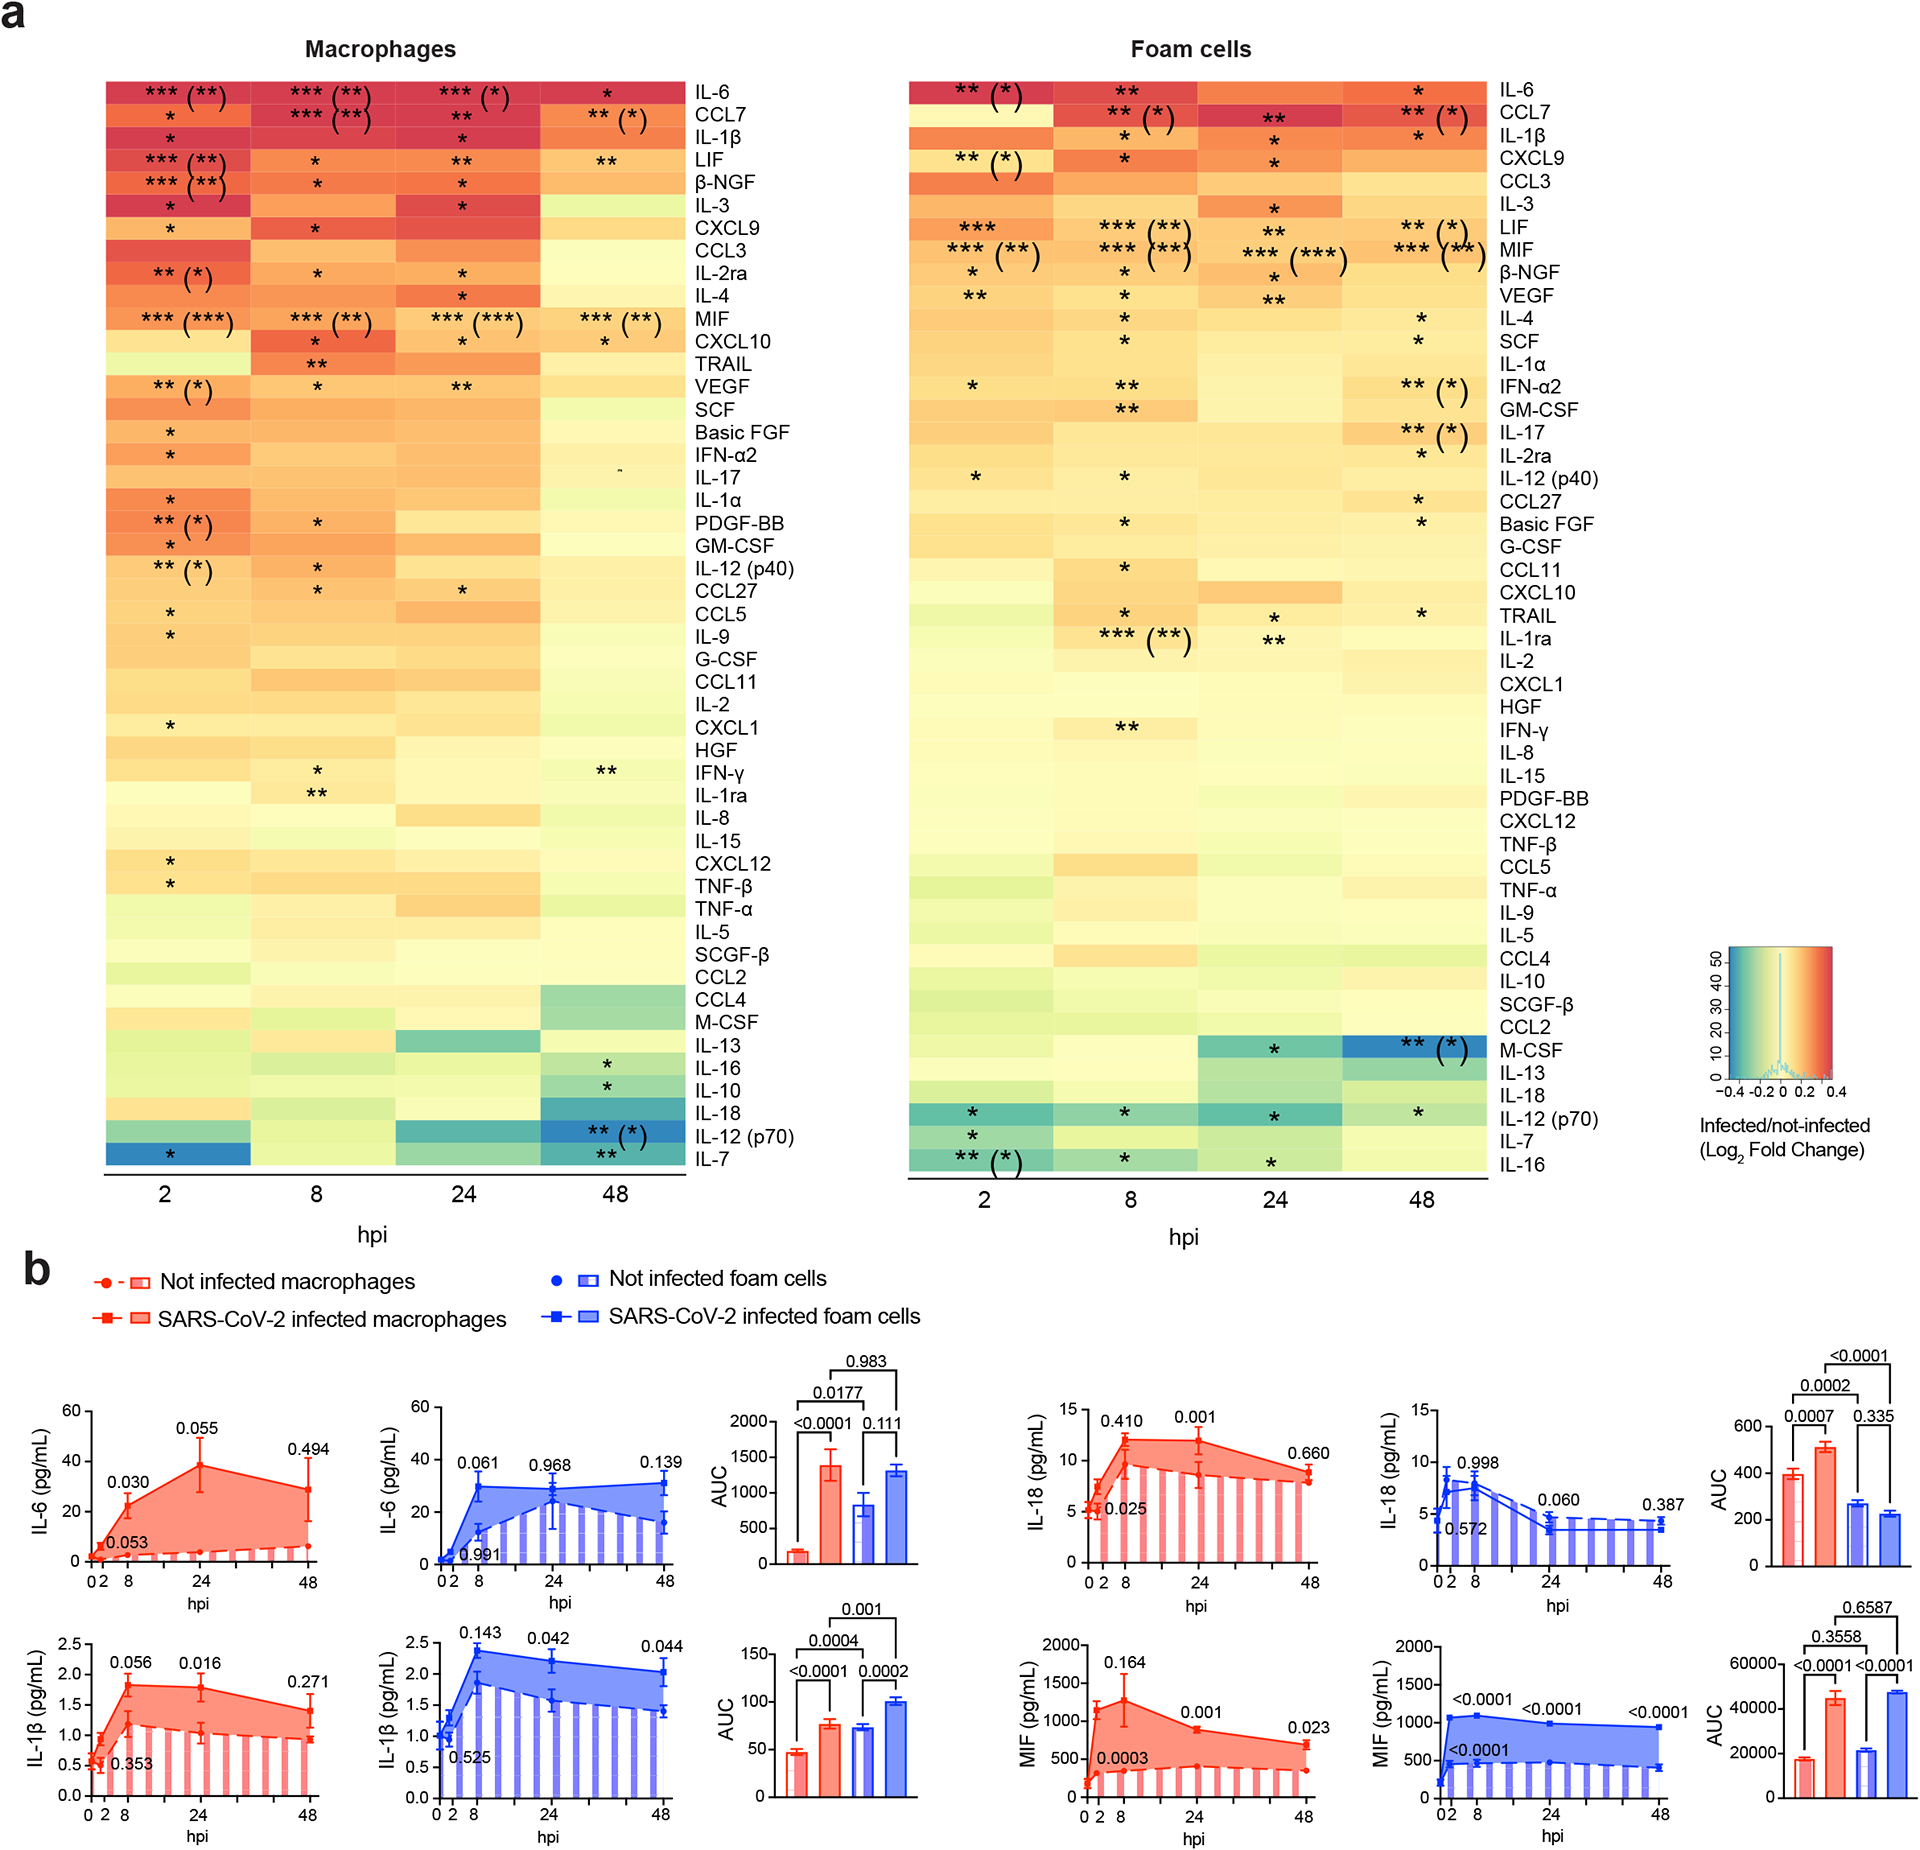
a) Heat map of cytokines and chemokines secreted from SARS-CoV-2-infected macrophages and foam cells. Data are shown as log2FC of infected versus uninfected cells. P values were calculated by two-tailed unpaired t-test, *P < 0.05; **P < 0.01; ***P < 0.001. Adjusted P values (Benjamini–Hochberg method) are presented in parentheses. b) Kinetic plots show the AUC of cytokines secreted by SARS-CoV-2-infected macrophages and foam cells versus non-infected cells (n = 4 biological replicates, technical duplicates). For AUC comparisons, one-way ANOVA after Tukey’s multiple comparisons test was performed. Kinetics differences were evaluated by two-way ANOVA followed by Sidak’s multiple comparisons test. Data are presented as mean ± s.e.m. Bar plots show the quantification of the AUC for each cytokine. One-way ANOVA statistical analysis after Tukey’s multiple comparisons test was performed.
SARS-CoV-2 boosts inflammation of atherosclerotic vascular explants
To determine whether the macrophage and foam cell proinflammatory response to SARS-CoV-2 we observed in vitro also occurs in human vascular tissue, we infected human atherosclerotic vascular explants with SARS-CoV-2 (USA WA1//2020) (Figure 4a). SARS-CoV-2 vRNA encoding the structural proteins spike (S), envelope (E), membrane (M), and nucleocapsid (N), as well as ORFs encoding nonstructural accessory proteins, were detectable in infected plaques as early as 24 hpi and for up to 72 hpi (Figure 4b). S and N protein expression and virus-like particles were observed in infected atherosclerotic plaques (Extended Data Figure 5a–b). However, viral titer decreased over time with no infectious virus isolated from the conditioned media of either infected cells or tissues using a plaque assay up to 72 hpi, suggesting abortive replication in the vascular explants (Figure 4c). Regardless, SARS-CoV-2 infection induced a strong type I IFN transcriptional response in infected plaques reflected by the early upregulation of transcription factors and genes involved in response to viral infections such as IRF7, JAK1, IFITM1 at 2hpi; IFNAR, IRF4, IRF1, MX1, PTPN6, IFNA1, STAT1 and STAT2 at 24 hpi; IRF1, IFNA7, IFI35 at 48 hpi, and IFNA16 at 72hpi. Genes involved in the negative regulation of IFN signaling (i.e., SOCS1 and SOCS3) were also upregulated likely reflecting the activation of regulatory signaling (Figure 4d). Interestingly, SARS-CoV-2 infection triggered the expression of viral receptors and entry factors such as ACE2, NRP1, FURIN, TMPRSS4, TMPRSS11A and CTSB at 24 hpi, suggesting that the virus facilitates its own entry in host cells (Figure 4e). SARS-CoV-2 also initiated a transcriptional proinflammatory response that largely recapitulated that seen in cultured macrophages and foam cells. This included the upregulation of proatherogenic cytokines such as IL1B, IL6, MIF, ILB, TNF, IL7, CCL5, as well as chemokines like CCL2, CCL3, CCL4, CCL5, CXCL9, CCL27, CCL7, CCL6, CXCL1, CXCL8, CXCL9 and CXCL12. Anti-inflammatory cytokines such as IL10 and IL13 were down regulated further supporting a strong proatherogenic inflammatory response to SARS-CoV-2 infection in human atherosclerotic plaques (Figure 4f; Extended Data Figure 5c). Analysis of the secretome of infected plaques revealed similar proinflammatory protein changes (Figure 4g). SARS-CoV-2 infected plaques released several proatherogenic cytokines and chemokines including IL-6, IL-1β, and IFN-α2, as well as CCL2, CCL3, CCL4 and CCL7 (Figure 4g). The release of cytokines and chemokines was significantly higher at 72 hpi. However, only IL-6, IL-1β, IFN-α2 and CCL3 were secreted at significantly higher amounts over time calculated as area under the curve (AUC) (Figure 4h; Extended Data Figure 5d). A stronger inflammatory response was seen in SARS-CoV-2 infected atherosclerotic plaques versus non-atherosclerotic paired surgical margins, as shown by the significantly higher release of several cytokines (e.g., IFN-γ, IFN- α2, IL-1β, IL-17, TNF-α, TNF-β, CCL3, CCL4, CCL7) from infected plaques mainly at 48 hpi (Figure 4i). These findings suggest that SARS-CoV-2 infection triggers a hyperactivated immune response mainly within atherosclerotic lesions, a response that could contribute to the increased risk of ischemic cardiovascular events in COVID-19 patients with underlying atherosclerosis.
Figure 4: Host immune response to SARS-CoV-2 infection of human atherosclerosis vascular explants.
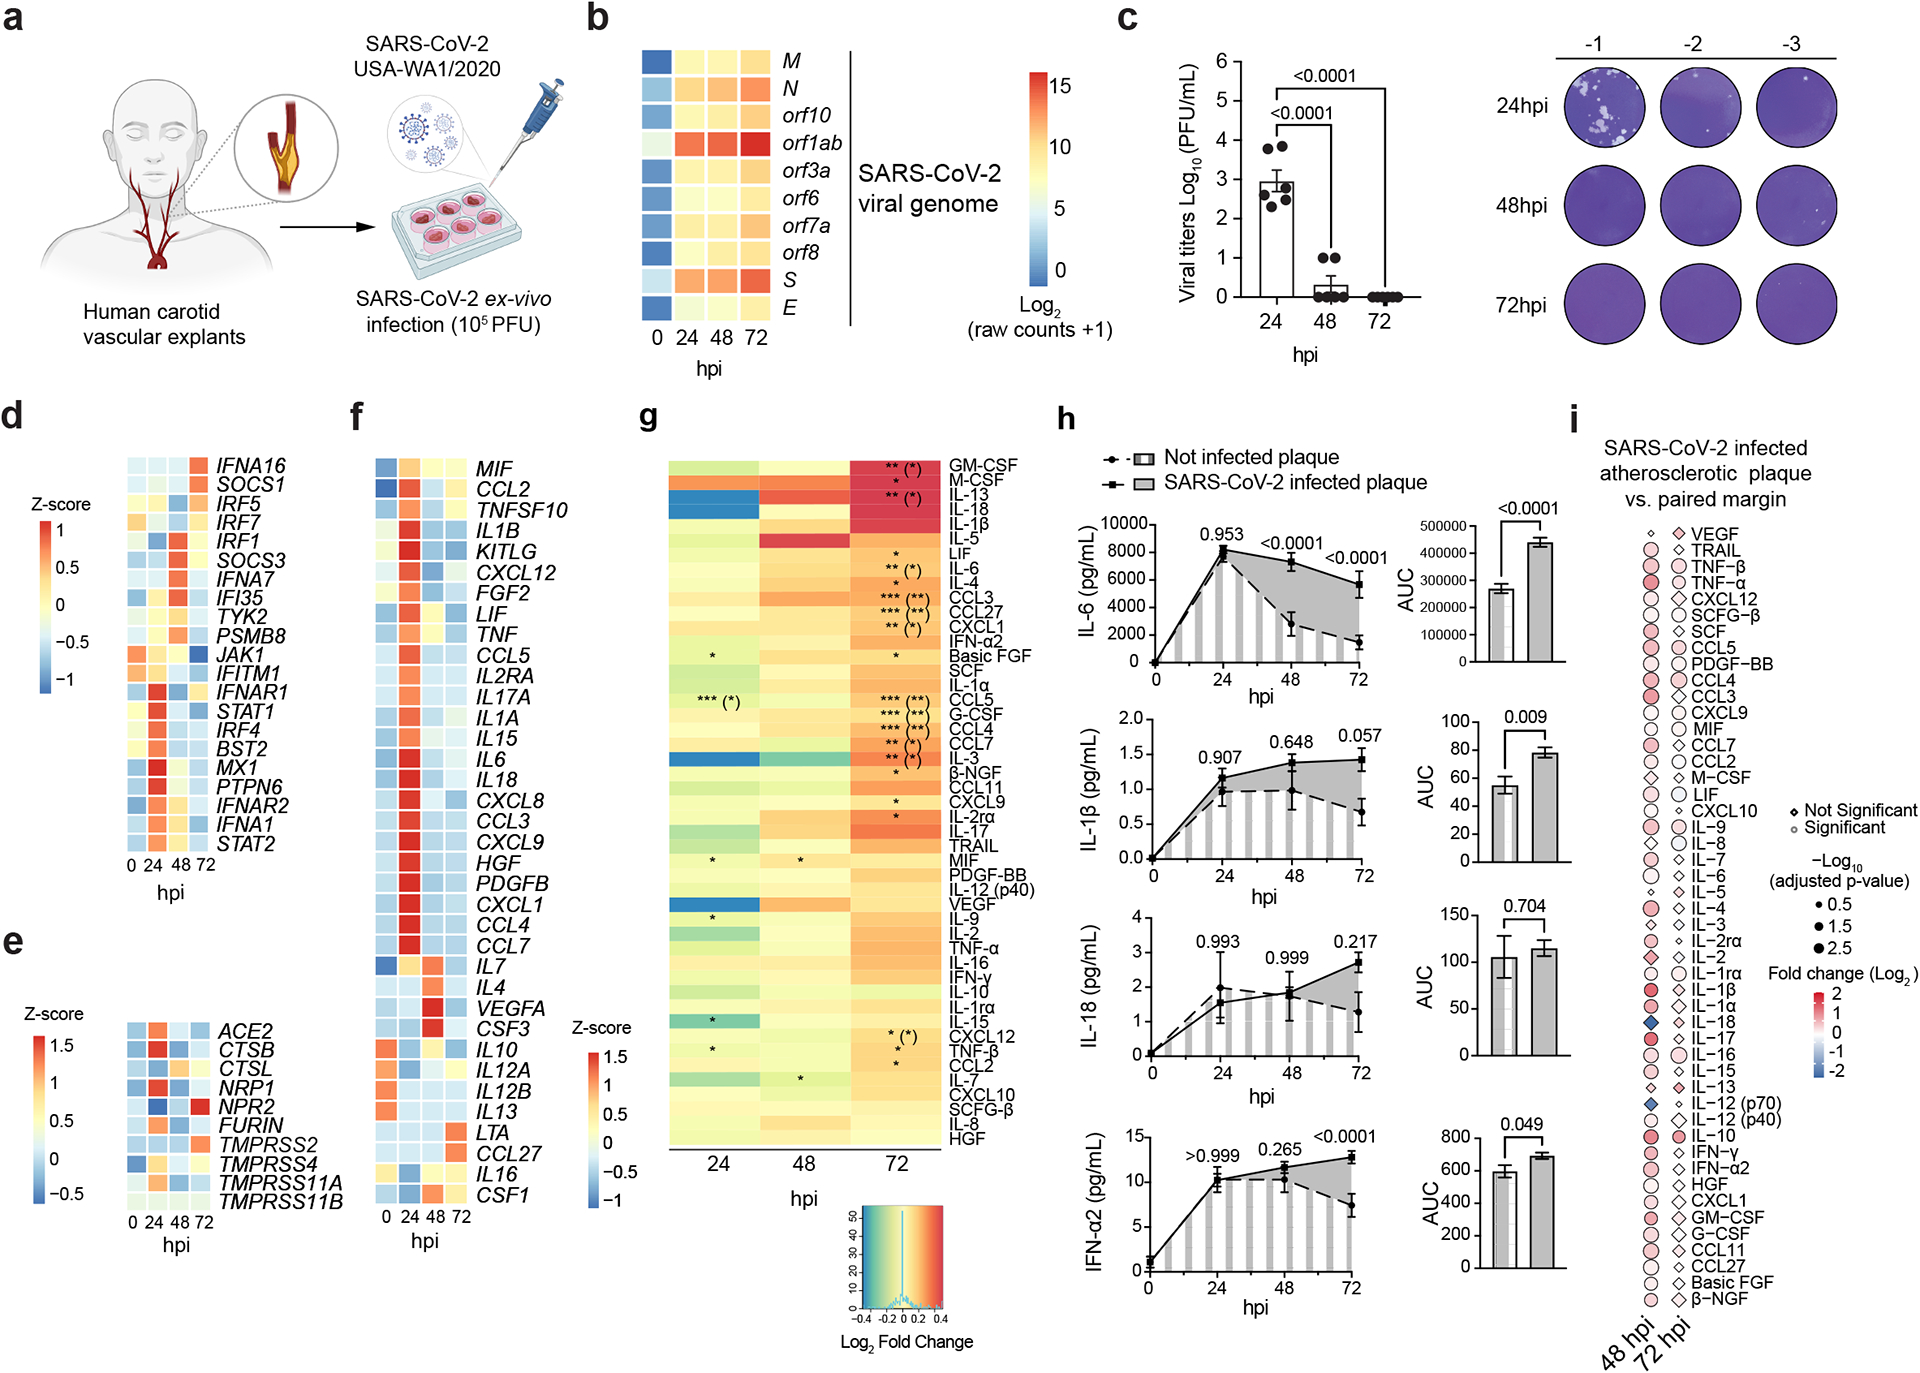
a) Schematics of experimental approach of human carotid vascular explants infection with SARS-CoV-2. b) Heat map of SARS-CoV-2 viral reads in carotid vascular explants at baseline (0 hpi), 24 hpi, 48 hpi and 72 hpi. c) Infectious viral titer quantification of SARS-CoV-2-infected carotid plaque culture supernatants (n = 3 biological samples, technical duplicates). Data are presented as mean values ± s.e.m. One-way ANOVA followed by Tukey’s post hoc test was performed. d) Heat map showing the standardized z-scored expression of IFN response genes in SARS-CoV-2-infected carotid vascular samples at different times after infection. e) Heat map of standardized z-scored expression of selected host viral receptors and entry factors in SARS-CoV-2-infected human carotid vascular samples. f) Heat map of standardized z-scored gene expression of cytokine and chemokine genes in SARS-CoV-2-infected human carotid vascular explants at different times after infection. g) Heat map of cytokines and chemokines secreted from SARS-CoV-2-infected human atherosclerotic plaques. Data are shown as log2FC of infected versus non-infected samples. P values were calculated by two-tailed paired t-test, *P < 0.05; **P < 0.01; ***P < 0.001. P values in parentheses were adjusted using the Benjamini–Hochberg method. h) Kinetic plots show the AUC of cytokines and chemokines secreted by non-infected or SARS-CoV-2-infected carotid plaques (n = 3 donors, technical duplicates). Data are presented as mean values ± s.e.m. Two-way ANOVA statistical analysis after Sidak’s multiple comparisons test was performed. Paired t-test was performed to compare the AUC of two groups. i) Plot showing the relative expression of secreted cytokines and chemokines between SARS-CoV-2-infected atherosclerotic plaque versus vascular margins. Relative expression is represented in log2FC colored scale. Statistical significance is expressed as dot size. Statistically significant values are represented as circles, and non-significant changes are represented as diamonds. P values were calculated by two-tailed unpaired t-test. P values were adjusted using the Benjamini–Hochberg method.
NRP1+ macrophages increase plaque susceptibility to SARS-CoV-2
To elucidate the vascular susceptibility to SARS-CoV-2 infection, we evaluated the expression of the main viral entry receptors and co-factors in the aorta, coronary and tibial arteries using gene expression data publicly available from the Genotype-Tissue Expression (GTEx) project (gtexportal.org). The lung, heart tissue and whole blood were also included in this analysis (Extended Data Figure 6a–b). We specifically focused on ACE2, encoding the first reported receptor for SARS-CoV-2 entry into human cells, neuropilins (NRP1, NRP2) and the proteases TMPRSS2, FURIN, Cathepsin B (CTSB) and Cathepsin L (CTSL), required to cleave the S protein for viral entry and replication51–54. Bulk RNA-seq analysis showed a similar expression pattern for ACE2, NRP1, NRP2, FURIN, and CTSB and CTSL in the aorta, coronary and tibial arteries compared to the lung, with the exception of TMPRSS2, which was expressed at lower levels in the arteries (Extended Data Figure 6b).
To investigate the cellular expression of SARS-CoV-2 receptor and entry factors in the human atherosclerotic tissue, we performed an integrated scRNA-seq analysis of human carotid plaques from 10 patients undergoing carotid endarterectomy and atherosclerotic coronary data obtained from 7 coronary samples from 4 heart transplant cases publicly available in GEO (GSE131780; Figure 5a)15. The two datasets were merged using the Harmony algorithm, resulting in 16 subclusters of immune cells that corresponded to all major immune population infiltrating human atherosclerotic plaques (Extended Data Figure 6c). The SARS-CoV-2 entry receptors and host entry factors such as NRP1, a SARS-CoV-2 receptor that can bind FURIN-cleaved S protein to facilitate SARS-CoV-2 viral entry, and the proteases CTSB and CTSL were highly expressed in myeloid subclusters, while ACE2 and the transmembrane serine proteases TMPRSS2, TMPRSS4, TMPRSS11A, and TMPRSS11B were either undetectable or expressed at low levels (Extended Data Figure 6d). Based on this observation, we subclustered myeloid cells (Figure 5b, Extended Data Figure 6e) and identified 2 clusters of dendritic cells, 3 clusters of monocytes/macrophages, 1 cluster of mixed myeloid cells and 4 clusters of macrophages/foam cells that were annotated based on the expression of canonical markers (Extended Data Figure 6f). To identify significant differences in the abundance of myeloid cells between carotid and coronary arteries we performed Milo differential neighborhood abundance testing55. This analysis revealed that TREM2high macrophages were enriched in coronary tissue, whereas VCAN+ monocytes/macrophages and CD1c+ DCs were enriched in carotid samples. CD16+ monocytes, inflammatory monocyte/macrophages, IL1B DCs and CD36+ mixed myeloid were exclusively present in carotid samples, whereas LYVE1+ macrophages present in coronaries. SPP1+ macrophages were present in both tissues. (Figure 5c). Overall, NRP1 was strongly expressed in TREM2+, SPP1+, LYVE1+, and interferon response genes (ISG)+TREM2+ macrophages, clusters that also expressed FURIN. ACE2 and TMPRSS2 were undetectable in the analyzed myeloid cells (Figure 5d). NRP1 and FURIN gene expression was higher and in human atherosclerotic plaques compared to paired normal margins (Figure 5e), suggesting a key role for NRP-1 in mediating SARS-CoV-2 infection of the atherosclerotic vasculature. Spatial RNA-FISH analysis of human coronary autopsy specimens from COVID-19 patients confirmed that macrophages expressing NRP1 (CD68+NRP1+ cells) infiltrated coronary lesions, and that these cells also expressed SARS-CoV-2 S vRNA and the antisense strand of the S gene, indicating viral replication (Figure 5f–g). A higher number of NRP1+ macrophages expressing the antisense strand of the S gene were found in PIT coronary lesions, consistent with the greater susceptibility of PIT lesions to infection (Figure 5g).
Figure 5: Single-cell expression of SARS-CoV-2 receptor and entry factors in human atherosclerotic tissue.
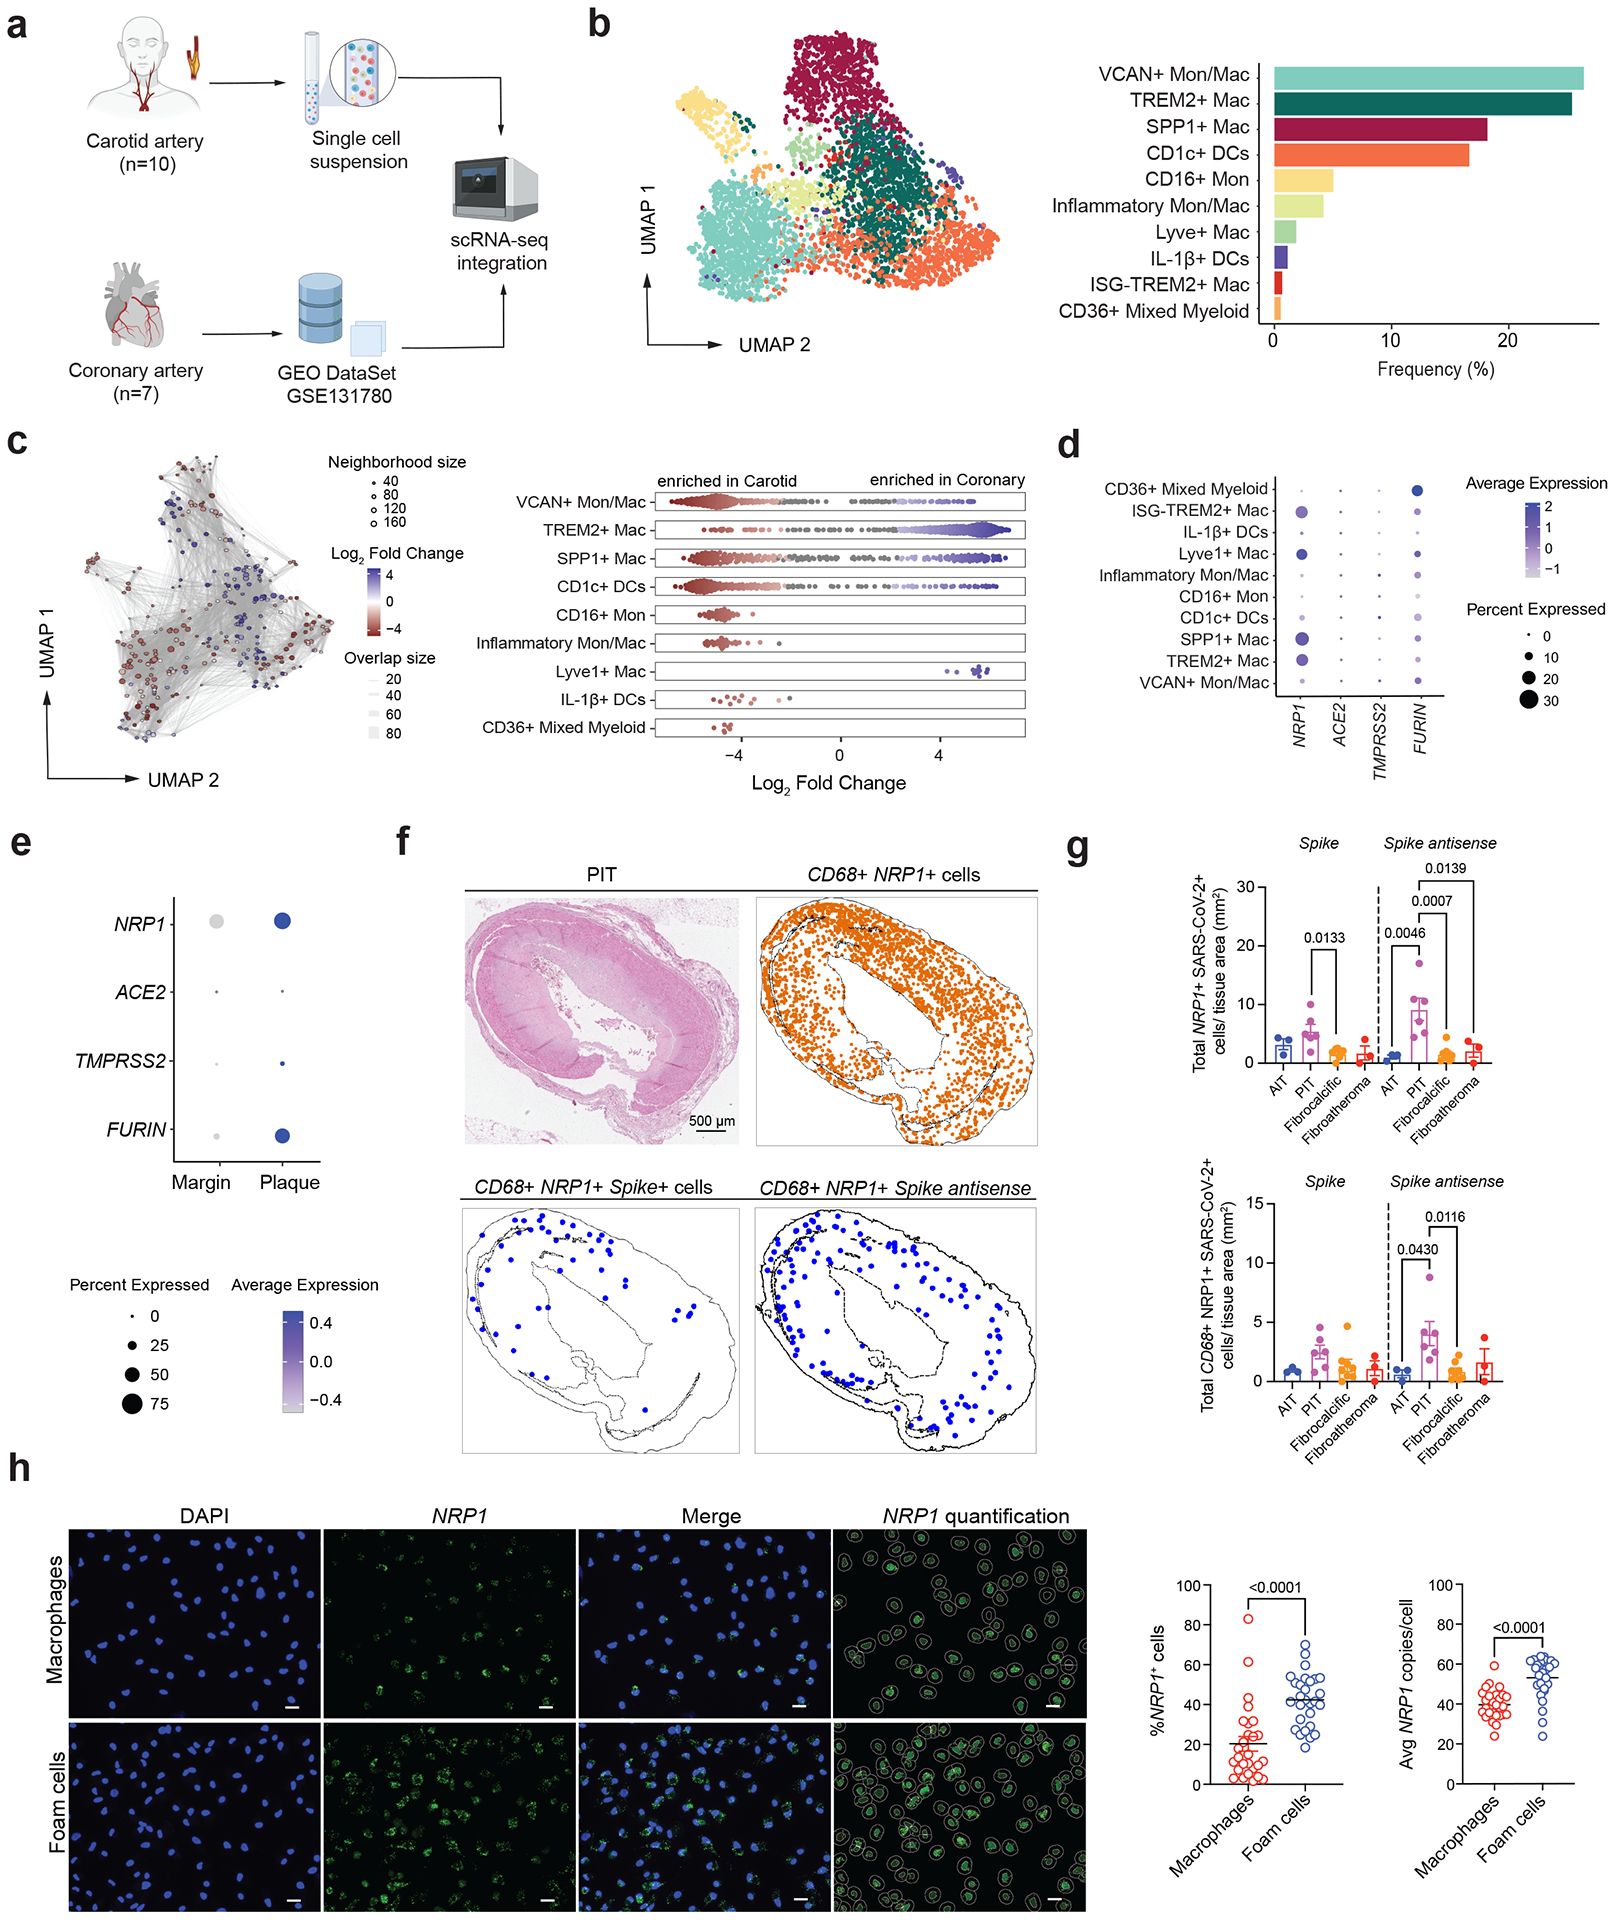
a) scRNA-seq of human carotid (n = 10) and coronary (GSE131780) (n = 7) tissue samples. b) UMAP visualization of myeloid cell subclusters from coronary (1,960 cells) and carotid (2,900 cells) samples. Bar plot shows the frequency of each myeloid cluster. c) Neighborhood graph of the results from MiloR differential abundance testing. Nodes represent neighborhoods, colored by their log2FC between carotid (red) and coronary (blue) samples. Non-differential abundance neighborhoods are in white (FDR = 10%), and node size reflects the total number of cells in each neighborhood. Beeswarm plots show the log2FC distribution of neighborhoods between tissue type (FDR = 10%). d) Dot plot of the SARS-CoV-2 viral entry factor average gene expression and percent of expression in each myeloid subcluster. e) Dot plots showing the frequency of cells expressing SARS-CoV-2 viral entry factors colored by average expression in atherosclerotic plaque lesions and paired vasculature margins. f) Representative images of H&E and spatial analysis of PIT coronary sample showing the location of CD68+NRP1+ cells, CD68+NRP1+ SARS-CoV-2 S+ or S antisense+ cells. g) Bar plots showing total NRP1+ SARS-CoV-2 vRNA+ and CD68+NRP1+ SARS-CoV-2 vRNA+ cells normalized by tissue area (mm2) in AIT (n = 3), PIT (n = 6), fibrocalcific (n = 8) and fibroatheroma (n = 3) coronaries. h) Representative images and RNA-FISH quantification of frequency of NRP1+ cells and average NRP1 copies per cell in non-infected macrophages (n = 27) and foam cells (n = 28). Scale bars, 20 μm. Statistical analysis was performed using unpaired two-tailed Student’s t-test. Avg, average; Mac, macrophages; Mon, monocytes.
Given that NRP1 was highly expressed in TREM2hi macrophages, which are considered foamy plaque macrophages56, and it was significantly higher in foam cells versus macrophages in vitro (Figure 5h), we performed additional experiments using silencing RNA (siRNA) to specifically inhibit NRP-1 expression and investigate its impact on SARS-CoV-2 infection (Figure 6a–b and Extended Data Figure 7a–f). We achieved efficient reduction (~80%) of NRP1 gene expression in both macrophages and foam cells, which was confirmed by western blotting and RNA scope analysis (Extended Data Figure 7a–d; Supplementary Figure 2). Upon NRP1 silencing of infected cells, we observed a significant decrease in the frequency of SARS-CoV-2 S antisense+ macrophages and foam cells, as well as a reduced frequency of SARS-CoV-2 S+ foam cells (Figure 6a; Extended Data Figure 7e). These findings were confirmed using EG 00229, a small molecule that prevents SARS-CoV-2 binding to the B1 domain of NRP-1 and reduces SARS-CoV-2 infection of cell lines53,54 (Figure 6b; Extended Data Figure 7f).
Figure 6: Abrogation of NRP-1 mediated SARS-CoV-2 infection.
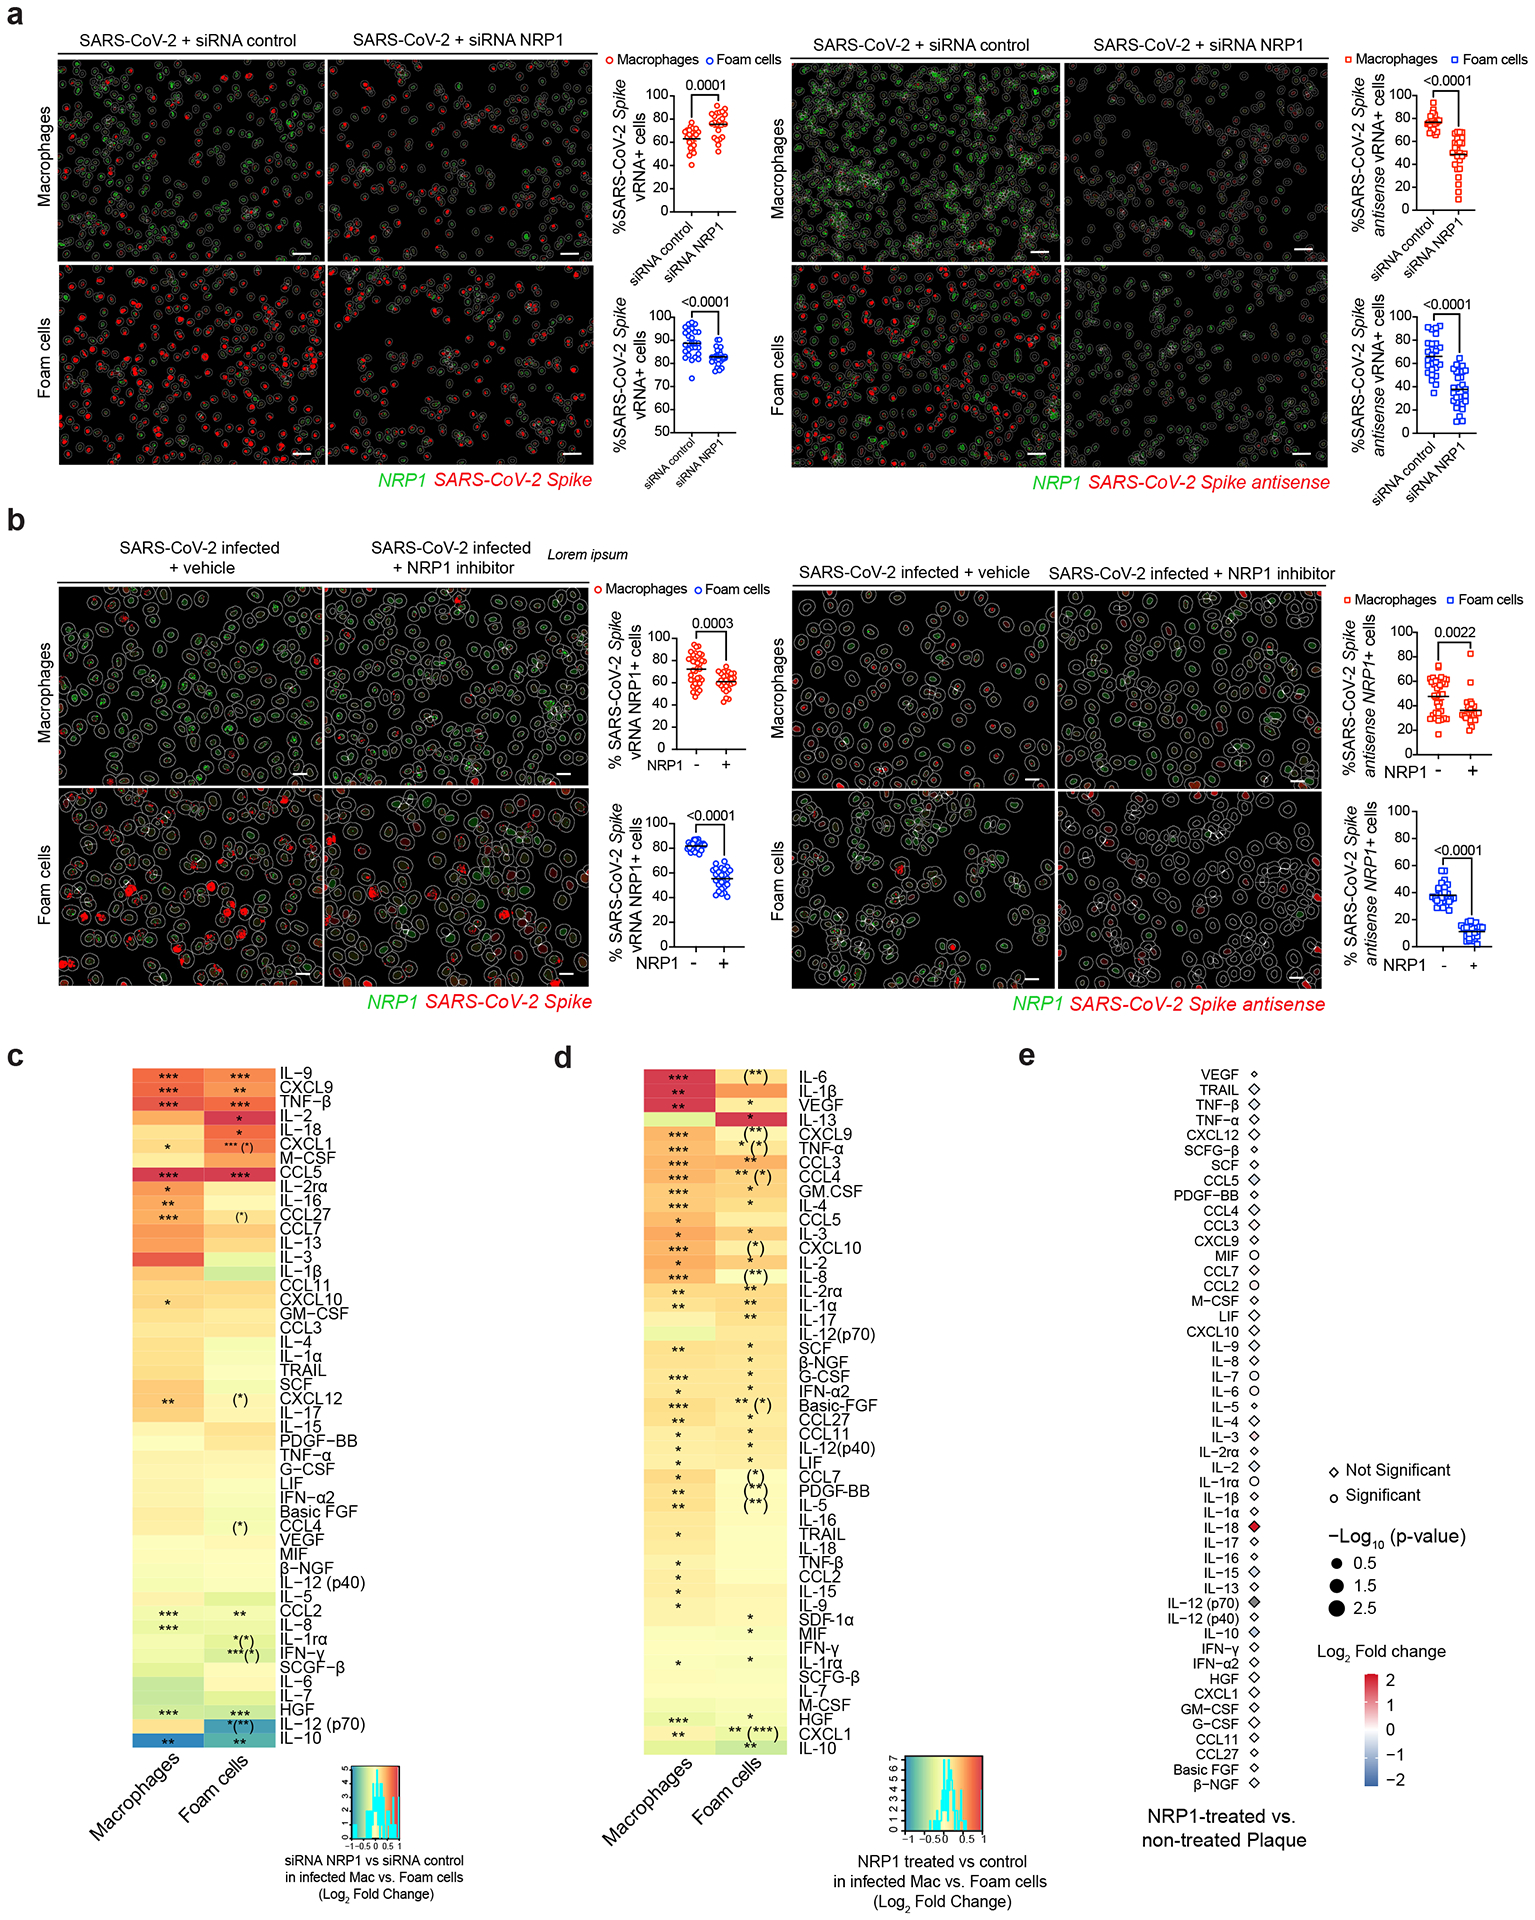
a) Representative images of AI-based RNA-FISH quantification showing NRP1 RNA, SARS-CoV-2 S and S antisense+ cells. Scale bars, 50 μm. Quantification of the frequency of SARS-CoV-2 S+ and SARS-CoV-2 S antisense+ cells in macrophages and foam cells treated with non-targeting siRNA control or siRNA NRP1 at 24 hpi. Data are presented as mean values ± s.e.m. Statistical analysis was performed using unpaired two-tailed Student’s t-test. b) Representative images of RNA-FISH quantification showing NRP1 RNA, SARS-CoV-2 S and S antisense+ cells. Scale bars, 20 μm. Quantification of the frequency of SARS-CoV-2 S+ and SARS-CoV-2 S antisense+ cells in macrophages and foam cells with and without NRP1 inhibition (EG00229 trifluoroacetate) at 24 hpi. c) Heat map of differentially secreted cytokine and chemokine levels from SARS-CoV-2-infected macrophages and foam cells (n = 4–5) after treatment with siRNA control or siRNA NRP1 at 24 hpi. Adjusted P values < 0.05 were considered significant. Asterisk indicates an adjusted P value < 0.05 for the comparison of SARS-CoV-2 infected and treated with NRP1 siRNA versus infected and siRNA control. Asterisks in parentheses indicate nominal P < 0.05 for the comparison between macrophages versus foam cells, *P < 0.05; **P < 0.01; ***P < 0.001. d) Heat map of differentially secreted cytokine and chemokine levels from SARS-CoV-2-infected macrophages and foam cells after NRP1 blocking (EG00229 trifluoroacetate). Results are shown as log2FC between infected and non-treated conditions. Adjusted P values < 0.05 were considered significant. Asterisk indicates an adjusted P value < 0.05 for the comparison of SARS-CoV-2 infected and treated versus infected and vehicle-treated conditions. Asterisks in parentheses indicate nominal P value < 0.05 for the comparison between macrophages versus foam cells, *P < 0.05; **P < 0.01; ***P < 0.001. e) Plot showing the relative expression of secreted cytokines and chemokines from NRP1 blocking (EG00229 trifluoroacetate) treated versus untreated SARS-CoV-2-infected atherosclerotic plaques at 48 hpi. Relative expression is represented in log2FC colored scale. Circles represent statistically significant results, and non-significant changes are represented as diamonds.
We next asked whether NRP1 silencing or blocking using EG 00229, which reduced the infection of macrophages and foam cells in vitro, would reduce the inflammatory response to SARS-CoV-2. The results revealed that NRP1 silencing increased the baseline inflammatory state of uninfected macrophages, and to a less extent of foam cells, as evidenced by the release of several cytokines and chemokines (Extended Data Figure 8a). Importantly, this inflammatory state persisted upon SARS-CoV-2 infection, with infected NRP1-silenced cells exhibiting higher levels of cytokines induced by the virus, such as IL-6 and MIF, compared to non-infected NRP1-silenced cells (Figure 6c; Extended Data Figure 8a). In foam cells, NRP-1 silencing had more modest effects on both uninfected and infected cells, with the release of inflammatory cytokines primarily driven by SARS-CoV-2 infection (Figure 6c; Extended Data Figure 8a). The results are consistent with the anti-inflammatory functions of NRP-1 in myeloid cells, and increased inflammation when NRP1 expression is lost57,58. Interestingly, the use of EG00229 yielded similar inflammatory patterns, but some differences may suggest potential off-target effects associated with this inhibitor (Figure 6d). To investigate the potential modulation of TGF-ß by NRP1 inhibition, we examined the secretion of TGF-ß in infected macrophages and foam cells (Extended Data Figure 8b). Although in macrophages, TGF-ß expression was unaffected by SARS-CoV-2 infection and the inhibition of NRP-1 did not influence its expression, we observed an increase in TGF-ß levels in infected foam cells due to SARS-CoV-2 infection, that was partially reduced by NRP-1 inhibition. NRP-1 blocking increased the release of secreted IL-6 and CCL2 from SARS-CoV-2 infected human atherosclerotic vascular explant tissue. The release of IL-1β and IL-18 was also increased but not significantly (Figure 6e). Taken together, these findings suggest that atherosclerotic plaques are particularly susceptible to SARS-CoV-2 infection, which triggers an hyperactivated immune response that could contribute to the increased risk of ischemic cardiovascular events in COVID-19 patients with underlying atherosclerosis. Although inhibition the host entry factor NRP-1 expressed by macrophages infiltrating coronary lesions in humans reduced SARS-CoV-2 infection, it also induced a strong inflammatory response, indicating that alternative strategies will be necessary to prevent SARS-CoV-2 infection of coronary vessels and its downstream consequences.
Discussion
Although SARS-CoV-2 is considered a respiratory virus, COVID-19 patients have been shown to be at increased risk of cardiovascular complications, including myocardial infarction and stroke. Our study provides evidence of SARS-CoV-2 presence in human coronary vasculature, and demonstrates viral tropism for vascular lesional macrophages in individuals with severe COVID-19. We found evidence of SARS-CoV-2 replication in all analyzed human autopsy coronaries regardless of their pathological classification, although viral replication was highest in pathological intima thickening (PIT) coronary lesions, early-stage lesions that progress to more advanced atherosclerotic plaques11,12. It is well established that as lesions progress to more advanced stages, such as fibroatheromas and fibrocalcific plaques, macrophages and foam cells become dysfunctional due to prolonged exposure to lipids and an inflammatory microenvironment11,12. In early PIT lesions, macrophages attempting to clear inflammatory lipids (e.g., oxidized low density lipoproteins) accumulate excess cholesterol and triglycerides within cytoplasmic lipid droplets12 may be more prone to viral infection. SARS-CoV-2 showed a stronger tropism for the arterial lesions than corresponding perivascular fat, which was related to the degree of macrophage infiltration, consistent with the higher viral replication in PIT lesions and fibroatheromas, where macrophages are more prevalent. Others have previously reported the presence of SARS-CoV-2 RNA within the heart, and the aorta, as well as other distant organs8,14,59,60. Our data conclusively demonstrate that SARS-CoV-2 is capable of infecting and replicating in macrophages within the coronary vasculature of patients with COVID-19. Furthermore, SARS-CoV-2 preferentially replicates in foam cells compared to other macrophages, due to a reduced type I interferon response that leads to vRNA and viral protein accumulation, suggesting that these cells might act as reservoir of SARS-CoV-2 viral debris in the atherosclerotic plaque. Our results demonstrate that while type I interferon response remained elevated in SARS-CoV-2 infected macrophages indicating a sustained antiviral state, infected foam cells only exhibited a transient expression of type I interferon gene expression. Together with the reduced expression of lysosomal genes and lower inflammatory response to SARS-CoV-2 infection, the reduced type I interferon may contribute to the persistence of SARS-CoV-2 observed in the analyzed atherosclerotic autopsy specimens. Macrophages residing vascular tissue can undergo self-renewal, contributing to their long-term maintenance61 and in heart transplant studies, it has been shown that cardiac macrophages have a half-life of 8.8 years62. Therefore, it is possible that macrophages may act as reservoirs of SARS-CoV-2 viral RNA in atherosclerotic plaques. We also identified infected VSMCs in coronary autopsy specimens. Although the number of infected VSMCs was lower than that of infected macrophages, VSMCs have a half-life of 270–400 days63 and may contribute to SARS-CoV-2 persistence in the arterial wall.
SARS-CoV-2 infection of macrophages and foam cells promoted a strong inflammatory response characterized by release of cytokines implicated in both the pathogenesis of atherosclerosis and increased risk of cardiovascular events such as stroke and myocardial infarction46,47,64. Using an ex vivo model of viral infection of human vascular explants, we found that atherosclerotic tissue could be directly infected by SARS-CoV-2, confirming our observation in COVID-19 patient tissue. As in cultured macrophages and foam cells, SARS-CoV-2 infection of vascular tissue triggered an inflammatory response and induced the secretion of key pro-atherogenic cytokines such as IL-6 and IL-1β. Considering that plaque inflammation promotes disease progression and contributes to plaque rupture, our results provide a molecular basis for how SARS-CoV-2 infection of coronary lesions can contribute to the acute cardiovascular manifestations of COVID-19 such as myocardial infarction3,65. SARS-CoV-2 infection of coronaries was unrelated to pre-existing clinical characteristics, stage of COVID-19 by illness days, duration of hospitalization at the time of death, or co-morbidities. However, we found a higher accumulation of SARS-CoV-2 S and S antisense vRNA in the coronary vasculature of the 3 patients with acute ischemic cardiovascular manifestations, including posterior myocardial infarction (P1) and type II myocardial infarction (P2 and P3). Although, evidence of coronary occlusion was not detected at autopsy for two patients with clinical diagnosis of myocardial infarction, these data suggest that SARS-CoV-2 coronary infection may increase cardiovascular risk. A systematic analysis of Gtex, a multi-tissue gene expression dataset that includes donors who died from cerebrovascular (>22%) and heart disease (>40%), revealed a similar expression pattern of SARS-CoV-2 receptors and co-factors in the human vasculature as that found in the lungs. In particular, while ACE2 expression was low in the aorta and the tibial artery, its expression levels in the coronary artery are comparable to those in the lung, suggesting that the coronary vasculature may be more susceptible to SARS-CoV-2 viral infection than other vascular beds. At the single-cell level, expression of SARS-CoV-2 receptors and factors confirmed our coronary vasculature autopsy findings. Although ACE2 expression was not detectable by scRNAseq, NRP1 and FURIN were highly expressed in two TREM2+ macrophage clusters, known to correspond to plaque foamy macrophages56, as well as in clusters of SSP1+ macrophages and LYVE1+ macrophages. We further found that SARS-CoV-2 infects NRP1+ macrophages within human coronary tissue at autopsy and that viral replication was greater in NRP1+ macrophages present in PIT lesions. Experimentally, both silencing of NRP1 gene and a specific inhibitor of the interaction between the b1 domain of NRP-1 and the SARS-CoV-2 S1 CendR53,54 reduced SARS-CoV-2 infectivity of human primary macrophages and foam cells, confirming that SARS-CoV-2 infection of macrophage and foam cell is in part neuropilin-1 (NRP-1) dependent. However, an aberrant proinflammatory response associated with NRP-1 inhibition limits the potential therapeutic use of NRP-1 inhibitor. This proinflammatory effect, although unexpected in the context of SARS-CoV-2 infection, is consistent with previous findings of a protective role of NRP-1 in sepsis and the increased release of pro-inflammatory cytokines (e.g., IL-6) from NRP-1 null macrophages58.
Overall, our data demonstrate that SARS-CoV-2 replicates in macrophages within human coronaries of patients who died from severe COVID-19. Our study is limited to the analysis of a small cohort of older individual with COVID-19 and pre-existing atherosclerosis and other medical conditions and comorbidities. Therefore, our observations cannot be extrapolated to younger, healthy individuals. Our study is also limited to cases that occurred during the early phases of the COVID-19 pandemic, and the findings that SARS-CoV-2 replicates in the atherosclerotic coronary vasculature is pertinent only to the viral strains that circulated in New York City between May 2020 and May 2021. Despite these limitations, our study highlights the hyperinflammatory response orchestrated by SARS-CoV-2 infected plaque macrophages and foam cells as a mechanistic link between infection of atherosclerotic coronary vessels and acute cardiovascular complications of COVID-19.
Methods
Ethical approval for the use of human autopsy specimens was obtained from the institutional review board (IRB) of NYU Langone Health (NYULH) (IRB i21-01587) in compliance with all relevant ethical regulations. Patients undergoing CEA who signed a written informed consent were enrolled in the ATHERO-IN study approved by the IRBs of the Icahn School of Medicine at Mount Sinai (IRB 11-01427) and NYULH (IRB i21-00429). The reported demographic information and clinical history are de-identified and covered by the patients’ consent to publish such data in compliance with IRB 11–01427 and IRB i21-00429.
Coronary autopsy specimens from COVID-19 patients
Formalin-fixed paraffin-embedded (FFPE) coronary artery specimens (n=27) from 8 deceased patients diagnosed with COVID-19 were obtained from the NYULH and NYU Grossman School of Medicine’s Center for Biospecimen Research and Development (CBRD). Demographic information and clinical history were obtained from the hospital medical records (Supplementary Table 1). Data on the clinical course of the infection and COVID-19 associated pathology were obtained from both the hospital medical records and autopsy pathology reports (Supplementary Table 2).
RNAscope in-situ hybridization
Images were annotated in Phenochart whole slide viewer (Akoya Biosciences). Whole slide scan ‘.qptiff’ files were stamped for InForm batch on Phenochart (version 1.1). Spectral unmixing of all images was performed using InForm’s automated algorithm. The stamped images were processed through InForm (PerkinElmer, version 2.6), and ‘component_data.tif’ files were exported for quantification using the HALO image analysis platform (version 3.5.3577) and HALO AI (version 3.6.4134) (Indica Labs) using the classifier module, neural network classifier module and spatial analysis module. The algorithms used were Area Quantification (version 2.4.2 and version 2.4.3), Area Quantification FL (version 2.3.3 and version 2.3.4), Deconvolution (version 1.1.7 and version 1.1.8) and FISH (version 3.2.3). AI was trained-by-example to classify the regions of the tissue. HALO AI trained Mininet deep learning classifier was used to classify the coronary wall and corresponding perivascular fat in all sections and to remove background autofluorescence. Cell segmentation was performed by training AI nuclei segmentation network classifier with DAPI-stained nuclei on both the stitched images of whole coronary tissue and in vitro experiments’ images. Quantification of the probes was based on color and constant image intensity thresholding, maintaining parameters constant across samples. HALO imaging analysis algorithms and spatial analysis workflow were used to quantify the number of positive dots per cell and the frequency of positive cells divided by total cells.
Immunohistochemistry
H&E and chromogenic IHC were performed by the NYULH CBRD. IHC for the quantification of macrophages was performed on a Ventana Medical Systems Discovery Ultra platform using rabbit anti-human CD68 (ref. 65) (Ventana Medical Systems). Images were acquired in the Vectra Polaris multimodal digital pathology. Histopathology assessment and coronary pathology reports were performed by a blinded clinical cardiovascular pathologist. Quantification of percentage of CD68+ area was performed with the hybrid cell count module of the Keyence BZ-X800 microscope. CD68+ cell count and frequency were obtained using HALO imaging analysis algorithms and AI nuclei segmentation.
Immunofluorescence
Autopsy coronary sections were stained with primary antibodies at 4°C overnight and with secondary antibodies at room temperature for 2 hours, and cell nuclei were stained with DAPI. Autofluorescence was quenched with TrueBlack Lipofuscin Autofluorescence Quencher (Biotium). Cultured macrophages and foam cells were stained with a mouse anti-SARS-CoV-2 nucleoprotein (NP) antibody (ProScience) overnight at 4°C, followed by a goat anti-mouse Alexa Fluor 488 (Invitrogen) for 2 hours at room temperature. Images were acquired using Keyence BZ-X800 microscope . Primary and secondary antibodies used are listed in Supplementary Table 5.
Single-cell RNA sequencing of human carotid arteries
Carotid plaques were obtained from patients undergoing CEA (n = 10) enrolled in the Athero-IN study (IRB 11–01427 and IRB i21-00429). Exclusion criteria for patient enrollment were as follows: active infection, autoimmune diseases, active or recurrent cancer and severe renal failure requiring dialysis. Supplementary Table 4 summarizes the clinical and demographic characteristics of the study cohort. Plaques were classified by a clinical cardiovascular pathologist (N.N.) as fibrocalcific (n = 3) and fibroatheroma (n = 4). Three of 10 plaque tissues were not classified owing to insufficient tissue.
Cell isolation from carotid atherosclerotic tissues
Fresh plaque specimens were placed immediately in DMEM (Gibco) and processed within 30 minutes to obtain single-cell suspension using a digestion protocol previously described66. Briefly, the specimens were washed and digested in DMEM containing 10% Fetal Bovine Serum (FBS, Gibco, Cat. #10082147); collagenase type IV (Sigma, Cat. #C5138) at a final concentration of 1 mg ml−1; and DNase I (Sigma, Cat. #DN25), hyaluronidase (Sigma, Cat. #H3506), collagenase type XI (Sigma, Cat. #C7657) and collagenase type II (Sigma, Cat. #C6885), each at a final concentration of 0.3 mg/ml for 40 minutes in gentle MACS Octo Dissociator (Miltenyi Biotec). The digested tissue was sequentially filtered through 70 μm and 40 μm cell strainers (Fisher Scientific, Cat. #22363547 and Cat. #22363548), and centrifuged at 300 g for 8 minutes. Dead cells were removed with the EasySep Dead Cell Removal (Annexin V) kit (StemCell Technologies, Cat. #17899) and leukocytes were isolated with the EasySep Release Human CD45 positive selection kit (StemCell Technologies, Cat. #100–0105) according to the manufacturer’s instructions. Live cells were counted with the automatic cell counter Cellometer Auto 2000 (Nexcellom) and cells were loaded to the Chromium Controller (10X Genomics). Single cell RNA sequencing (scRNAseq) libraries were prepared using the Chromium Single Cell 3′ Library v3 reagent, Gel Bead and Multiplex Kit, and Chip Kit (10X Genomics). DNA library quantity and quality were measured with Qubit dsDNA HS assay fluorometric assay (Qiagen) and Bioanalyzer (Agilent) and sequenced on NovaSeq 6000 sequencer (Illumina). scRNAseq data from 6 samples were previously published66 and available in Gene Expression Omnibus (GEO) NCBI (GSE224273). Four extra samples were processed to obtain additional scRNA-seq data (GEO NCBI; GSE235437).
Computational analysis of coronary and carotid single-cell RNA sequencing
Cell Ranger Single-Cell Software Suite (version 3.1.0) was used to demultiplex and align to the human genome reference version GRCh38. A total of 20,639 CD45+ cells were analyzed and Cell Ranger outputs from the CEA scRNA-seq data with an average of 104,351 mean reads/cell, and 3,128 median UMI counts/cell. A scRNA-seq dataset (GSE131780) comprising human atherosclerotic coronary samples was obtained from NCBI GEO dataset repository15. A total of 12,200 coronary cells from 7 tissue samples obtained from 4 patients were analyzed. Cell Ranger outputs had an average of 62,328 mean reads per cell, and 2,703 median UMI counts per cell.
The output filtered gene expression matrices were analyzed using the Seurat package (v4.0.3)67. Mitochondrial genes > 10% to > 20%, < 200 genes and <10000 to <20000 UMI’s were filtered out. Gene expression matrices were normalized using SCTransform function and robust Principal Component Analysis was used for integration. The RunPCA function was used to compute the top 30 principal components using variably expressed genes. FindIntegrationAnchors served to identify anchors between carotid samples and were inputted into the IntegrateData function to correct for batch effects. Cells were assigned a cell cycle score using the CellCycleScoring function to regress out unwanted variation. RunUMAP with FindNeighbors and FindClusters functions were used for cell clustering. Integration/co-clustering of carotid and coronary single cells was performed using Harmony68. The dimensionality reduction generated by Harmony was used to calculate UMAP, and graph-based clustering with a resolution of 0.7. FindAllMarkers was used to find differentially expressed genes using the Wilcoxon rank-sum statistical test and major cell population were annotated using differentially expressed genes and canonical marker genes. Subclustering analysis of myeloid cells was performed with same approach described above. MiloR package (v1.3.1)55 was used to test for differential abundance analysis between carotid and coronary. Cell neighborhoods were defined on a kNN graph (k = 20, d = 30) and testing for differential abundance was done using a negative binomial general linear model framework. Cell neighborhoods were annotated to their clusters and differential abundance expressed as log fold changes displayed in a Beeswarm plot.
GTEx dataset analysis
Gene expression analysis of SARS-CoV-2 entry factors was analyzed in aorta, coronary and tibial arteries, heart (atrial appendage and left ventricle), lung, and whole blood was performed using GTEx data (v8 version, dbGaP Accession phs000424.v8.p2) which contains 17,382 RNA-seq tissue samples in total from 948 deceased donors (67.1% males). The cohort includes Caucasian (84.6%), African American (12.9%), American Indian (0.2%), Asian (1.3%), and unknown (1.1%) ancestry. The registered causes of death are traumatic injury, cerebrovascular (>22%) or heart disease (>40%). Results are shown as a logarithmic scale of transcripts per million (log10 TMP+1).
Computational analysis of murine single-cell RNA sequencing data
Sequencing data from Wang et al. (2020)16 was extracted from BioProject Accession: PRJNA626450. Quality control of scRNA-seq data was performed using FastQC (v.0.11.7). Reads were aligned to the GRCm39 (mm39) reference genome using the STAR (v2.6.1d). FeatureCounts from the subread package (v1.6.3) was employed and normalized counts used for downstream analysis using Seurat R package (v4.3.0). Highly variable genes were identified using the ‘FindVariableFeatures’ function. RunUMAP function with default settings was used with FindNeighbors and FindClusters functions for cell clustering. Differential gene expression analysis was performed using the FindMarkers function to identify differences between single-color Tomato reporter (Myh11-CreERT2, Rosa26tdTomato/tdTomato, ApoE−/− mice) fed high fat diet (HFD, 21% anhydrous milk fat, 19% casein, and 0.25% cholesterol) for 18 weeks vs control mice. Benjamini-Hochberg method was applied to control for the FDR.
Experiments in Biosafety Level 3
Studies involving SARS-CoV-2 infection were approved by the Institutional Biosafety Committee (IBC21–000079) of the NYU Grossman School of Medicine. All BSL3 procedures were conducted in accordance to the Biosafety Manual and Standard Operating Procedures (SOP) of the New York University Grossman School of Medicine High-Containment Facility.
Cells and viruses
Vero E6 (ATCC; Cat #CRL-1586) were maintained in DMEM culture media containing 10% fetal bovine serum (FBS, Gibco), 2 mM L-glutamine and 100 U ml−1 penicillin-streptomycin. Vero E6 Expressing Transmembrane Protease, Serine 2 and Human Angiotensin-Converting Enzyme 2 (Vero E6-TMPRSS2-T2A-ACE2) were obtained from Biodefense and Emerging Infections Research Resources Repository (BEI Resources, Cat. #NR-54970). Vero E6-TMPRSS2-T2A-ACE2 cells were grown in DMEM medium with 4 mM L-glutamine, 4500 m/L of glucose, 1mM sodium pyruvate and 1500 mg/L sodium bicarbonate, 10% fetal bovine serum and 10 μg/mL of puromycin. All cells were verified to be free of mycoplasma contamination.
SARS-CoV-2 isolate USA-WA1/2020 (BEI resources #NR52281), was amplified once in Vero E6 cells infected at a MOI 0.01 as previously described69. Virus was collected at 72 hours post-infection (hpi) upon observation of cytopathic effect. Debris was removed by centrifugation and passage through a 0.22-μm filter, and the supernatant was then aliquoted and stored at −80 °C. Virus titer was calculated by plaque assay on Vero E6 cells and informed as particle forming units per mL (PFU/mL). Virus stocks were SANGER sequenced during viral stock production. A PCR amplicon covering the S gene (FW: gttcagagtttattctagtgcgaataattgcacttttg, RV: gcagtaaggatggctagtgtaactagcaagaataccac) was purified using the Nucleospin PCR and Gel Extraction kit (Macherey-Nagel), and Sanger sequenced (Genewiz) with the following primers (FW: ggttttaattgttactttcc and FW: ctacaggttctaatgtttttc). icSARS-CoV-2 mNeonGreen (mNG) reporter virus was obtained from the UTMB World Reference Center for Emerging Viruses and Arboviruses, Texas, USA21.
In-vitro SARS-CoV-2 infection of human primary cells
Human primary monocytes were differentiated into macrophages in the presence of 20 nM human macrophage-colony stimulating factor (M-CSF; PreproTech) in DMEM culture media supplemented with 10% FBS, 2 mM L-glutamine, 100 U ml−1 penicillin–streptomycin for 5 days. Macrophages were then treated with 10 μg/mL of either Dil-oxLDL or ox-LDL (Invitrogen) for 1 hour before infection and kept throughout the experiment. Human aortic smooth muscle cells (VSMC; Promocell, Cat. #C-12533) were cultured in complete Smooth Muscle Cell Growth Medium with 0.05 mL/mL fetal calf serum, 0.5 ng/mL recombinant human epidermal growth factor, 0.2 ng/mL recombinant human basic fibroblast growth factor and 5 μg/mL recombinant human insulin, and treated with 10 μg/mL of Cholesterol–methyl-β-cyclodextrin (Chol:MβCD, Sigma Aldrich) overnight before infection with SARS-CoV-2 virus (USA-WA1/2020 strain) at MOI 0.1 in infection media with 2% FBS. Mock-infected cells were used as controls. Cell culture supernatants were inactivated with UV irradiation for 15 minutes and stored at −80°C. Cells were collected in either TRIzol (Invitrogen) or in 10% buffered formalin. Macrophages and foam cells were treated with the EG 00229 trifluoroacetate (Tocris Cat. #6986) at 100 μM final concentration for 1 hour prior to infection.
Lipid staining with Oil Red O (ORO)
VSMC treated with 10 μg/mL of Chol:MβCD or vehicle for 48h were fixed with 10% buffered formalin for 1 hour and incubated with 60% isopropanol for 1 minute. Staining with Oil Red O (Sigma Aldrich) working solution was performed for 20 minutes before hematoxylin counterstain for 1 minute. Images were acquired with Keyence BZ-X800 microscope.
Ex-vivo SARS-CoV-2 infection of human vascular explants
Carotid plaque specimens were thawed, cut into pieces (approx. 3×3 mm) and cultured in DMEM culture media supplemented with 10% FBS, 2 mM L-glutamine and 100 U ml−1 penicillin–streptomycin for 2 hours. Tissue specimens were infected with 105 PFU/mL of SARS-CoV-2 virus (USA-WA1/2020 strain). Not infected tissues were used as controls. Culture media samples were collected at 24, 48 and 72 hpi, and inactivated by UV irradiation for 15 minutes. Tissue specimens were fixed overnight with either 4% paraformaldehyde (PFA) for immunofluorescence or 3% glutaraldehyde for electron microscopy. Tissues used for bulk RNA sequencing were stored in 1 mL of TRIzol reagent. For NRP-1 blocking experiments, tissues were pre-treated with NRP1 blocking agent (EG 00229 trifluoroacetate) at a final concentration of 100 μM for 1 hour prior to infection.
Infectious particle quantification by plaque assay
Ten-fold dilutions of conditioned culture media were added to Vero E6-TMPRSS2-T2A-ACE2 cells monolayers for 1 hour and gently shaken every 15 minutes. Following incubation, cells were overlaid with 0.8% agarose in DMEM containing 2% FBS, and incubated for 36 hours. After fixation, agarose plugs were removed and plaques visualized by crystal violet solution staining. Plaques were counted and the results were expressed as PFU/mL. Plaque assays using Vero E6 cells were performed with a 72 hours incubation period.
Silencing of NRP1 in human macrophages and foam cells
Transient knockdown of NRP1 was achieved using a pool of predesigned siRNAs FlexiTube GeneSolution for NRP1 silencing (Qiagen GS8829; Hs_NRP1_8, ACGGTCATAGACAGCACCATA; Hs_NRP1_7, CACGCGATTCATCAGGATCTA; Hs_NRP1_12, ACAGCCT TGAATGCACTTATA; Hs_NRP1_11, CTCCCAGATCACATCATCCAA) and non-targeting negative control (Qiagen; siRNA AllStarts Negative Control siRNA). Briefly, 3 μl of Lipofectamine RNAiMAX (Invitrogen) and siRNA oligos 10 nM final concentration were added to a final volume of 200 μL of OptiMEM, reduced serum medium (Gibco). The mix was incubated at room temperature for 20 min. Plated cells (60–80% confluence) were transfected by adding oligos/Lipofectamine RNAiMAX complexes in a final volume of 1 mL with DMEM without serum or antibiotics overnight (~16h) before replacing the medium with complete DMEM medium with 10% FBS for 24 h. After 24h, half of the cells were treated with 10μg/mL oxLDL for 2 h before infection with SARS-CoV-2 virus (USAWA1/2020 strain) 0.1 MOI in infection media (2% FBS DMEM) for 24h. Cells were harvested for RNA and protein analysis; cell culture supernatants were UV inactivated for 15 minutes. Cells were fixed with 10% buffered formalin for 1h before RNAScope staining.
Protein quantification and Western Blot analysis
Protein lysates, obtained using RIPA buffer containing phosphatase and protease inhibitor cocktail (100X), were processed to quantify protein concentration by Pierce BCA Protein Assay Kit. The following antibodies were used for western blot analysis: anti- NRP1 rabbit monoclonal antibody (Cell Signaling), the anti-β-actin mouse monoclonal antibody (Sigma), anti-rabbit and anti-mouse HRP-conjugated secondary antibodies (Protein Simple). All reagents information is listed in Supplementary Table 5. Molecular weight markers and samples were run through the Protein Simple Wes System and images were analyzed using the Compass for Simple Western software (v 6.2.0).
Real-time qPCR
RNA was extracted using TRIzol reagent and Direct-zol RNA Microprep Kits (Zymo Research) or RNAeasy Mini kit (Qiagen). Reverse transcription (High-capacity cDNA Reverse transcription kit, Applied Biosystems) was carried out at 37 °C for 1 hour and the reaction was stopped by heating to 95°C for 5 minutes and hold at 4°C. Real-time, quantitative PCR (RT-qPCR) was performed using gene-specific primers (Supplementary Table 5) using the TaqMan Fast Advanced Master Mix and the Applied Biosystems™ QuantStudio™ 6 Pro detection system. The thermal cycling conditions were 50°C for 2 minutes followed by a step at 95°C for 2 minutes, and 40 cycles at 95°C for 1 second, 60°C for 20 seconds. The relative quantification of the SARS-CoV-2 nucleoprotein gene was calculated using the 2-ΔΔCt method in the Design and Analysis Software version 2.6. Fold changes in gene expression were normalized to housekeeping control gene and calculated Log10 fold change relative to control sample (2 hours post-viral inoculum). For NRP1 silencing in-vitro experiments QC, fold changes in gene expression of NRP1 target gene were normalized to GAPDH housekeeping control gene. Relative quantification was performed using the 2-ΔΔCt method and samples were normalized by the endogenous controls.
Bulk RNA sequencing
RNA from primary macrophages and foam cells was extracted using TRIzol reagent and Direct-zol RNA Microprep Kits following the manufacturer’s instructions. Total RNA from human atherosclerotic tissue was isolated using QIAzol Lysis Reagent (Qiagen) and the gentleMACS™ Octo Dissociator (Miltenyi Biotec) homogenizer, combined with RNA clean-up using the RNAeasy Mini kit (Qiagen). Quality control was performed with Agilent RNA 6000 Nano and Pico Kits (Agilent Technologies) using the Agilent 2100 Bioanalyzer System. For in-vitro experiments, PolyA library preparation was performed using Illumina Stranded mRNA Preparation and Ligation (Illumina). For human atherosclerotic plaque ex-vivo experiments, the Revelo RNA-Seq High Sensitivity library preparation kit was used (Tecan). Libraries were quantified using KAPA library Quantification kit (Roche), pooled at 2 nM equimolar concentration and sequenced using the Illumina NovaSeq 6000 sequencer.
RNA-seq data processing, analysis and visualization
Quality control of RNA-seq data was performed using FastQC2 (v.0.11.7). Raw sequenced reads were trimmed using fastp3 (v0.20.1) for quality control of bases and to eliminate sequencing adaptors. Raw reads were aligned using STAR (v.2.6.1d) to the combined human (Homo sapiens) genome assembly GRCh38 from Genome Reference Consortium [GCA_000001405.15 GCF_000001405.26]) and SARS-CoV-2 Washington isolate (WA1/2020) genome (GeneBank: MN985325.1). The gene-level expression counts were computed with the feature counts function in the Subread package (v.1.6.3; parameters: -g gene_id -s 2) using the human gene annotations from Gencode release 33. Differential expression was performed using the R package DESeq2 (v1.30.1). To model differences in gene expression between SARS-CoV-2 infected vs. not infected primary macrophages and foam cells, a model including infection status, timepoint, and donor as dependent variables was used. To identify differences in gene expression between infected macrophages and infected foam cells, a model including cell type, time point and donor as dependent variables was used. To model gene expression differences between time points and infection status, a model including infection status, timepoint, donor, and an interaction between infection status and timepoint were included as dependent variables was used on macrophages and foam cell samples separately. The IFN and SARS-CoV-2 scores were calculated as Log2 values of interferon response genes and SARS-CoV-2 genes comparing macrophages and foam cells response at 0, 2, 8, 24 and 48 hpi. Standardized data (z-scores) were calculated for each feature by subtracting the estimate mean and dividing by the estimate standard deviation. For hierarchical clustering, data was plotted using pheatmap package (v1.0.12) in R. Differential expression analysis of SARS-CoV-2 infected atherosclerotic plaque samples was performed using the R package DESeq2 with timepoint and donor included as dependent variables. For hierarchical clustering analysis, normalized values were standardized and plotted using pheatmap package (v1.0.12) in R. P-values were adjusted using Benjamini-Hochberg correction and denoted as an asterisk. Gene set enrichment analysis using Reactome knowledgebase 2022 and Gene Ontology (GO) Biological Process 2021 of top 300 differentially expressed genes (DEG) was performed using Enrichr (https://maayanlab.cloud/Enrichr/)70,71. Bar plots represent the combined score of ten top relevant pathways with statistical significance (p-value<0.05, *; p-value<0.01; **; p-value<0.001; ***).
Cytokine and chemokine protein secretion
A screen of 48 human cytokines and chemokines was performed using UV-inactivated culture supernatants by using the Bio-Plex Pro Human Cytokine Screening Panel (Biorad) and the Luminex® 200™ platform of the Immune Monitoring Laboratory Division of Advanced Research Technologies (DART) of NYU Grossman School of Medicine. Luminex data was log-transformed and statistically significant differences were calculated using unpaired two-sided t-tests and p-values were adjusted using Benjamini-Hochberg correction. Empirical Bayes batch correction (Combat) was used to remove batch effect before log-transforming the data. Statistical analysis was performed using R (v.4.0.3). Cytokines showing log2FC>0 were upregulated and log2FC<0 were downregulated. Secreted TGF-β1 and Caspase-8 were measured by ELISA (Invitrogen) in clarified culture media supernatant, according to the manufacturer’s instructions.
Transmission electron microscopy
After 48 and 72 hpi, ex-vivo SARS-CoV-2 infected atherosclerotic samples were fixed with 3% glutaraldehyde/PBS (pH=7.4) at 4°C. Samples were prepared for electron microscopic evaluation by NYU Grossman School of Medicine’s Microscopy Laboratory following standard operating procedures. The specimens were examined by transmission electron microscopy. Stained grids were imaged with Talos L120C transmission electron microscope and recorded using Gatan OneView Camera (4K × 4K resolution) with software Digital Micrograph, Gatan Microscopy Suite (GMS).
Statistical analysis
Statistical analysis not described above was performed using GraphPad Prism v9.0 and details are included in the figure legends. Statistical p-values were calculated and reported on graphs, a p-value of <0.05 was considered significant.
Extended Data
Extended Data Fig. 1: Pathology assessment and RNA-FISH analysis of coronary arteries from deceased individuals with COVID-19.
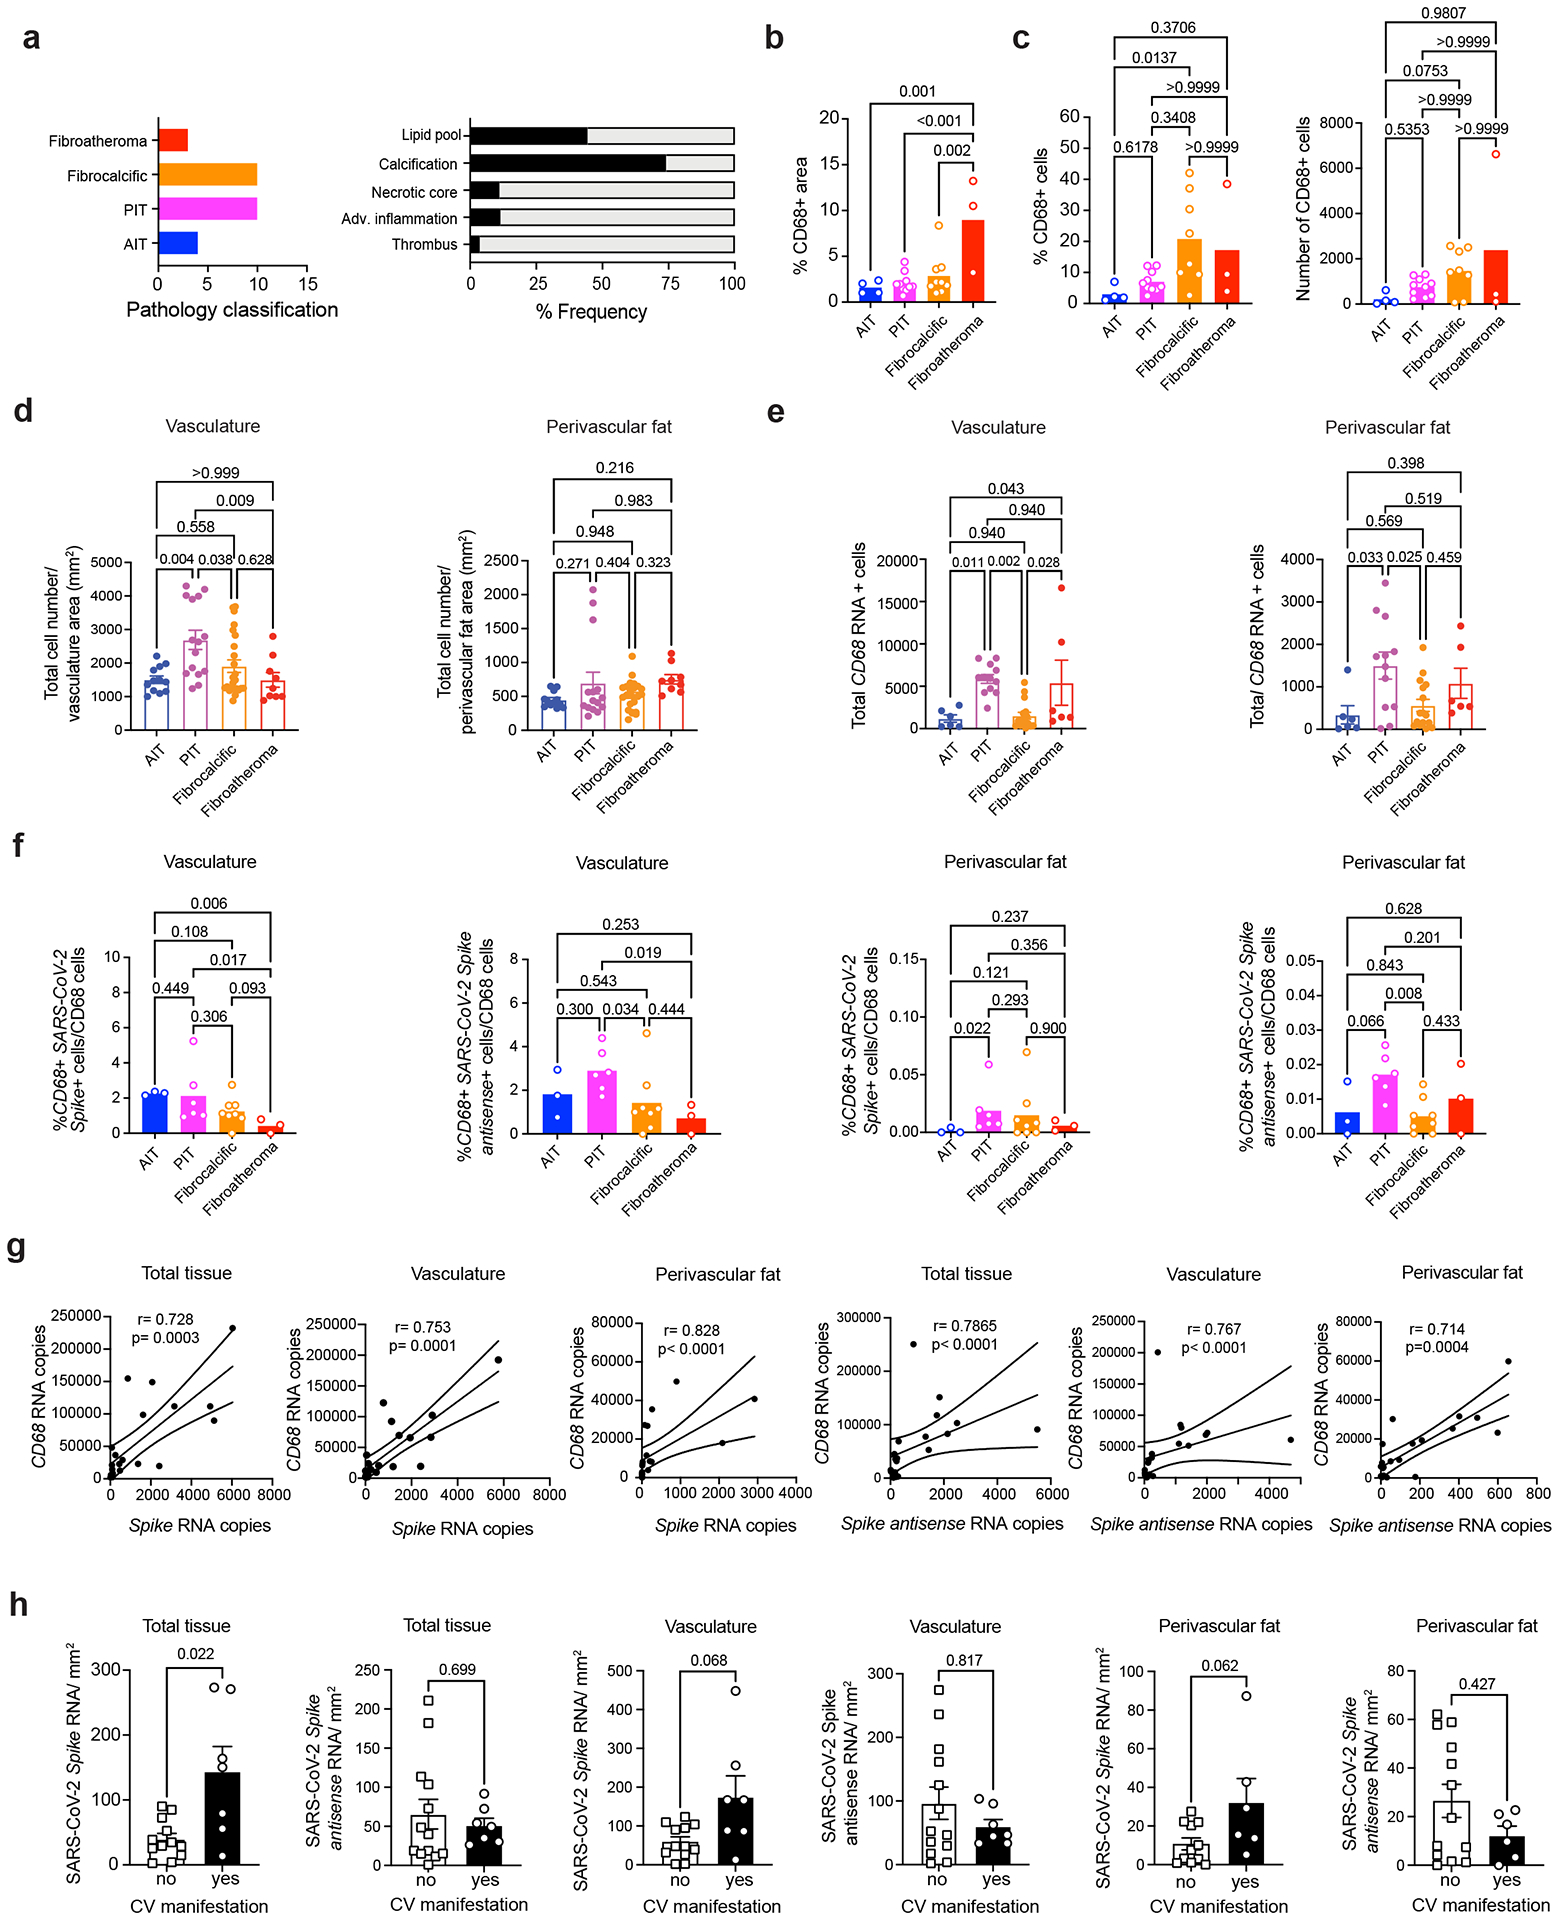
a) Bar plot (left) shows the number of adaptive intimal thickening (AIT; blue, n = 4), pathological intimal thickening (PIT; magenta, n = 10), fibrocalcific (orange, n = 10) and fibroatheroma (red, n = 3) specimens. Bar plot (right) shows the proportion of coronaries that presented pathological features of lipid pool, calcification, necrotic core, adventitial inflammation, and thrombus. b) Bar plot showing the percentage of CD68+ area. Non-parametric Kruskal-Wallis test with Dunn’s test for multiple comparisons was performed. c) Bar plot showing the quantification of frequency and total count of CD68+ cells in AIT (n = 4), PIT (n = 10), fibrocalcific (n = 8) and fibroatheroma (n = 3). Data are presented as mean values ± s.e.m. Non-parametric Kruskal-Wallis test with Dunn’s test for multiple comparisons was performed. d) Bar plots of total cell number normalized by the area (mm2 ) of vasculature and perivascular fat. Each dot represents a tissue section from AIT (n = 12), PIT (n = 15), fibrocalcific (n = 24) and fibroatheroma (n = 9). Data are presented as mean values ± s.e.m. One-way ANOVA with post-hoc Tukey’s test for multiple comparisons was performed. e) Bar plots of total number of CD68 RNA+ cells quantified in the arterial wall and perivascular fat. Dots represent individual tissue sections from AIT (n = 6), PIT (n = 12), fibrocalcific (n = 16) and fibroatheroma (n = 6). Data are presented as mean values ± s.e.m. One-way ANOVA followed by Holm-Šídák’s test for multiple comparisons was performed. f ) Bar plots of frequency of CD68+ SARS-CoV-2 Spike+ and CD68+ Spike antisense+ cells in AIT (n = 3), PIT (n = 6), fibrocalcific (n = 8) and fibroatheroma (n = 3) coronaries. Non-parametric Kruskal-Wallis test followed by uncorrected Dunn’s test for multiple comparisons was performed. g) Scatter plot of Spearman’s rank correlation (95% confidence interval) of total CD68 RNA copies with total SARS-CoV-2 spike and Spike antisense copies (n = 20). h) SARS-CoV-2 S and S antisense quantification in total tissue, vasculature, and perivascular fat from patients with (n = 7 samples) versus without CV manifestations (n = 13 samples). Data were normalized by tissue area (mm2 ) and presented as mean values ± s.e.m. Rout method (Q = 1%) was used to remove outliers. Unpaired Mann-Whitney test was performed.
Extended Data Fig. 2: Analysis of SARS-CoV-2 tropism for human vascular smooth muscle cells.
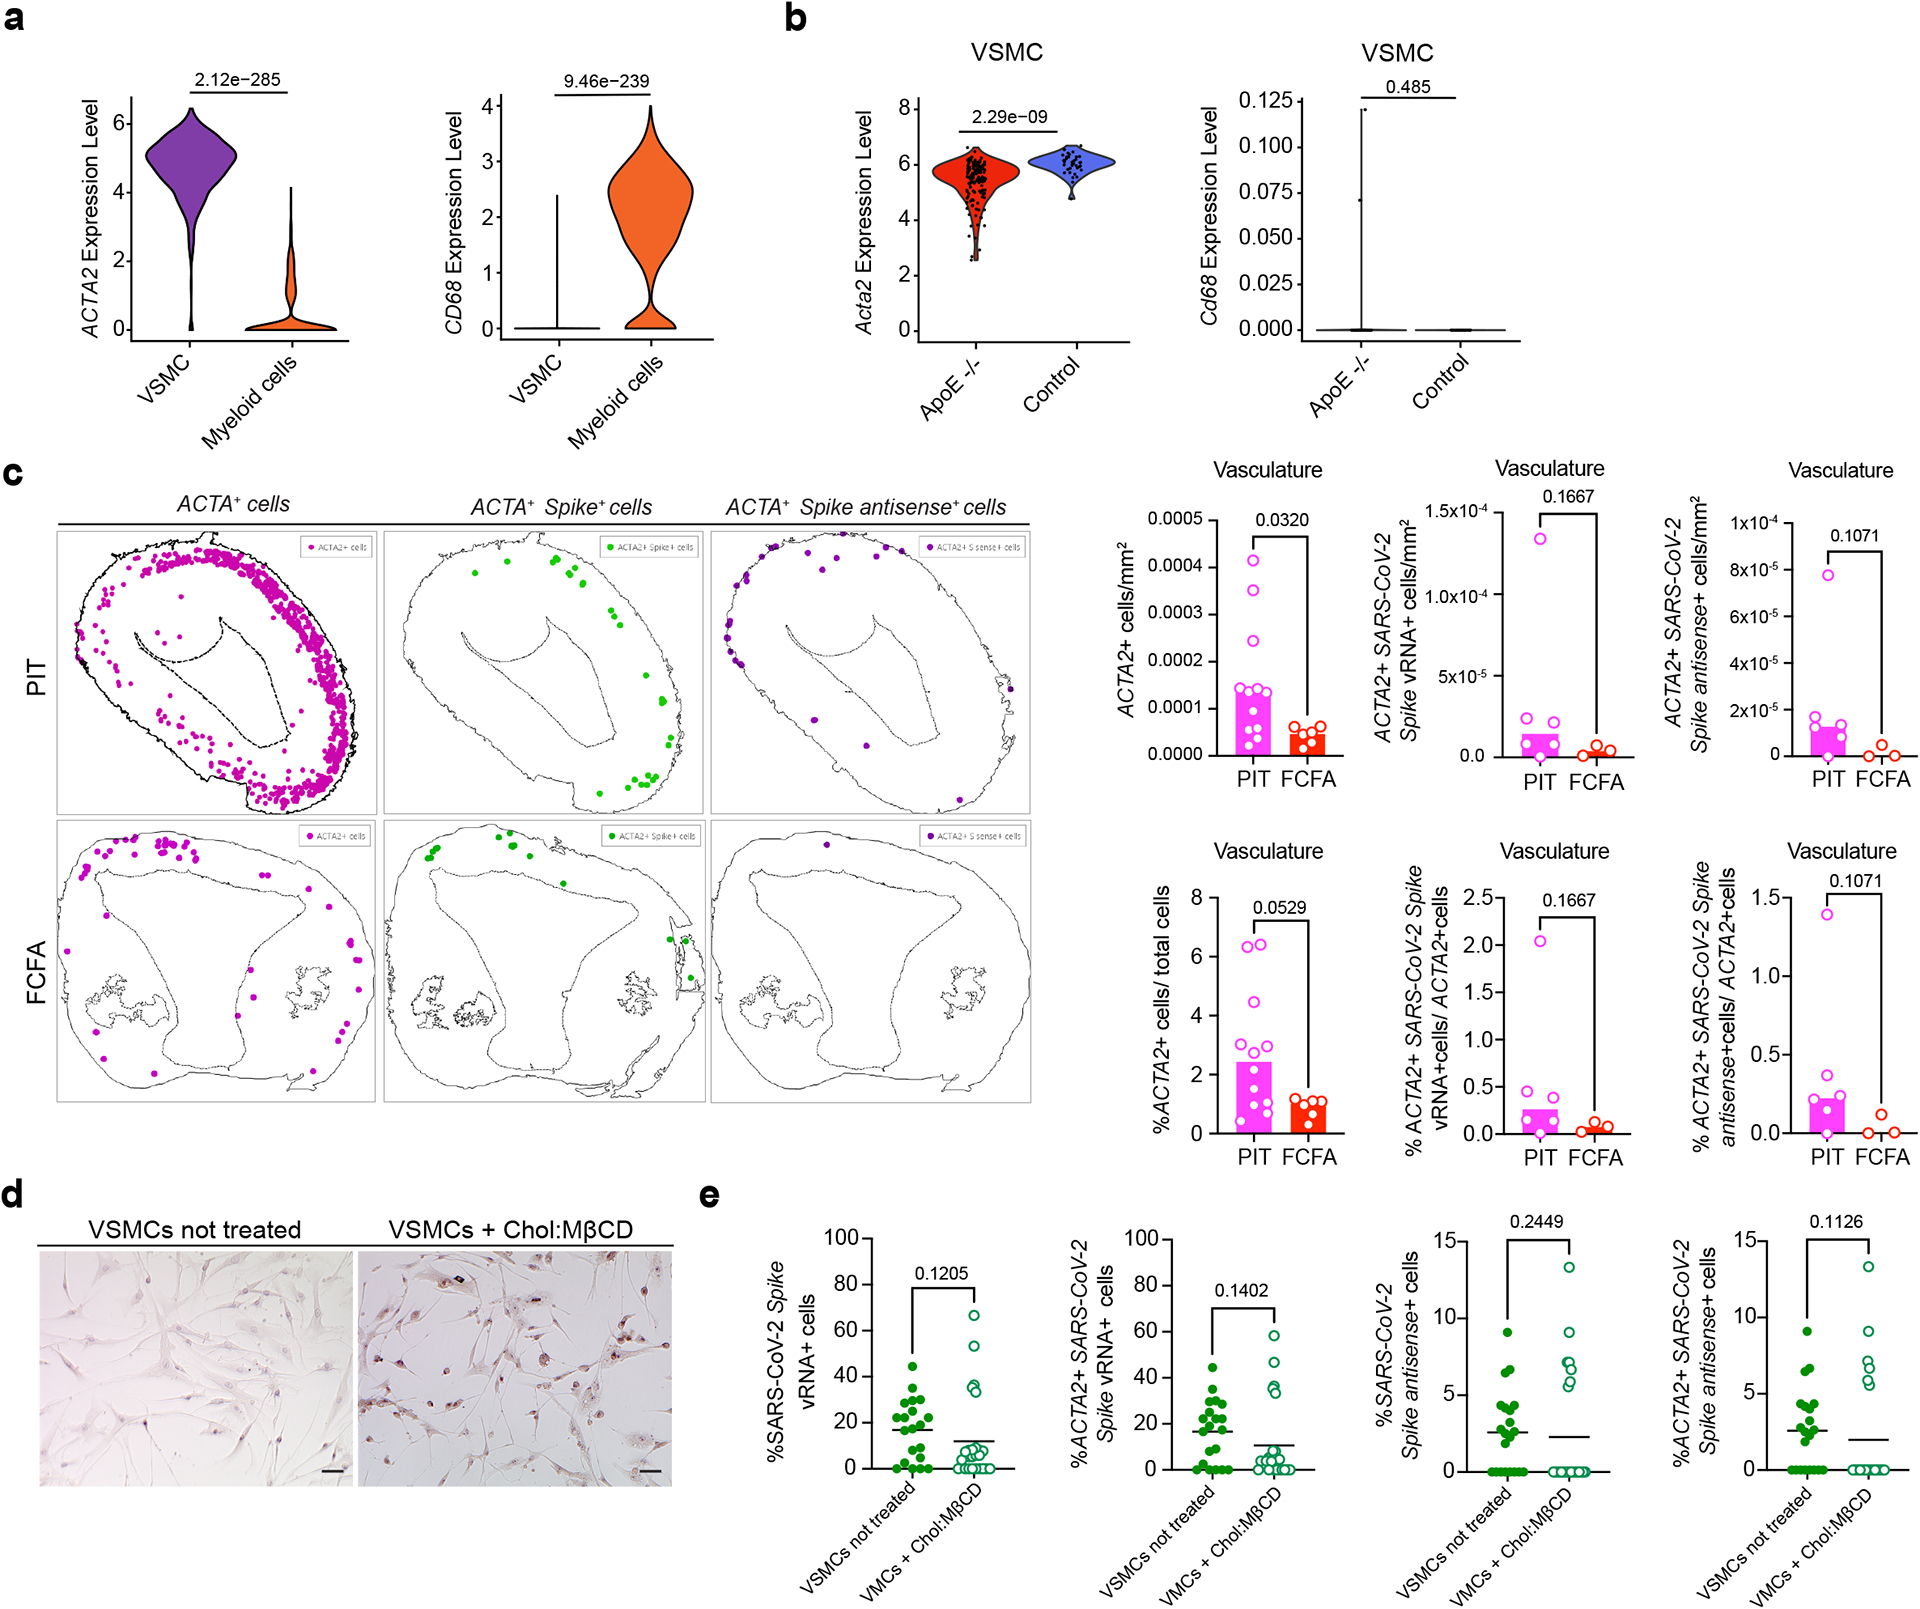
a) Differential gene expression analysis of ACTA2 and CD68 in vascular smooth muscle cells (VSMCs) and myeloid cell clusters from seven atherosclerotic coronary samples. Wilcoxon Rank-Sum test was used to compare groups and adjusted p-values with Benjamini-Hochberg correction method are shown. b) Differential gene expression analysis of Acta2 mRNA and Cd68 mRNA in lineage-tagged (Tdt+ ) SMC-derived cells dissociated from the aortic arches of atherosclerotic single-color Tomato reporter (Myh11-CreERT2, Rosa26tdTomato/ tdTomato, ApoE−/− mice) mice fed high fat diet (HFD) for 18 weeks versus control mice. Wilcoxon Rank-Sum test was used to compare groups and adjusted p-values with BH correction method are shown. c) Representative images of spatial analysis of PIT coronary samples, and fibrocalcific and fibroatheroma (FCFA) samples showing the location of ACTA2+ cells, ACTA2+ SARS-CoV-2 Spike+ cells or ACTA2+ SARS-CoV-2 Spike antisense+ cells. Bar plots showing the number and frequencies of ACTA2+ cells/mm2 , ACTA2+ SARS-CoV-2 Spike vRNA+ and ACTA2+ SARS-CoV-2 S antisense+ cells normalized by tissue area (mm2 ) in intimal thickening (PIT; n = 6) versus fibrocalcific and fibroatheroma (n = 3) coronaries. Mann-Whitney test (two-tailed) was performed. d) Representative images of Oil Red-O staining of human VSMCs treated with 10 μg/mL of Cholesterol– methyl-β-cyclodextrin (Chol:MβCD) or vehicle overnight before infection and kept for 48 h. e) Bar plots showing the frequencies of SARS-CoV-2 Spike vRNA+, ACTA2+ SARS-CoV-2 Spike vRNA+ , SARS-CoV-2 S antisense+ and ACTA2+ SARSCoV-2 Spike antisense+ cells in vehicle and Chol:MβCD conditions after infection with SARS-CoV-2 USA-WA1/2020 for 24 h. n = 20 of vehicle and n = 25 Chol:MβCD treated VSMCs in Spike vRNA quantification experiment, n = 21 of vehicle and n = 24 Chol:MβCD treated VSMCs in Spike antisense quantification experiment. Mann-Whitney test (two-tailed) was used.
Extended Data Fig. 3: SARS-CoV-2 in-vitro infection of human primary macrophages and foam cells.

a) Representative images of not-infected and infected macrophages and foam cells cultured with mNG reporter virus (MOI 0.1) at 24 hpi. Scale bar, 20 μm. b) Representative images of not-infected and SARS-CoV-2 infected macrophages and foam cells at 24 hours post-infection (hpi). Scale bar, 20 μm. c) Representative images of plaque assay in VERO E6- TMPRSS2-T2A-ACE2 cells of culture supernatants of macrophages and foam cells cultured with SARS-CoV-2 USA-WA1/2020 at 2 hpi, 8 hpi, 24 hpi, and 48 hpi. Serial dilutions are represented from left to right (−1 to −6). d) Bar plot showing the log10 FC of SARS-CoV-2 NP RNA levels normalized by 2 hpi samples (n = 4 biological replicates) in infected macrophages and foam cells. e) Bar plots showing the combined score of Gene Ontology (GO) Biological Process 2021 enrichment analysis of upregulated genes in infected macrophages, foam cells and or both vs. non-infected counterparts. P < 0.05. *, P < 0.05; **, P < 0.01; ***, P < 0.001. f ) Heat map of log2 FC in complement genes between SARS-CoV-2 infected macrophages (n = 3) and SARS-CoV-2 infected foam cells (n = 3) at 0 hpi, 2 hpi, 8 hpi, 24 hpi and 48 hpi. Adjusted P-values < 0.05 (FDR = 10%) were considered significant. g) Heat map of Log2 fold changes in lysosomal genes in SARS-CoV-2 infected cells vs. not infected cells at 2 hpi, 8 hpi, 24 hpi and 48 hpi. h) Heat map of Log2 fold changes in lysosomal genes in SARS-CoV-2 infected macrophages vs. foam cells at 2 hpi, 8 hpi, 24 hpi and 48 hpi. P-values < 0.05 were considered significant. P < 0.05. *, P < 0.05; **, P < 0.01; ***, P < 0.001. i) Heat map of log2 FC in lipid metabolism genes in SARS-CoV-2 infected macrophages (n = 3) vs. foam cells (n = 3) at 2 hpi, 8 hpi, 24 hpi and 48 hpi. Adjusted P-values < 0.05 (FDR = 0.1) were considered significant. P < 0.05. *, P < 0.05; **, P < 0.01; ***, P < 0.001. j) Quantification of Caspase-8 concentration in culture supernatants of not infected or SARS-CoV-2 infected macrophages and foam cells. One-way ANOVA with post-hoc Tukey’s test were performed.
Extended Data Fig. 4: Dynamics of cytokine response in macrophages and foam cells after SARS-CoV-2 infection.
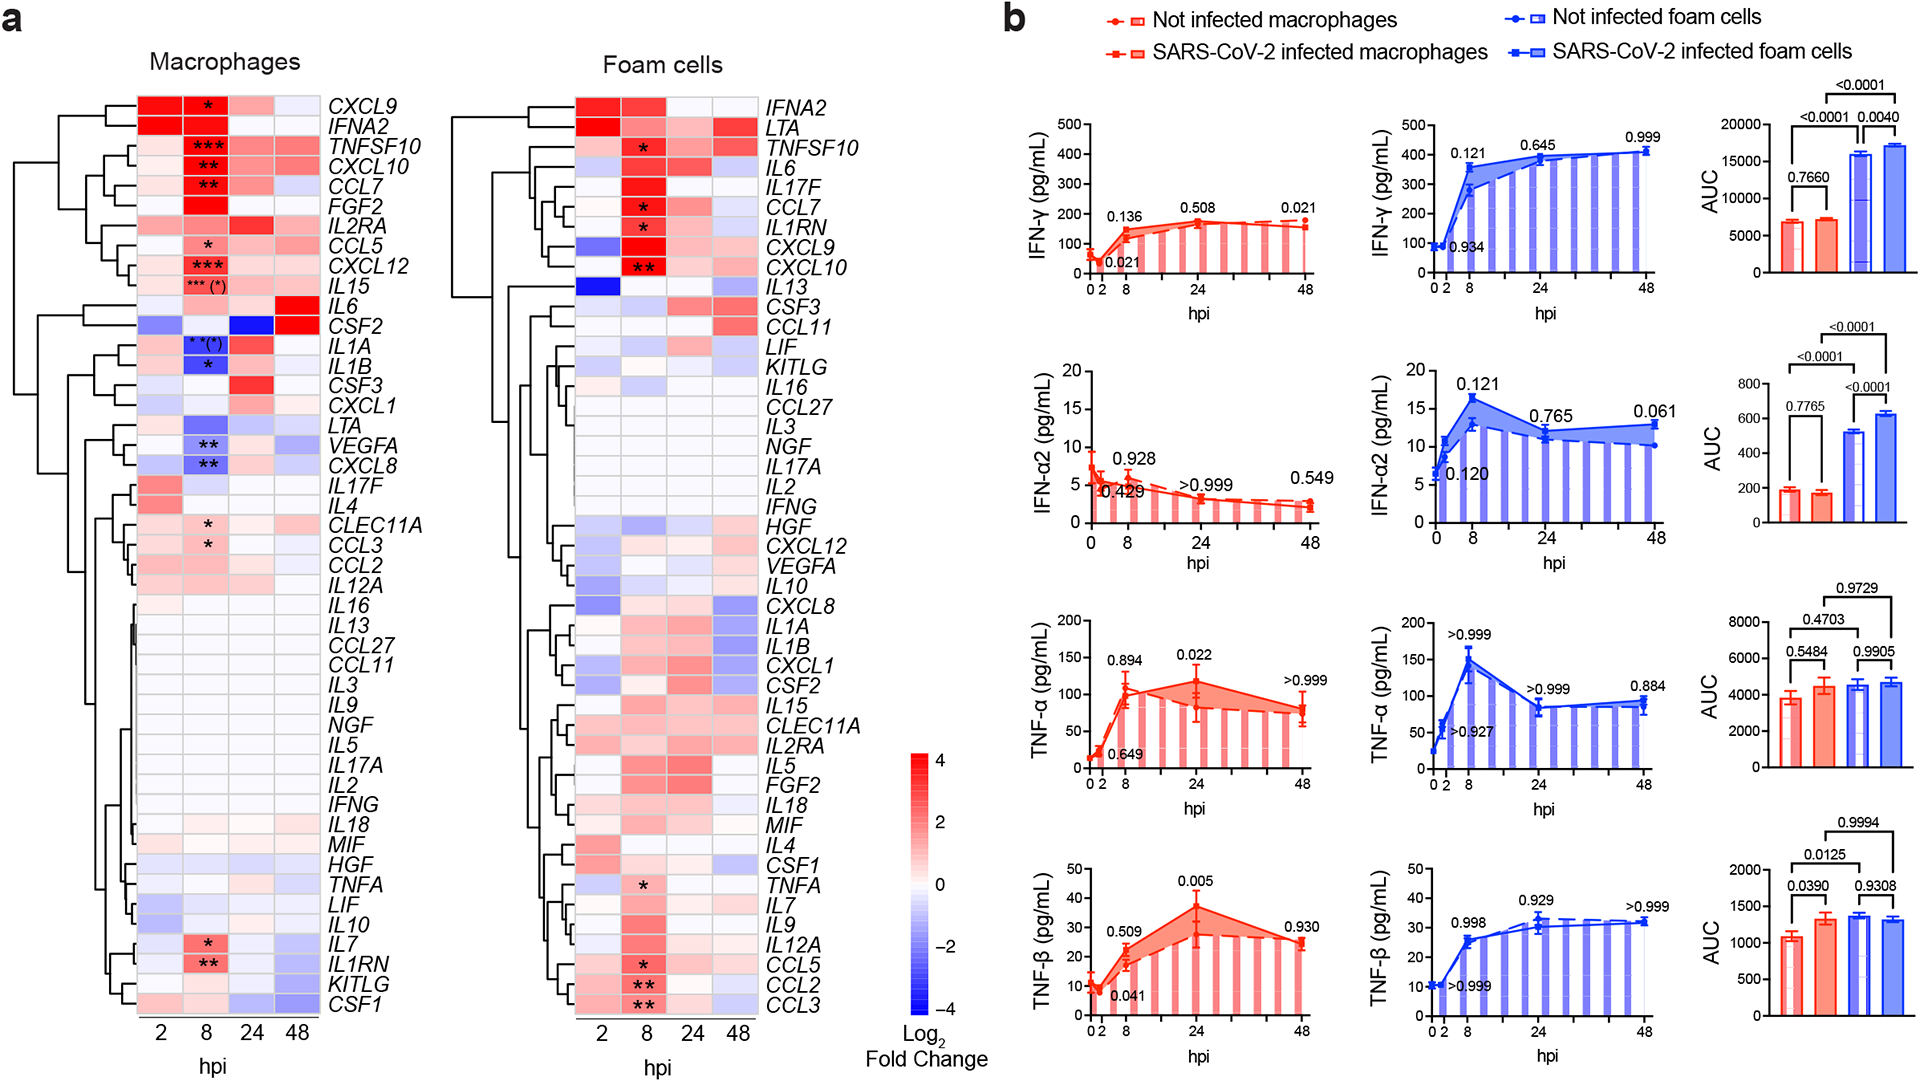
a) Heat maps of log2 FC of selected differentially expressed cytokine and chemokine genes in SARS-CoV-2 infected macrophages (left, n = 3) and foam cells (right, n = 3) versus. non-infected counterparts at different hpi. P-values were adjusted using BenjaminiHochberg correction (FDR = 10%). Adjusted P-values < 0.05 were considered significant. Asterisk indicates an adjusted P-value < 0.05 for the comparison of infected vs not infected at each timepoint. Asterisk in parentheses indicates an adjusted P value < 0.05 for the interaction term of the model. *, P < 0.05; **, P < 0.01; ***, P < 0.001. b) Kinetic plots showing the area under the curve (AUC) of cytokines and chemokines in the supernatant of SARS-CoV-2 infected and non-infected macrophages and foam cells (n = 4 biological replicates, technical duplicates). For AUC comparisons, one-way ANOVA with Tukey’s test for multiple comparisons was used. Bar plots represent Mean ± s.e.m. One-way ANOVA followed by Šídák’s test for multiple comparisons was performed.
Extended Data Fig. 5: Ex-vivo SARS-CoV-2 infection of human carotid vascular explants.
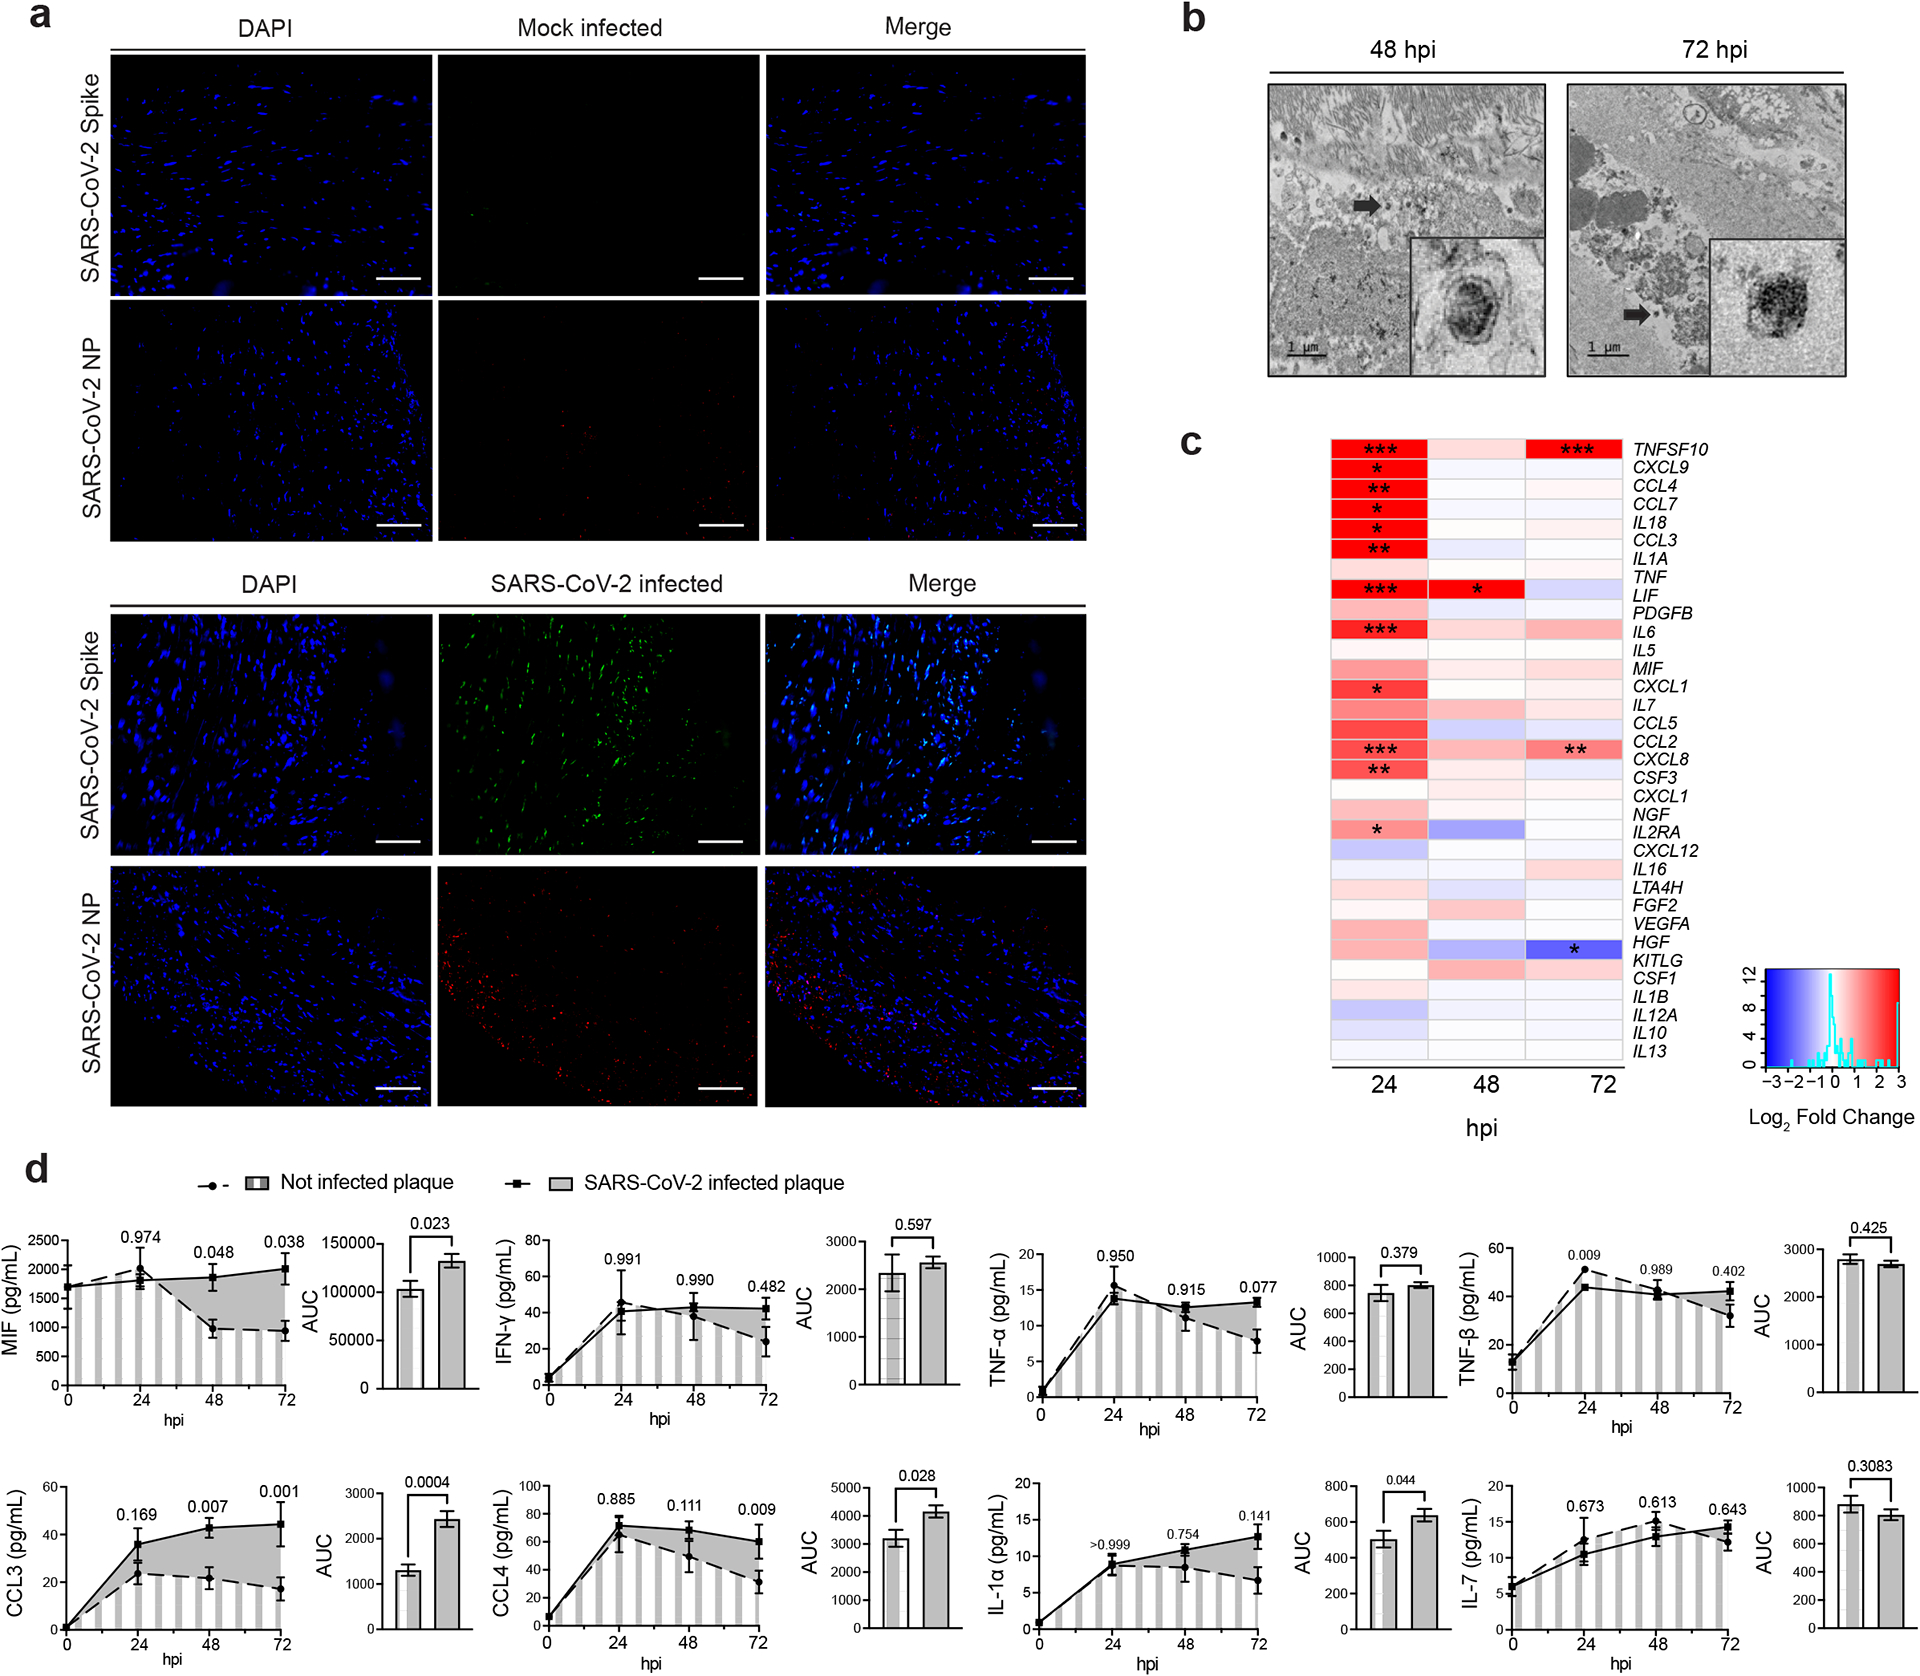
a) Representative images of human atherosclerotic plaque tissues infected ex vivo with SARS-CoV-2 USA-WA1/2020 (105 PFU) versus mock infected control shows the expression of spike protein and nucleoprotein (NP). Scale bar, 100 μm. b) Electron microscopy of human atherosclerotic carotid plaque tissue infected ex vivo with the SARS-CoV-2. Scale bar, 1 μm. Black arrows indicate coronavirus-like particles. c) Heat map of selected cytokine and chemokine genes showing the log2 FC in SARS-CoV-2 infected carotid vascular explants versus not-infected tissues at different times post-infection. Wald test from DESeq2 package was used to test for significance. P values were adjusted using Benjamini-Hochberg correction (FDR = 10%) and denoted as an asterisk *, P < 0.05; **, P < 0.01; ***, P < 0.001. d) Kinetic plots showing the AUC of selected cytokines and chemokines secreted by non-infected or SARS-CoV-2 infected carotid vascular explants (n = 3 donors, technical duplicates) at different time post-infection. One-way ANOVA with Šídák’s test for multiple comparisons was performed. Bar plots represent mean ± s.e.m. Unpaired t-test (two-tailed) was performed and P < 0.05 was considered significant.
Extended Data Fig. 6: Single cell RNA sequencing analysis of SARS-CoV-2 entry factors in vascular myeloid subclusters.
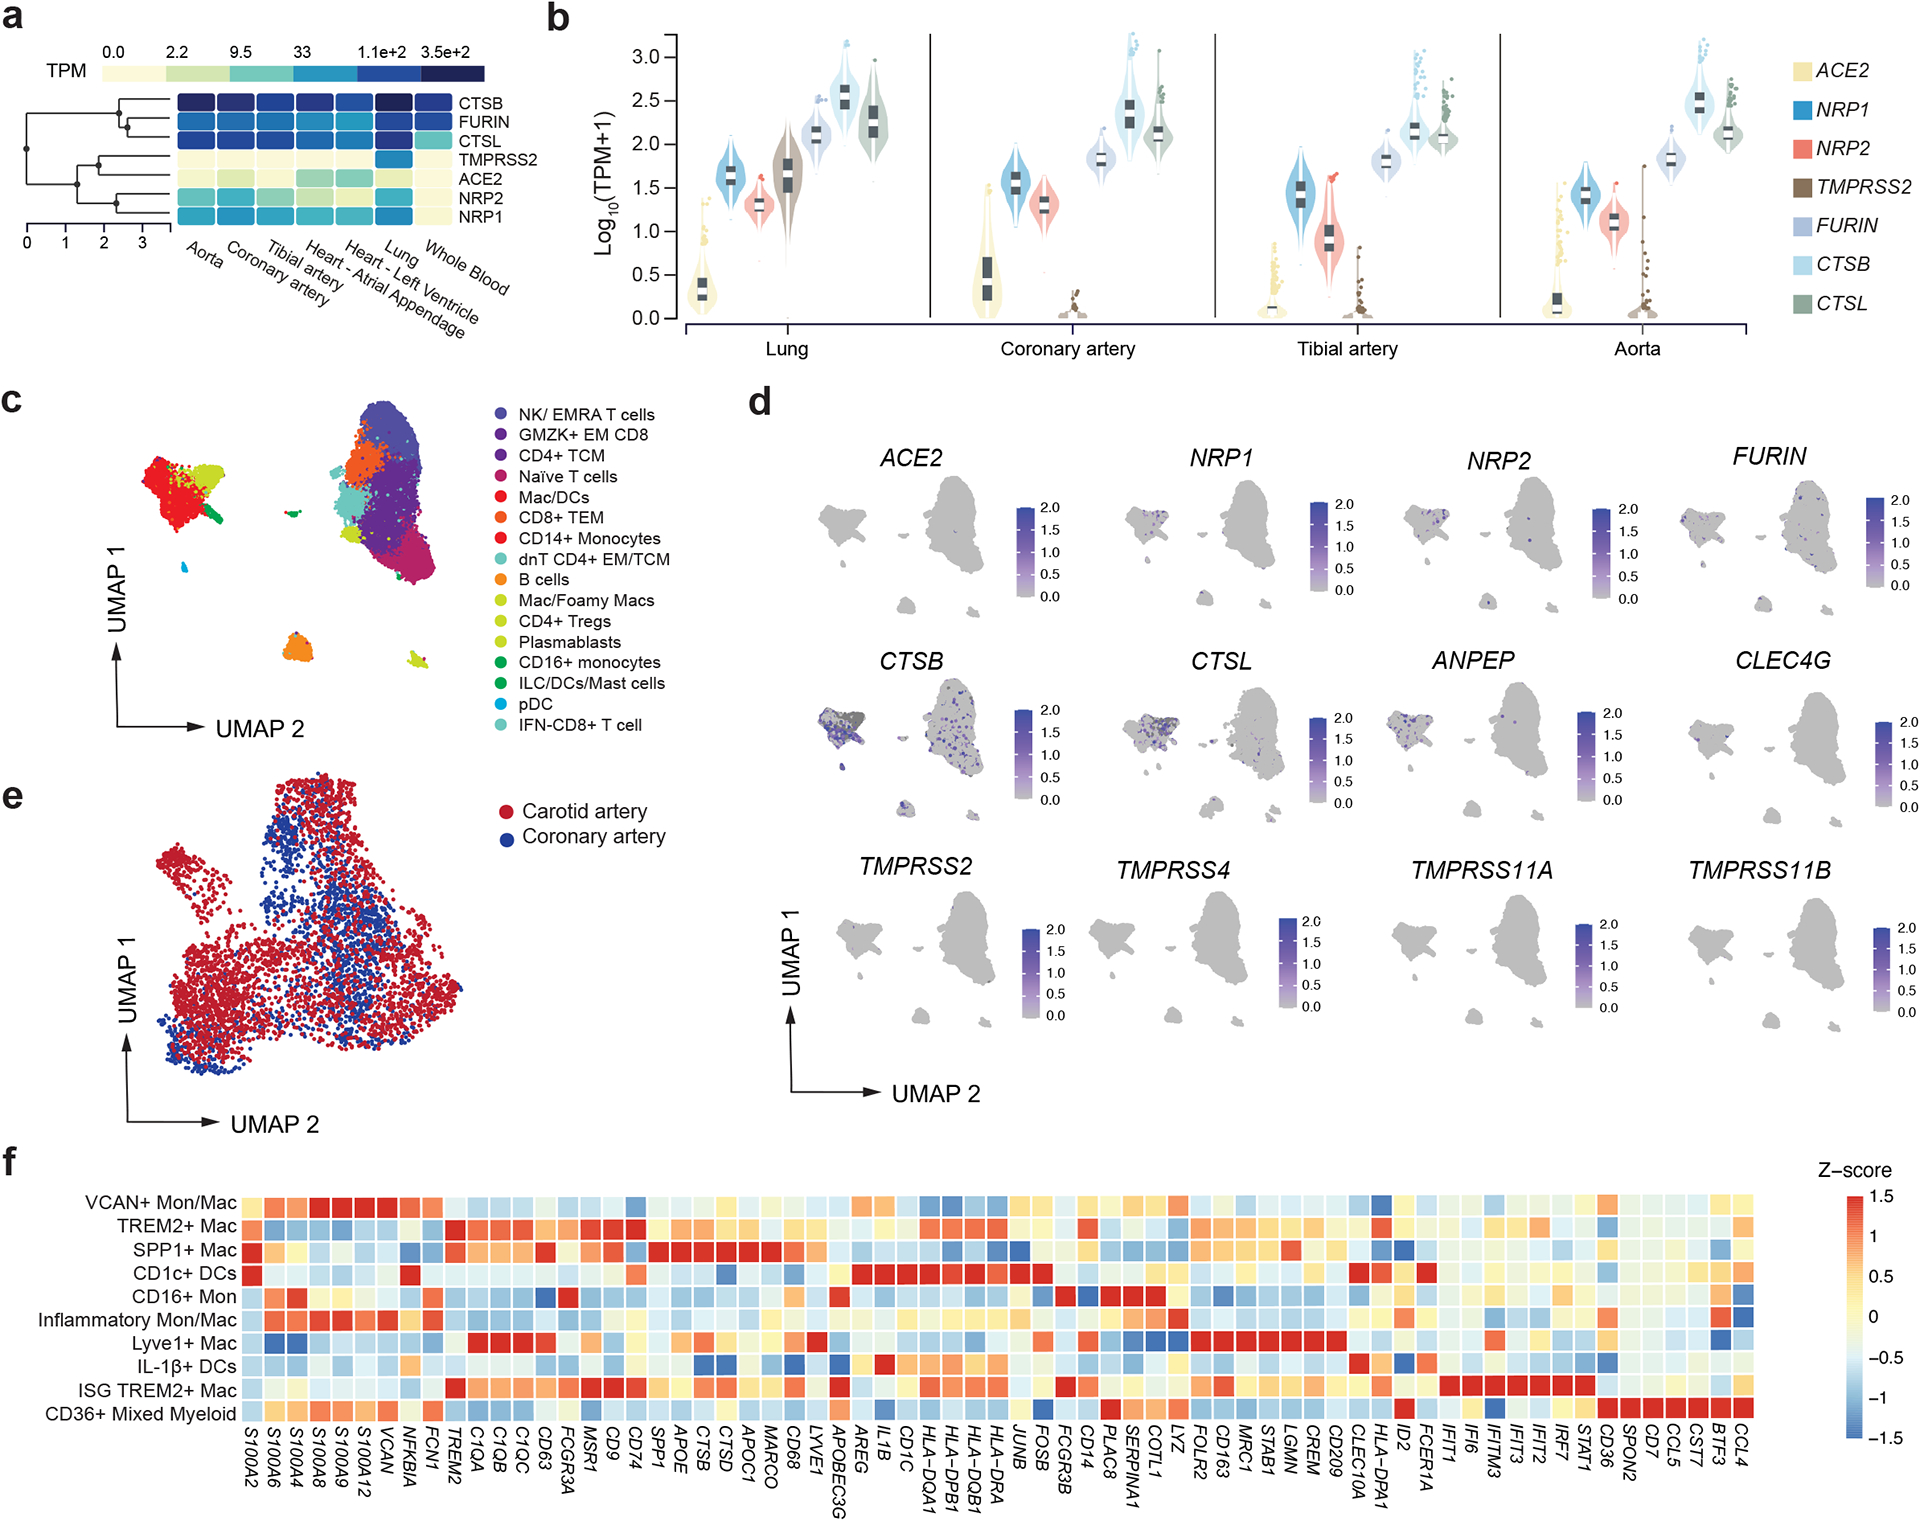
a) Heat map shows transcripts expression (median TPM, transcripts per million) of SARS-CoV-2 entry factors identified in lung, whole blood, heart (left ventricle and atrial appendage), aorta, and tibial and coronary arteries. b) Violin plots showing the log10 TMP + 1 of tissue level expression of SARS-CoV-2 entry factors in lung, aorta, tibial and coronary artery identified. Data are presented as median ±IQR (25%–75% quartiles) in the box plot, violin plot defines density of data in whole range. c) UMAP embedding of integrated total immune cells from carotid (n = 10) and coronary (n = 7) tissues. d) Gene expression of SARS-CoV-2 viral entry factors and related genes projected onto the UMAP of total immune cells. e) UMAP representation of myeloid cell clusters colored by tissue origin. Dots represent individual cells belonging to carotid (red) or coronary artery (blue). f ) Heatmap displaying selected z-score scaled genes (columns) across myeloid cell subclusters (rows) from human coronary and carotid samples. Canonical genes were used for myeloid subclusters annotations.
Extended Data Fig. 7: Abrogation of SARS-CoV-2 interaction with host by NRP-1 small molecule inhibitor and silencing RNA.
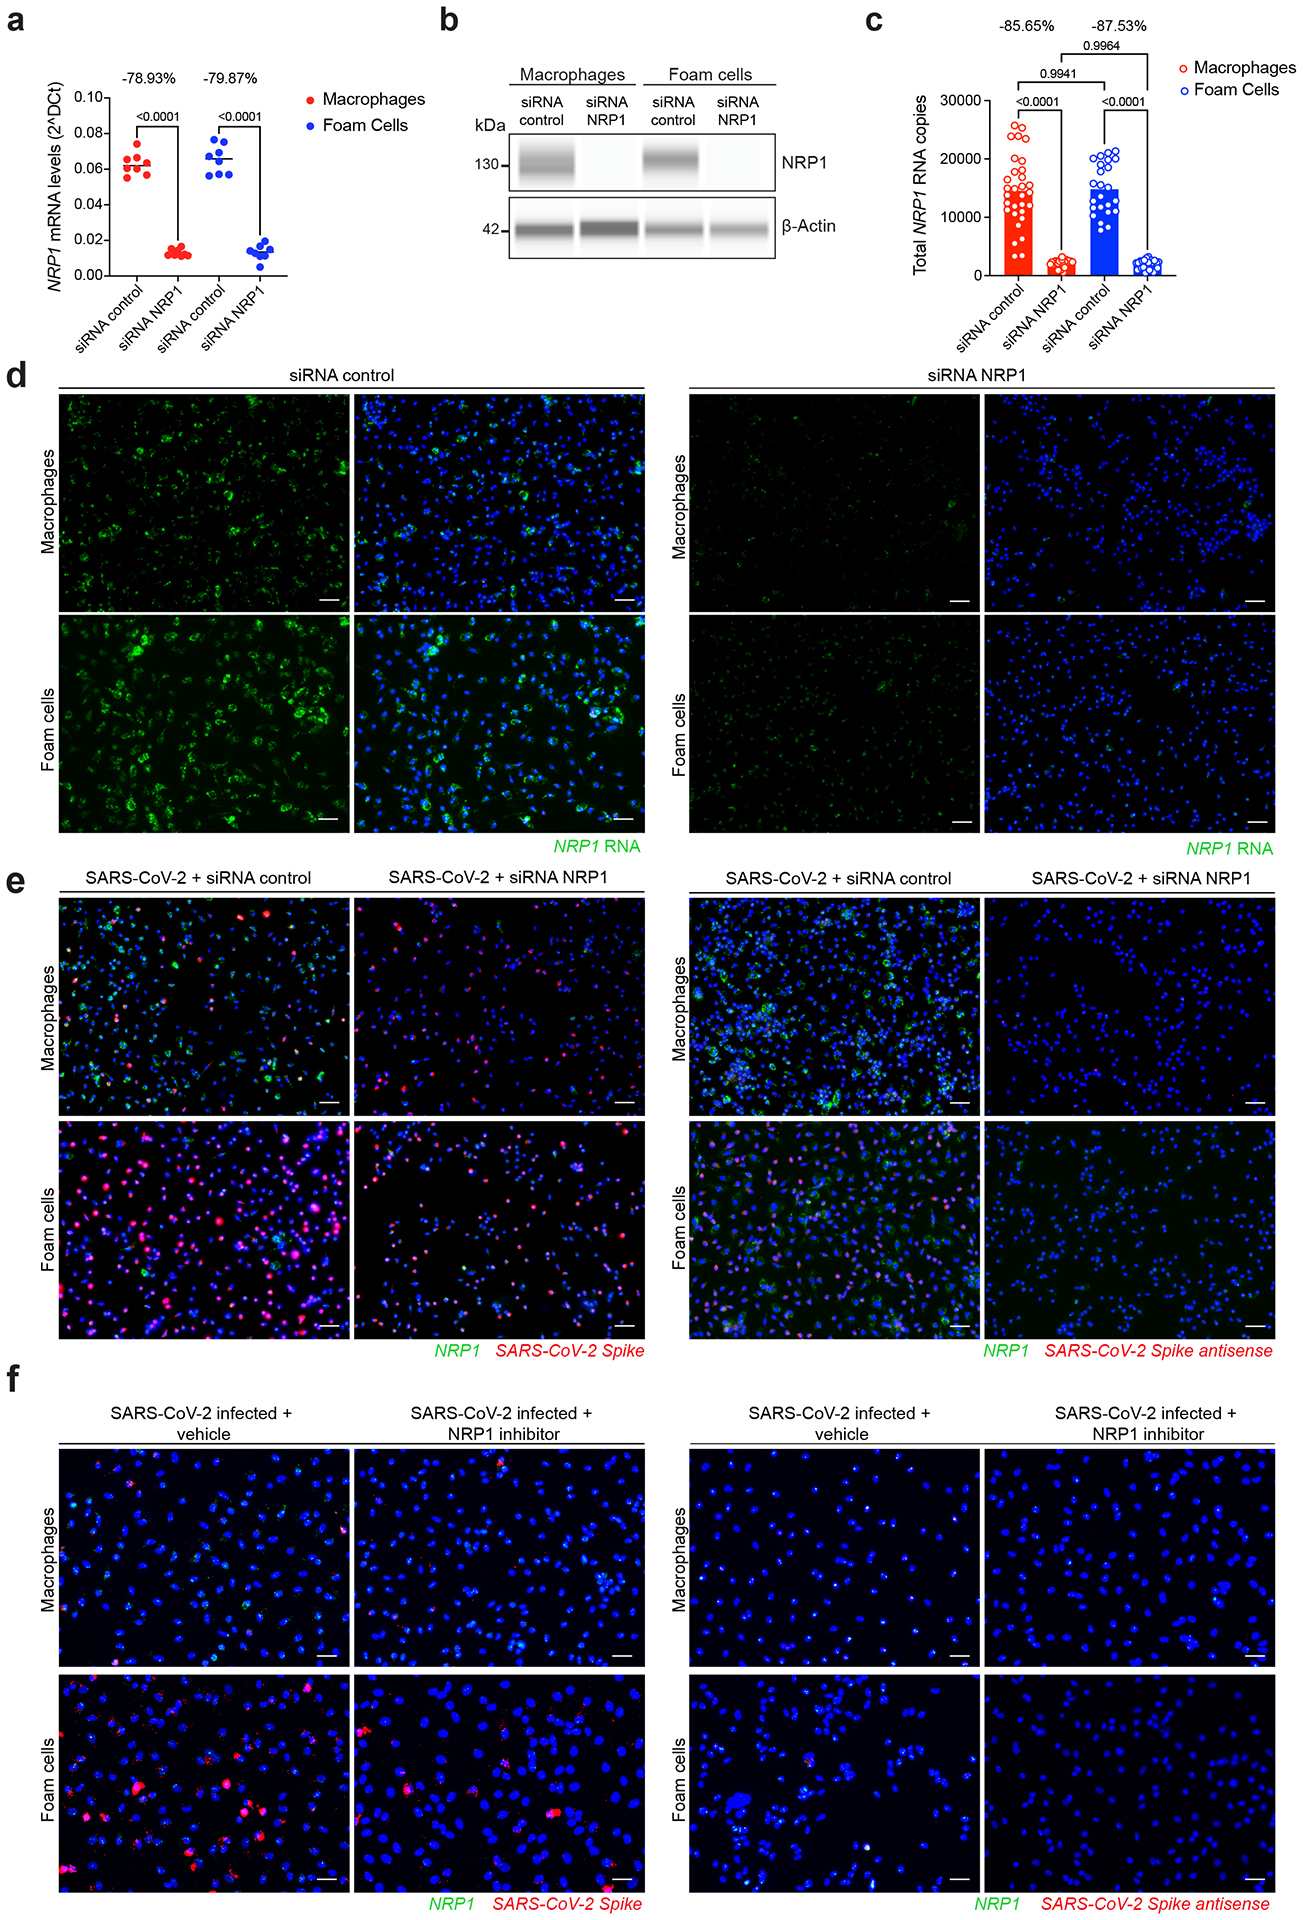
a) Dot plot showing the relative expression levels of NRP1 RNA normalized by GAPDH RNA expression in macrophages and foam cells. Average percentage of NRP1 silencing efficacy were calculated and depicted at the top (n = 4 biological replicates measured by technical duplicate per cell type, condition). b) Representative image of capillary western blot (Wes) was performed to evaluate the protein expression levels of NRP1 after siRNA NRP1 or siRNA control treatment. Target protein NRP1 (130–140 kD) and β-actin loading control blots (42 kD) are shown. c) Total NRP1 RNA copies were quantified in not-infected macrophages and foam cells treated with either siRNA control or siRNA NRP1 (n = 31 images of macrophages siRNA control; n = 26 macrophages siRNA NRP1, n = 24 foam cells siRNA control, n = 25 foam cells siRNA NRP1) at 24 hpi. d) Representative images and quantification of RNA-FISH showing NRP1 RNA in not-infected macrophages and foam cells. e) Representative images of RNA-FISH showing SARS-CoV-2 spike vRNA and NRP1 RNA (left), SARS-CoV-2 spike antisense vRNA and NRP1 RNA (right) in infected macrophages and foam cells treated with non-targeting siRNA control or siRNA NRP1 at 24 hpi. f ) Representative images of RNA-FISH showing SARS-CoV-2 S vRNA and NRP1 RNA (left), SARS-CoV-2 S antisense RNA and NRP1 RNA (right) in infected macrophages and foam cells with and without NRP1-blocking (EG00229 trifluoroacetate) at 24 hpi.
Extended Data Fig. 8: Dynamics of cytokine response in NRP1- blocking/ silencing treated macrophages and foam cells.
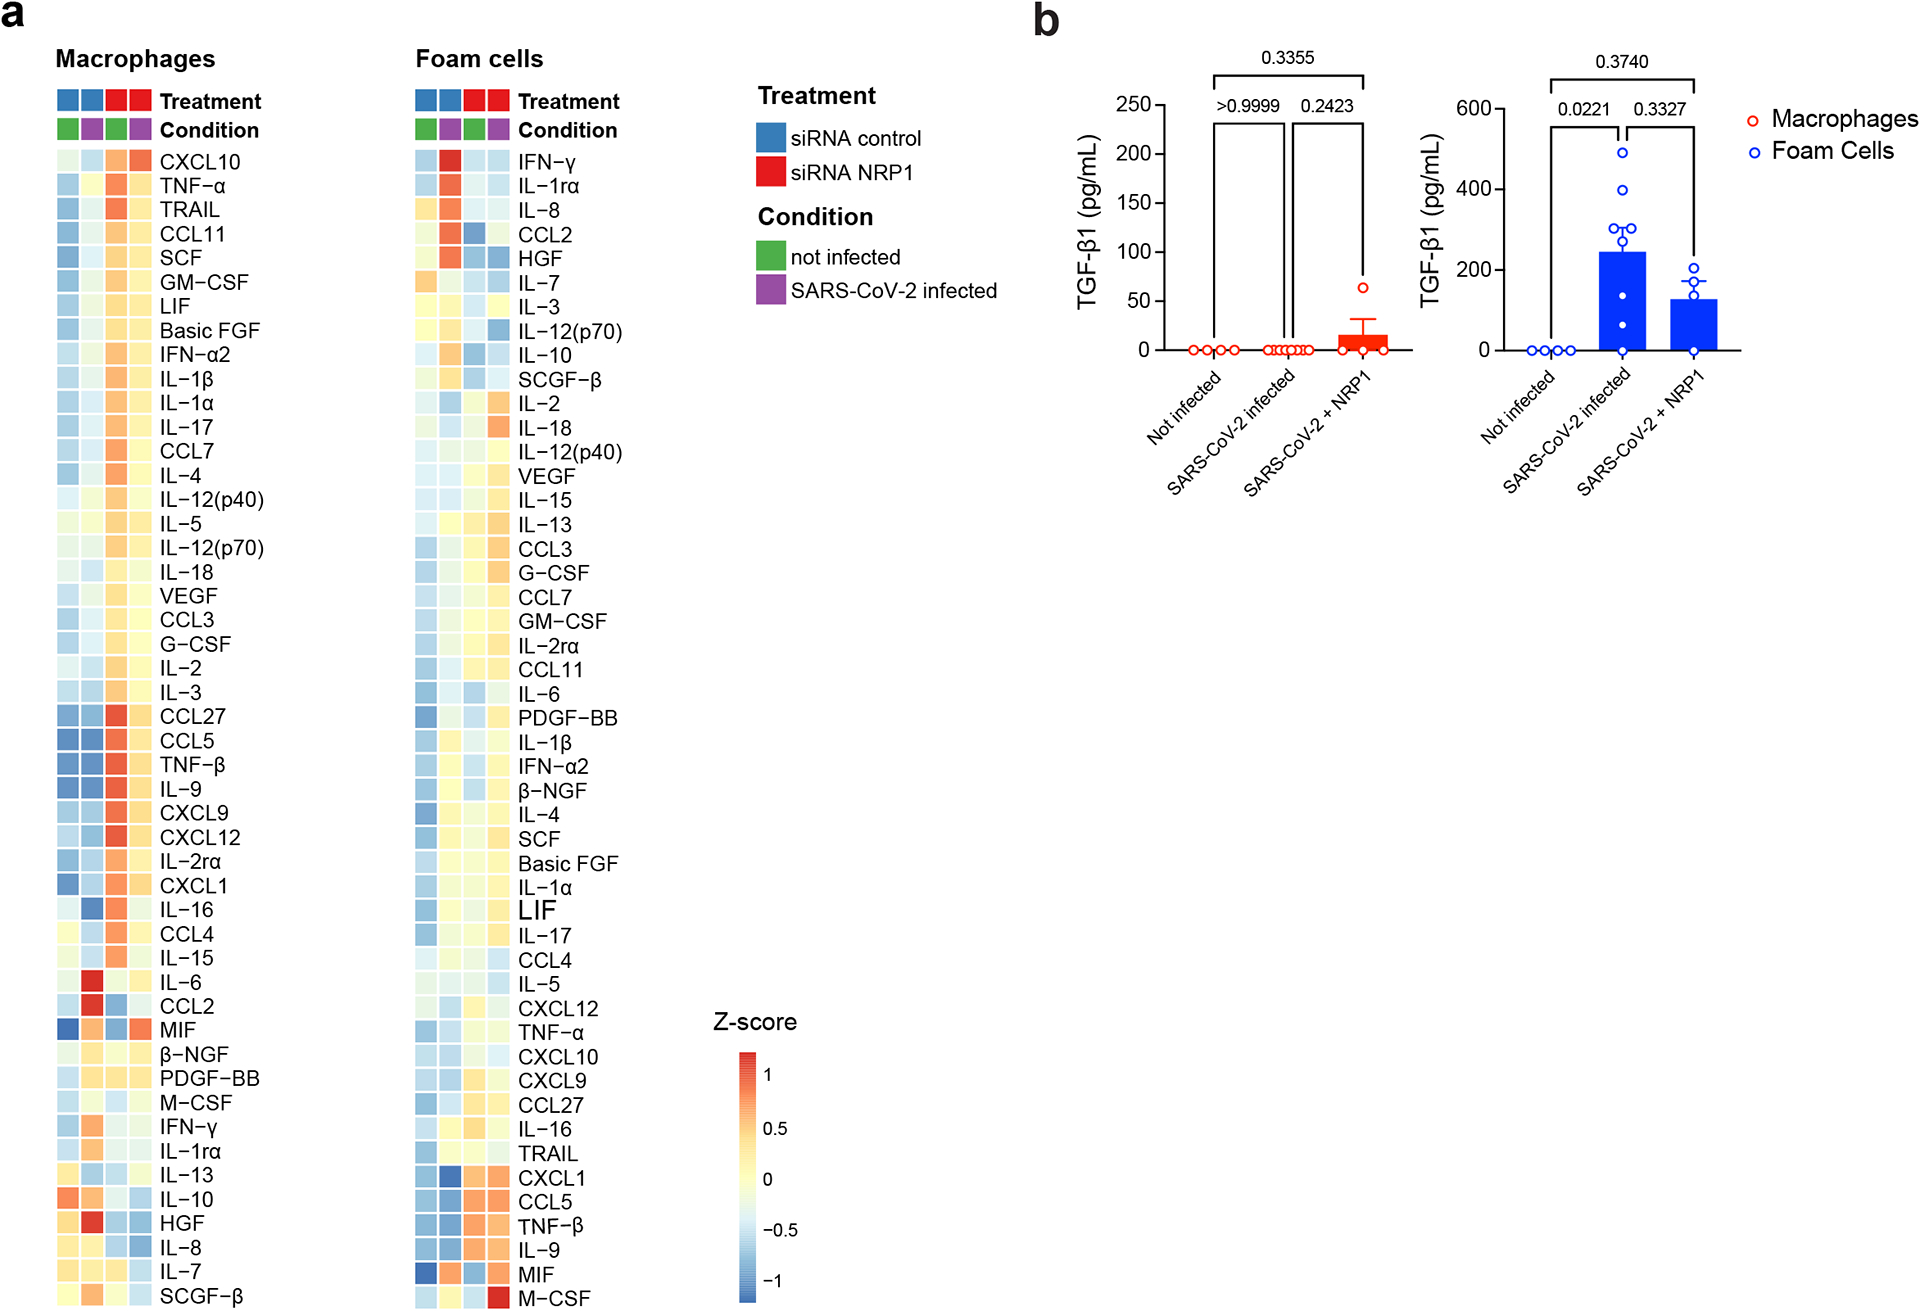
a) Heat map of standardized z-scored gene expression of cytokines and chemokines in not-infected, SARS-CoV-2 infected macrophages and foam cells treated with non-targeting siRNA control or siRNA NRP1 at 24 hpi. b) Quantification of TGF-β1 concentration (pg mL−1) in culture supernatants of not infected (n = 4) or SARS-CoV-2 infected macrophages and foam cells with (n = 4) or without (n = 8) NRP1-blocking treatment (EG00229 trifluoroacetate) at 24 hpi. Data are presented as mean values ±s.e.m. One-way ANOVA with post-hoc Tukey’s test for multiple comparisons was performed.
Supplementary Material
Acknowledgement
We thank the NYU BSL3 high-containment facility, the NYULH Center for Biospecimen Research and Development, the Histology and Immunohistochemistry Laboratory (CBRD; RRID:SCR_018304), the Experimental Pathology Division (ExPath), the NYU Genome Technology Center (GTC), the NYU Microscopy Laboratory, the NYU Immune Monitoring Laboratory (IML) at the NYU Langone’s Division of Advanced Research Technologies (DART) for their assistance. The DART CBRD, ExPath, IML and the Microscopy Lab cores are supported by the NIH/NCI grant P30CA016087. CBRD is also supported by the Laura and Isaac Perlmutter Cancer Center Support Grant. ExPath is also supported by NIH S10 OD021747. This work was funded by the NIH/NHLBI grant 1R01HL165258 (C.G.). C.G. also acknowledges support from grants NIH/NHLBI R01HL153712, AHA 20SFRN35210252, CZI NFL-2020-218415, U34TR003594. N.E is supported by the AHA Research supplement to promote diversity in science (AHA 965509); M.G.N is supported by the AHA Postdoctoral Fellowship 19-A0-00-1003686; D.D. is supported by the AHA grant 20SFRN35210252; SARS-CoV-2 work in the M.S. laboratory is supported by NIH/NIAID R01AI160706 and NIH/NIDDK R01DK130425; K.A.S is supported by NIH/NIAID 1R01 AI162774-01A1, NYU Grossman School of Medicine start up funds, and NYU Cardiovascular Research Center pilot award. K.J.M. is supported by NIH/NHLBI R35HL R35HL135799 and R01HL084312. The publicly available data used for the analyses described in this manuscript were obtained from the GTEx Portal. The Genotype-Tissue Expression (GTEx) Project was supported by the Common Fund of the Office of the Director of the National Institutes of Health, and by NCI, NHGRI, NHLBI, NIDA, NIMH, and NINDS.
Competing Interests
The M.S. laboratory has received unrelated research funding in sponsored research agreements from ArgenX N.V., Moderna and Phio Pharmaceuticals which has no competing interest with this work. The authors declare no other competing interests.
Footnotes
Code availability
Code used for data analysis is available on GitHub at https://github.com/giannarelli-lab/SARS-CoV-2-infection-triggers-pro-atherogenic-inflammatory-responses-in-human-coronary-vessels.
Data availability
scRNA-seq data from the six human carotid arteries were previously published and are available in the GEO (GSE224273). Four additional carotid plaques were processed to obtain sc-RNAseq data deposited in the GEO (GSE235437). scRNA-seq data coronary lesions were obtained from the GEO (GSE131780). Bulk RNA-seq data from macrophages and foam cell experiments and the plaque tissues infected with SARS-CoV-2 are deposited in the GEO (GSE235437). GTEx data used are version V8, dbGaP accession number phs000424.v8.p2, and available at the GTEx portal (https://gtexportal.org/home). Murine scRNA-seq data from ref. 16 were extracted from BioProject accession number PRJNA626450. Human (Homo sapiens) genome assembly GRCh38 (hg38) was obtained from the Genome Reference Consortium (GCA_000001405.15 GCF_000001405.26). SARS-CoV-2 Washington isolate (WA1/2020) genome was obtained from the NIH repository (GenBank: MN985325.1). The following reagent was deposited by the Centers for Disease Control and Prevention and obtained through BEI Resources, NIAID, NIH: SARS-Related Coronavirus 2, Isolate hCoV-19/USA-WA1/2020, NR-52281. The following reagent was obtained through BEI Resources, NIAID, NIH Cercopithecus aethiops Kidney Epithelial Cells Expressing Transmembrane Protease, Serine and Human Angiotensin-Converting Enzyme 2 (Vero E6-TMPRSS2-T2A-ACE2, NR-54970). All other data supporting the findings in this study are included in the main article and associated files. Source data files are available on GitHub at https://github.com/giannarelli-lab/SARS-CoV-2-infection-triggers-pro-atherogenic-inflammatory-responses-in-human-coronary-vessels..
References
- 1.Lamers MM & Haagmans BL SARS-CoV-2 pathogenesis. Nat Rev Microbiol 20, 270–284 (2022). 10.1038/s41579-022-00713-0 [DOI] [PubMed] [Google Scholar]
- 2.Engelen SE, Robinson AJB, Zurke YX & Monaco C Therapeutic strategies targeting inflammation and immunity in atherosclerosis: how to proceed? Nat Rev Cardiol 19, 522–542 (2022). 10.1038/s41569-021-00668-4 [DOI] [PMC free article] [PubMed] [Google Scholar]
- 3.Katsoularis I, Fonseca-Rodriguez O, Farrington P, Lindmark K & Fors Connolly AM Risk of acute myocardial infarction and ischaemic stroke following COVID-19 in Sweden: a self-controlled case series and matched cohort study. Lancet 398, 599–607 (2021). 10.1016/S0140-6736(21)00896-5 [DOI] [PMC free article] [PubMed] [Google Scholar]
- 4.Kwong JC et al. Acute Myocardial Infarction after Laboratory-Confirmed Influenza Infection. N Engl J Med 378, 345–353 (2018). 10.1056/NEJMoa1702090 [DOI] [PubMed] [Google Scholar]
- 5.Merkler AE et al. Risk of Ischemic Stroke in Patients With Coronavirus Disease 2019 (COVID-19) vs Patients With Influenza. JAMA Neurol (2020). 10.1001/jamaneurol.2020.2730 [DOI] [PMC free article] [PubMed] [Google Scholar]
- 6.Xie Y, Xu E, Bowe B & Al-Aly Z Long-term cardiovascular outcomes of COVID-19. Nat Med 28, 583–590 (2022). 10.1038/s41591-022-01689-3 [DOI] [PMC free article] [PubMed] [Google Scholar]
- 7.Fajgenbaum DC & June CH Cytokine Storm. N Engl J Med 383, 2255–2273 (2020). 10.1056/NEJMra2026131 [DOI] [PMC free article] [PubMed] [Google Scholar]
- 8.Liu J et al. SARS-CoV-2 cell tropism and multiorgan infection. Cell Discov 7, 17 (2021). 10.1038/s41421-021-00249-2 [DOI] [PMC free article] [PubMed] [Google Scholar]
- 9.Sefik E et al. Inflammasome activation in infected macrophages drives COVID-19 pathology. Nature 606, 585–593 (2022). 10.1038/s41586-022-04802-1 [DOI] [PMC free article] [PubMed] [Google Scholar]
- 10.Moore KJ, Sheedy FJ & Fisher EA Macrophages in atherosclerosis: a dynamic balance. Nat Rev Immunol 13, 709–721 (2013). 10.1038/nri3520 [DOI] [PMC free article] [PubMed] [Google Scholar]
- 11.Narula N, Olin JW & Narula N Pathologic Disparities Between Peripheral Artery Disease and Coronary Artery Disease. Arterioscler Thromb Vasc Biol 40, 1982–1989 (2020). 10.1161/ATVBAHA.119.312864 [DOI] [PubMed] [Google Scholar]
- 12.Otsuka F et al. Natural progression of atherosclerosis from pathologic intimal thickening to late fibroatheroma in human coronary arteries: A pathology study. Atherosclerosis 241, 772–782 (2015). 10.1016/j.atherosclerosis.2015.05.011 [DOI] [PMC free article] [PubMed] [Google Scholar]
- 13.Saccon TD et al. SARS-CoV-2 infects adipose tissue in a fat depot- and viral lineage-dependent manner. Nat Commun 13, 5722 (2022). 10.1038/s41467-022-33218-8 [DOI] [PMC free article] [PubMed] [Google Scholar]
- 14.Martinez-Colon GJ et al. SARS-CoV-2 infection drives an inflammatory response in human adipose tissue through infection of adipocytes and macrophages. Sci Transl Med 14, eabm9151 (2022). 10.1126/scitranslmed.abm9151 [DOI] [PMC free article] [PubMed] [Google Scholar]
- 15.Wirka RC et al. Atheroprotective roles of smooth muscle cell phenotypic modulation and the TCF21 disease gene as revealed by single-cell analysis. Nat Med 25, 1280–1289 (2019). 10.1038/s41591-019-0512-5 [DOI] [PMC free article] [PubMed] [Google Scholar]
- 16.Wang Y et al. Clonally expanding smooth muscle cells promote atherosclerosis by escaping efferocytosis and activating the complement cascade. Proc Natl Acad Sci U S A 117, 15818–15826 (2020). 10.1073/pnas.2006348117 [DOI] [PMC free article] [PubMed] [Google Scholar]
- 17.Rong JX, Shapiro M, Trogan E & Fisher EA Transdifferentiation of mouse aortic smooth muscle cells to a macrophage-like state after cholesterol loading. Proc Natl Acad Sci U S A 100, 13531–13536 (2003). 10.1073/pnas.1735526100 [DOI] [PMC free article] [PubMed] [Google Scholar]
- 18.Shankman LS et al. KLF4-dependent phenotypic modulation of smooth muscle cells has a key role in atherosclerotic plaque pathogenesis. Nat Med 21, 628–637 (2015). 10.1038/nm.3866 [DOI] [PMC free article] [PubMed] [Google Scholar]
- 19.Feil S et al. Transdifferentiation of vascular smooth muscle cells to macrophage-like cells during atherogenesis. Circ Res 115, 662–667 (2014). 10.1161/CIRCRESAHA.115.304634 [DOI] [PubMed] [Google Scholar]
- 20.Allahverdian S, Chehroudi AC, McManus BM, Abraham T & Francis GA Contribution of intimal smooth muscle cells to cholesterol accumulation and macrophage-like cells in human atherosclerosis. Circulation 129, 1551–1559 (2014). 10.1161/CIRCULATIONAHA.113.005015 [DOI] [PubMed] [Google Scholar]
- 21.Xie X et al. An Infectious cDNA Clone of SARS-CoV-2. Cell Host Microbe 27, 841–848 e843 (2020). 10.1016/j.chom.2020.04.004 [DOI] [PMC free article] [PubMed] [Google Scholar]
- 22.Combe M, Garijo R, Geller R, Cuevas JM & Sanjuan R Single-Cell Analysis of RNA Virus Infection Identifies Multiple Genetically Diverse Viral Genomes within Single Infectious Units. Cell Host Microbe 18, 424–432 (2015). 10.1016/j.chom.2015.09.009 [DOI] [PMC free article] [PubMed] [Google Scholar]
- 23.Heldt FS, Kupke SY, Dorl S, Reichl U & Frensing T Single-cell analysis and stochastic modelling unveil large cell-to-cell variability in influenza A virus infection. Nat Commun 6, 8938 (2015). 10.1038/ncomms9938 [DOI] [PMC free article] [PubMed] [Google Scholar]
- 24.Zhu Y, Yongky A & Yin J Growth of an RNA virus in single cells reveals a broad fitness distribution. Virology 385, 39–46 (2009). 10.1016/j.virol.2008.10.031 [DOI] [PMC free article] [PubMed] [Google Scholar]
- 25.Cohen EM, Avital N, Shamay M & Kobiler O Abortive herpes simplex virus infection of nonneuronal cells results in quiescent viral genomes that can reactivate. Proc Natl Acad Sci U S A 117, 635–640 (2020). 10.1073/pnas.1910537117 [DOI] [PMC free article] [PubMed] [Google Scholar]
- 26.Ioannidis LJ, Verity EE, Crawford S, Rockman SP & Brown LE Abortive replication of influenza virus in mouse dendritic cells. J Virol 86, 5922–5925 (2012). 10.1128/JVI.07060-11 [DOI] [PMC free article] [PubMed] [Google Scholar]
- 27.Lucas C et al. Longitudinal analyses reveal immunological misfiring in severe COVID-19. Nature 584, 463–469 (2020). 10.1038/s41586-020-2588-y [DOI] [PMC free article] [PubMed] [Google Scholar]
- 28.Munnur D et al. Altered ISGylation drives aberrant macrophage-dependent immune responses during SARS-CoV-2 infection. Nat Immunol 22, 1416–1427 (2021). 10.1038/s41590-021-01035-8 [DOI] [PubMed] [Google Scholar]
- 29.Cheng J et al. IL-27 induces IFN/STAT1-dependent genes and enhances function of TIGIT(+) HIVGag-specific T cells. iScience 25, 103588 (2022). 10.1016/j.isci.2021.103588 [DOI] [PMC free article] [PubMed] [Google Scholar]
- 30.Heaton NS & Randall G Multifaceted roles for lipids in viral infection. Trends Microbiol 19, 368–375 (2011). 10.1016/j.tim.2011.03.007 [DOI] [PMC free article] [PubMed] [Google Scholar]
- 31.Cloherty APM, Olmstead AD, Ribeiro CMS & Jean F Hijacking of Lipid Droplets by Hepatitis C, Dengue and Zika Viruses-From Viral Protein Moonlighting to Extracellular Release. Int J Mol Sci 21 (2020). 10.3390/ijms21217901 [DOI] [PMC free article] [PubMed] [Google Scholar]
- 32.Theken KN, Tang SY, Sengupta S & FitzGerald GA The roles of lipids in SARS-CoV-2 viral replication and the host immune response. J Lipid Res 62, 100129 (2021). 10.1016/j.jlr.2021.100129 [DOI] [PMC free article] [PubMed] [Google Scholar]
- 33.Collins KL, Chen BK, Kalams SA, Walker BD & Baltimore D HIV-1 Nef protein protects infected primary cells against killing by cytotoxic T lymphocytes. Nature 391, 397–401 (1998). 10.1038/34929 [DOI] [PubMed] [Google Scholar]
- 34.Hansen TH & Bouvier M MHC class I antigen presentation: learning from viral evasion strategies. Nat Rev Immunol 9, 503–513 (2009). 10.1038/nri2575 [DOI] [PubMed] [Google Scholar]
- 35.Bizzotto J et al. SARS-CoV-2 Infection Boosts MX1 Antiviral Effector in COVID-19 Patients. iScience 23, 101585 (2020). 10.1016/j.isci.2020.101585 [DOI] [PMC free article] [PubMed] [Google Scholar]
- 36.Domizio JD et al. The cGAS-STING pathway drives type I IFN immunopathology in COVID-19. Nature 603, 145–151 (2022). 10.1038/s41586-022-04421-w [DOI] [PMC free article] [PubMed] [Google Scholar]
- 37.Prelli Bozzo C et al. IFITM proteins promote SARS-CoV-2 infection and are targets for virus inhibition in vitro. Nat Commun 12, 4584 (2021). 10.1038/s41467-021-24817-y [DOI] [PMC free article] [PubMed] [Google Scholar]
- 38.Kuznetsova T, Prange KHM, Glass CK & de Winther MPJ Transcriptional and epigenetic regulation of macrophages in atherosclerosis. Nat Rev Cardiol 17, 216–228 (2020). 10.1038/s41569-019-0265-3 [DOI] [PMC free article] [PubMed] [Google Scholar]
- 39.Seth RB, Sun L, Ea CK & Chen ZJ Identification and characterization of MAVS, a mitochondrial antiviral signaling protein that activates NF-kappaB and IRF 3. Cell 122, 669–682 (2005). 10.1016/j.cell.2005.08.012 [DOI] [PubMed] [Google Scholar]
- 40.Minkoff JM & tenOever B Innate immune evasion strategies of SARS-CoV-2. Nat Rev Microbiol 21, 178–194 (2023). 10.1038/s41579-022-00839-1 [DOI] [PMC free article] [PubMed] [Google Scholar]
- 41.Garcia-Nicolas O, Godel A, Zimmer G & Summerfield A Macrophage phagocytosis of SARS-CoV-2-infected cells mediates potent plasmacytoid dendritic cell activation. Cell Mol Immunol 20, 835–849 (2023). 10.1038/s41423-023-01039-4 [DOI] [PMC free article] [PubMed] [Google Scholar]
- 42.Janeway CA Jr. & Medzhitov R Innate immune recognition. Annu Rev Immunol 20, 197–216 (2002). 10.1146/annurev.immunol.20.083001.084359 [DOI] [PubMed] [Google Scholar]
- 43.tenOever BR The Evolution of Antiviral Defense Systems. Cell Host Microbe 19, 142–149 (2016). 10.1016/j.chom.2016.01.006 [DOI] [PubMed] [Google Scholar]
- 44.Blanco-Melo D et al. Imbalanced Host Response to SARS-CoV-2 Drives Development of COVID-19. Cell 181, 1036–1045 e1039 (2020). 10.1016/j.cell.2020.04.026 [DOI] [PMC free article] [PubMed] [Google Scholar]
- 45.Lazear HM, Schoggins JW & Diamond MS Shared and Distinct Functions of Type I and Type III Interferons. Immunity 50, 907–923 (2019). 10.1016/j.immuni.2019.03.025 [DOI] [PMC free article] [PubMed] [Google Scholar]
- 46.Ridker PM & Rane M Interleukin-6 Signaling and Anti-Interleukin-6 Therapeutics in Cardiovascular Disease. Circ Res 128, 1728–1746 (2021). 10.1161/CIRCRESAHA.121.319077 [DOI] [PubMed] [Google Scholar]
- 47.Ridker PM et al. Antiinflammatory Therapy with Canakinumab for Atherosclerotic Disease. N Engl J Med 377, 1119–1131 (2017). 10.1056/NEJMoa1707914 [DOI] [PubMed] [Google Scholar]
- 48.Zernecke A, Bernhagen J & Weber C Macrophage migration inhibitory factor in cardiovascular disease. Circulation 117, 1594–1602 (2008). 10.1161/CIRCULATIONAHA.107.729125 [DOI] [PubMed] [Google Scholar]
- 49.Wang J et al. Interleukin 18 function in atherosclerosis is mediated by the interleukin 18 receptor and the Na-Cl co-transporter. Nat Med 21, 820–826 (2015). 10.1038/nm.3890 [DOI] [PMC free article] [PubMed] [Google Scholar]
- 50.Bastard P et al. Autoantibodies against type I IFNs in patients with life-threatening COVID-19. Science 370 (2020). 10.1126/science.abd4585 [DOI] [PMC free article] [PubMed] [Google Scholar]
- 51.Hoffmann M et al. SARS-CoV-2 Cell Entry Depends on ACE2 and TMPRSS2 and Is Blocked by a Clinically Proven Protease Inhibitor. Cell 181, 271–280 e278 (2020). 10.1016/j.cell.2020.02.052 [DOI] [PMC free article] [PubMed] [Google Scholar]
- 52.Kyrou I, Randeva HS, Spandidos DA & Karteris E Not only ACE2-the quest for additional host cell mediators of SARS-CoV-2 infection: Neuropilin-1 (NRP1) as a novel SARS-CoV-2 host cell entry mediator implicated in COVID-19. Signal Transduct Target Ther 6, 21 (2021). 10.1038/s41392-020-00460-9 [DOI] [PMC free article] [PubMed] [Google Scholar]
- 53.Cantuti-Castelvetri L et al. Neuropilin-1 facilitates SARS-CoV-2 cell entry and infectivity. Science 370, 856–860 (2020). 10.1126/science.abd2985 [DOI] [PMC free article] [PubMed] [Google Scholar]
- 54.Daly JL et al. Neuropilin-1 is a host factor for SARS-CoV-2 infection. Science 370, 861–865 (2020). 10.1126/science.abd3072 [DOI] [PMC free article] [PubMed] [Google Scholar]
- 55.Dann E, Henderson NC, Teichmann SA, Morgan MD & Marioni JC Differential abundance testing on single-cell data using k-nearest neighbor graphs. Nat Biotechnol 40, 245–253 (2022). 10.1038/s41587-021-01033-z [DOI] [PMC free article] [PubMed] [Google Scholar]
- 56.Kim K et al. Transcriptome Analysis Reveals Nonfoamy Rather Than Foamy Plaque Macrophages Are Proinflammatory in Atherosclerotic Murine Models. Circ Res 123, 1127–1142 (2018). 10.1161/CIRCRESAHA.118.312804 [DOI] [PMC free article] [PubMed] [Google Scholar]
- 57.Solomon BD, Mueller C, Chae WJ, Alabanza LM & Bynoe MS Neuropilin-1 attenuates autoreactivity in experimental autoimmune encephalomyelitis. Proc Natl Acad Sci U S A 108, 2040–2045 (2011). 10.1073/pnas.1008721108 [DOI] [PMC free article] [PubMed] [Google Scholar]
- 58.Dai X et al. A novel role for myeloid cell-specific neuropilin 1 in mitigating sepsis. FASEB J 31, 2881–2892 (2017). 10.1096/fj.201601238R [DOI] [PMC free article] [PubMed] [Google Scholar]
- 59.Stein SR et al. SARS-CoV-2 infection and persistence in the human body and brain at autopsy. Nature 612, 758–763 (2022). 10.1038/s41586-022-05542-y [DOI] [PMC free article] [PubMed] [Google Scholar]
- 60.Lindner D et al. Association of Cardiac Infection With SARS-CoV-2 in Confirmed COVID-19 Autopsy Cases. JAMA Cardiol 5, 1281–1285 (2020). 10.1001/jamacardio.2020.3551 [DOI] [PMC free article] [PubMed] [Google Scholar]
- 61.Robbins CS et al. Local proliferation dominates lesional macrophage accumulation in atherosclerosis. Nat Med 19, 1166–1172 (2013). 10.1038/nm.3258 [DOI] [PMC free article] [PubMed] [Google Scholar]
- 62.Bajpai G et al. The human heart contains distinct macrophage subsets with divergent origins and functions. Nat Med 24, 1234–1245 (2018). 10.1038/s41591-018-0059-x [DOI] [PMC free article] [PubMed] [Google Scholar]
- 63.Brewer CM & Majesky MW Branch Point Smooth Muscle Cells Highlighted by Novel Lineage Tracking Approach. Circ Res 122, 194–196 (2018). 10.1161/CIRCRESAHA.117.312444 [DOI] [PMC free article] [PubMed] [Google Scholar]
- 64.Nilsson-Payant BE et al. The NF-kappaB Transcriptional Footprint Is Essential for SARS-CoV-2 Replication. J Virol 95, e0125721 (2021). 10.1128/JVI.01257-21 [DOI] [PMC free article] [PubMed] [Google Scholar]
- 65.Merkler AE et al. Risk of Ischemic Stroke in Patients With Coronavirus Disease 2019 (COVID-19) vs Patients With Influenza. JAMA Neurol 77, 1–7 (2020). 10.1001/jamaneurol.2020.2730 [DOI] [PMC free article] [PubMed] [Google Scholar]
- 66.Fernandez DM et al. Single-cell immune landscape of human atherosclerotic plaques. Nat Med 25, 1576–1588 (2019). 10.1038/s41591-019-0590-4 [DOI] [PMC free article] [PubMed] [Google Scholar]
- 67.Hao Y et al. Integrated analysis of multimodal single-cell data. Cell 184, 3573–3587 e3529 (2021). 10.1016/j.cell.2021.04.048 [DOI] [PMC free article] [PubMed] [Google Scholar]
- 68.Korsunsky I et al. Fast, sensitive and accurate integration of single-cell data with Harmony. Nat Methods 16, 1289–1296 (2019). 10.1038/s41592-019-0619-0 [DOI] [PMC free article] [PubMed] [Google Scholar]
- 69.Noval MG et al. Antibody isotype diversity against SARS-CoV-2 is associated with differential serum neutralization capacities. Sci Rep 11, 5538 (2021). 10.1038/s41598-021-84913-3 [DOI] [PMC free article] [PubMed] [Google Scholar]
- 70.Kuleshov MV et al. Enrichr: a comprehensive gene set enrichment analysis web server 2016 update. Nucleic Acids Res 44, W90–97 (2016). 10.1093/nar/gkw377 [DOI] [PMC free article] [PubMed] [Google Scholar]
- 71.Chen EY et al. Enrichr: interactive and collaborative HTML5 gene list enrichment analysis tool. BMC Bioinformatics 14, 128 (2013). 10.1186/1471-2105-14-128 [DOI] [PMC free article] [PubMed] [Google Scholar]
Associated Data
This section collects any data citations, data availability statements, or supplementary materials included in this article.
Supplementary Materials
Data Availability Statement
scRNA-seq data from the six human carotid arteries were previously published and are available in the GEO (GSE224273). Four additional carotid plaques were processed to obtain sc-RNAseq data deposited in the GEO (GSE235437). scRNA-seq data coronary lesions were obtained from the GEO (GSE131780). Bulk RNA-seq data from macrophages and foam cell experiments and the plaque tissues infected with SARS-CoV-2 are deposited in the GEO (GSE235437). GTEx data used are version V8, dbGaP accession number phs000424.v8.p2, and available at the GTEx portal (https://gtexportal.org/home). Murine scRNA-seq data from ref. 16 were extracted from BioProject accession number PRJNA626450. Human (Homo sapiens) genome assembly GRCh38 (hg38) was obtained from the Genome Reference Consortium (GCA_000001405.15 GCF_000001405.26). SARS-CoV-2 Washington isolate (WA1/2020) genome was obtained from the NIH repository (GenBank: MN985325.1). The following reagent was deposited by the Centers for Disease Control and Prevention and obtained through BEI Resources, NIAID, NIH: SARS-Related Coronavirus 2, Isolate hCoV-19/USA-WA1/2020, NR-52281. The following reagent was obtained through BEI Resources, NIAID, NIH Cercopithecus aethiops Kidney Epithelial Cells Expressing Transmembrane Protease, Serine and Human Angiotensin-Converting Enzyme 2 (Vero E6-TMPRSS2-T2A-ACE2, NR-54970). All other data supporting the findings in this study are included in the main article and associated files. Source data files are available on GitHub at https://github.com/giannarelli-lab/SARS-CoV-2-infection-triggers-pro-atherogenic-inflammatory-responses-in-human-coronary-vessels..