

Abstract
Background:
The impact of temperature on morbidity remains largely unknown. Moreover, extensive evidence indicates contrasting patterns between temperature–mortality and temperature–morbidity associations. A nationwide comparison of the impact of temperature on mortality and morbidity in more specific subgroups is necessary to strengthen understanding and help explore underlying mechanisms by identifying susceptible populations.
Objective:
We performed this study to quantify and compare the impact of temperature on mortality and morbidity in 47 prefectures in Japan.
Methods:
We applied a two-stage time-series design with distributed lag nonlinear models and mixed-effect multivariate meta-analysis to assess the association of temperature with mortality and morbidity by causes (all-cause, circulatory, and respiratory) at prefecture and country levels between 2015 and 2019. Subgroup analysis was conducted by sex, age, and regions.
Results:
The patterns and magnitudes of temperature impacts on morbidity and mortality differed. For all-cause outcomes, cold exhibited larger effects on mortality, and heat showed larger effects on morbidity. At specific temperature percentiles, cold (first percentile) was associated with a higher relative risk (RR) of mortality [1.45; 95% confidence interval (CI): 1.39, 1.52] than morbidity (1.33; 95% CI: 1.26, 1.40), as compared to the minimum mortality/morbidity temperature. Heat (99th percentile) was associated with a higher risk of morbidity (1.30; 95% CI: 1.28, 1.33) than mortality (1.04; 95% CI: 1.02, 1.06). For cause-specific diseases, mortality due to circulatory diseases was more susceptible to heat and cold than morbidity. However, for respiratory diseases, both cold and heat showed higher risks for morbidity than mortality. Subgroup analyses suggested varied associations depending on specific outcomes.
Discussion:
Distinct patterns were observed for the association of temperature with mortality and morbidity, underlying different mechanisms of temperature on different end points, and the differences in population susceptibility are possible explanations. Future mitigation policies and preventive measures against nonoptimal temperatures should be specific to disease outcomes and targeted at susceptible populations. https://doi.org/10.1289/EHP12854
Introduction
Nonoptimal temperature exposure (both heat and cold) is among the ten leading causes of death worldwide.1 Substantial epidemiological evidence has suggested nonoptimal temperatures affect human health and may be associated with increased risks of mortality and morbidity.2,3
To date, the relationship between temperature and mortality has been investigated by a large number of studies,4,5 across multiple locations,6,7 and over time.8,9 However, the understanding of the effect of temperature on morbidity (hospitalization, outpatient, or emergency department visit) is limited, and most of the extant studies on morbidity were limited to restricted locations and usually focused on heat.2,3,10 Moreover, existing studies on the topic reported different exposure–response associations for temperature-related mortality and morbidity.11–14 For example, a Spanish study comparing the effects of temperature on cardiovascular and respiratory disease mortality and hospitalization found that increased risks of both mortality and morbidity were associated with cold, but not to the same extent, whereas heat only affected mortality.14 Therefore, the evidence on temperature–mortality association cannot be directly applied to the temperature-morbidity association. A detailed comparative study in the same population by subgroups is needed to better understand temperature effect on human health. It could provide important evidence to the risk management of climate change and more insight into identifying susceptible population.
Here, we conducted a nationwide comparative study to estimate and compare the association of ambient temperature with mortality and morbidity in 47 prefectures in Japan. We performed subgroup analyses stratified by specific causes, sex, age, and regions. To our knowledge, this study is the first to address this question and undertake a comprehensive assessment of specific subgroups in the Japanese population.
Methods
Data Collection
Daily mortality data was extracted from Ministry of Health, Labor and Welfare of Japan. All-cause, circulatory, and respiratory mortality data were disaggregated by sex and age groups for 47 prefectures for the study period of 2015–2019. Circulatory causes for mortality were coded by the International Classification of Diseases, tenth revision (ICD-10) codes I00–I99. Respiratory causes of death were coded by J00–J99 (ICD-10).
Daily time series data on all-cause and cause-specific (circulatory and respiratory) emergency ambulance dispatch (EAD) data for 47 prefectures between 2015 and 2019 (except for Tokyo mainland, which was available during 2016–2019) were collected from the Fire and Disaster Management Agency of the Ministry of Internal Affairs and Communication. Circulatory and respiratory system EADs were coded in the accordance with the ICD-10 codes I00–I99 and J00–J99, respectively. The severity of illness for each EAD case was classified into six levels (death, life-threatening, severe, moderate, mild, or other) and was determined by the physician who initially evaluated the patient upon their arrival to the hospital. The details of the emergency medical services and registration system have been explained elsewhere.15
Mortality and EAD data were aggregated by cause, sex, and age groups ( and years of age) in each prefecture. Daily mean temperature and relative humidity for each prefecture were obtained from the Japan Meteorological Agency for the same study period. Ethical approval was not required since all data collected in this study was secondary data without any personal information and not transferable.
Statistical Analysis
The statistical analysis consists of two stages. We first applied standard time-series quasi-Poisson regression models that allow for overdispersion in each of the 47 prefectures to derive prefecture-specific estimates of temperature–morbidity and temperature–mortality associations for specific causes (all-cause, circulatory, and respiratory causes). Specifically, the association with temperature was specified with a standard distributed lag nonlinear model (DLNM). This class of models can describe complex nonlinear and lagged dependencies through a cross-basis function, obtained by the combination of two functions that define the conventional exposure–response relationship and the additional lag–response relationship, respectively.16 The exposure–response curve was modeled using a quadratic B-spline, with three internal knots located at the 10th, 75th, and 90th percentile of the temperature distribution, and the lag–response curve was modeled using a natural cubic B-spline with three internal knots equally placed in the log scale. The lag period was extended up to 21 d to capture the long-delayed effects of cold. The model included a natural cubic spline of 8 degrees of freedom (df) per year to control for seasonality and long-time trend, an indicator variable to adjust for the day-of-week effect, and a binary variable for the holiday effect.6,9,14
In the second stage, a mixed-effects multivariate meta-analysis was fitted to pool the overall cumulative association at the country level and obtain the best linear unbiased prediction (BLUP) for each prefecture.17,18 This meta-analysis model included random-effect indicators for the prefecture to account for variations in risks across prefectures, and fixed-effects predictors of prefecture-specific average temperature and temperature range to reduce possible differences in temperature distribution that account partially for the between-prefecture heterogeneity. We then extracted minimum mortality or morbidity temperature (MMTs) and respective percentiles (MMTPs) from the pooled exposure–response association and prefecture-specific BLUP. The search of the MMTP was restricted to the 1st to the 99th percentile. The empirical confidence intervals (eCIs) for MMT and MMTP were calculated using Monte Carlo simulations ().19 Then, the risks of mortality and morbidity associated with cold and heat are estimated, respectively, defined as the risk increment at the 1st and 99th percentiles of the temperature distribution relative to MMTP. The lag patterns for cold and heat are also examined at country level.
The morbidity and mortality burdens attributable to nonoptimal temperatures for each outcome were calculated and reported as attributable fraction (AF).16 The overall relative risk (RR) corresponding to each day of the series was used to calculate the AFs for that day and the following 21 d. The total mortality and morbidity AFs due to nonoptimal temperatures were given by the sum of contributions for all days of the series with temperatures higher or lower than the MMT. The components attributable to cold and heat were computed in turn by separating the associations corresponding to days with temperatures below or above the MMT, respectively. The total attributable number (AN) of mortality and morbidity caused by nonoptimal temperature as well as separate components of cold and heat were calculated. The 95% eCIs of attributable risks were calculated using Monte Carlo simulations ().
Subgroup Analyses
We performed subgroup analyses stratified by sex (male and female) and age groups ( and ) for each cause-specific outcome using the same two-stage modeling approach as described above. In addition, we investigated the differences between regions by repeating the two-stage analysis separately for the prefectures within northern and southern regions, as previous local evidence showed temperature–mortality associations shared similarities within each region but differed between the regions.9 The northern and southern regions are separated at the prefecture-level by Shiga prefecture from its northern boundary point located at 136.0 E longitude and 35.1 N latitude (see Figure S1). The differences in the RRs related to cold and heat for each outcome across sex, age, and region subgroups were tested and quantified as the ratio of RR (RRR).20
Sensitivity Analyses
Multiple sensitivity analyses were performed to determine the robustness of our results. We first conducted analyses for modeling exposure–response relationship in the first stage by changing the number and locations of knots, using quadratic B-splines with two knots at the 33rd and 66th percentiles or with three knots at the 25th, 50th, and 75th percentiles. The knots set was compared and decided by incorporating relationship curves, effect estimates, and the quasi-Akaike information criteria (Q-AIC). Further, we repeated the two-stage analysis with adjustment for average dewpoint, an absolute measure of humidity as most relevant for health, calculated using relative humidity and temperature.21 The 3-d moving average dewpoint was included in the first stage model with a natural cubic spline with 3 df.22 To further demonstrate the robustness of the comparison against different MMTs for mortality and morbidity, a common reference temperature was defined as the 10th and 90th percentiles of the temperature distribution for the cold and heat effects, respectively. Cold/heat-related mortality and morbidity risks were calculated as risk increments at the 1st/99th percentile of the temperature distribution relative to common cold/heat reference temperatures. We used R software (version 4.2.1; R Development Core Team) with the packages dlnm and mixmeta to perform the two-stage analysis and NipponMap package for generating maps.
Results
The dataset includes 6,676,551 deaths and 28,254,980 EADs for all causes between 2015 and 2019 in the 47 prefectures in Japan (Table 1). Among all-cause mortality, circulatory death took 25.9%, and respiratory cause accounts for 14.8%. Among all-cause EAD, the proportions of circulatory and respiratory cause were 8.4% and 5.0%, respectively. The proportions of older adults aged 65 years and older were over 90% for deaths and more than half for EADs across different causes. About 1.3%, 4.1%, and 0.7% of all-cause, circulatory, and respiratory EAD cases were classified as deaths (Table S1). Figure 1 shows the spatial map and estimates of mean temperature in 47 prefectures. Table S2 shows the distributions of prefecture-level average weather variables, ranging from 9.6°C to 23.8°C for daily mean temperature and 61.5% to 76.7% for daily relative humidity. Table S3 shows the summary statistics of deaths, EAD, and weather variables at the prefectural level.
Table 1.
Summary statistics for mortality and emergency ambulance dispatch for the 47 prefectures between 2015 and 2019 in Japan.
| Cause | All counts | Male (%) | Female (%) | y (%) | y (%) | Daily |
|---|---|---|---|---|---|---|
| All-cause | ||||||
| Mortality | 6,676,551 | 3,434,144 (51.4) | 3,242,407 (48.6) | 664,894 (10.0) | 6,011,528 (90.0) | 77.8 (66.2) |
| EADa | 28,254,980 | 14,352,066 (50.8) | 13,652,039 (48.3) | 11,604,636 (41.4) | 16,472,970 (58.3) | 330.6 (374.2) |
| Circulatory | ||||||
| Mortality | 1,731,910 | 822,052 (47.5) | 909,858 (52.5) | 140,498 (8.1) | 1,591,383 (91.9) | 20.2 (17.2) |
| EADb | 2,367,433 | 1,255,037 (53.0) | 1,108,472 (46.8) | 543,573 (23.0) | 1,823,860 (77.0) | 27.7 (28.2) |
| Respiratory | ||||||
| Mortality | 990,745 | 575,776 (58.1) | 414,969 (41.9) | 26,637 (2.7) | 964,106 (97.3) | 11.5 (10.4) |
| EADc | 1,425,928 | 761,067 (53.4) | 662,857 (46.5) | 371,451 (26.0) | 1,054,477 (74.0) | 16.7 (20.2) |
Note: EAD data for Tokyo prefecture (main island) is available from 2016 to 2019. EAD, emergency ambulance dispatch; SD, standard deviation.
The missing proportion of sex and age groups for all-cause EAD is 0.9% and 0.3%, respectively.
The missing proportion of sex groups for circulatory EAD is 0.2%.
The missing proportion of sex groups for respiratory EAD is 0.1%.
Figure 1.

Spatial map of mean temperature in 47 prefectures between 2015 and 2019 in Japan. See Table S3 for the corresponding numeric data.
Figure 2 and Figure S2 show the pooled temperature–mortality and temperature–morbidity associations and attributable risks among overall population and subgroups at the country level, respectively. In general, the exposure–response curves for mortality and morbidity due to all studied causes exhibit higher risks associated with both heat and cold temperatures (Figure 2). The MMTPs are similar between mortality and morbidity within each cause group. The heat and cold impacts, however, are distinct between mortality and morbidity, and the pattern is different for different causes. A total of 793,272 deaths and 2,323,649 EADs due to all-causes are attributable to nonoptimal temperatures nationwide (Table 2). Exposure to cold is associated with a higher risk for both mortality and EAD but not with the same magnitude. For example, the effect estimates for cold at (the first percentile of the temperature distribution at the country level) compared with MMT(P)s were larger for all-cause mortality (; 95% CI: 1.39, 1.52) than for all-cause EAD (; 95% CI: 1.26, 1.40). Exposure to heat at 30.6°C (the 99th percentile) is linked with a higher risk of all-cause EAD (; 95% CI: 1.28, 1.33) but a relatively lower risk for all-cause mortality (; 95% CI: 1.02, 1.06), with a decreasing trend in mortality risk observed as heat temperature increases toward the end of the distribution. Contrasting patterns of attributable mortality and morbidity due to heat and cold remain consistent, with a higher total fraction observed for all-cause mortality (; 95% eCI: 10.75, 12.82) than EAD (; 95% eCI: 7.28, 8.97) (Table 2; Figure S2). Figure S3 shows the lag-cumulative RR curves for cold and heat, suggesting that the higher RR of cumulative effect is mainly due to the long lag period in the association. For all-cause outcomes, cold-related mortality and EAD peaked at the same day (lag-2 d), with mortality exhibiting longer delayed effect, whereas pooled lag-effect of heat on morbidity was larger than mortality during the lag period. Contrasting patterns of temperature impacts on mortality and morbidity varied by cause (Table 2; Figure 2). In general, cold is associated with a higher risk of circulatory mortality than EAD due to circulatory causes, whereas both cold and heat are associated with a higher risk of respiratory EAD than mortality from respiratory causes. Such differences in risk are consistent with the different length of the lag effects observed for cause-specific lag–response relationships (Figure S3).
Figure 2.
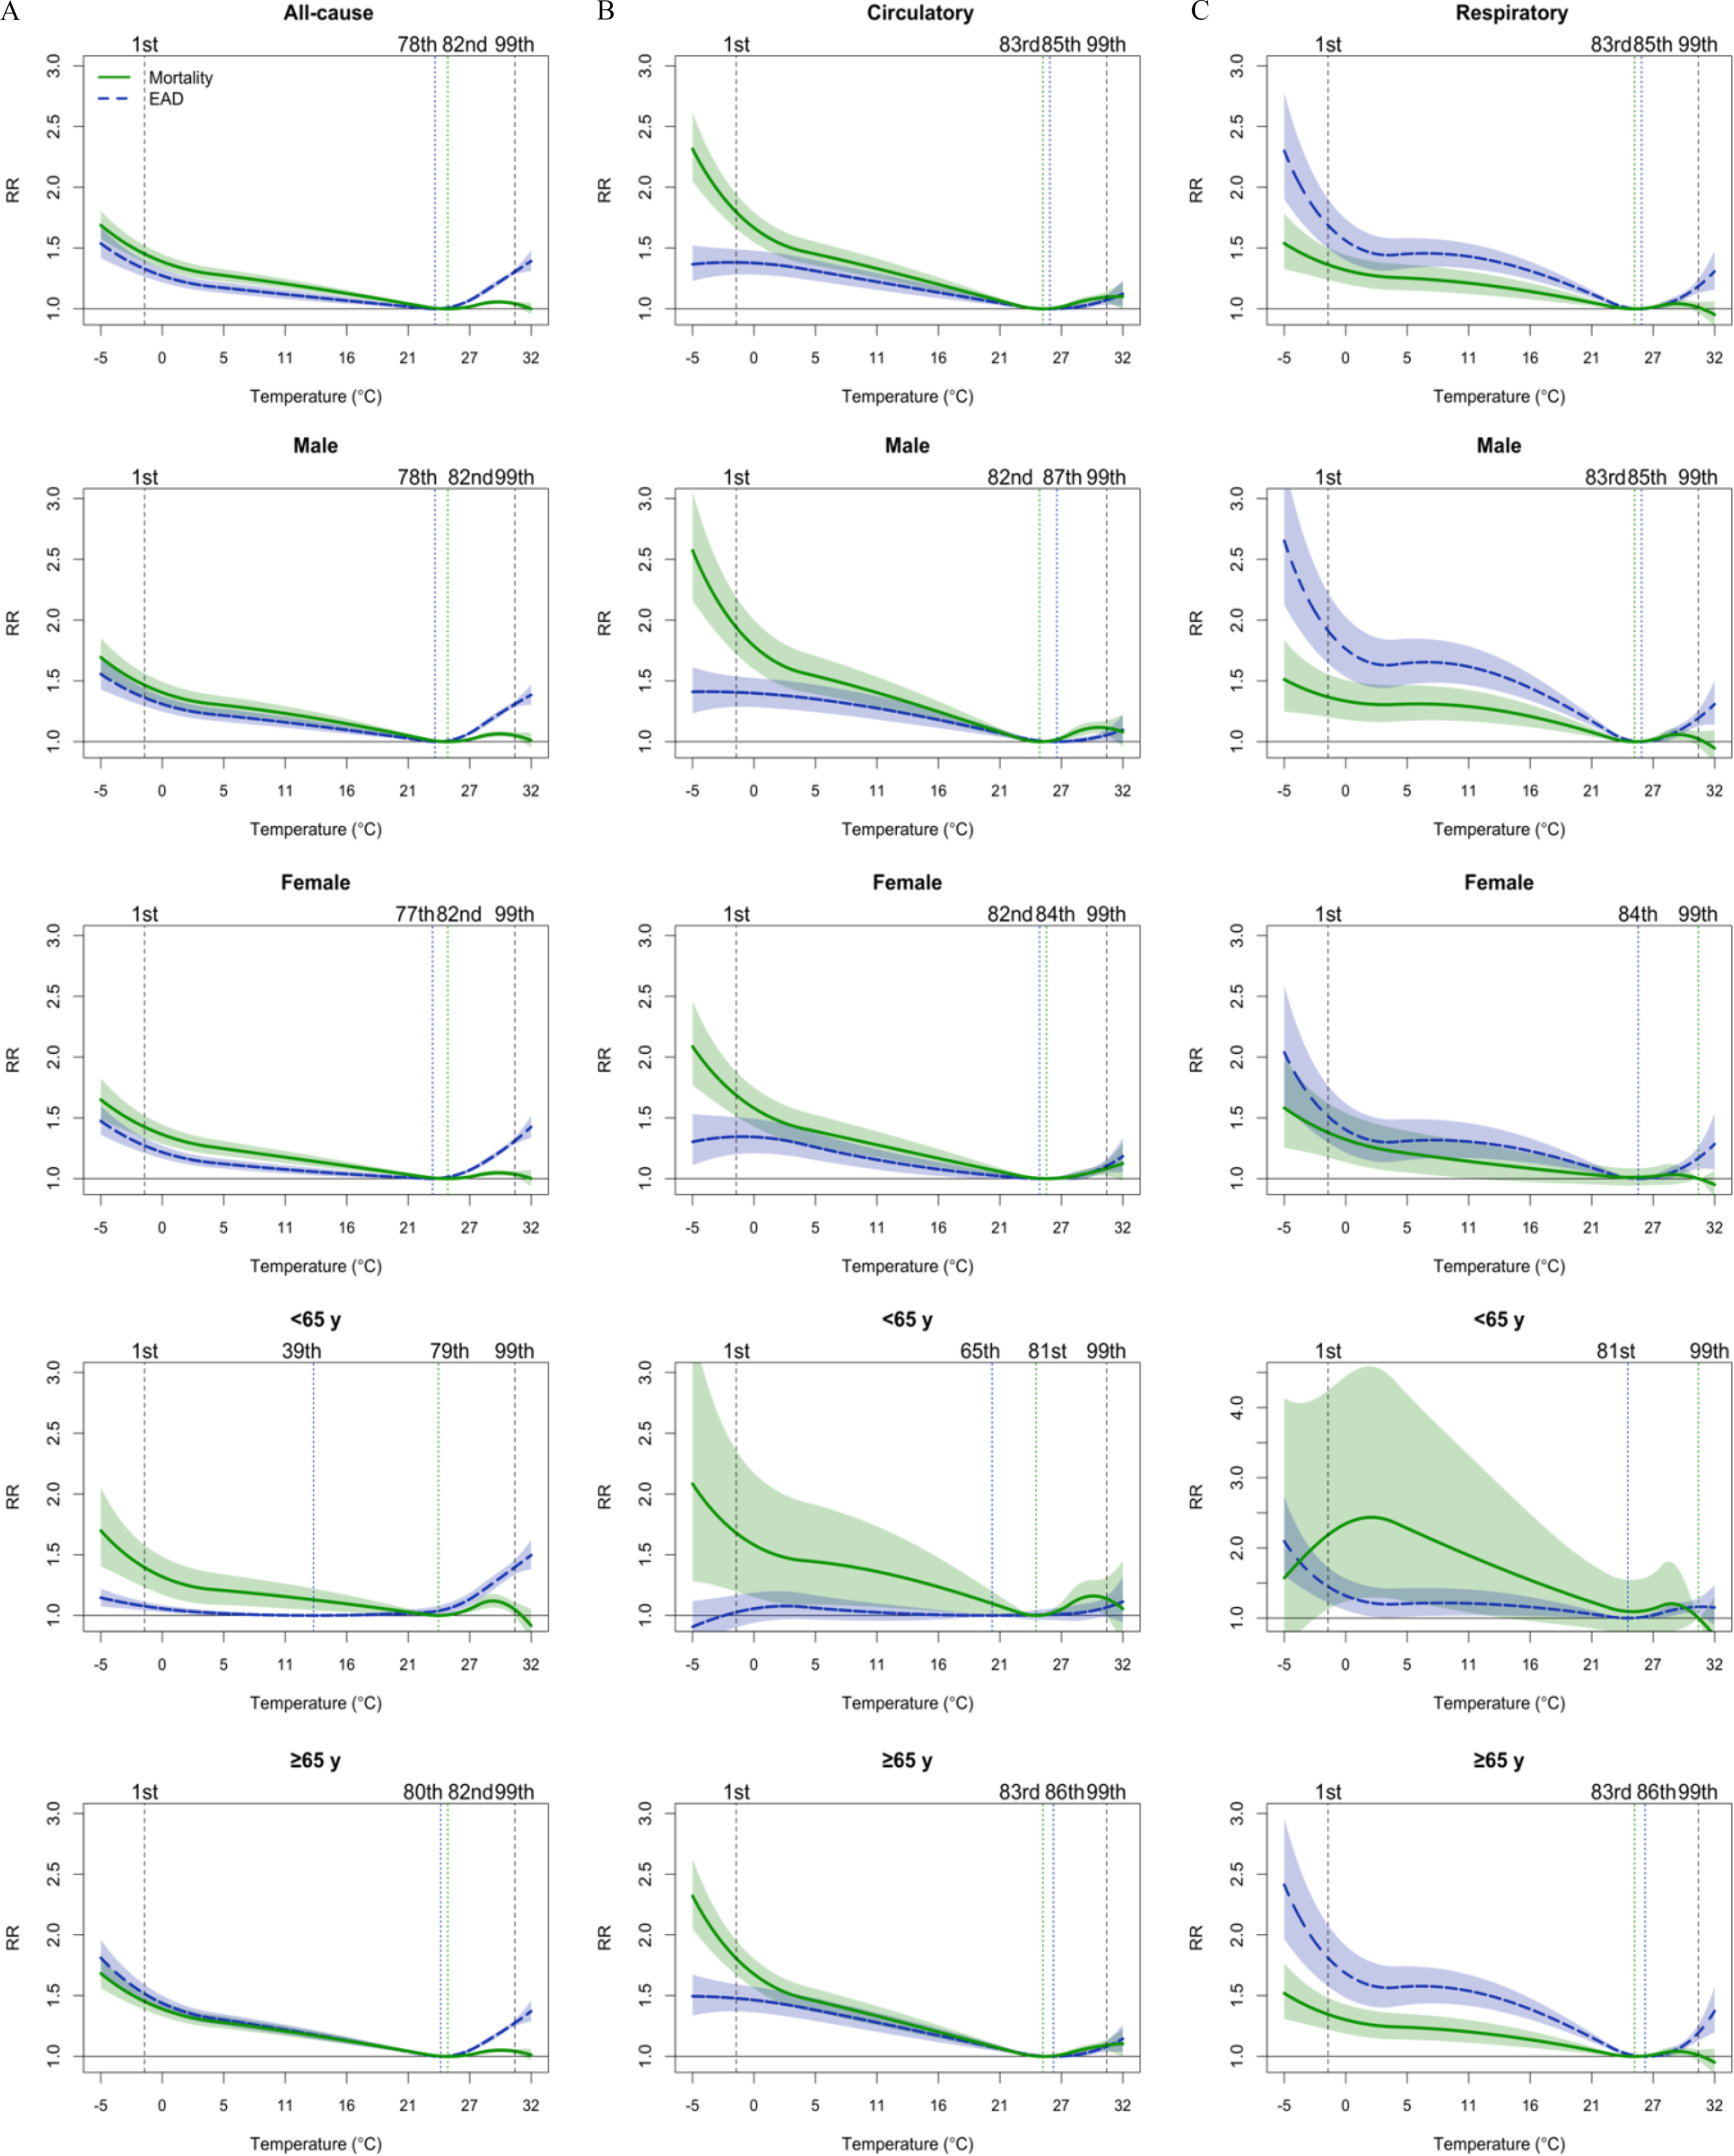
Cold and heat effects on all-cause and cause-specific mortality and EAD for the general population and different sex and age subgroups between 2015 and 2019 in Japan. The vertical lines represent the percentile of minimum mortality/morbidity temperature (dotted) and the 1st and 99th percentiles of the temperature distribution (dashed). See Table 2 for the corresponding numeric data for overall population and Table S7 for subgroup estimates. Note: EAD, emergency ambulance dispatches; RR, relative risk.
Table 2.
Cold and heat effects and attributable risks on all-cause and cause-specific mortality and emergency ambulance dispatch for overall population for the 47 prefectures between 2015 and 2019 in Japan.
| Outcome | MMTP [% (95% CI)] | MMT [°C (95% CI)] | Total AN [n (95% CI)] | Total AF [% (95% CI)] | Cold | Heat | ||||
|---|---|---|---|---|---|---|---|---|---|---|
| RR (95% CI) | AN (95% CI) | AF (95% CI) | RR (95% CI) | AN (95% CI) | AF (95% CI) | |||||
| All-cause | ||||||||||
| Mortality | 82 (81, 83) | 24.8 (24.5, 25.1) | 793,272 (718,319; 850,893) | 11.88 (10.75, 12.82) | 1.45 (1.39, 1.52) | 759,804 (693,623; 820,641) | 11.38 (10.25, 12.25) | 1.04 (1.02, 1.06) | 33,467 (28,952; 37,513) | 0.50 (0.44, 0.56) |
| EAD | 78 (77, 79) | 23.7 (23.5, 24.0) | 2,323,649 (2,069,136; 2,522,009) | 8.22 (7.28, 8.97) | 1.33 (1.26, 1.40) | 1,611,644 (1,370,990; 1,806,576) | 5.70 (4.84, 6.47) | 1.30 (1.28, 1.33) | 712,004 (626,600; 793,233) | 2.52 (2.19, 2.82) |
| Circulatory | ||||||||||
| Mortality | 83 (82, 85) | 25.1 (24.8, 25.7) | 327,074 (298,404; 349,252) | 18.89 (17.33, 20.10) | 1.80 (1.66, 1.94) | 315,969 (290,103; 336,342) | 18.24 (16.74, 19.52) | 1.10 (1.05, 1.14) | 11,105 (9,796; 12,143) | 0.64 (0.57, 0.70) |
| EAD | 85 (82, 90) | 25.7 (24.8, 27.4) | 305,150 (259,625; 337,739) | 12.89 (11.09, 14.37) | 1.38 (1.28, 1.49) | 295,134 (254,623; 328,392) | 12.47 (10.56, 13.93) | 1.07 (1.03, 1.11) | 10,016 (8,194; 11,626) | 0.42 (0.34, 0.49) |
| Respiratory | ||||||||||
| Mortality | 83 (81, 99) | 25.1 (24.5, 30.6) | 133,330 (115,313; 147,172) | 13.46 (11.60, 14.98) | 1.36 (1.24, 1.50) | 130,643 (111,784; 143,044) | 13.19 (11.34, 14.63) | 1.01 (0.97, 1.06) | 2,687 (1,987; 3,329) | 0.27 (0.20, 0.33) |
| EAD | 85 (83, 87) | 25.7 (25.1, 26.3) | 286,952 (264,137; 302,820) | 20.12 (18.44, 21.28) | 1.69 (1.50, 1.90) | 273,354 (251,783; 289,477) | 19.17 (17.53, 20.28) | 1.19 (1.13, 1.25) | 13,598 (11,769; 15,157) | 0.95 (0.82, 1.06) |
Note: The total number for mortality is 6,676,551 (all-cause), 1,731,910 (circulatory), and 990,745 (respiratory), and the total number for EAD is 28,254,980 (all-cause), 2,367,433 (circulatory), and 1,425,928 (respiratory). Attributable mortality and morbidity computed as total and as separate components for cold and heat. RR is defined as the risk increment at cold and heat (the 1st and 99th percentiles of the temperature distribution, corresponding to and 30.6°C at the country level respectively) relative to MMTP. AF, attributable fraction; AN, attributable number; CI, confidence interval; EAD, emergency ambulance dispatch; MMT(P), minimum mortality/morbidity temperature (percentile); RR, relative risk.
The nationwide contrasting patterns between mortality and morbidity by cause remain consistent at the prefecture level (Figure S4–S6). Figure 3 shows the spatial distribution of prefecture-specific cold- and heat-related risks for overall population (point estimates of RRs). Overall, the RRs for cold tended to be higher in the southern prefectures, especially for all-cause and circulatory mortality and respiratory EAD. Whereas, those for heat were higher in the northern prefectures, particularly for all-cause EAD, circulatory mortality, and respiratory EAD. The prefecture-specific MMTs, MMTPs, risks, and attributable fractions are listed in Tables S4–S6.
Figure 3.

Spatial variations in the cold- and heat-related RRs of all-cause and cause-specific mortality and EAD between 2015 and 2019 in Japan. RR is defined as the risk increment at cold and heat (the 1st and 99th percentiles of the temperature distribution) relative to MMTP. See Table S4–S6 for the corresponding prefecture-specific numeric data. Note: EAD, emergency ambulance dispatch; MMTP, minimum mortality/morbidity temperature percentile; RR, relative risk.
The observed contrasting pattern between mortality and morbidity among the overall population remains consistent for all subgroups (Figure 1; Figure S7). Figure 4 shows the cold- and heat-related RRs for specific causes stratified by sex, age, and region subgroups. We observed that the estimates of temperature–morbidity association exhibited some differences among subgroups with nonoverlapped CIs but not for mortality. Specifically, the RRs of all-cause and circulatory cause of EAD for cold were higher in people 65 years of age and older than in those younger than 65 years of age, whereas the opposite pattern showed in all-cause EAD for heat, with a higher RR in people below 65 years of age. We also found a higher RR of respiratory EAD for cold in males than among females. For cold, the RRs for all-cause EAD were higher in the south than in the north. For heat, the RRs for all-cause and respiratory EAD were higher in the north than in the south. The detailed estimates along with the significance test of difference across subgroups within cause-specific outcome is reported in Table S7.
Figure 4.

Pooled RRs with 95% CIs (vertical bars) of heat and cold on all-cause and cause-specific mortality and EAD in subgroup analyses by sex, age, and region groups. RR is defined as the risk increment at cold and heat (the 1st and 99th percentiles of the temperature distribution) relative to MMTP. See Table S7 for the corresponding numeric data and test for the difference. Note: CI, confidence interval; EAD, emergency ambulance dispatch; MMTP, minimum mortality/morbidity temperature percentile; RR, relative risk.
Sensitivity analyses suggest that the estimates were generally robust given the altered modellings of the number and location of knots for the temperature–response curve and adjustment for dewpoint (Table S8). The results with and without the adjustment for dewpoint were nearly identical, and we reported the ones without the adjustment. Furthermore, consistent contrasting patterns of temperature-related mortality and morbidity risks were observed when fitting a common reference temperature (Table S9; Figure S8).
Discussion
In this study, we conducted a comprehensive nationwide study to assess and compare the impacts of temperature on mortality and morbidity. The results suggest increased risks of both mortality and morbidity associated with cold but not to the same extent, whereas heat showed a less evident association with mortality and a large effect on morbidity. In addition, these findings varied across subgroups by causes, sex, age, and regions, suggesting that nonoptimal temperature may affect mortality and morbidity in different ways, as indicated by differed vulnerable subgroups.
Our results are largely consistent with previous findings suggesting contrasting patterns of mortality and morbidity due to nonoptimal temperatures.11–14 However, comparison with previous investigations assessing simultaneous, nonlinear exposure–response relationships is more complex, due to differences in modeling approaches, data availability, and quality. A comparison between 1,096 deaths and 16,937 hospital admission for all causes during a six-day heat wave in 1995 in the UK demonstrated effects only for mortality but not for morbidity.11 Another analysis for hot spell effects on mortality and morbidity due to cardiovascular diseases during 1994–2009 in the Czech Republic consistently reported a significant increase in mortality, while the association with hospital admissions was weak and mostly insignificant.12 A comparative assessment in Taiwan of mortality and morbidity (emergency room visits and outpatient visits) due to circulatory diseases in association with extreme temperatures between 2000 and 2014, using a DLNM with different lag periods for cold (10 lag days) and heat (5 lag days), observed that extreme low and high temperatures were associated with higher risks of mortality than of morbidity.13 Their study also showed an inverse direction of lagged associations with mortality and morbidity for cold, which is similar to our findings. The lagged effect of cold on emergency room visits peaked immediately on the current day of exposure, whereas mortality peaked 5 d later. A larger study, including 52 cities in Spain during the period of 1997–2014, reported that both mortality and morbidity (hospital admissions) due to cardiovascular and respiratory diseases increased with cold, whereas heat was only found to have an impact on mortality but not on morbidity.14 However, the between-city heterogeneity was large in their analysis, and the data lacked representativeness due to large missing values of morbidity data. These issues highlight the advantage of our study design and modeling technique, where analyses are performed using a nationwide dataset aggregated at the prefecture-level and allow consistent modeling of nonlinear and delayed effects of both heat and cold temperature.
The observed contrasting patterns might have several explanations. One possible explanation is the difference in disease distribution between mortality and morbidity. Emergency ambulance dispatch may better reflect the less severe and more acute response to nonoptimal temperature, which could therefore be captured earlier, potentially better differentiating susceptibility to nonfatal effects. The observed stronger effect of heat on all-cause morbidity than mortality may be explained by the higher proportion of heat-sensitive diseases (such as heatstroke and genitourinary diseases) with less severe conditions in EADs, as previous investigations in Japan showed high heat-related risks of EAD due to these disorders.23 However, the mechanism by which nonoptimal temperatures trigger fatal outcomes may vary, as for those with long-term chronic illness or higher severity, they may encounter death before being admitted to a hospital or receiving medical attention.11,12 Based on our findings, we also hypothesize that the distinct effects of temperature on different outcomes are more likely to be driven by longer lag periods. A more detailed study of the different patterns of lagged associations of mortality and morbidity with nonoptimal temperatures will further contribute to the topic.
In our study, the analysis on this topic was further extended by assessing sex-, age-, and regional differences in the associations. Only one assessment among previous comparisons has evaluated gender and age differences, with more pronounced effects of hot spells on cardiovascular mortality in males and the older population.12 In contrast to their findings, our results demonstrated age and sex differences for temperature–morbidity association only. Contrast subgroup differences in temperature-related mortality and morbidity could point toward differences in the above-motioned disease distribution and the prevalence of comorbid chronic diseases but could also imply differences in exposure related to fatal and nonfatal diseases in terms of age and sex distribution, behavior, lifestyle, and occupation. Based on our analysis, subgroup differences were only prominent in temperature–morbidity association. In particular, for all-cause morbidity, people younger than 65 years of age were more susceptible to heat, whereas those 65 years of age and older were more susceptible to cold. This trend is largely driven by different MMTs, a critical indicator characterizing the complex exposure–response association and representing climate adaptation.7 The low MMT (13.2°C) for the younger age group indicates greater room for adaptation; therefore, more effective adaptive strategies targeting younger populations should be implemented. For heat, many heat-related morbidities in temperate regions are mainly coronary and cerebral thromboses resulting from hemoconcentration due to loss of salt and water in sweat.24 We hypothesize that younger people are more likely than older people to have outdoor work or activities and face situations where mitigation behaviors, such as cooling, cannot be used in time. For cause-specific morbidity, we observed that people 65 years of age and older and males were more susceptible to cold-related circulatory and respiratory morbidity, respectively. In terms of cold effects, the increase in circulatory morbidity could be explained by increases in blood pressure in older people but not younger groups.25 Cold stress also leads to an increase in blood thrombotic factors in the blood of older adults due to their much higher baseline fibrinogen levels. Respiratory infections spread more easily in cold temperatures, and people tend to congregate in poorly ventilated spaces when it is cold.24 Therefore, we speculate that part of the reason for males to be more susceptible to respiratory morbidity in cold weather may be that males are the main labor force for cluster works, such as factories. In addition, women are suspected to be better at coping with health risks than men,9 such as wearing masks and taking medication early in the onset of symptoms before secondary infections within this context; further investigations are required to verify these hypotheses.
In the southern part of Japan, relatively lower heat risks for morbidity were observed. This suggests that the mechanisms of adaptation to heat might differ between two regions. Possible adaptation can occur directly following physiological adaptation or through multiple adaptive changes, including planned adaptive measures such as infrastructural change and spontaneous adaptive behavior such as appropriate clothing.26,27 Physiological adaptation can occur following a warmer climate in southern prefectures, as populations are more exposed to hotter weather compared to those in northern prefectures and may be better adapted to heat. Moreover, one previous nationwide study proved a generally higher air conditioning (AC) prevalence in the south, reflecting a higher need to cope with heat.9 The additional mechanism through similar adaptive behaviors adopted during the summer might have contributed to the observed risk difference between regions: these include differences in awareness of the health consequence of heat exposure and corresponding preventable behaviors, such as the use of light clothes, the increase in AC prevalence, better housing conditions, or improved health care.8 Our findings suggest that varied population susceptibility might be one of the reasons to explain the contrasting patterns of temperature effect on mortality and morbidity.
Our study has several strengths. First, the present study benefits from the possibility of comparing impacts from a large nationwide data set. The data covered all 47 prefectures and involved about 6,676,551 deaths and 28,254,980 morbidity cases, capable of including enough sample size to capture the association between temperature and health outcomes and allowing for investigation on spatial variation. Second, the application of a unified framework and modeling selection enabled us to compare the impact of temperature on mortality and morbidity simultaneously. Less-stringent approaches could produce very misleading results. Third, the availability of information of specific causes enabled us to focus on more distinct patterns across mortality and morbidity due to circulatory and respiratory diseases, known from previous evidence to exhibit the strongest association with ambient temperature.24 Finally, to further understand differences in impact patterns and population susceptibility, we performed a series of subgroup analyses stratified by sex, age, and regions. This would help identify subpopulations at an increased risk and higher susceptibility to the harmful effects of nonoptimal temperature.
It should be noted that some limitations also deserve further consideration and improvement. First, as the meteorological data were collected at representative weather stations in cities, there is potential misclassification of the exposure due to factors such as urban heat island effect. Second, the diagnosis of EAD was made by preliminary examination rather than definitive diagnosis. The primary diagnosis was recorded with a single ICD code for each case, and there may be possible misclassification causing potential underestimation or overestimation of EAD risk related with temperature.25 Moreover, although EAD is a sensitive indicator of morbidity, it cannot represent all of the occurrences of diseases. Future studies should also include sufficient scales of patients who do not use ambulances, such as hospitalization and emergency room visits, to reexamine and verify the relationship. Third, individual level of other environmental exposures and personal factors, including medical history, were not available; therefore, we were not able to investigate their possible modifying effect on the associations. Last, although the present study provides a comparative estimate at a nationwide scale of the impacts of temperature on mortality and morbidity, more research in various countries with different climate, demographic, and socioeconomic conditions is needed to further understand the generalizability of the results. Meanwhile, the study period was 5 years due to data availability of emergency ambulance dispatches, but it offers no information on the temporal changes of past and current susceptibility in determining the differences in the observed patterns. Future studies applying long-term historical data might contribute to the understanding of the varied patterns by identifying susceptibility change through time.
The findings of the present study have several critical implications for public health policy and strategies. First, the contrasting patterns between mortality and morbidity by cause can be informative for earlier preparation for health risk due to nonoptimal temperatures and better allocation to manage medical resources through preparations accordingly by disease categories between inpatient vs. outpatient and emergency rooms. In addition, the observed sex and age differences for the temperature–morbidity association imply that related health risk management for vulnerable subpopulations may require different strategies. Higher risks for heat-related morbidity among the young population and cold-related respiratory morbidity for males suggest that a linking strategy may be needed between working conditions and the health risks of weather stressors. This, combined with the higher cold risk of circulatory morbidity among older people, warrants attention to be improved by equalizing the awareness and availability of emergency ambulance calls across prefectures. Last, further investigations and management of risk factors that contribute to region-specific effects might be more beneficial.
Supplementary Material
Acknowledgments
M.H. was supported by the Japan Science and Technology Agency (JST) as part of SICORP (JPMJSC20E4) and the Environment Research and Technology Development Funds (JPMEERF23S21120 and JPMEERF20231007) of the Environmental Restoration and Conservation Agency provided by Ministry of the Environment of Japan. L.Y. was supported by JST SPRING under grant number JPMJSP2108.
References
- 1.Murray CJL, Aravkin AY, Zheng P, Abbafati C, Abbas KM, Abbasi-Kangevari M, et al. 2020. Global burden of 87 risk factors in 204 countries and territories, 1990–2019: a systematic analysis for the global burden of disease study 2019. Lancet 396(10258):1223–1249, PMID: , 10.1016/S0140-6736(20)30752-2. [DOI] [PMC free article] [PubMed] [Google Scholar]
- 2.Bunker A, Wildenhain J, Vandenbergh A, Henschke N, Rocklöv J, Hajat S, et al. 2016. Effects of air temperature on climate-sensitive mortality and morbidity outcomes in the elderly; a systematic review and meta-analysis of epidemiological evidence. EBioMedicine 6:258–268, PMID: , 10.1016/j.ebiom.2016.02.034. [DOI] [PMC free article] [PubMed] [Google Scholar]
- 3.Song X, Wang S, Hu Y, Yue M, Zhang T, Liu Y, et al. 2017. Impact of ambient temperature on morbidity and mortality: an overview of reviews. Sci Total Environ 586:241–254, PMID: , 10.1016/j.scitotenv.2017.01.212. [DOI] [PubMed] [Google Scholar]
- 4.Basu R, Samet JM. 2002. Relation between elevated ambient temperature and mortality: a review of the epidemiologic evidence. Epidemiol Rev 24(2):190–202, PMID: , 10.1093/epirev/mxf007. [DOI] [PubMed] [Google Scholar]
- 5.Son JY, Liu JC, Bell ML. 2019. Temperature-related mortality: a systematic review and investigation of effect modifiers. Environ Res Lett 14(7):073004, 10.1088/1748-9326/ab1cdb. [DOI] [Google Scholar]
- 6.Gasparrini A, Guo Y, Hashizume M, Lavigne E, Zanobetti A, Schwartz J, et al. 2015. Mortality risk attributable to high and low ambient temperature: a multicountry observational study. Lancet 386(9991):369–375, PMID: , 10.1016/S0140-6736(14)62114-0. [DOI] [PMC free article] [PubMed] [Google Scholar]
- 7.Tobías A, Hashizume M, Honda Y, Sera F, Ng CFS, Kim Y, et al. 2021. Geographical variations of the minimum mortality temperature at a global scale: a multicountry study. Environ Epidemiol 5(5):e169, PMID: , 10.1097/EE9.0000000000000169. [DOI] [PMC free article] [PubMed] [Google Scholar]
- 8.Gasparrini A, Guo Y, Hashizume M, Kinney PL, Petkova EP, Lavigne E, et al. 2015. Temporal variation in heat–mortality associations: a multicountry study. Environ Health Perspect 123(11):1200–1207, PMID: , 10.1289/ehp.1409070. [DOI] [PMC free article] [PubMed] [Google Scholar]
- 9.Chung Y, Yang D, Gasparrini A, Vicedo-Cabrera AM, Fook Sheng Ng C, Kim Y, et al. 2018. Changing susceptibility to non-optimum temperatures in Japan, 1972–2012: the role of climate, demographic, and socioeconomic factors. Environ Health Perspect 126(5):057002, PMID: , 10.1289/EHP2546. [DOI] [PMC free article] [PubMed] [Google Scholar]
- 10.Phung D, Thai PK, Guo Y, Morawska L, Rutherford S, Chu C. 2016. Ambient temperature and risk of cardiovascular hospitalization: an updated systematic review and meta-analysis. Sci Total Environ 550:1084–1102, PMID: , 10.1016/j.scitotenv.2016.01.154. [DOI] [PubMed] [Google Scholar]
- 11.Kovats RS, Hajat S, Wilkinson P. 2004. Contrasting patterns of mortality and hospital admissions during hot weather and heat waves in Greater London, UK. Occup Environ Med 61(11):893–898, PMID: , 10.1136/oem.2003.012047. [DOI] [PMC free article] [PubMed] [Google Scholar]
- 12.Hanzlíková H, Plavcová E, Kynčl J, Kříž B, Kyselý J. 2015. Contrasting patterns of hot spell effects on morbidity and mortality for cardiovascular diseases in the Czech Republic, 1994–2009. Int J Biometeorol 59(11):1673–1684, PMID: , 10.1007/s00484-015-0974-1. [DOI] [PubMed] [Google Scholar]
- 13.Lin YK, Sung FC, Honda Y, Chen YJ, Wang YC. 2020. Comparative assessments of mortality from and morbidity of circulatory diseases in association with extreme temperatures. Sci Total Environ 723:138012, PMID: , 10.1016/j.scitotenv.2020.138012. [DOI] [PubMed] [Google Scholar]
- 14.Iñiguez C, Royé D, Tobías A. 2021. Contrasting patterns of temperature related mortality and hospitalization by cardiovascular and respiratory diseases in 52 Spanish cities. Environ Res 192:110191, PMID: , 10.1016/j.envres.2020.110191. [DOI] [PubMed] [Google Scholar]
- 15.Kotani K, Ueda K, Seposo X, Yasukochi S, Matsumoto H, Ono M, et al. 2018. Effects of high ambient temperature on ambulance dispatches in different age groups in Fukuoka, Japan. Glob Health Action 11(1):1437882, PMID: , 10.1080/16549716.2018.1437882. [DOI] [PMC free article] [PubMed] [Google Scholar]
- 16.Gasparrini A, Leone M. 2014. Attributable risk from distributed lag models. BMC Med Res Methodol 14(1):55, PMID: , 10.1186/1471-2288-14-55. [DOI] [PMC free article] [PubMed] [Google Scholar]
- 17.Gasparrini A, Armstrong B, Kenward MG. 2012. Multivariate meta‐analysis for non‐linear and other multi‐parameter associations. Stat Med 31(29):3821–3839, PMID: , 10.1002/sim.5471. [DOI] [PMC free article] [PubMed] [Google Scholar]
- 18.Sera F, Gasparrini A. 2022. Extended two-stage designs for environmental research. Environ Health 21(1):41, PMID: , 10.1186/s12940-022-00853-z. [DOI] [PMC free article] [PubMed] [Google Scholar]
- 19.Tobías A, Armstrong B, Gasparrini A. 2017. Brief report: investigating uncertainty in the minimum mortality temperature methods and application to 52 Spanish cities. Epidemiology 28(1):72–76, PMID: , 10.1097/EDE.0000000000000567. [DOI] [PMC free article] [PubMed] [Google Scholar]
- 20.Altman DG, Bland JM. 2003. Statistics notes: interaction revisited: the difference between two estimates. BMJ 326(7382):219, PMID: , 10.1136/bmj.326.7382.219. [DOI] [PMC free article] [PubMed] [Google Scholar]
- 21.Davis RE, McGregor GR, Enfield KB. 2016. Humidity: a review and primer on atmospheric moisture and human health. Environ Res 144(Pt A):106–116, PMID: , 10.1016/j.envres.2015.10.014. [DOI] [PubMed] [Google Scholar]
- 22.Armstrong B, Sera F, Vicedo-Cabrera AM, Abrutzky R, Åström DO, Bell ML, et al. 2019. The role of humidity in associations of high temperature with mortality: a multicountry, multicity study. Environ Health Perspect 127(9):97007, PMID: , 10.1289/EHP5430. [DOI] [PMC free article] [PubMed] [Google Scholar]
- 23.Seposo X, Madaniyazi L, Ng CFS, Hashizume M, Honda Y. 2021. COVID-19 pandemic modifies temperature and heat-related illness ambulance transport association in Japan: a nationwide observational study. Environ Health 20(1):122, PMID: , 10.1186/s12940-021-00808-w. [DOI] [PMC free article] [PubMed] [Google Scholar]
- 24.Ekamper P, Van Poppel F, Van Duin C, Garssen J. 2009. 150 Years of temperature-related excess mortality in The Netherlands. Dem Res 21:385–426, 10.4054/DemRes.2009.21.14. [DOI] [Google Scholar]
- 25.Goodwin J, Pearce VR, Taylor RS, Read KL, Powers SJ. 2001. Seasonal cold and circadian changes in blood pressure and physical activity in young and elderly people. Age Ageing 30(4):311–317, PMID: , 10.1093/ageing/30.4.311. [DOI] [PubMed] [Google Scholar]
- 26.Arbuthnott K, Hajat S, Heaviside C, Vardoulakis S. 2016. Changes in population susceptibility to heat and cold over time: assessing adaptation to climate change. Environ Health 15(Suppl 1):33, PMID: , 10.1186/s12940-016-0102-7. [DOI] [PMC free article] [PubMed] [Google Scholar]
- 27.Vicedo-Cabrera AM, Sera F, Guo Y, Chung Y, Arbuthnott K, Tong S, et al. 2018. A multi-country analysis on potential adaptive mechanisms to cold and heat in a changing climate. Environ Int 111:239–246, PMID: , 10.1016/j.envint.2017.11.006. [DOI] [PubMed] [Google Scholar]
Associated Data
This section collects any data citations, data availability statements, or supplementary materials included in this article.