

Abstract
Clinical trials in nephrology often use composite end points comprising clinical events, such as onset of ESKD and initiation of kidney function replacement therapy, along with a sustained large (e.g., ≥50%) decrease in GFR. Such events typically occur late in the disease course, resulting in large trials in which most participants do not contribute clinical events. In addition, components of the end point are considered of equal importance; however, their clinical significance varies. For example, kidney function replacement therapy initiation is likely to be clinically more meaningful than GFR decline of ≥50%. By contrast, hierarchical composite end points (HCEs) combine multiple outcomes and prioritize each patient's most clinically relevant outcome for inclusion in analysis. In this review, we consider the use of HCEs in clinical trials of CKD progression, emphasizing the potential to combine dichotomous clinical events such as those typically used in CKD progression trials, with the continuous variable of GFR over time, while ranking all components according to clinical significance. We consider maraca plots to visualize overall treatment effects and the contributions of individual components, discuss the application of win odds in kidney HCE trials, and review general design considerations for clinical trials for CKD progression with kidney HCE as an efficacy end point.
Keywords: angiotensin, CKD, chronic renal disease, clinical trial, kidney disease, nephrology, SGLT2
Introduction
CKD progression clinical trials often use a composite end point consisting of clinical events, such as onset of ESKD and initiation of kidney function replacement therapy, along with a sustained large (e.g., ≥50%) decrease in GFR. These events typically occur late in the disease course, resulting in large trials in which most participants do not contribute clinical events. In addition, such composites are typically assessed in time-to-event analyses that, by design, capture only the first event for a given participant without accounting for more severe events that may occur later during a clinical trial (Figure 1).1 The rate of change of GFR over time (often referred to as GFR slope) incorporates all participants' GFR data, may allow for smaller and more efficient trials, and has been demonstrated to be a valid surrogate end point for progression to ESKD.2,3 Treatment effects on GFR over time show high levels of agreement with treatment effects on clinical end points, such as ESKD, and can be used as an end point to support full regulatory approval of novel therapies in some countries.4 GFR over time analyses, however, do not account for clinical events, such as death or development of kidney failure, and imputation of missing or noninformative GFR data is usually required after these events, when assessing GFR.5
Figure 1.
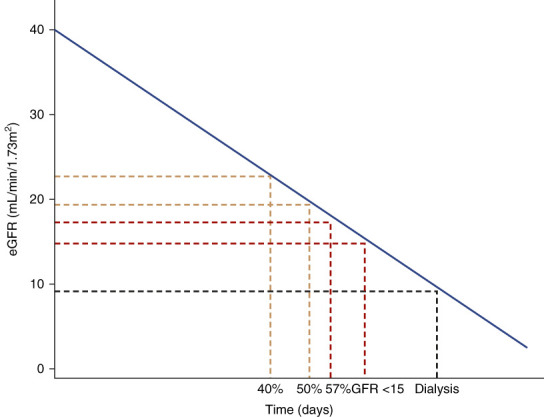
Progression of kidney disease.
Unlike traditional composite end points, hierarchical composite end points (HCEs) rank components according to clinical significance. In this review, we consider the use of HCE in CKD progression trials,1 emphasizing the potential to combine dichotomous clinical events such as those typically used in CKD trials, with the continuous variable of rate of change of GFR over time, while ranking all components according to clinical severity. We consider maraca6 plots to visualize overall treatment effects and the contributions of individual components, discuss the application of win odds7 in kidney HCE trials, and review general design considerations for clinical trials for CKD progression with kidney HCE as an efficacy end point.8
HCEs in Clinical Trials
HCEs are evaluated on a fixed follow-up duration and use the prioritization of components in deriving an ordinal end point.9 HCEs originated from heart failure trials,10 to combine outcomes corresponding to the therapeutic goals of reducing the risk of cardiovascular (CV) death, reducing the burden of heart failure hospitalizations, and improving symptoms associated with heart failure.11 By combining these outcomes into an HCE and recognizing the clinical priority of these outcomes, one can attempt to capture the overall treatment effect on clinical outcomes and symptoms. For example, the empagliflozin in patients hospitalized for acute heart failure trial of empagliflozin in patients hospitalized for heart failure analyzed an HCE consisting of death, heart failure events, and assessment of heart failure–related symptoms over a fixed 90-day follow-up duration.12
HCEs have the potential to include both adverse (“worsening”) and favorable (“improvement”) outcomes. Thus, unlike end points that include only clinically severe outcomes that the treatment intends to prevent, HCE may include outcomes that indicate improvement in a patient's clinical status. For example, the dapagliflozin in patients with cardiometabolic risk factors hospitalised with coronavirus disease 2019 (DARE-19) trial used an HCE to evaluate the effects of treatment with dapagliflozin for 30 days in hospitalized patients with coronavirus disease 2019.13–15 The HCE in the DARE-19 study8 included events which represented both worsening (e.g., death and in-hospital organ dysfunction) and improvement (e.g., discharge from the hospital) in a participant's clinical status.
Thus, the use of HCEs has been demonstrated to be feasible and to enable efficient and informative trial designs in various disease settings, making HCEs a potential option for CKD trials.
Analysis of HCEs Using Win Statistics
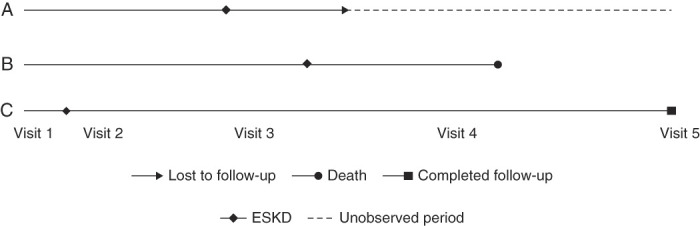
An HCE, a patient-level ordinal end point, can be analyzed using various methods for ordinal outcomes, such as ordinal logistic regression16 or win statistics (win ratio, win odds, or net benefit).17 Win statistics compare the number of wins, losses, and—in some cases—ties between the treatment groups. Components of the HCE are ranked according to clinical importance, and each participant is analyzed according to their most clinically significant event, regardless of the timing (e.g., a participant in a CKD trial who experiences ESKD and who later sustains CV death is analyzed according to the death, despite the ESKD having occurred earlier). To assess the treatment effect of the active treatment compared with control, each patient assigned to the active group is individually compared with each patient in the control group. Each comparison results in a “win,” “loss,” or “tie” for the active group. In the case of a fixed follow-up duration, a “win” for the active group occurs when the participant in the active group experiences a less severe event (regardless of the timing) than the participant in the control group or when both participants experienced the same event, but the active participant experienced the event after a longer time in the study (Figure 2).
Figure 2.

Pairwise comparisons of patients using kidney outcomes. First comparison: considered a “win” for the active group because the participant in the control group (patient A) experienced the more clinically severe event (death). Second comparison: considered a “win” for the active group because although both participants experienced the same dichotomous event, the participant in the control group (patient A) experienced the event sooner. Third comparison: neither participant experienced a dichotomous event, so the “win” or “loss” will be declared by comparison of the participant's GFR slope.
The total number of wins, losses, and ties are used to calculate the win odds, which describes the odds of a better outcome for a patient in the active treatment compared with the control group.7,18 The win odds is an adaptation of the win ratio (introduced by Pocock et al.,19 inspired by the ideas of Finkelstein and Schoenfeld20) to include ties21,22 and is defined as the total number of wins of the active group added to half of the total number of ties and divided by the total number of losses added to the other half of the total number of ties. Win odds may be calculated with adjustment and/or stratification for baseline covariates.21 A win odds of >1 corresponds to a treatment benefit, indicating that treated patients are more likely to have a favorable outcome, compared with control patients. By decreasing the number of ties, for example, by using a continuous variable (e.g., the rate of change of GFR over time) to determine wins and losses among participants who do not experience dichotomous events (e.g., death, kidney failure) during the course of the clinical trial, the statistical power of analysis of an HCE using win odds may be increased.1
Use of HCE in CKD Progression Trials
Utilization of HCE offers several benefits for CKD progression trials (Table 1). Traditional clinical events, such as kidney failure and sustained large (e.g., 50%) decline in GFR, can be incorporated, and unlike in traditional analytic methods, the most clinically significant (severe) events can be prioritized. All-cause or cause-specific mortality can be incorporated into the HCE and given the highest priority. Multiple GFR reduction thresholds (such as 40%, 50%, and 57%) may be used in the same HCE. Importantly, participants without dichotomous clinical events can be analyzed according to their individual rate of change of GFR, allowing for the combined use of traditional CKD progression end points along with GFR over time, which is expected to increase clinical trial efficiency in many settings.1 Combination and prioritization of outcomes for HCE may be challenging in some settings. For example, combining clinical events, such as CV death and heart failure hospitalization with symptom assessments into a heart failure HCE, requires the HCE to address the different objectives of measuring an overall treatment effect on both clinical outcomes and symptoms. In addition, it may be more difficult to determine a “win” or a “loss” on the basis of heart failure hospitalization, when one participant had an earlier, shorter heart failure hospitalization, while another participant experienced a later but longer and more complex hospitalization.
Table 1.
Pros and cons of hierarchical composite end point
| End point | Pros | Cons |
|---|---|---|
| Established kidney end point Time to the first event of the composite of 40% (50% or 57%) decline in GFR from baseline, ESKD, cardiorenal death |
• Can handle variable follow-up • Substantial contributions of clinical events in the overall composite |
• Analyses the first events of the patients and disregards the potential more severe events occurring later in the study • Gives equal importance to GFR declines and ESKD • Does not capture treatment effect on patients without clinical events or large decline in GFR • Requires large sample size |
| Rate of change of GFR over time | • All participants contribute to the analysis • Likely to decrease sample size compared with traditional end points |
• Severe events, such as death or kidney failure, do not contribute to the end point • GFR values noninformative after dialysis initiation |
| Kidney HCE Hierarchical composite of death, KFRT, sustained GFR <15, sustained large % decline in GFR from baseline, individual GFR slope (individual rate of change in GFR) |
• Prioritizes the most severe event of the patient • The components are not considered of equal importance • All patients contribute to the analysis, not only patients experiencing clinical events or large decline in kidney function • Likely to decrease sample size compared to traditional end points |
• Requires a fixed time point for evaluation • Most patients contribute to the analysis with rate of change of GFR |
HCE, hierarchical composite end point; KFRT, kidney function replacement therapy.
By contrast, the use of an HCE for CKD progression trials, as described above, includes correlated GFR-based outcomes (except death). Hierarchical ordering of these GFR-based outcomes is intuitive (Figure 1), and an effective CKD treatment would be expected to affect each of the components. In addition, inclusion of the rate of change of GFR allows for the assessment of disease progression in patients without a dichotomous event, while still—as is the case with the dichotomous events—being GFR-based and therefore targeting the same objective of preventing the decline of kidney function. Therefore, the components of an HCE for trials of CKD progression are more readily prioritized on the basis of clinical severity and more consistently address the clinical objective of CKD treatment of slowing the progression of kidney disease and reducing the risk of progression to kidney failure.
Visualization of HCEs—Maraca Plots
The maraca plot6 (named after its visual similarity to its namesake musical instrument) has been recently introduced for visualization of such HCEs which combine multiple dichotomous end points with a single continuous end point. A maraca plot is formed by end-to-end adjoining, from left to right by declining the severity level, uniformly scaled Kaplan–Meier plots of times to each dichotomous outcome among those without more severe outcomes, with superimposed boxplot (can be replaced by either a violin plot of mirrored density function or a violin plot with a nested boxplot) of the continuous variable. The maraca plot gives the possibility to analyze the contribution of components of an HCE over time by providing the cumulative percentages of patients experiencing each dichotomous outcome during the fixed follow-up period, whereas patients without dichotomous outcomes contribute to the analysis via the continuous outcome. The x-axis shows the same fixed follow-up duration separately for each dichotomous outcome by declining severity, while for the continuous outcome, it shows the range of possible values. The width of each component on the plot is scaled proportionally to the relative contribution of this component to the composite. The conceptual maraca plot in Figure 3 illustrates the main features of this plot. In this illustration, the adjoined Kaplan–Meier plots separate in a manner consistent with a beneficial effect for the active treatment on the dichotomous events. The rate of change of GFR among patients without dichotomous events was favorable for the active treatment, as shown by the rightward shift in the boxplot representing annualized rate of change of GFR for the active compared with the control treatment.
Figure 3.

Conceptual maraca plot: illustration of the visualization between active (red) and placebo (blue) treatments using an HCE with six dichotomous outcomes (on gray background) and a continuous eGFR slope outcome (on white background). The numbers indicate the three main readouts from the visualization: (1) the treatment effect on the individual and combined dichotomous component outcomes; (2) the treatment effect on the continuous component; and (3) the proportion of outcomes in the overall population. It is important to note that in each of the components, we refer to the treatment effect on components as they contribute to the HCE, not the treatment effect on the components separately. HCE, hierarchical composite end point
Clinical Interpretability of the Treatment Effect
A kidney HCE has been developed and tested in several CKD progression trials.1 In that post hoc analysis trials that demonstrated benefit in the traditional hazard ratio-based analysis (hazard ratio [HR] point estimates and 95% confidence intervals below 1.00) also demonstrated benefit for the HCE (win odds point estimates and 95% confidence intervals >1.00). For analyzed clinical trials showing a benefit of the active intervention on the established kidney end points, the hazard ratios for kidney composite time-to-event analysis of 0.61–0.86 corresponded to win odds for the kidney HCE between 1.41 and 1.13, suggesting that win odds for the kidney HCE within this range are clinically meaningful.
Although the HR correlates with win odds in which trials with lower HRs tend to have higher win odds (because time-to-event outcomes are included as components of HCE), it should be noted that the win odds of the kidney HCE should not be expected to be the reciprocal of hazard ratio for the time-to-first-event end point analysis because these measures include different outcomes and incorporate time differently.
As with any composite, the contribution of components should be assessed, particularly to address the extent to which each particular component was consistent with and contributed to the overall result. The treatment effect measured by the win odds in the HCE setting is determined by the treatment effect on the risk of developing severe outcomes that are often included in time-to-event analyses as well as the effect on GFR over time for patients without dichotomous outcomes during the follow-up time. The maraca plot (Figure 3) allows for a visual assessment of the contribution of each component to the composite, as described above. In addition, supportive analyses of components can be conducted.
Power and Sample Size Considerations
In a bootstrap-based resampling of several large trials of CKD progression, the statistical power of the prespecified primary time-to-event end points in each trial was compared with the power of a kidney HCE on the basis of the 36-month follow-up (extending the follow-up for patients with a shorter follow-up presuming no further CKD progression). This analysis demonstrated that the proposed HCE consistently resulted in higher power1 and is consistent with the power and sample size calculation formulas for studies on the basis of the win odds.7,23 The power and sample size for the win odds analysis can also be calculated for planned imbalanced randomization.23
Follow-up Duration and Handling of Missing Data
Some factors should be considered for designing trials using an HCE. First, the analytic method uses a fixed follow-up duration for all patients, to be able to compare them on the basis of a common timeframe. A fixed follow-up duration is used for the evaluation to make the HCE a patient-level end point, that is, every patient contributes to the analysis with one outcome (the outcome with the highest priority). As noted previously,18 differing follow-up times for patients makes their comparisons nontransitive, which in turn can lead to paradoxical conclusions making the clinical interpretation of results difficult. For example, consider a comparison of two participants with varying follow-up time, where participant A with longer follow-up time has a more severe event, but after the observed follow-up time of participant B (Figure 4). How to determine a winner or a loser for the comparison is challenging because it is unknown whether participant B sustained a more severe event during the unobserved follow-up time.
Figure 4.
The nontransitivity issue for incomplete follow-up. The A versus B comparison: B wins on ESKD, but A could have won on death, but incomplete follow-up impairs that conclusion. The B versus C, B versus A, C versus A comparisons: if we use only available follow-up time, C>B (on death), B>A (on ESKD), and yet, A>C (on ESKD), which would seem illogical.
The fixed follow-up for evaluation does not require a fixed follow-up duration for the trial, but rather that some minimum follow-up requirements are introduced and the time point for evaluation be selected in a way that a prespecified number of patients have the required follow-up. When considering follow-up duration, it should be noted that with prolonged follow-up, the contribution of dichotomous outcomes will be higher. The length of follow-up should be considered in relation to the studied population and expectations regarding the contribution of dichotomous outcomes to the composite, given the expected rates of each outcome in the composite.
The use of fixed follow-up duration minimizes the risk of these transitivity problems, but incomplete follow-up can still occur, such as when clinical trial participants are lost to follow-up or elect to prematurely withdraw from the clinical study. In these settings, several potential approaches can be taken to account for missing follow-up data. Comparisons between two participants where a win or a loss would be determined by events after the observed follow-up time for one of the participants can be considered a tie. Optimally, trials using a kidney HCE should have a minimum follow-up time for each patient, and multiple imputation methods, which use imputation on the basis of distributions of all outcomes, should be preferred. In any clinical trial, retention, and complete capture of clinical information for participants for the duration of the trial is critical, and increased amounts of missing data may weaken study quality and introduce uncertainty regarding the generalizability or robustness of study conclusions.
Potential Adaptations of the Kidney HCE
As with any composite end point, the incorporation of additional components can be considered. For example, whether to include overall or cause-specific mortality may be considered on a case-by-case basis. Excluding mortality allows for the ability to compare relevant clinical effects while patients are alive. However, mortality is often included as an end point in CKD progression clinical trials because of high risk for mortality among patients with CKD and potential for interventions which affect CKD progression to also have an effect on (CV) mortality risk. These considerations regarding inclusion of mortality are not unique to kidney HCE trials and must be considered for any CKD progression trial.
The use of GFR over time analyzed as a continuous variable for patients without dichotomous events increases efficiency of the HCE by reducing the number of ties in pairwise comparisons. Alternatively, comparisons between two patients can be considered a “tie” unless GFR over time varies by more than a preplanned margin, such as 0.5 ml/min per 1.73 m2 per year or other thresholds. Another method would be to incorporate percent change from baseline in GFR for each patient for the evaluation of GFR over time. In addition, CKD treatments may have acute, reversible, hemodynamic effects which can complicate the analysis of GFR over time.3 In the setting of large acute effects, different methods for assessing GFR over time may be considered, such as comparison of change in GFR from baseline to values obtained after treatment discontinuation.4
Additional events of clinical relevance to patients at risk of CKD progression, such as CV events, can be added to the composite. Adverse events of clinical relevance to patients with CKD, such as hyperkalemia24 or acute kidney injury, may also be considered. Although it should be noted that inclusion in the composite of outcomes requiring subjectivity of determining whether an outcome should be prioritized, a myocardial infarction versus a stroke can complicate the hierarchical ranking of components, while also the components that are not of the same nature may be affected differently by the treatment further complicating the interpretation of results.
Subsequent adaptations of the kidney HCE whether in an alternative method for assessing GFR over time or inclusion of additional outcomes in the composite should be analyzed in additional clinical trial databases to further delineate the performance of the kidney HCE compared with traditional end points, in different patient populations and with different interventions.
Discussion
In this review, we discuss the use of HCEs in CKD progression trials, with particular consideration for kidney HCEs that combine traditional kidney clinical end point events with the rate of change of GFR. This offers several potential benefits: All nonmortality components of the HCE are based on decline in GFR (e.g., rate of change in GFR, ≥50% GFR decline) or the direct clinical consequences of loss of kidney function (e.g., GFR <15 ml/min per 1.73 m2, requirement for kidney function replacement therapy), allowing for clear ranking of events, and analysis of each patient according to their most severe event or for patients without a clinical event of disease progression as assessed by their individual rate of change of GFR. Analysis of large kidney randomized controlled trials showed a general agreement between the results of the HCE and those of traditional time-to-event clinical end points, with “positive” trials showing a benefit on both end points. Importantly, simulations performed on the basis of resampling of clinical trials suggest increased clinical trial efficiency (e.g., a reduction in the required number of patients) for a kidney HCE compared with time-to-first event analysis of traditional composite end points.1 The use of HCEs for CKD progression trials may have some drawbacks as well, such as requirements for fixed follow-up duration, and subjectivity in event prioritization when non-GFR or non–mortality-based events are included in the composite (such as nonfatal CV events or other adverse events).
As with any composite end point, the assessment of clinical relevance requires an assessment of contributions of the individual components to the overall results. For this end point, the study of populations with more severe CKD and/or faster progression would be expected to lead to a higher proportion of dichotomous events and a lower proportion of GFR over time comparisons, whereas GFR over time would make a larger contribution to study of populations with less severe CKD and/or lower rates of progression. HCEs can be visualized using maraca plots,6 which visually represent the contribution from dichotomous and continuous end point components, in a single figure. As is the case with time-to-event analyses, the assessment of the clinical relevance of the effect size of the HCE analyses depends on several factors, including the precision of the estimate (e.g., confidence intervals), underlying the absolute risk of adverse kidney events in the target population, and the rate of progression of kidney disease, as well as the disease burden and potential risks of the treatment.
In summary, HCEs are appealing for clinical trials in nephrology. The hierarchical ranking of clinical events by severity and the contribution of data from each patient to the analysis offer potential advantages over established kidney end points. Future trials in CKD should consider utilization of HCEs to evaluate for clinically relevant attenuation of progression in patients with CKD. Finally, trial sponsors should engage with patients, regulators, physicians, and other stakeholders to design and prospectively conduct clinical trials formally using the kidney HCE to assess treatment benefit.
Acknowledgments
The authors thank all investigators, patients, and research teams for their contribution to the clinical trials used for the analyses. We thank Jörg Pawlitschko for support with statistical analysis. We thank Joan Buenconsejo for initial discussions on this topic. The authors acknowledge Parita Sheth, inScience Communications, London, United Kingdom, for assistance in editing and preparation of figures. This support was funded by AstraZeneca.
Disclosures
M. Brinker reports Employer: Bayer AG; and Ownership Interest: Bayer AG. P. Schloemer is a Bayer employee. L. Frison reports Employer: AstraZeneca. L. Frison, S.B. Gasparyan, M. Karpefors, D.J. Little, and J. Rossert are AstraZeneca employees. H.L. Heerspink is consultant for AstraZeneca, Bayer, Behring, Boehringer Ingelheim, Chinook, CSL Dimerix, Eli-Lilly, Gilead, Janssen, Merck, Novo Nordisk, ProKidney, Travere Therapeutics, and Vifor Fresenius. He has received research support from AstraZeneca, Boehringer Ingelheim, Janssen, and Novo Nordisk. H.L. Heerspink also reports Honoraria: Lecture fees from AstraZeneca and NovoNordisk. N. Jongs reports travel grants from AstraZeneca. N. Jongs reports Speakers Bureau: AstraZeneca. D.J. Little reports Ownership Interest: AstraZeneca; and Other Interests or Relationships: volunteer as a nephrologist at Walter Reed National Military Medical Center. R. Nkulikiyinka reports Employer: Bayer AG; and Ownership Interest: Bayer AG. N. Rethemeier reports Employer: Bayer AG; and Ownership Interest: Bayer AG. J. Rossert reports Ownership Interest: Amgen, AstraZeneca, and Vertex. C. Tasto Employer: Bayer AG; and reports Ownership Interest: Bayer AG.
Funding
The publication of this manuscript is funded by AstraZeneca.
Author Contributions
Conceptualization: Meike Brinker, Lars Frison, Samvel B. Gasparyan, Niels Jongs, Martin Karpefors, Dustin J. Little, Richard Nkulikiyinka, Nicole Rethemeier, Jerome Rossert, Patrick Schloemer, Christoph Tasto.
Data curation: Meike Brinker, Lars Frison, Samvel B. Gasparyan, Hiddo J.L. Heerspink, Niels Jongs, Martin Karpefors, Dustin J. Little, Richard Nkulikiyinka, Nicole Rethemeier, Jerome Rossert, Patrick Schloemer, Christoph Tasto.
Formal analysis: Meike Brinker, Lars Frison, Samvel B. Gasparyan, Hiddo J.L. Heerspink, Niels Jongs, Martin Karpefors, Dustin J. Little, Richard Nkulikiyinka, Nicole Rethemeier, Jerome Rossert, Patrick Schloemer, Christoph Tasto.
Writing – original draft: Samvel B. Gasparyan, Hiddo J.L. Heerspink, Dustin J. Little.
Writing – review & editing: Meike Brinker, Lars Frison, Samvel B. Gasparyan, Hiddo J.L. Heerspink, Niels Jongs, Martin Karpefors, Dustin J. Little, Richard Nkulikiyinka, Nicole Rethemeier, Jerome Rossert, Patrick Schloemer, Christoph Tasto.
References
- 1.Heerspink HJ Jongs N Schloemer P, et al. Development and validation of a new hierarchical composite endpoint for clinical trials of kidney disease progression. J Am Soc Nephrol. 2023;34(12):2025-2038. doi: 10.1681/ASN.0000000000000243 [DOI] [PMC free article] [PubMed] [Google Scholar]
- 2.Inker LA Heerspink HJL Tighiouart H, et al. GFR slope as a surrogate end point for kidney disease progression in clinical trials: a meta-analysis of treatment effects of randomized controlled trials. J Am Soc Nephrol. 2019;30(9):1735–1745. doi: 10.1681/ASN.2019010007 [DOI] [PMC free article] [PubMed] [Google Scholar]
- 3.Greene T Ying J Vonesh EF, et al. Performance of GFR slope as a surrogate end point for kidney disease progression in clinical trials: a statistical simulation. J Am Soc Nephrol. 2019;30(9):1756–1769. doi: 10.1681/ASN.2019010009 [DOI] [PMC free article] [PubMed] [Google Scholar]
- 4.Thompson A, Smith K, Lawrence J. Change in estimated GFR and albuminuria as end points in clinical trials: a viewpoint from the FDA. Am J kidney Dis. 2020;75(1):4–5. doi: 10.1053/j.ajkd.2019.08.007 [DOI] [PubMed] [Google Scholar]
- 5.Darken P, Nyberg J, Ballal S, Wright D. The attributable estimand: a new approach to account for intercurrent events. Pharm Stat. 2020;19(5):626–635. doi: 10.1002/pst.2019 [DOI] [PubMed] [Google Scholar]
- 6.Karpefors M, Lindholm D, Gasparyan SB, The maraca plot: a novel visualization of hierarchical composite endpoints. Clin Trials. 2023;20(1):84–88. doi: 10.1177/17407745221134949 [DOI] [PubMed] [Google Scholar]
- 7.Gasparyan SB Kowalewski EK Folkvaljon F, et al. Power and sample size calculation for the win odds test: application to an ordinal endpoint in COVID-19 trials. J Biopharm Stat. 2021;31(6):765–787. doi: 10.1080/10543406.2021.1968893 [DOI] [PubMed] [Google Scholar]
- 8.Gasparyan SB Buenconsejo J Kowalewski EK, et al. Design and analysis of studies based on hierarchical composite endpoints: insights from the DARE-19 trial. Ther Innov Regul Sci. 2022;56(5):785–794. doi: 10.1007/s43441-022-00420-1 [DOI] [PMC free article] [PubMed] [Google Scholar]
- 9.Packer M. Development and evolution of a hierarchical clinical composite end point for the evaluation of drugs and devices for acute and chronic heart failure: a 20-year perspective. Circulation. 2016;134(21):1664–1678. doi: 10.1161/CIRCULATIONAHA.116.023538 [DOI] [PubMed] [Google Scholar]
- 10.Packer M. Proposal for a new clinical end point to evaluate the efficacy of drugs and devices in the treatment of chronic heart failure. J Card Fail. 2001;7(2):176–182. doi: 10.1054/jcaf.2001.25652 [DOI] [PubMed] [Google Scholar]
- 11.Ferreira JP Jhund PS Duarte K, et al. Use of the win ratio in cardiovascular trials. JACC Heart Fail. 2020;8(6):441–450. doi: 10.1016/j.jchf.2020.02.010 [DOI] [PubMed] [Google Scholar]
- 12.Pocock SJ Ferreira JP Collier TJ, et al. The win ratio method in heart failure trials: lessons learnt from EMPULSE. Eur J Heart Fail. 2023;25(5):632–641. doi: 10.1002/ejhf.2853 [DOI] [PMC free article] [PubMed] [Google Scholar]
- 13.Kosiborod M Berwanger O Koch GG, et al. Effects of dapagliflozin on prevention of major clinical events and recovery in patients with respiratory failure because of COVID-19: design and rationale for the DARE-19 study. Diabetes Obes Metab. 2021;23(4):886–896. doi: 10.1111/dom.14296 [DOI] [PMC free article] [PubMed] [Google Scholar]
- 14.Kosiborod MN Esterline R Furtado RHM, et al. Dapagliflozin in patients with cardiometabolic risk factors hospitalised with COVID-19 (DARE-19): a randomised, double-blind, placebo-controlled, phase 3 trial. Lancet Diabetes Endocrinol. 2021;9(9):586–594. doi: 10.1016/S2213-8587(21)00180-7 [DOI] [PMC free article] [PubMed] [Google Scholar]
- 15.Heerspink HJ Furtado RHM Berwanger O, et al. Dapagliflozin and kidney outcomes in hospitalized patients with COVID-19 infection: an analysis of the DARE-19 randomized controlled trial. Clin J Am Soc Nephrol. 2022;17(5):643–654. doi: 10.2215/CJN.14231021 [DOI] [PMC free article] [PubMed] [Google Scholar]
- 16.Harrell FE. Regression Modeling Strategies: With Applications to Linear Models, Logistic Regression, and Survival Analysis; 2001. Springer; 608. [Google Scholar]
- 17.Dong G Huang B Verbeeck J, et al. Win statistics (win ratio, win odds, and net benefit) can complement one another to show the strength of the treatment effect on time‐to‐event outcomes. Pharm Stat. 2022;22(1):20–33. doi: 10.1002/pst.2251 [DOI] [PubMed] [Google Scholar]
- 18.Brunner E, Vandemeulebroecke M, Mütze T. Win odds: an adaptation of the win ratio to include ties. Stat Med. 2021;40(14):3367–3384. doi: 10.1002/sim.8967 [DOI] [PubMed] [Google Scholar]
- 19.Pocock SJ, Ariti CA, Collier TJ, Wang D. The win ratio: a new approach to the analysis of composite endpoints in clinical trials based on clinical priorities. Eur Heart J. 2012;33(2):176–182. doi: 10.1093/eurheartj/ehr352 [DOI] [PubMed] [Google Scholar]
- 20.Finkelstein DM, Schoenfeld DA. Combining mortality and longitudinal measures in clinical trials. Stat Med. 1999;18(11):1341–1354. doi: [DOI] [PubMed] [Google Scholar]
- 21.Gasparyan SB, Folkvaljon F, Bengtsson O, Buenconsejo J, Koch GG. Adjusted win ratio with stratification: calculation methods and interpretation. Stat Methods Med Res. 2021;30(2):580–611. doi: 10.1177/0962280220942558 [DOI] [PubMed] [Google Scholar]
- 22.Dong G Hoaglin DC Qiu J, et al. The win ratio: on interpretation and handling of ties. Stat Biopharm Res. 2019;12(1):99–106. doi: 10.1080/19466315.2019.1575279 [DOI] [Google Scholar]
- 23.Gasparyan SB, Kowalewski EK, Koch GG. Comments on “Sample size formula for a win ratio endpoint” by R. X. Yu and J. Ganju. Stat Med. 2022;41(14):2688–2690. doi: 10.1002/sim.9379 [DOI] [PubMed] [Google Scholar]
- 24.Butler J Anker SD Lund LH, et al. Patiromer for the management of hyperkalemia in heart failure with reduced ejection fraction: the DIAMOND trial. Eur Heart J. 2022;43(41):4362–4373. doi: 10.1093/eurheartj/ehac401 [DOI] [PMC free article] [PubMed] [Google Scholar]