

Visual Abstract

Keywords: cell ablation, drug metabolism, drug nephrotoxicity, glomerular filtration barrier, glomerulosclerosis, molecular biology, podocyte, proteinuria, renal protection, glomerular diseases
Abstract
Background
FSGS affects the complex three-dimensional morphology of podocytes, resulting in loss of filtration barrier function and the development of sclerotic lesions. Therapies to treat FSGS are limited, and podocyte-specific drugs are unavailable. To address the need for treatments to delay or stop FSGS progression, researchers are exploring the repurposing of drugs that have been approved by the US Food and Drug Administration (FDA) for other purposes.
Methods
To identify drugs with potential to treat FSGS, we used a specific zebrafish screening strain to combine a high-content screening (HCS) approach with an in vivo model. This zebrafish screening strain expresses nitroreductase and the red fluorescent protein mCherry exclusively in podocytes (providing an indicator for podocyte depletion), as well as a circulating 78 kDa vitamin D—binding enhanced green fluorescent protein fusion protein (as a readout for proteinuria). To produce FSGS-like lesions in the zebrafish, we added 80 µM metronidazole into the fish water. We used a specific screening microscope in conjunction with advanced image analysis methods to screen a library of 138 drugs and compounds (including some FDA-approved drugs) for podocyte-protective effects. Promising candidates were validated to be suitable for translational studies.
Results
After establishing this novel in vivo HCS assay, we identified seven drugs or compounds that were protective in our FSGS-like model. Validation experiments confirmed that the FDA-approved drug belinostat was protective against larval FSGS. Similar pan-histone deacetylase inhibitors also showed potential to reproduce this effect.
Conclusions
Using an FSGS-like zebrafish model, we developed a novel in vivo HCS assay that identified belinostat and related pan-histone deacetylase inhibitors as potential candidates for treating FSGS.
Introduction
In more than 75% of kidney patients, podocytes are damaged and lost.1 Podocytes as a postmitotic cell type are attached to the outer aspect of the glomerular capillaries with their interdigitating foot processes. Their complex morphology together with the slit membrane between foot processes is essential for the size selectivity of the glomerular filtration barrier (GFB).2,3 Any changes of the foot process morphology are directly linked to a lack of function.
FSGS is defined by foot process effacement, loss of podocytes, development of sclerotic lesions, and glomerular matrix accumulation.4–6 To date, the therapeutic options for patients suffering from FSGS are very limited, and often progressive loss of kidney function cannot be prevented.7,8 This has led to a significant unmet need and high demand for drugs that can stop or delay FSGS progression. To address this, we have used a drug repurposing approach to identify drugs/compounds that can rapidly progress to clinical translation studies.
One of the challenges to achieve the above is the lack of appropriate cell culture–based assay systems that cannot fully resemble the physiologically relevant conditions, such as glomerular perfusion. In addition, the use of mammalian models has concerns regarding reproduction times and ethics. Therefore, we focused our attention on a simple vertebrate model, the zebrafish larva (Danio rerio).
The zebrafish larva is a widely used model to study kidney development, function, and disease.9–11 The remarkable homology of the pronephric glomerulus to mammalian glomeruli with a fenestrated endothelium, a glomerular basement membrane and podocytes with interdigitating foot processes make this model particularly suitable for glomerular research.12–15 Moreover, optical transparency, a high fecundity, and a rapid ex utero development provide decisive advantages in contrast to mammalian models in microscopic access and experimental throughput. Zebrafish larvae represent an elegant bridge between cell culture, Drosophila, and mammals.16–19
Drug screening that targets a specific cell type or aim to prevent a certain disease is heavily dependent on a reliable disease model. Induction of FSGS-like lesions in mammals can be performed by several approaches which mostly include injections.20,21 However, injection-based approaches are not suitable for high-content screening (HCS). To overcome this, we have focused on cell-specific ablation using the nitroreductase/metronidazole (NTR/MTZ) system which is an elegant way to avoid side effects.22,23 Our group recently established a protocol to induce FSGS-like lesions in zebrafish larvae using this method.24 Moreover, crossbreeding of the podocyte-specific MTZ-sensitive zebrafish strain with a strain that expresses a circulating vitamin D–binding enhanced green fluorescent protein (eGFP) fusion protein (VDP-eGFP, 78 kDa) generates a “screening fish” (ScreeFi) that is perfectly equipped for an imaging-based, high-content drug/compound screening on a reliable FSGS model.25 Podocyte-specific injury in this ScreeFi induces podocyte depletion and results in a loss of glomerular mCherry fluorescence and a subsequent glomerular leakage of VDP-eGFP, causing a decrease in vascular eGFP fluorescence.24,26
Automated data analysis is crucial for high-content, imaging-based screening. The assessment of vascular eGFP fluorescence requires a reliable, automated segmentation of blood vessels to measure the fluorescence exclusively in the vasculature. The same is true for an automated measurement of the mCherry fluorescence exclusively in podocytes. Open source image processing software ImageJ (FIJI) provides diverse possibilities for such a task.27 Because stable and vibration-free imaging is an essential prerequisite for exact fluorescence intensity measurements, we used a specific imaging machine (IM) which was developed for in vivo screening in the multiwell format equipped with a static microscopic stage and moving objectives.28,29
At stage, HCS is well established for in vitro screening of huge amounts of drugs/compounds such as RNA interference experiments, and their performance can be validated using metrics such as Z-scores.30,31 As in vivo systems have to tackle various features in contrast to in vitro systems on the basis of their complexity such as higher biologic variances and complexities, adjustments to standard metrics have been established such as the robust Z-score or strictly standardized mean (SSMD) as quality metric.32 In current zebrafish in vivo HCS assays, quality metrics beside signal-to-noise ratios are barely reported.29,33–36
In the past, epigenetic changes have been shown to play an important role in kidney cell biology and disease.37,38 It is notable that histone deacetylases (HDACs) are known to play a pivotal role in kidney injury and are an interesting pharmacologic target in podocytes.39,40 Although HDACs regulate inflammatory processes and autophagy in podocytes,41 little is known about the effects of epigenetic drugs in FSGS. Recently, a study has shown that the pan-HDAC inhibitor panobinostat was able to promote differentiation of parietal cells into podocytes and ameliorates severe glomerulonephritis in mice.42 Therefore, we used a drug/compound library containing epigenetic modulators and US Food and Drug Administration (FDA)–approved drugs in this screening exercise that would allow their rapid progression to clinical translation studies.
To summarize, our group developed a rapid and semiautomated in vivo high-content assay that quantifies podocyte fluorescence and integrity of the GFB in a FSGS-like zebrafish model. For validation of the high-content in vivo screening approach, we also tested several quality measurement metrics. The assay was used for a 138 drug/compound library and led to the identification and validation of the FDA-approved drug belinostat and structurally similar substances as potential drugs for the treatment of FSGS. Belinostat is already used in the clinic, and its evaluation as renal therapy can be substantially accelerated.
Methods
Zebrafish Strains and Husbandry
Zebrafish stocks were maintained as previously described.18 Several groups of two males and two females were permanently placed together as mating pairs for the screening experiments. These groups always comprised two individuals of the following zebrafish strains: Tg(−3.5fabp10a:gc-eGFP), mitfaw2/w2, mpv17a9/a9, Tg(−3.5fabp10a:gc-eGFP), Tg(nphs2:GAL4-VP16), Tg(UAS:Eco.nfsB-mCherry), mitfaw2/w2, and mpv17a9/a9, further termed ScreeFi.23,25,26 Larvae from these groups were raised under standard conditions until 4 days postfertilization (dpf), and transgene expression was assessed using a fluorescence stereomicroscope (SMZ 18 Nikon, Düsseldorf, Germany) exposed to 0.1 mg/ml tricaine anesthesia (MS-222, E10521, Merck, Darmstadt, Germany). For edema assessment in validation experiments, Tg(UAS:Eco.nfsB-mCherry), mitfaw2/w2, and mpv17a9/a9 larvae, termed Cherry, were used. All experiments were performed according to the German animal protection law and were overseen and approved (file 7221.3-1-06/21) by the “Landesamt für Landwirtschaft, Lebensmittelsicherheit und Fischerei, Rostock” (LALLF M-V) of the federal state of Mecklenburg-Western Pomerania.
Induction of Podocyte Injury and Drug Treatment
Groups of 12 larvae from one breeding were distributed into a 24-well plate (662160 Greiner, Frickenhausen, Germany). For each clutch of eggs, 12 larvae were treated with 0.2% v/v DMSO (Sigma-Aldrich, Taufkirchen, Germany) dissolved in E3 media (Cold Spring Harbor protocols) as negative control, and 12 larvae were treated with 80 µM MTZ (Sigma-Aldrich) dissolved in DMSO as the injury control and reference group.43 A custom drug/compound library, containing epigenetic modulators and FDA-approved drugs, was designed and purchased from Enzo Life Sciences, Inc. (Lausen, Switzerland), and was used for the screening experiments. The drugs/compounds were structurally diverse and reported to possess epigenetic modifying properties in biochemical and cell-based assays with the strongest link with HDAC and Sirtuin enzyme target class. Larvae were cotreated with 80 µM MTZ and 100 µM drug/compound and were dissolved in 0.2% v/v DMSO. The total volume was 400 µl for each well with 12 larvae, and the wells were sealed with Adhesive Clear PCR Seal (600208, Biozym Scientific, Hessisch-Oldendorf) to prevent evaporation. The plates were incubated at 28.5°C and protected from light. After 24 hours, the drugs/compounds were washed three times with 0.5× E3 media.
Preparation for Imaging
After washout at 5 dpf, E3 media in the 12-well plate was replaced with E3 media containing 0.4 mg/ml tricaine solution. Larvae were individually transferred into the wells of a 96-well plate (644101, Greiner) which was prepared with custom agarose molds. For the molds, 45 µl of 0.7% agarose (Biozym LE agarose) were transferred into each well, and a custom 3D-printed orientation tool was inserted into the agarose.44 Each larva was transferred into the single wells of the 96-well plate and oriented laterally in the molds.
Image acquisition for the screening was performed with an Acquifer IM (ACQUIFER Imaging, Heidelberg, Germany). This HCS device is equipped with a scientific Complementary Metal–Oxide–Semiconductor (2048 × 2048 pixels) camera and a temperature-controlled incubation chamber (set to 28.5°C). Overview images of each laterally oriented larva were obtained using a 2× objective. For each larva, a region of interest (ROI) at the tail caudal of the cloaca was selected with a 10× objective to image the blood flow and vasculature. After creating custom modified imaging scripts via FIJI, ten consecutive brightfield frames at a frame rate of 13 Hz were acquired (10× objective), followed by one frame at 470 nm. The ROI of each larva was dragged to the glomerular region, and one frame of each glomerulus was acquired at 555 nm using a 10× objective. The focal plane for both acquisitions was detected with a built-in two-step software autofocus.
After image acquisition, tricaine-containing E3 media was washed out two times and replaced by 150 µl E3 media. The 96-well plate was again sealed and incubated for another 24 hours at 28.5°C. At 6 dpf, larvae were anesthetized with 0.4 mg tricaine, oriented laterally, and imaged in the same way as described before. Two values for the vascular eGFP fluorescence and two values for the glomerular mCherry fluorescence were taken for each individual larva.
Data Storage and Processing
Because automated analysis of >70,000 images of zebrafish larvae required large storage and random access memory, the HIVE (ACQUIFER Imaging) was used for storage and processing. Custom written FIJI image analysis macros were written in the IJ1 language and used for image analysis.
Measurement of the Vascular Fluorescence, an Indicator for Proteinuria
Vascular eGFP fluorescence was segmented and measured in a fully automatic manner via a custom FIJI image analysis macro, similar to the method used by Steenbergen et al.45 For each larva, ten brightfield slices and one slice at 470 nm were acquired at the caudal region. The image analysis macro fused the brightfield slices into a short movie in which the blood flow was clearly observable due to the movement of erythrocytes. After blurring and background subtraction, the SD of this movie was created. This SD showed all areas in which pixel changes occur due to circulating erythrocytes. Subsequent thresholding and size restriction allowed the creation of ROIs which distinctively detect the areas of blood flow. These ROIs were then used as segmentation masks for the 470 nm image in which the mean fluorescence was measured exclusively in the blood vessels due to prior blood flow detection.
Measurement of the Glomerular Fluorescence, an Indicator for Podocyte Depletion
Fluorescence of the nphs2-driven podocyte mCherry was detected and measured in an automated manner via FIJI. For each larva and each image obtained with 555 nm channel, the center of mass (x and y coordinate of the brightness-weighted average of all pixel) was determined, which, in this case, was the center of the pronephric glomerulus. A circular custom ROI is created and gets automatically drawn to the center. The ROI for the mCherry signal was always of the same size (70,688 pixels with 0.65 µm/pixel ratio), and the mean fluorescence intensity in this ROI was measured for each larva and both time points.
Generation of Time-Lapse Movies
For Supplemental Movie 2 and Supplemental Movie 3, ScreeFi larvae were treated with either 0.1% DMSO v/v or 80 µM MTZ for 24 hours from 4 to 5 dpf. After washout, larvae were dorsally oriented and embedded in 20 µl 0.6% agarose in the mold with E3 media containing 0.1 mg/ml tricaine. After acquisition of overview images in the 555 nm with the 2× objective, ROIs were placed at the glomerular mCherry signal with the 4× objective in the IM. The eGFP and the mCherry signal were imaged once per hour from 5 to 6 dpf, and the focus plane detection was determined in the 555 nm channel. Processing of two-channel multipage tagged image files and movie creation was conducted with FIJI.
Data Analysis and Statistics of the Screening
Both image analysis macros created excel files with all the necessary data. The image analysis macro for the vascular fluorescence additionally created a subfolder with images of the segmentation masks to check the segmentation process. Using a built-in exclusion algorithm, larvae, in which no vascular blood flow was detected, were not analyzed and values of these larvae were excluded. For both readouts and each larva, one mean fluorescence value was determined at 5 and 6 dpf. These values were used to calculate the fluorescence ratios for each larva, which depict the loss of fluorescence between 5 and 6 dpf. We opted to choose two readouts because the loss of podocytes and proteinuria might display different dynamics in fluorescence loss timing, and drugs/compounds could only be protective in one readout due to the timing restrictions of this assay. For this reason, both readouts should be looked at separately, and protective hits in both readouts might be very rare.
For the screening, 12 larvae were used in each treatment group which resulted in 12 ratios for vascular and 12 ratios for glomerular fluorescence per treatment. As in vivo systems display a certain degree of variability within datasets, a variance analysis was implemented with a followed outlier removal in the statistical workflow to homogenize the data obtained from the fluorescence quantification. The results in this work and preliminary experiments have shown that 60% of ScreeFi and Cherry respond with proteinuric edema to the MTZ treatment at 6 dpf. Therefore, 60% of 12=7 larvae were taken as cutoff for the statistical analysis. To analyze the seven best responding larvae to the podocyte injury and to obtain the most reliable data, the ratios were sorted and those seven larvae which displayed the lowest ratios in all treatment groups, including DMSO controls, were taken into analysis and the remaining larvae were considered as potential outlier (for details in data preprocessing, see Supplemental Figure 1). This excluded “weak responders” and ensured equal group sizes for the statistical analysis as the FIJI code occasionally excluded nonviable larvae. For the seven larvae, Gaussian distribution was checked with a Shapiro–Wilk test for each readout and each treatment. Ratios of treatment groups were subsequently analyzed by either one-way ANOVA followed by a Dunnett multiple comparison test or a Kruskal–Wallis test followed by Dunn multiple comparison. The MTZ group on each plate served as a control group; P < 0.05 was considered as statistically significant. Drugs/compounds that ameliorated the MTZ-induced loss of fluorescence were considered to be raw primary hits. To validate the robustness of this in vivo zebrafish HCS approach, we compared standard in vitro metrics such as the Z-score for each readout and each plate on the basis of the R library Z′ (https://rdrr.io/bioc/imageHTS/man/zprime.html). As our HCS is based on biologic in vivo datasets, we adjusted the Z-score to the version less sensitive to outliers by using the relation of the median controls and the mad (mean absolute deviation, formula: 1−[3×(MADDMSO+MADMTZ]/ABS[medianDMSO−medianMTZ]).30 We excluded hits with a Z-score <0. Because there is a high interindividual variation the in vivo approach, we lowered the Z-score to 0. We compared the metric SSMD, the signal-to-noise ratio, and signal-to-background ratio to assess metric variance, demonstrating the robustness of our HCS approach. Data analysis/graphs were performed with GraphPad Prism 9.1.2 (GraphPad Software, San Diego, CA). Volcano plots were created using VolcaNoseR (DOI: 10.1101/2020.05.07.082263).
Immunofluorescence Staining
Larvae were treated with 0.1% DMSO, 80, 160, or 320 µM MTZ for 48 hours; fixed in 2% paraformaldehyde at 6 dpf; and incubated in 15% sucrose. After freezing, cryosections were cut (Microm HM 560, Thermo Fisher Scientific, Darmstadt, Germany) and stained with anti-human podocin antibody (1:250, IBL, 29040, Japan), followed by Alexa Fluor 647 labeled anti-rabbit antibody (1:500, Thermo Fisher Scientific, A31573) and Hoechst 33342 (Sigma-Aldrich) incubation. Sections were mounted in Mowiol (Carl Roth, Karlsruhe, Germany). Images were acquired with an FV3000 system (Olympus, Tokyo, Japan) using a 60× water objective. Images were processed with a custom FIJI macro.
Hematoxylin and Eosin Staining
Larvae of different edema categories were fixed in 2% paraformaldehyde and embedded in Technovit 7100 (Kulzer GmbH, Hanau, Germany). In total, 4 µm sections were cut using a microtome (Leica, Wetzlar, Germany). Sections were stained with hematoxylin and eosin. After embedding in Eukitt (Sigma-Aldrich), images were acquired with a BX50 microscope (Olympus, 100× oil objective [numerical aperture 1.25]).
Reverse Transcriptase-Quantitative Polymerase Chain Reaction (RT-qPCR)
RNA was isolated with TRI-Reagent™ (Sigma-Aldrich) followed by cDNA synthesis using QuantiTect kit (Qiagen, Hilden, Germany). iQ SYBR green Supermix (BioRad, Hercules, CA) and the QuantStudio3 system (Thermo Fisher Scientific) were used. Primer sequences used for eef1a1I1 were forward: AAGGAGGGTAATGCTAGCGG, reverse: GGGCGAAGGTCACAACCATA; for nphs2 were forward: GAAGCAAGACGTCAGGCAC, reverse: GGTATGTTGAGGACCACGGC; and for ntr were forward: TCTCAACGTCGGTAACTTCC, reverse: TCAACGCTGTGATGACTAC. The RTq-PCR was repeated three times and normalized against eef1a1I1 and the DMSO group (2−∆∆Ct method).
Results
Screening Readouts
To determine the integrity of the GFB, the zebrafish strain ScreeFi was used for all experiments. SceeFi expresses the vitamin D–binding eGFP protein (VDP-eGFP, 78 kDa) in all vessels as well as mCherry which is exclusively expressed in podocytes. The VDP-eGFP clearance was used as a parameter for proteinuria and mCherry fluorescence for podocyte depletion.26
We identified that a lateral position of the larvae in agarose was optimal for the measurement of vascular eGFP fluorescence at the tail region and for the mCherry signal of podocytes. To determine the vascular eGFP fluorescence for each larva in a 96-well plate, a ROI was selected in an overview image (Figure 1, A and B). By using the SD of the pixel change, we automatically segmented the vasculature of the zebrafish larvae (Figure 1C and Supplemental Movie 1). In addition, larvae with no blood flow were excluded by the script (Supplemental Figure 2).
Figure 1.

Imaging setup of vascular and glomerular fluorescence with the IM. At first, an overview image of all wells of the 96-well plate is acquired with a 2× objective (A). A ROI at the larval tail is manually selected for the vascular fluorescence (B). At this region, a 10× objective acquires ten consecutive frames in the brightfield channel and one frame at 470 nm (eGFP) of each larva. A custom FIJI code automatically segments vessels on the basis of moving erythrocytes and measures the fluorescence intensity exclusively in the vasculature (C). For podocyte vitality, another ROI at the glomerular region is manually selected (B). For each larva, one frame at 555 nm (mCherry) is acquired. The FIJI code automatically detects podocytes and creates a defined ROI. Afterward, the mCherry fluorescence intensity is measured within this ROI (D). Scale bar in (B): 1 mm, (C and D): 250 µm. eGFP, enhanced green fluorescent protein; IM, imaging machine; ROI, region of interest.
The mCherry fluorescence was directly taken and used as detection template allowing an automatic detection of podocytes and the measurement of the fluorescence intensity in the defined area (Figure 1D).
Workflow
To minimize fluorescence variations which can occur between different founders, our workflow is based on two read outs—proteinuria and podocyte depletion—which is measured in each larva at 5 and 6 dpf during the screening (Figure 2). To include only larvae that respond properly to podocyte injury, an outlier removal was performed and only the responders to MTZ were analyzed (Supplemental Figure 1).
Figure 2.

Workflow of the high content in vivo drug screening assay. Transgene expression of nphs2:ntr-mCherry in podocytes and the VDP-eGFP in the vasculature is checked with a stereomicroscope at 4 dpf. Larvae from one clutch are distributed in groups of 12 in 24-well plates for treatments. After 24 hours, all drugs/compounds are washed out and the larvae are placed individually into a 96-well plate. After lateral orientation, images of vascular and glomerular fluorescence are acquired at 5 dpf. After another 24 hours, the vascular fluorescence and the glomerular fluorescence are acquired again of the exact same larvae. The fluorescence ratios of both readouts for each individual larva serve as input for hit identification via t-statistics; the plots show one exemplary plate. dpf, days postfertilization; VDP-eGFP, vitamin D–binding enhanced green fluorescent protein.
Titration of the MTZ Concentration
Since the severity of podocyte injury is directly linked to the concentration and exposure time of MTZ,23 we selected different concentrations of MTZ, starting with 80 µM which was already described by our group.24 In addition, we included 160 and 320 µM MTZ for 24 hours. After washout at 5 dpf, no difference of the mCherry fluorescence intensity was detected in the control (0.1% DMSO) and the 80 µM MTZ group in contrast to the 160 and 320 µM MTZ groups. These concentrations caused a strong podocyte depletion already at 5 dpf (Figure 3A). After another 24 hours (at 6 dpf), the mCherry fluorescence of the 80 µM MTZ larvae was significantly reduced, whereas a complete loss of the mCherry signal in the glomerulus was observed in the 160 and 320 µM MTZ group (Figure 3A). Looking at the eGFP expression in the vasculature, we found that 80 µM MTZ was also the best concentration to induce proteinuria because we detected a reduction of the eGFP fluorescence between 5 and 6 dpf. Furthermore, we observed fluorescence in the proximal tubules due to the endocytotic uptake of VDP-eGFP which passed the leaky filtration barrier (Figure 3B).
Figure 3.
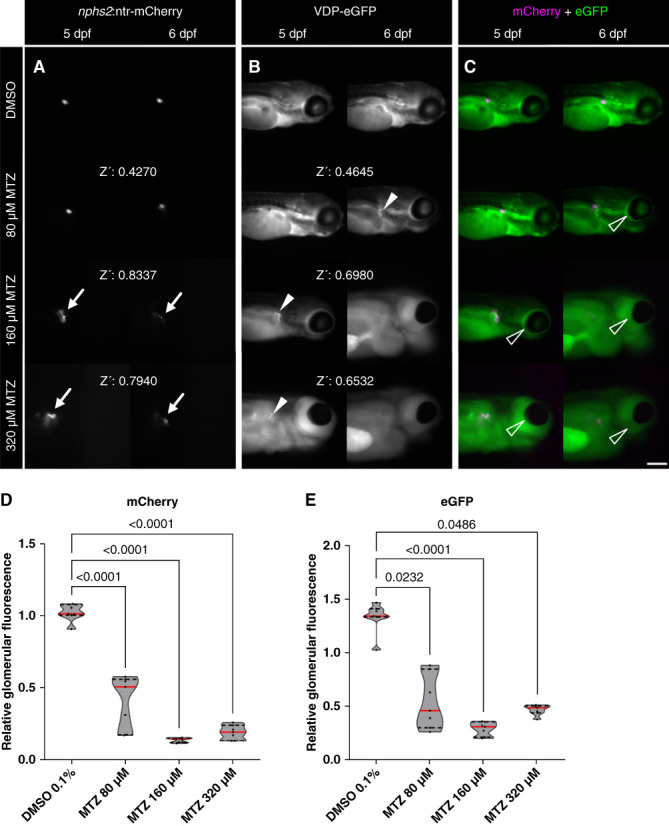
Different MTZ concentrations caused an acute or chronic larval podocyte injury accompanied by proteinuria. After 24 hours of treatment, the mCherry signal of the DMSO control group and the 80 µM MTZ group did not differ at 5 dpf. In contrast to this, 160 and 320 µM MTZ caused a loss of mCherry fluorescence and a distribution of the mCherry signal into the proximal convoluted tubules at 5 dpf (arrows in A). At 6 dpf, the 80 µM MTZ group showed a loss of mCherry fluorescence. The glomerular injury in the 160 and 320 µM group did progress to a state in which podocytes are barely visible on the glomerular tuft. The Z-prime score (Z’) is below 0.5 in the 80 µM and above 0.5 in the 160 and 320 µM treatment (A). The same dynamic was observed in vascular VDP-eGFP. In total, 160 and 320 µM MTZ caused a strong glomerular leakage and a tubular reabsorption of the 78 kDa VDP-eGFP at 5 dpf (arrowheads in B). Disruption of the GFB was observable in the 80 µM group not at 5, but at 6 dpf. Again, the Z-score is <0.5 in the 80 µM and >0.5 in the 160 and 320 µM MTZ group (B). Podocyte-specific injury and proteinuria are accompanied by periocular edema formation. After the treatment with 320 µM MTZ for 24 hours, larvae developed severe edema at 5 dpf (arrowheads in C). Treatment with 160 µM caused slight edema formation at 5 dpf and severe edema formation at 6 dpf. In total, 80 µM MTZ caused no visible edema at 5 dpf and slight edema at 6 dpf. The DMSO control group did not show edema at all (C). All three treatment groups developed a significant loss of the podocyte mCherry fluorescence in the screening setup (D). Accordingly, a significant loss of vascular eGFP (proteinuria) could be detected in all three MTZ groups. These results show that 80 µM MTZ causes a more chronic glomerular injury, whereas higher concentrations cause an acute loss of podocytes after 24 hours of treatment. Data distribution was checked via the Kolmogorov–Smirnov test, and significance was determined by the Kruskal–Wallis test, followed by Dunn’s multiple comparison; the DMSO group served as control, and P ≤ 0.05 was considered statistically significant. Scale bar in (C): 250 µm. GFB, glomerular filtration barrier.
Another important hallmark of size selectivity loss in zebrafish is edema formation.46 Larvae (4 dpf) that were treated with 80 µM MTZ for 24 hours developed no edema at 5 dpf; however, a slight edema formation was observed at 6 dpf. By contrast, all larvae treated with 320 µM MTZ developed severe edema at 5 and 6 dpf (Figure 3C).
Because the dynamic range of the mCherry and VDP-eGFP fluorescence was optimal in the group treated with 80 µM MTZ, we used this concentration for our screening procedure despite the fact that the calculated Z-score was <0.5 (Figure 3D) because reaching a Z-score >0.5 resulted in a complete ablation of podocytes which would not be purposeful (Figure 3 and Supplemental Figures 3 and 4).
Screening of an Epigenetic Library
An epigenetic library with 138 drugs/compounds was used to screen for substances that are able to prevent podocyte damage and/or proteinuria (Supplemental Table 1). A total of 36 drugs/compounds of this library showed lethal effects (Table 1). By contrast, seven drugs/compounds were identified as candidates (Figure 4, A and B). The assay performance is shown in more detail in supplemental materials (Supplemental Figure 5).
Table 1.
List of toxic drugs/compounds
| 3-TYP | AK-1 | BRD 4354 | BG45 |
| Droxinostat | Fimepinostat | HDAC8-IN-1 | Huperzine A |
| Inauhzin | J22352 | OPC 95% | Ophiopogonin D′ |
| Panobinostat | PCI-34051 | Quisinostat | R-α lipoic acid |
| Remetinostat | Scopolin | Scriptaid | Selisistat R-enantiomer |
| Selisistat S-enantiomer | Sinapinic acid | Sirtinol | Sirtuin modulator 1 |
| Splitomicin | SR-4370 | SRT 1720 (hydrochloride) | SRT2183 |
| SW-100 | Tenovin-6 | Tenovin-6 (hydrochloride) | TMP195 |
| Trichostatin A | UF010 | Valproic acid (sodium salt) | UBCS039 |
All drugs/compounds in this list had a lethal effect on all 12 larvae in conjunction with 80 µM metronidazole.
Figure 4.

Overview of protective effects on larval podocytes. Of 138 drugs/compounds, two drugs/compounds ameliorated the degree of proteinuria (A) and five drugs/compounds prevented podocyte depletion (B) significantly compared with their corresponding MTZ groups. Belinostat displayed the highest significance (P = 0.0004) among all hits. MTZ, metronidazole.
Belinostat was identified as a top candidate that was selected to be validated in further experiments with a higher number of larvae and under different conditions.
Validation of Belinostat as a Protective Drug
Evaluation of the Effect of Belinostat on Fluorescence Intensity
To ascertain the influence of belinostat on the fluorescence intensity of mCherry and eGFP alone, larvae were treated with 100 µM belinostat for 24 hours without MTZ. The results depicted in Supplemental Figure 6 revealed no statistically significant alteration in fluorescence intensity, showing that belinostat alone has no effect on fluorescence intensity (Supplemental Figure 6, A and B).
Influence of the HDAC Inhibitor on NTR Expression
To investigate the effect of belinostat on the expression of the bacterial NTR, an enzyme that converts MTZ into a toxin, we used RT-qPCR. Our results showed that belinostat did not change the mRNA expression of this enzyme. Furthermore, we found an increased expression of podocin mRNA in larvae treated with either belinostat alone or in combination with MTZ (Supplemental Figure 6, C and D).
Assessment of Belinostat's Effects on Edema Formation
To investigate the effect of belinostat on edema formation, larvae were exposed to MTZ for 48 hours resulting in edema formation with different manifestations. We categorized the edema into four types of severity, starting from type 1 (absent) to type 4 (severe) (Figure 5A and Supplemental Figure 7). On concurrent administration of MTZ and belinostat from 4 to 6 dpf, a reduction in type 3 and type 4 edemas was observed at 6, 7, and 8 dpf. Notably, cotreatment with 100 µM belinostat induced edemas in only 15% of larvae, primarily of type 2 in contrast to over 50% of type 3 and type 4 on the MTZ group (Figure 5B).
Figure 5.

Follow-up experiments with belinostat proved a protective effect on larval podocytes. As drug validation experiment, Cherry larvae were treated with different concentrations of belinostat in conjunction with MTZ or post-MTZ treatment. Depending on the progression of podocyte injury, larvae developed different degrees of edema: 1: no edema, 2: mild edema, 3: moderate edema, and 4: severe edema. Black arrowheads show periocular edema, and blank arrowheads depict abdominal edema (A). Belinostat had a concentration-dependent protective effect on podocytes from MTZ injury in a cotreatment setup until 8 dpf (DMSO n=52, MTZ n=55, MTZ+1 µM belinostat n=52, MTZ+10 µM belinostat n=55, MTZ+100 µM belinostat n=53, B). A continuous treatment with 100 µM belinostat until 8 dpf after initial washout of MTZ+belinostat at 6 dpf completely prevented progression to moderate or severe edema in contrast to the MTZ and the MTZ+belinostat washout group (DMSO n=50, MTZ n=50, MTZ+100 µM belinostat 4–6 dpf n=51, MTZ+100 µM belinostat cont. n=49, C). Treatment with belinostat from 5 to 8 dpf after injury induction and washout of MTZ could drastically reduce the development of proteinuric edema compared with the MTZ and the MTZ+belinostat cotreatment group (DMSO 4–5 dpf n=38, MTZ 4–5 dpf n=43, MTZ+100 µM belinostat 4–5 dpf n=38, MTZ 4–5 dpf+100 µM belinostat 5–8 dpf n=37, D). Scale bar in (A): 500 µm.
Continuous Belinostat Treatment after MTZ Exposure
Larvae treated with MTZ together with 100 µM belinostat for 48 hours, or until 8 dpf, exhibited significantly less edema. Notably, progression from mild type 2 edema to moderate type 3 edema was prevented in the group treated continuously with belinostat, which was observed in the washout group (Figure 5C).
Curative Belinostat Treatment Approach
A curative treatment strategy was undertaken, wherein larvae were exposed to DMSO, 80 µM MTZ, or 80 µM MTZ with 100 µM belinostat for 24 hours. Subsequently, all substances were removed at 5 dpf. In particular, the group that received 100 µM belinostat after MTZ exposure up to 8 dpf showed a remarkable deceleration in disease progression and a complete prevention of development of type 3 or type 4 edema (Figure 5D).
Dose-Dependent Protection by Belinostat
Taken together, these comprehensive findings underscore the dose-dependent role of belinostat in maintaining larval podocyte integrity and preventing edema formation.
Hydroxamate-Containing HDAC Inhibitors Protect against Larval FSGS
Abexinostat
The HDAC inhibitor abexinostat, another hit from this screening, shares structural similarities with belinostat (Figure 6A and Supplemental Figure 8). To investigate a potential protective effect of this drug, larvae were treated with MTZ and 1, 10, or 100 µM abexinostat. The results are in agreement with the results of belinostat. In the 100 µM abexinostat group, edema was prevented compared with the MTZ group. However, lower concentrations (1, 10 µM abexinostat) showed no effect on edema prevention (Figure 6A).
Figure 6.

Confirmation of abexinostat, panobinostat, and oxamflatin as protective agents in the larval FSGS-like model. Cotreatment of Cherry larvae with 80 µM MTZ and three concentrations abexinostat, as second hit from the screening, showed a protective effect at 100 µM, especially at 6 dpf. Treatment with 1 or 10 µM showed no protective effect in edema formation (DMSO n=50, MTZ n=50, MTZ+1 µM abexinostat n=50, MTZ+10 µM abexinostat n=50, MTZ+100 µM abexinostat n=50, A). Cotreatment with 80 µM MTZ and 100 µM oxamflatin, another hydroxamate acid containing HDAC inhibitor, induced edema formation in 4% of larvae in contrast to 55% in the MTZ injury group at 6 dpf (DMSO n=50, MTZ n=48, MTZ+1 µM oxamflatin n=55, MTZ+10 µM oxamflatin n=64, MTZ+100 µM oxamflatin n=50, B). Treatment with panobinostat for 48 hours revealed that panobinostat is highly toxic at 10 and 100 µM. By contrast, panobinostat at 1 µM had a distinct protective effect compared with the MTZ injury group, especially at 6 dpf (DMSO n=50, MTZ n=45, MTZ+1 µM panobinostat n=51, MTZ+10 µM panobinostat n=50, MTZ+100 µM panobinostat n=50, C). A second titration of panobinostat showed a clear dose-dependent protective effect in edema formation. In total, 5 µM panobinostat effectively prevented MTZ-induced proteinuric edema at 6 dpf (DMSO n=50, MTZ n=47, MTZ+0.5 µM panobinostat n=52, MTZ+1 µM panobinostat n=48, MTZ+5 µM panobinostat n=50, D). HDAC, histone deacetylase.
Oxamflatin
Another pan-HDAC inhibitor, which shares major structural similarity with belinostat and abexinostat, was tested. Treatment of larvae with MTZ together with 1, 10, and 100 µM oxamflatin showed a dose-dependent protective effect, with 100 µM to be the most effective concentration (Figure 6B).
Panobinostat
Recently, it was shown in mice that panobinostat attenuates nephrotoxic serum–induced glomerulonephritis.42 Here, we show that panobinostat at 1 µM concentration in the presence of MTZ reduced the edema formation from 53.3% to 11.8% at 6 dpf. A complete prevention of edema was seen in the 5 µM group. Higher concentrations, such as 10 and 100 µM of panobinostat, were lethal (Figure. 6, C and D).
In summary, our study reveals the protective effects of four tested hydroxamate-containing drugs/compounds in a zebrafish model mimicking FSGS (Supplemental Figure 8).
Discussion
FSGS, a podocyte-related disease, is characterized by effacement and detachment of podocytes, matrix accumulation, and proteinuria.47 Because there are currently no curative therapies for FSGS, it is essential to identify drugs or compounds that inhibit or delay podocyte damage in these patients. Therefore, HCS of specific libraries in living organism are an important technique as it was already shown, for the neurodegenerative Parkinson disease.48 Here, we present an innovative in vivo HCS technique that is based on the targeted ablation of podocytes in zebrafish larvae leading to a FSGS-like phenotype.24 Through this HCS, we have successfully identified four substances, including two FDA-approved drugs (belinostat and panobinostat), with the potential to treat FSGS.
After implementation of automated segmentation, measurement, and image analysis algorithms to quantify fluorescence in vessels and of podocytes, we were able to assess the integrity of the filtration barrier in living zebrafish larvae. Because a quality control is required in the HCS, we used several metrics for our in vivo assay. Although the Z-score is a standard for in vitro screenings, it seems less suitable for in vivo assays.30,34,49,50 This is because a good Z-score in our in vivo screening would require the complete ablation of podocytes, which would make the identification of curative drugs impossible. Therefore, we used a less stringent metric, such as SSMD and signal-to-noise ratio, yielding in reliable results which were confirmed by receiver operating characteristic curve analysis and different validation steps.32,48
Here, we used a library of 138 substances (compounds and FDA-approved drugs), which are known for their ability to induce epigenetic modifications. These modifications could potentially have beneficial effects on podocytes, as Majumder and colleagues previously reported.51–54 The group has revealed that elevated levels of histone H3 lysine 27 trimethylation protects against glomerular and specifically podocyte injury.55
In our screen of a 138 drugs/compounds library, we identified seven candidates with a beneficial effect, all of which are HDAC inhibitors (mostly zinc dependent, class I, IIa, IIb or IV).56 Among these hits, the FDA-approved pan-HDAC inhibitor belinostat was the most significant candidate. It is known for its ability to induce apoptosis in cancer cells and inhibit their proliferation, making it a valuable drug for the treatment of peripheral T-cell lymphoma.57–60 Because there was no evidence in the literature that belinostat might be protective in podocyte diseases, our attention was focused on exploring its potential in this field.
A potential pitfall in this assay is the indirect detection of proteinuria via fluorescence. Drugs that affect fluorophores might produce false results. However, the possibility of belinostat being a false-positive hit was ruled out by fluorescence quantification without MTZ and RT-qPCR.
Subsequently, we discovered that belinostat protects larval podocytes in a dose-dependent manner during 48-hour MTZ exposure and, in particular, prevents severe edema. During continuous treatment, this protection persisted and a curative setting ruled out a direct interaction of belinostat with MTZ. These results are very interesting due to the repurposing potential of belinostat. The second positive hit, abexinostat, which shares the hydroxamate group within its chemical structure to belionostat also proved to be protective. Furthermore, oxamflatin and panobinostat demonstrated similar protective effects against proteinuric edema in our zebrafish model. Interestingly, it was recently shown that panobinostat, another hydroxamate pan-HDAC inhibitor, provided promising results in targeting podocytes and promoting differentiation of parietal cells into podocytes in a nephrotoxic serum mouse model. These results successfully validated two of the seven identified candidates from the HCS.
In summary, our group successfully developed a novel high-content, in vivo drug screening assay using a larval zebrafish injury model that mimics the characteristics of FSGS. Through this approach, we identified a specific class of substances, including FDA-approved drugs that demonstrated protective effects in this FSGS-like model. These findings hold the exciting potential to consider belinostat as a therapeutic drug for the treatment of FSGS.
Supplementary Material
Acknowledgments
The experimental support of Thor-Magnus Koppe and Juan Saydou Dikou is highly appreciated. The authors are very grateful for the excellent zebrafish husbandry by Oliver Zabel and Steffen Prellwitz. The European Patent Office issued a patent (Application No. EP22179045.4) that is related to this study.
Disclosures
N. Endlich is CEO of the NIPOKA GmbH, Greifswald, Germany. N. Endlich also reports: Ownership Interest: NIPOKA GmbH; Patents or Royalties: University Medicine Greifswald; Advisory or Leadership Role: Academic Editor PLOS One, NIPOKA GmbH, and University Medicine Greifswald; and Other Interests or Relationships: NephCure, Nordverbund Niere “Save the Kidney,” and Walden Bioscience. J. Gehrig is an employee of ACQUIFER Imaging GmbH, and Heidelberg, Germany. M. Schindler reports: Patents or Royalties: Patent pending for a drug. F. Siegerist reports: Ownership Interest: NIPOKA GmbH, Germany; and Patents or Royalties: NIPOKA GmbH, Germany. All remaining authors have nothing to disclose.
Funding
This work was funded by the federal Ministry of Education and Research (BMBF Grant No. 01GM1518B, STOP‐FSGS) to N. Endlich. Additionally, the Bundesministerium für Wirtschaft und Klimaschutz (BMWi) funded this project (Grant No. 16KN077229, title: Alterna Tier-vivoPod). Furthermore, this work was generously supported by the Dr. Gerhard Büchtemann fund, Hamburg, Germany and the Südmeyer fund for kidney and vascular research (“Südmeyer Stiftung für Nieren-und Gefäßforschung”).
Author Contributions
Conceptualization: Maximilian Schindler, Nicole Endlich.
Data curation: Jochen Gehrig, Sheraz Gul, Tim Lange, Maximilian Schindler, Stefan Simm.
Formal analysis: Marianne Klawitter, Tim Lange, Maximilian Schindler.
Funding acquisition: Nicole Endlich.
Investigation: Sophia-Marie Bach, Marianne Klawitter, Maximilian Schindler.
Methodology: Sophia-Marie Bach, Nicole Endlich, Maximilian Schindler, Florian Siegerist.
Project administration: Nicole Endlich.
Resources: Nicole Endlich, Jochen Gehrig, Sheraz Gul.
Software: Jochen Gehrig, Maximilian Schindler, Florian Siegerist.
Supervision: Nicole Endlich.
Validation: Nicole Endlich, Tim Lange, Maximilian Schindler, Florian Siegerist.
Visualization: Nicole Endlich, Maximilian Schindler.
Writing – original draft: Nicole Endlich, Maximilian Schindler.
Writing – review & editing: Jochen Gehrig, Sheraz Gul, Tim Lange, Florian Siegerist, Stefan Simm.
Data Sharing Statement
All data is included in the manuscript and/or supporting information. The FIJI image analysis macro code is available at https://github.com/MaximilianSchindler/ImageJ-macros.
Supplemental Material
This article contains the following supplemental material online at http://links.lww.com/JSN/E530, http://links.lww.com/JSN/E531, http://links.lww.com/JSN/E532, http://links.lww.com/JSN/E533, and http://links.lww.com/JSN/E534.
Supplemental Figure 1. Data acquisition and (pre)processing for analysis.
Supplemental Figure 2. Control of the segmentation process.
Supplemental Figure 3. Immunofluorescence staining of ScreeFi larvae treated with different concentrations of MTZ.
Supplemental Figure 4. Negative control of the immunofluorescence staining.
Supplemental Figure 5. Performance of the in vivo screening assay with 80 µM MTZ for 24 hours.
Supplemental Figure 6. Effects of belinostat treatment on fluorescence reporters and podocyte-specific mRNA expression levels.
Supplemental Figure 7. Representative glomerular histology of edema categories type 1–4.
Supplemental Figure 8. Hydroxamate acid containing HDAC inhibitors are protective against larval FSGS.
Supplemental Table 1. List of screened drugs/compounds.
Supplemental Movie 1. Segmentation process in the vasculature.
Supplemental Movie 2. Time lapse imaging of the DMSO control.
Supplemental Movie 3. Time lapse imaging of the MTZ injury.
References
- 1.Wiggins RC. The spectrum of podocytopathies: a unifying view of glomerular diseases. Kidney Int. 2007;71(12):1205–1214. doi: 10.1038/sj.ki.5002222 [DOI] [PubMed] [Google Scholar]
- 2.Pavenstädt H, Kriz W, Kretzler M. Cell biology of the glomerular podocyte. Physiol Rev. 2003;83(1):253–307. doi: 10.1152/physrev.00020.2002 [DOI] [PubMed] [Google Scholar]
- 3.Garg P. A review of podocyte biology. Am J Nephrol. 2018;47(suppl 1):3–13. doi: 10.1159/000481633 [DOI] [PubMed] [Google Scholar]
- 4.Kriz W, Hosser H, Hähnel B, Gretz N, Provoost AP. From segmental glomerulosclerosis to total nephron degeneration and interstitial fibrosis: a histopathological study in rat models and human glomerulopathies. Nephrol Dial Transplant. 1998;13(11):2781–2798. doi: 10.1093/ndt/13.11.2781 [DOI] [PubMed] [Google Scholar]
- 5.Bose B, Cattran D. Glomerular diseases: FSGS. Clin J Am Soc Nephrol. 2014;9(3):626–632. doi: 10.2215/CJN.05810513 [DOI] [PMC free article] [PubMed] [Google Scholar]
- 6.Kriz W, Lemley KV. A potential role for mechanical forces in the detachment of podocytes and the progression of CKD. J Am Soc Nephrol. 2015;26(2):258–269. doi: 10.1681/ASN.2014030278 [DOI] [PMC free article] [PubMed] [Google Scholar]
- 7.Rosenberg AZ, Kopp JB. Focal segmental glomerulosclerosis. Clin J Am Soc Nephrol. 2017;12(3):502–517. doi: 10.2215/CJN.05960616 [DOI] [PMC free article] [PubMed] [Google Scholar]
- 8.De Vriese AS, Sethi S, Nath KA, Glassock RJ, Fervenza FC. Differentiating primary, genetic, and secondary FSGS in adults: a clinicopathologic approach. J Am Soc Nephrol. 2018;29(3):759–774. doi: 10.1681/ASN.2017090958 [DOI] [PMC free article] [PubMed] [Google Scholar]
- 9.Drummond IA Majumdar A Hentschel H, et al. Early development of the zebrafish pronephros and analysis of mutations affecting pronephric function. Development. 1998;125(23):4655–4667. doi: 10.1242/dev.125.23.4655 [DOI] [PubMed] [Google Scholar]
- 10.Drummond IA, Davidson AJ. Zebrafish kidney development. Methods Cell Biol. 2010;100:233–260. doi: 10.1016/B978-0-12-384892-5.00009-8 [DOI] [PubMed] [Google Scholar]
- 11.Poureetezadi SJ, Wingert RA. Little fish, big catch: zebrafish as a model for kidney disease. Kidney Int. 2016;89(6):1204–1210. doi: 10.1016/j.kint.2016.01.031 [DOI] [PMC free article] [PubMed] [Google Scholar]
- 12.Kramer-Zucker AG, Wiessner S, Jensen AM, Drummond IA. Organization of the pronephric filtration apparatus in zebrafish requires Nephrin, Podocin and the FERM domain protein Mosaic eyes. Dev Biol. 2005;285(2):316–329. doi: 10.1016/j.ydbio.2005.06.038 [DOI] [PMC free article] [PubMed] [Google Scholar]
- 13.Müller T Rumpel E Hradetzky S, et al. Non-muscle myosin IIA is required for the development of the zebrafish glomerulus. Kidney Int. 2011;80(10):1055–1063. doi: 10.1038/ki.2011.256 [DOI] [PubMed] [Google Scholar]
- 14.Kroeger PT, Wingert RA. Using zebrafish to study podocyte genesis during kidney development and regeneration. Genesis. 2014;52(9):771–792. doi: 10.1002/dvg.22798 [DOI] [PMC free article] [PubMed] [Google Scholar]
- 15.Siegerist F Lange T Iervolino A, et al. Evaluation of endogenous miRNA reference genes across different zebrafish strains, developmental stages and kidney disease models. Sci Rep. 2021;11(1):22894. doi: 10.1038/s41598-021-00075-2 [DOI] [PMC free article] [PubMed] [Google Scholar]
- 16.Endlich N, Siegerist F, Endlich K. Are podocytes motile? Pflugers Arch. 2017;469(7-8):951–957. doi: 10.1007/s00424-017-2016-9 [DOI] [PubMed] [Google Scholar]
- 17.Siegerist F, Blumenthal A, Zhou W, Endlich K, Endlich N. Acute podocyte injury is not a stimulus for podocytes to migrate along the glomerular basement membrane in zebrafish larvae. Sci Rep. 2017;7(1):43655. doi: 10.1038/srep43655 [DOI] [PMC free article] [PubMed] [Google Scholar]
- 18.Schindler M, Blumenthal A, Moeller MJ, Endlich K, Endlich N. Adriamycin does not damage podocytes of zebrafish larvae. PLoS One. 2020;15(11):e0242436. doi: 10.1371/journal.pone.0242436 [DOI] [PMC free article] [PubMed] [Google Scholar]
- 19.Bolten JS, Pratsinis A, Alter CL, Fricker G, Huwyler J. Zebrafish (Danio rerio) larva as an in vivo vertebrate model to study renal function. Am J Physiol Renal Physiol. 2022;322(3):F280–F294. doi: 10.1152/ajprenal.00375.2021 [DOI] [PMC free article] [PubMed] [Google Scholar]
- 20.Fogo AB. Animal models of FSGS: lessons for pathogenesis and treatment. Semin Nephrol. 2003;23(2):161–171. doi: 10.1053/snep.2003.50015 [DOI] [PubMed] [Google Scholar]
- 21.Yang JW Dettmar AK Kronbichler A, et al. Recent advances of animal model of focal segmental glomerulosclerosis. Clin Exp Nephrol. 2018;22(4):752–763. doi: 10.1007/s10157-018-1552-8 [DOI] [PubMed] [Google Scholar]
- 22.Davison JM Akitake CM Goll MG, et al. Transactivation from Gal4-VP16 transgenic insertions for tissue-specific cell labeling and ablation in zebrafish. Dev Biol. 2007;304(2):811–824. doi: 10.1016/j.ydbio.2007.01.033 [DOI] [PMC free article] [PubMed] [Google Scholar]
- 23.Zhou W, Hildebrandt F. Inducible podocyte injury and proteinuria in transgenic zebrafish. J Am Soc Nephrol. 2012;23(6):1039–1047. doi: 10.1681/ASN.2011080776 [DOI] [PMC free article] [PubMed] [Google Scholar]
- 24.Hansen KUI Siegerist F Daniel S, et al. Prolonged podocyte depletion in larval zebrafish resembles mammalian focal and segmental glomerulosclerosis. FASEB J. 2020;34(12):15961–15974. doi: 10.1096/fj.202000724r [DOI] [PubMed] [Google Scholar]
- 25.Xie J, Farage E, Sugimoto M, Anand-Apte B. A novel transgenic zebrafish model for blood-brain and blood-retinal barrier development. BMC Dev Biol. 2010;10(1):76. doi: 10.1186/1471-213x-10-76 [DOI] [PMC free article] [PubMed] [Google Scholar]
- 26.Siegerist F, Zhou W, Endlich K, Endlich N. 4D in vivo imaging of glomerular barrier function in a zebrafish podocyte injury model. Acta Physiol (Oxf). 2017;220(1):167–173. doi: 10.1111/apha.12754 [DOI] [PubMed] [Google Scholar]
- 27.Schindelin J Arganda-Carreras I Frise E, et al. Fiji: an open-source platform for biological-image analysis. Nat Methods. 2012;9(7):676–682. doi: 10.1038/nmeth.2019 [DOI] [PMC free article] [PubMed] [Google Scholar]
- 28.Pandey G, Westhoff JH, Schaefer F, Gehrig J. A smart imaging workflow for organ-specific screening in a cystic kidney zebrafish disease model. Int J Mol Sci. 2019;20(6):1290. doi: 10.3390/ijms20061290 [DOI] [PMC free article] [PubMed] [Google Scholar]
- 29.Westhoff JH Steenbergen PJ Thomas LSV, et al. In vivo high-content screening in zebrafish for developmental nephrotoxicity of approved drugs. Front Cell Dev Biol. 2020;8:583. doi: 10.3389/fcell.2020.00583 [DOI] [PMC free article] [PubMed] [Google Scholar]
- 30.Zhang JH, Chung TD, Oldenburg KR. A simple statistical parameter for use in evaluation and validation of high throughput screening assays. J Biomol Screen. 1999;4(2):67–73. doi: 10.1177/108705719900400206 [DOI] [PubMed] [Google Scholar]
- 31.Birmingham A Selfors LM Forster T, et al. Statistical methods for analysis of high-throughput RNA interference screens. Nat Methods. 2009;6(8):569–575. doi: 10.1038/nmeth.1351 [DOI] [PMC free article] [PubMed] [Google Scholar]
- 32.Zhang XD. A pair of new statistical parameters for quality control in RNA interference high-throughput screening assays. Genomics. 2007;89(4):552–561. doi: 10.1016/j.ygeno.2006.12.014 [DOI] [PubMed] [Google Scholar]
- 33.Arulmozhivarman G Stöter M Bickle M, et al. In vivo chemical screen in zebrafish embryos identifies regulators of hematopoiesis using a semiautomated imaging assay. J Biomol Screen. 2016;21(9):956–964. doi: 10.1177/1087057116644163 [DOI] [PubMed] [Google Scholar]
- 34.George S Xia T Rallo R, et al. Use of a high-throughput screening approach coupled with in vivo zebrafish embryo screening to develop hazard ranking for engineered nanomaterials. ACS Nano. 2011;5(3):1805–1817. doi: 10.1021/nn102734s [DOI] [PMC free article] [PubMed] [Google Scholar]
- 35.Mauro AN Turgeon PJ Gupta S, et al. Automated in vivo compound screening with zebrafish and the discovery and validation of PD 81,723 as a novel angiogenesis inhibitor. Sci Rep. 2022;12(1):14537. doi: 10.1038/s41598-022-18230-8 [DOI] [PMC free article] [PubMed] [Google Scholar]
- 36.Quint WH Tadema KCD Crins JHC, et al. Zebrafish: an in vivo screening model to study ocular phenotypes. Transl Vis Sci Technol. 2022;11(3):17. doi: 10.1167/tvst.11.3.17 [DOI] [PMC free article] [PubMed] [Google Scholar]
- 37.Wanner N Vornweg J Combes A, et al. DNA methyltransferase 1 controls nephron progenitor cell renewal and differentiation. J Am Soc Nephrol. 2019;30(1):63–78. doi: 10.1681/ASN.2018070736 [DOI] [PMC free article] [PubMed] [Google Scholar]
- 38.Li LX, Agborbesong E, Zhang L, Li X. Investigation of epigenetics in kidney cell biology. Methods Cell Biol. 2019;153:255–278. doi: 10.1016/bs.mcb.2019.04.015 [DOI] [PMC free article] [PubMed] [Google Scholar]
- 39.Hyndman KA, Kasztan M, Mendoza LD, Monteiro-Pai S. Dynamic changes in histone deacetylases following kidney ischemia-reperfusion injury are critical for promoting proximal tubule proliferation. Am J Physiol Renal Physiol. 2019;316(5):F875–F888. doi: 10.1152/ajprenal.00499.2018 [DOI] [PMC free article] [PubMed] [Google Scholar]
- 40.Zhang L, Cao W. Histone deacetylase 3 (HDAC3) as an important epigenetic regulator of kidney diseases. J Mol Med (Berl). 2022;100(1):43–51. doi: 10.1007/s00109-021-02141-8 [DOI] [PubMed] [Google Scholar]
- 41.Liu S, Gao X, Fan Z, Wang Q. SIRT2 affects cell proliferation and apoptosis by suppressing the level of autophagy in renal podocytes. Dis Markers. 2022;2022:1–10. doi: 10.1155/2022/4586198 [DOI] [PMC free article] [PubMed] [Google Scholar]
- 42.Melica ME Antonelli G Semeraro R, et al. Differentiation of crescent-forming kidney progenitor cells into podocytes attenuates severe glomerulonephritis in mice. Sci Transl Med. 2022;14(657):eabg3277. doi: 10.1126/scitranslmed.abg3277 [DOI] [PMC free article] [PubMed] [Google Scholar]
- 43.E3 Medium (For Zebrafish Embryos). Cold Spring Harb Protoc; 2011;2011(10): pdb.rec66449. [Google Scholar]
- 44.Wittbrodt JN, Liebel U, Gehrig J. Generation of orientation tools for automated zebrafish screening assays using desktop 3D printing. BMC Biotechnol. 2014;14(1):36. doi: 10.1186/1472-6750-14-36 [DOI] [PMC free article] [PubMed] [Google Scholar]
- 45.Steenbergen PJ, Heigwer J, Pandey G, Tönshoff B, Gehrig J, Westhoff JH. A multiparametric assay platform for simultaneous in vivo assessment of pronephric morphology, renal function and heart rate in larval zebrafish. Cells. 2020;9(5):1269. doi: 10.3390/cells9051269 [DOI] [PMC free article] [PubMed] [Google Scholar]
- 46.Huang J, McKee M, Huang HD, Xiang A, Davidson AJ, Lu HAJ. A zebrafish model of conditional targeted podocyte ablation and regeneration. Kidney Int. 2013;83(6):1193–1200. doi: 10.1038/ki.2013.6 [DOI] [PMC free article] [PubMed] [Google Scholar]
- 47.D'Agati VD. Podocyte growing pains in adaptive FSGS. J Am Soc Nephrol. 2017;28(10):2825–2827. doi: 10.1681/ASN.2017060612 [DOI] [PMC free article] [PubMed] [Google Scholar]
- 48.Kim G-HJ Mo H Liu H, et al. A zebrafish screen reveals Renin-angiotensin system inhibitors as neuroprotective via mitochondrial restoration in dopamine neurons. Elife. 2021;10:e69795. doi: 10.7554/elife.69795 [DOI] [PMC free article] [PubMed] [Google Scholar]
- 49.Bar H, Zweifach A. Z′ does not need to Be 0.5. SLAS Discov. 2020;25(9):1000–1008. doi: 10.1177/2472555220942764 [DOI] [PMC free article] [PubMed] [Google Scholar]
- 50.Markossian S Grossman A Brimacombe K, et al., eds. Assay Guidance Manual; 2004. PMID: 22553861. [PubMed] [Google Scholar]
- 51.Liu M Liang K Zhen J, et al. Sirt6 deficiency exacerbates podocyte injury and proteinuria through targeting notch signaling. Nat Commun. 2017;8(1):413. doi: 10.1038/s41467-017-00498-4 [DOI] [PMC free article] [PubMed] [Google Scholar]
- 52.Allison SJ. Epigenetics: H3K27me3 in glomerular disease. Nat Rev Nephrol. 2018;14(3):143. doi: 10.1038/nrneph.2018.1 [DOI] [PubMed] [Google Scholar]
- 53.Lange T Artelt N Kindt F, et al. MiR-21 is up-regulated in urinary exosomes of chronic kidney disease patients and after glomerular injury. J Cell Mol Med. 2019;23(7):4839–4843. doi: 10.1111/jcmm.14317 [DOI] [PMC free article] [PubMed] [Google Scholar]
- 54.Kuo F-C, Chao C-T, Lin S-H. The dynamics and plasticity of epigenetics in diabetic kidney disease: therapeutic applications vis-à-vis. Int J Mol Sci. 2022;23(2):843. doi: 10.3390/ijms23020843 [DOI] [PMC free article] [PubMed] [Google Scholar]
- 55.Majumder S Thieme K Batchu SN, et al. Shifts in podocyte histone H3K27me3 regulate mouse and human glomerular disease. J Clin Invest. 2017;128(1):483–499. doi: 10.1172/jci95946 [DOI] [PMC free article] [PubMed] [Google Scholar]
- 56.Gregoretti IV, Lee Y-M, Goodson HV. Molecular evolution of the histone deacetylase family: functional implications of phylogenetic analysis. J Mol Biol. 2004;338(1):17–31. doi: 10.1016/j.jmb.2004.02.006 [DOI] [PubMed] [Google Scholar]
- 57.Emanuele S, Lauricella M, Tesoriere G. Histone deacetylase inhibitors: apoptotic effects and clinical implications (review). Int J Oncol. 1992;33(4):637–646. doi: 10.3892/ijo_00000049 [DOI] [PubMed] [Google Scholar]
- 58.Marampon F Di Nisio V Pietrantoni I, et al. Pro-differentiating and radiosensitizing effects of inhibiting HDACs by PXD-101 (Belinostat) in in vitro and in vivo models of human rhabdomyosarcoma cell lines. Cancer Lett. 2019;461:90–101. doi: 10.1016/j.canlet.2019.07.009 [DOI] [PubMed] [Google Scholar]
- 59.Lee H-Z Kwitkowski VE Del Valle PL, et al. FDA approval: belinostat for the treatment of patients with relapsed or refractory peripheral T-cell lymphoma. Clin Cancer Res. 2015;21(12):2666–2670. doi: 10.1158/1078-0432.ccr-14-3119 [DOI] [PubMed] [Google Scholar]
- 60.Foss F Advani R Duvic M, et al. A Phase II trial of Belinostat (PXD101) in patients with relapsed or refractory peripheral or cutaneous T-cell lymphoma. Br J Haematol. 2015;168(6):811–819. doi: 10.1111/bjh.13222 [DOI] [PubMed] [Google Scholar]
Associated Data
This section collects any data citations, data availability statements, or supplementary materials included in this article.
Data Availability Statement
All data is included in the manuscript and/or supporting information. The FIJI image analysis macro code is available at https://github.com/MaximilianSchindler/ImageJ-macros.