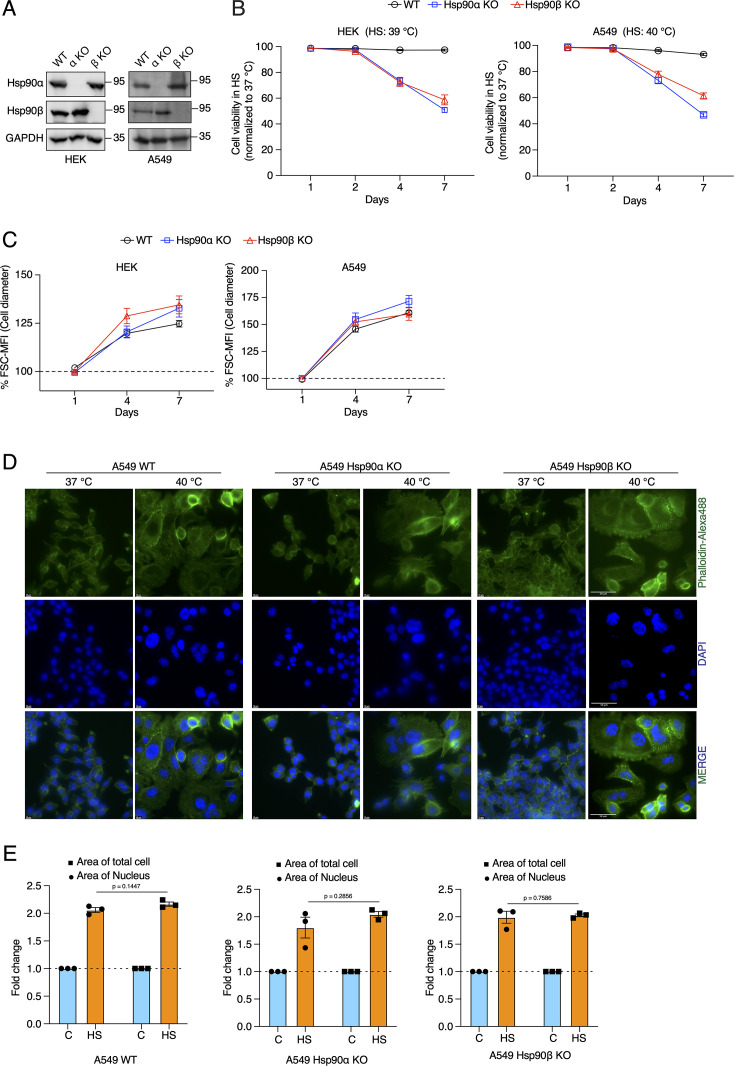
Figure 2. Cells increase their overall size and their nuclei, but are unable to adapt to chronic HS in the absence of one of the cytosolic Hsp90 isoforms.
(A) Immunoblots of Hsp90α and Hsp90β in WT HEK and A549 cells, and their respective Hsp90α/β KO cells. GAPDH serves as the loading control (α KO; Hsp90α KO and β KO; Hsp90β KO) (representative images of n=4 biologically independent experiments). (B) Flow cytometric quantification of cell viability of HEK, A549, and their respective Hsp90α/β KO cells in chronic HS at different time points during a period of 7 days (n=5 biologically independent samples). Note that the X axis does not have a linear scale and that lines connecting the data points are drawn as a visual aid. (C) Flow cytometric quantification of cell size in chronic HS at different time points during a period of 7 days (HS = 39 °C for HEK and 40 °C for A549) (n=4 biologically independent samples) The data are represented as mean values ± SEM for all bar graphs. (D) Fluorescence microscopy images of A549 WT and Hsp90α/β KO cells fixed after 4 days of chronic HS. The cytoskeleton is stained with phalloidin-Alexa488 (green), and the nucleus is stained with DAPI (blue). Images were captured with a fluorescence microscope (Zeiss, Germany). The scale bars on the images in the far right column are 50 μM. (E) Bar graphs of the area of nuclei and whole cells determined from fluorescent micrographs (representative images are shown in panel D) using ImageJ. We used micrographs from three biologically independent experiments. From each experiment, we measured 30 randomly chosen cells, and their average values were used as one data point. The data for all bar graphs are represented as mean values ± SEM. The statistical significance between the groups was analyzed by two-tailed unpaired Student’s t-tests.


