

Abstract
Following a request from the European Commission (EC), the EFSA Panel on Nutrition, Novel Foods and Food Allergens (NDA) was asked to deliver a scientific opinion on the tolerable upper intake level (UL) for manganese. Systematic reviews of the literature of human and animal data were conducted to assess evidence regarding excess manganese intake (including authorised manganese salts) and the priority adverse health effect, i.e. manganese‐induced neurotoxicity. Available human and animal studies support neurotoxicity as a critical effect, however, data are not sufficient and suitable to characterise a dose–response relationship and identify a reference point for manganese‐induced neurotoxicity. In the absence of adequate data to establish an UL, estimated background dietary intakes (i.e. manganese intakes from natural dietary sources only) observed among high consumers (95th percentile) were used to provide an indication of the highest level of intake where there is reasonable confidence on the absence of adverse effects. A safe level of intake of 8 mg/day was established for adults ≥ 18 years (including pregnant and lactating women) and ranged between 2 and 7 mg/day for other population groups. The application of the safe level of intake is more limited than an UL because the intake level at which the risk of adverse effects starts to increase is not defined.
Keywords: manganese, safe level of intake, tolerable upper intake level, UL
Short abstract
This publication is linked to the following EFSA Journal article: https://efsa.onlinelibrary.wiley.com/doi/10.2903/j.efsa.2023.p211201
1. INTRODUCTION
Directive 2002/46/EC 1 on food supplements and Regulation (EC) No 1925/2006 2 on fortified foods delegate the power to the European Commission (EC) to adopt maximum amounts of vitamins and minerals that may be used in food supplements or added to foods. In this context, the EC asked EFSA to update the scientific advice on the tolerable upper intake level (UL) for a number of priority nutrients, among which manganese. 3
Briefly, the UL is defined as ‘the maximum level of total chronic daily intake of a nutrient (from all sources) which is not expected to pose a risk of adverse health effects to humans’. (EFSA NDA Panel, 2022).
‘Tolerable intake’ in this context connotes what is physiologically tolerable and can be established based on an assessment of risk, i.e. the probability of an adverse effect occurring at a specified level of exposure. The UL is not a recommended level of intake. As the intake increases above the UL, the risk of adverse effects increases.
ULs should be protective for all members of the general population, including sensitive individuals, throughout their lifetime. The derivation of ULs accounts for the expected variability in sensitivity among individuals. In principle, individuals under medical care are not excluded unless: (a) there is an expected interaction between the medical condition and the occurrence of possible adverse effects of a nutrient or (b) they are under medical treatment with the nutrient under assessment.
On the other hand, the UL may exclude sub‐populations with extreme and distinct vulnerabilities to adverse effects of the nutrient due to specific genetic predisposition or other factors. The exclusion of such sub‐populations must be considered on a nutrient‐by‐nutrient basis and is an area of scientific and expert judgement and of risk management (EFSA NDA Panel, 2022).
1.1. Background as provided by the European Commission
Article 6 of Regulation (EC) No 1925/2006 on the addition of vitamins and minerals and of certain other substances to foods and Article 5 of Directive 2002/46/EC on the approximation of the laws of the Member States relating to food supplements provide that maximum amounts of vitamins and minerals added to foods and to food supplements respectively, shall be set.
The above‐mentioned provisions lay down the criteria to be taken into account when establishing these maximum amounts that include the upper safe levels (ULs) of vitamins and minerals established by scientific risk assessment based on “generally accepted scientific data, taking into account, as appropriate, the varying degrees of sensitivity of different groups of consumers”.
To set maximum amounts of vitamins and minerals in fortified foods and food supplements, the Commission would like to ask the European Food Safety Authority (EFSA) to review the previous opinions of the Scientific Committee on Food (SCF) or the NDA Panel on the ULs for vitamin A, 4 folic acid/folate,4 vitamin D,4 vitamin E,4 vitamin B6,4 iron,4 manganese4 and β‐carotene4 to take into account recent scientific developments and evidence.
In this context, EFSA should first review the guidelines of the SCF4 for the development of tolerable upper intake levels for vitamins and minerals (adopted on 19 October 2000).
Tolerable Upper Intake Levels should be presented separately for the age group from 4/6 months onwards until 3 years of age and the general population group from 3 years onwards, taking into account, as appropriate, the varying degrees of sensitivity of different consumer groups. As foods intended for the general population are also consumed by young children, young children should be considered as a potentially sensitive consumer group.
1.2. Terms of Reference as provided by the European Commission
In accordance with Article 29(1)(a) of Regulation (EC) No 178/2002, the European Commission requests the European Food Safety Authority to:
Update the guidelines of the SCF for the development of Tolerable Upper Intake Levels for vitamins and minerals in the light of available recent scientific and methodological developments.
- Review existing scientific evidence and provide advice on Tolerable Upper Intake Levels for the following vitamins and minerals including their currently authorized forms for the addition to fortified foods and food supplements for the general population and, as appropriate, for vulnerable subgroups of the population:
- vitamin A
- folic acid/folate
- vitamin D
- vitamin E
- iron
- manganese
- β‐carotene
- vitamin B6
For nutrients for which there are no, or insufficient, data on which to base the establishment of an UL, an indication should be given on the highest level of intake where there is reasonable confidence in data on the absence of adverse effects.
1.3. Interpretation of the Terms of Reference
According to the mandate, EFSA has first reviewed the guidelines of the SCF for the development of tolerable upper intake levels for vitamins and minerals (SCF, 2000). A draft guidance has been endorsed by the NDA Panel and published for a 1‐year pilot phase (EFSA NDA Panel, 2022), after which it will be revised and complemented as necessary, following a public consultation.
The UL for manganese will be revised by the Panel according to the principles laid down in the above‐mentioned guidance, following a protocol developed for that purpose (Annex A).
The Panel also interprets that the assessment relates to manganese from all dietary sources, i.e. foods (including fortified foods), beverages (including water) and food supplements. Forms of manganese naturally present in foods and manganese salts currently authorised in the EU for addition to foods or use in food supplements (Section 3.1, Table 3) should also be considered.
TABLE 3.
Forms of manganese authorised as nutrient sources in the EU.
| Addition to foods Regulation (EC) 1925/2006 a | Food supplements Directive 2002/46/EC b | |
|---|---|---|
| Mn carbonate | x | x |
| Mn chloride | x | x |
| Mn citrate | x | x |
| Mn gluconate | x | x |
| Mn glycerophosphate | x | x |
| Mn sulfate | x | x |
| Mn ascorbate | x | |
| Mn L‐aspartate | x | |
| Mn bisglycinate | x | |
| Mn pidolate | x |
Regulation (EC) No 1925/2006 of the European Parliament and of the Council of 20 December 2006 on the addition of vitamins and minerals and of certain other substances to foods. OJ L 404, 30.12.2006, p. 26.
Directive 2002/46/EC of the European Parliament and of the Council of 10 June 2002 on the approximation of the laws of the Member States relating to food supplements. OJ L 183, 12.7.2002, p. 51–57.
1.4. Context of the assessment
Previous safety assessments by the SCF and EFSA
The SCF evaluated the UL for manganese in 2000 (SCF, 2000) and concluded that oral intake of manganese, despite its poor absorption in the gastrointestinal tract, can cause neurotoxic effects. However, an UL could not be set due to the limited available evidence in humans and the lack of a no‐observed‐adverse‐effect‐level (NOAEL) from animal studies. The SCF concluded that ‘The margin between oral effect levels in humans as well as experimental animals and the estimated intake from food is very low. Given the findings on neurotoxicity and the potentially higher susceptibility of some subgroups in the general population, oral exposure to manganese beyond the normally present in food and beverages could represent a risk of adverse health effects without evidence of any health benefit’.
EFSA has previously evaluated the safety and bioavailability of manganese aspartate, manganese ascorbate, manganese bisglycinate and manganese pidolate as a source of manganese added for nutritional purposes to food supplements (EFSA ANS Panel, 2009c). Although no specific studies on bioavailability were available, it was considered that the bioavailability of these forms would be at least similar to that from other dissociable sources of manganese in the gastrointestinal tract. The use of these manganese forms in food supplements was concluded not to be of safety concern, provided that guidance levels (EVM, 2003) for manganese supplementation (i.e. 4 mg Mn/day for the general population and 0.5 mg Mn/day for older people) were not exceeded (EFSA ANS Panel, 2009c). In contrast, data provided in the application dossiers were considered inadequate to establish the safety and bioavailability of manganese amino acid chelate and manganese ethanolamine phosphate under the proposed conditions of use (EFSA ANS Panel, 2009a, 2009b).
EFSA's FEEDAP Panel assessed the safety of several manganese compounds used as additives in animal feed and considered them to be safe for the consumed products, provided that the total maximum authorised content of manganese in complete feed is respected (EFSA FEEDAP Panel, 2010, 2013a, 2013b, 2016a, 2016b).
Adequate intake for manganese
In 2013, the NDA Panel published an opinion on Dietary Reference Values for manganese (EFSA NDA Panel, 2013). As per the terms of reference for its task, a review of the UL for manganese was out of the scope of the assessment. Due to insufficient evidence to derive an average requirement (AR) or a population reference intake (PRI), adequate intakes (AIs) for manganese were proposed. The Panel noted that mean intakes of manganese in adults in the EU were around 3 mg/day and that no indication of negative balance had been observed with intakes of manganese above 2.5 mg/day. An AI of 3 mg/day was established for adults, including pregnant and lactating women. For infants aged 7–11 months, an AI of 0.02–0.5 mg/day was established, to reflect the wide range of manganese intakes that appear to be adequate for this age group. The AIs for children and adolescents were extrapolated from the adult AI, applying isometric scaling, 5 as follows: 0.5 mg/day for toddlers (1–3 years), 1.0 mg/day for young children (4–6 years), 1.5 mg/day for older children (7–10 years), 2.0 mg/day for younger adolescents (11–14 years) and 3.0 mg/day for older adolescents (15–17 years).
1.5. Previous assessments by other bodies
As in the SCF assessment (2000), other authoritative bodies charged with establishing health‐based guidance values (HBGVs) for manganese identified neurotoxicity as the critical endpoint for manganese toxicity (EVM, 2003; IOM, 2001; US EPA, 2004).
The Institute of Medicine (IOM) considered data indicating that people eating Western‐type and vegetarian diets may have manganese intakes as high as 10.9 mg/day (IOM, 2001). The expert committee stated that ‘because no adverse effects due to manganese intake have been noted, at least in people consuming Western diets, 11 mg/day is a reasonable NOAEL from food’. A lowest‐observed‐adverse‐effect‐level (LOAEL) of 15 mg/day was identified for manganese from an experimental study in humans, in which significant increases in serum manganese concentrations and in lymphocyte Mn‐dependent superoxide dismutase activity (MnSOD) were reported after 25 days and 90 days of supplementation with manganese, respectively (Davis & Greger, 1992). The UL for children (≥ 1 year) and adolescents was derived from the UL for adults by applying isometric scaling.5 No UL was established for infants (0–12 months of age) due to lack of data on adverse effects in that age group and concerns regarding their ability to handle excessive amounts of manganese.
The UK Expert Group on Vitamins and Minerals concluded that data from animal or human studies were insufficient to establish a safe upper level (SULs) for manganese (EVM, 2003). For guidance purposes, the expert committee considered that a supplemental intake of up to 4000 μg manganese/day in addition to the diet would be unlikely to produce adverse effects (equivalent to 70 μg/kg body weight [bw] for a 60 kg adult) in the general population, based on the NOAEL from one observational study in Germany (average age of participants 57 years) (Vieregge et al., 1995), without applying an uncertainty factor (UF). Using the NOAEL from an observational study in Greece (average age of participants 66 years) (Kondakis et al., 1989), it was assumed that up to 0.5 mg manganese/day (equivalent to 8 μg/kg bw for a 60 kg adult) in addition to the diet would not result in adverse effects in older people. Assuming a dietary intake of 8.2 mg/day, acceptable total manganese intakes were estimated to be 12.2 mg/day in the general population and 8.7 mg/day for older people.
In the context of its work on drinking water health advisory values, the US Environmental Protection Agency (EPA) provided advice on a reference dose (RfD) for manganese, i.e. an estimate of a daily exposure to the human population (including sensitive subgroups) that is likely to be without appreciable risk of deleterious health effects during a lifetime (US EPA, 2004). Based on the dietary information, an intake of 10 mg Mn/day in the diet was considered safe for a lifetime of exposure and was selected as a NOAEL for chronic ingestion of manganese by humans. An UF of 1 was applied on the consideration of the essentiality of manganese for human health, of the ‘many large human populations consuming normal diets over an extended period of time’ that were used to derive the RfD, and of available data on manganese homeostatic control in humans. A dietary RfD of 0.14 mg Mn/kg bw per day (assuming a body weight of 70 kg) was derived.
The US Agency for Toxic Substances and Disease Registry (ATSDR) reviewed the toxicological profile of manganese in 2012, with the aim of establishing minimal risk levels (MRLs) for all routes and duration of exposure to manganese, including chronic dietary exposure (ATSDR, 2012). No MRL for oral exposure could be established from human or animal studies, due to lack of consistency in dose–response data across studies and lack of information on all intakes of manganese (e.g. dietary intakes plus administered doses). Instead, an interim guidance value of 0.16 mg Mn/kg bw per day was recommended for oral exposure to inorganic forms of manganese, based on the UL of 11 mg/day for adults set by the IOM (2001).
No UL for dietary manganese has been established by the World Health Organization (WHO)/ Food and Agriculture Organization (FAO) (FAO/WHO, 2004). For the purpose of setting guidelines for drinking water quality, WHO derived a tolerable daily intake (TDI) of 0.025 mg total manganese/kg bw per day, considering a LOAEL of 25 mg/kg bw per day based on available studies in rats, and applying an UF of 1000 to account for inter‐ and intraspecies differences and uncertainties in the database (WHO, 2021).
2. DATA AND METHODOLOGIES
2.1. Problem formulation
In accordance with the draft NDA Panel guidance on establishing and applying tolerable upper intake levels for vitamins and essential minerals (EFSA NDA Panel, 2022), the assessment questions underlying the UL evaluation are formulated as follows:
What is the maximum level of total chronic daily intake of manganese (from all sources) which is not expected to pose a risk of adverse health effects to humans? (Hazard identification and characterisation)
What is the daily intake of manganese from all dietary sources in EU populations? (Intake assessment)
What is the risk of adverse effects related to the intake of manganese in EU populations, including attendant uncertainties? (Risk characterisation)
The hazard identification and hazard characterisation relate to the identification of adverse health effects of a given nutrient and the qualitative and quantitative evaluation of the adverse health effects associated with the nutrient, including dose–response assessment and derivation of a UL, if possible.
Adverse (health) effects are defined as ‘a change in the morphology, physiology, growth, development, reproduction or life span of an organism, system or (sub)population that results in an impairment of functional capacity to compensate for additional stress or an increase in susceptibility to other influences (FAO/WHO, 2009; EFSA Scientific Committee, 2017a). The observable effects of high nutrient intake within the causal pathway of an adverse health effect can range from biochemical changes without functional significance (e.g. certain changes in enzyme activity) to irreversible clinical outcomes. Notably, some changes that occur before clinical manifestations could be used as surrogate or predictive markers of subsequent adverse health effects, i.e. biomarkers of effect’ (EFSA NDA Panel, 2022).
In consultation with a panel of qualified experts on manganese 6 and after discussion by the ULs Working Group (WG), neurotoxicity was identified as priority adverse health effect for the risk assessment, i.e. the one that is expected to play a critical role for establishing an UL. This is addressed through systematic reviews of the literature of animal (mammals) and human data. The rationale for the prioritisation of this adverse health effect is detailed in the protocol (Annex A). Other adverse health effects are addressed narratively.
The assessment sub‐questions identified as the result of the problem formulation, together with the methods selected to address them, are provided in Table 1.
TABLE 1.
Assessment sub‐questions and methods to address them.
| Sub‐question | Method | |
|---|---|---|
| sQ1 |
Absorption, distribution, metabolism and excretion (ADME) of manganese
|
Narrative review |
| sQ2 |
Biomarkers of exposure to manganese What are markers of manganese dietary exposure and their relationship with ‘high’ manganese dietary exposure? What are their strengths and limitations and future research needs? |
Narrative review |
| sQ3 |
Neurotoxicity of manganese
|
Systematic review Systematic review Narrative review |
| sQ4 |
Other adverse health effects What other adverse health effects have been reported to be associated with ‘high’ intake of manganese? |
Narrative review |
| sQ5 |
Manganese intake
|
Food composition and food consumption data in the EU |
2.2. Hazard identification and characterisation
Preparatory work to address sQ1 to sQ4 has been provided by a contractor and, subsequently, a technical report was published (Halldorsson et al., 2023). The technical report served as the primary source of information for this assessment, however, the Panel conducted an independent evaluation of the evidence and adapted the outcome of the contractor's work, where considered appropriate.
2.2.1. Data
A description of the processes applied for evidence retrieval, study selection and data extraction is provided below. These steps were conducted by a contractor, i.e. by the University of Iceland in collaboration with the University of Oslo, and are described in the final report of this outsourced project (Halldorsson et al., 2023).
A description of the processes used for evidence retrieval, study selection and data extraction for sub‐questions addressed through systematic and narrative reviews is provided below.
2.2.1.1. Priority adverse health effects (sQ3a and sQ3b)
To address sQ3a and sQ3b, relevant human (for sQ3a) and animal (for sQ3b) studies on the selected adverse health effect (neurotoxicity) were identified through systematic searches of the literature in MEDLINE (Ovid), Embase (Ovid) and Cochrane Central Register of Controlled Trials for articles published in English. No limitation on publication date was applied. The search strategy was created by information specialists of the University of Oslo and peer reviewed by information specialists at EFSA. The searches were performed on the 13th of April 2022. The search strategy is further detailed in the final report of the outsourced project (Halldorsson et al., 2023). Grey literature (i.e. literature not indexed in literature databases) was not searched.
Retrieved articles were screened in duplicate in Distiller SR® at title and abstract level, also with the use of the artificial intelligence tool of Distiller SR®, and at full‐text level for inclusion/exclusion according to the criteria defined in the protocol (Annex A). Conflicts were solved by a third reviewer, if necessary. Relevant systematic reviews, if available, were hand‐searched for additional pertinent studies. Reviews, expert opinions, editorials, letters to the editors, abstracts, posters and theses not reporting on original data were excluded.
Eligible designs: All experimental and observational study designs in humans (including case reports) were considered relevant. Regarding experimental studies in animals, repeated‐dose toxicity studies (with sub‐acute, sub‐chronic and chronic duration of exposure) as well as reproduction/developmental toxicity studies were considered.
Eligible study populations: Studies were eligible if they involved individuals of any age, who were healthy or diseased, if their disease was considered not to be related to the exposure‐outcome relationship. Studies in individuals with manganese deficiency and/or with clinical conditions affecting neurodevelopment or the central nervous system at baseline were excluded. Experimental studies in animals were restricted to mammalian species only.
Eligible exposure measurements: Studies were eligible if they reported quantitative estimates of dietary manganese (either self‐reported or recorded) or characterised its content in drinking water. Studies were also eligible if experimental animals were treated with manganese (at least one group of animals, without co‐administration with other substances) compared to a vehicle control through the oral route.
In relation to sQ3a, 7973 unique references were identified after removing duplicates (see flow chart, Appendix A.1). The title and abstract screening left 159 relevant articles that underwent a full‐text review. Of those, 110 were excluded. The reasons for exclusion are reported in the technical report of the outsourced project (Halldorsson et al., 2023). A total of 49 publications reporting on 1 human controlled trial (HCT) and 48 observational studies were included by the contractor. Upon evaluation of the papers, the Panel noted that three studies did not meet the eligibility criteria from the protocol (Sánchez et al., 2012 [wrong exposure], Soetrisno and Delgado‐Saborit, 2020 [uncontrolled co‐exposure], Lao et al., 2017 [wrong outcome]) and one study provided insufficient reporting for the scientific risk assessment (Iwata, 1977). One case–control study (Dang et al., 1983) investigated the outcome (congenital anomalies) not covered by the sQ3a, but rather with sQ4 (see Section 3.4.3.2).
Further, no evidence for an adverse effect of dietary intake of manganese was found for the following health outcomes: depression (six studies [Rubio‐López et al., 2016; Miyake et al., 2017; Nakamura et al., 2019; Thi Thu Nguyen et al., 2019; Li et al., 2020; Maitiniyazi et al., 2022]), autism (one study [Moludi et al., 2020]), multiple sclerosis (two studies [Cortese et al., 2019; Venasse et al., 2021]), Parkinson's disease (two studies [Miyake et al., 2011], Fukushima et al., 2010), increased signal intensity on T1‐weighted magnetic resonance images (MRI) (one study [Ahn et al., 2003]) and adverse symptoms during menstrual phase regarding changes in behaviour (one study [Penland & Johnson, 1993]). Therefore, these 13 studies are not further considered in this opinion. The characteristics and results of these studies are available in the technical report of the contractor (Halldorsson et al., 2023).
As a result, the Panel considered a total of 31 publications reporting human studies under sQ3a.
In relation to sQ3b, 6498 unique references were identified after removing duplicates (see flow chart, Appendix A.2). The title and abstract screening left 294 relevant articles that underwent a full‐text review. Of those, 231 were excluded. The reasons for exclusion are reported in the final report of the outsourced project (Halldorsson et al., 2023). A total of 63 publications reporting on 39 single dose‐level and 24 multiple dose‐level studies in animals were included.
Data were extracted into Distiller SR® by two extractors of the University of Iceland. They were jointly discussed, compared and harmonised at several time points by the two extractors. Evidence tables were prepared in Microsoft Word® (sQ3a) or Excel® (sQ3b) and are provided in Appendix C.
2.2.1.2. Other background information (sQ1, sQ2, sQ3c and SQ4)
The evidence used to inform sQ1, sQ2, sQ3c and sQ4 was retrieved through non‐systematic searches in bibliographic databases of textbooks, authoritative reviews and research papers, selected as sources of information by the WG on ULs based on their relevance and synthesised as narrative reviews.
2.2.2. Methodologies
The methodology for this assessment follows the guidance for establishing ULs developed by the EFSA NDA Panel (2022). Other guidance documents from EFSA were also considered, including those addressing the application of the systematic review methodology in food and feed safety assessments (EFSA, 2010), the principles and processes for dealing with data and evidence in scientific assessments (EFSA, 2015b), the statistical significance and biological relevance (EFSA Scientific Committee, 2011), the biological relevance of data (EFSA Scientific Committee, 2017a), the use of the weight of evidence approach (EFSA Scientific Committee, 2017b), the appraisal and integration of evidence from epidemiological studies (EFSA Scientific Committee, 2020), the selected values to be used by EFSA in the absence of actual measured data (EFSA Scientific Committee, 2012) and the analysis of uncertainty (UA) in scientific assessments (EFSA Scientific Committee, 2018).
2.2.2.1. Evidence appraisal (sQ3a and sQ3b)
A risk of bias (RoB) appraisal, i.e. evaluation of the internal validity of studies, was applied to the eligible studies in humans and animals which addressed sQ3a and sQ3b.
The appraisal was performed using the Office of Health Assessment and Translation (OHAT) RoB tool developed by the US National Toxicology Program (NTP) (OHAT‐NTP, 2015). The RoB criteria and rating instructions provided therein were adapted to the specific research questions; in human studies for the questions addressing: (1) consideration of potential confounders, (2) confidence in the exposure characterisation and (3) confidence in the outcome assessment (Appendix B.1); in animal studies for the questions addressing: (1) randomisation, (2) exposure characterisation and (3) outcome assessment (Appendix B.2).
The appraisal was performed in duplicate by the contractor and EFSA staff. Discrepancies in the assessment in relation to the RoB judgement of each domain were discussed among the assessors. In case of disagreement, the experts of the EFSA WG on ULs were consulted.
The OHAT RoB tool proposes five response options for each RoB question: definitely low RoB (++), probably low RoB (+), not reported (NR), probably high RoB (−) and definitely high RoB (−).
Studies were categorised according to their overall RoB based on a three‐tier system, i.e. at low (tier 1), moderate (tier 2) or high (tier 3) RoB), according to the strategy proposed by OHAT (OHAT/NTP, 2019) (Appendix B).
2.2.2.2. Evidence synthesis (sQ3b)
To obtain standardised doses of manganese exposure across the eligible animal studies, several assumptions had to be made:
- Unless the treatment dose was expressed as manganese by the study authors, conversion from the test substance to elemental manganese was applied by using the following factors:
- 0.278 when authors reported using manganese chloride tetrahydrate (MnCl2.4H20),
- 0.339, corresponding to manganese chloride dihydrate (MnCl2.2H20), as a default when the manganese chloride form used (anhydrous, dihydrate or tetrahydrate) was unspecified,
- 0.437 when authors reported using anhydrous manganese chloride (MnCl2).
In case manganese was administered via drinking water or feed and the consumption and animal body weights were not reported by the authors, extrapolation to daily doses by body weight (mg Mn/kg bw per day) was performed applying the factors recommended by the EFSA Scientific Committee (EFSA Scientific Committee, 2012).
In addition, the manganese intake from the background diet was estimated. When reported, this was based on the manganese content of the chow used in the study. When this was not available, the average intake of manganese from background diet was estimated based on the manganese content of standard rodent chows reported in the eligible publications, i.e. mean (range) of 86 (60–130) mg/kg feed, and the conversion factor applicable to the particular life stage of the animals involved in the study (Table 2).
TABLE 2.
Estimated manganese intake from background diet, by species and life stage of exposure.
| Exposure windows | Juvenile Sub‐acute b (week 5–9) | Young adults Sub‐chronic c (week 5–17) | |
|---|---|---|---|
| Rats | Conversion factor a | 0.12 | 0.09 |
| Mn intake (mean [range], mg/kg bw per day) | 10 (7–16) | 8 (5–12) | |
| Mice | Conversion factor a | 0.2 | 0.2 |
| Mn intake (mean [range], mg/kg bw per day) | 17 (12–26) | 17 (12–26) | |
Abbreviation: bw, body weight.
As recommended by EFSA Scientific Committee (EFSA Scientific Committee, 2012).
Duration of exposure: > 24 h to ≤ 28 days.
Duration of exposure: > 28 days to < 1 year.
The details of the calculations made for each individual studies are given in Appendix E.
2.2.2.3. Evidence integration
Hazard identification. Regarding sQ3a, the hazard identification step consisted of assessing the evidence for a causal positive relationship between manganese intake and the priority health effect identified (neurotoxicity). The available body of evidence (BoE) is organised in separate lines of evidence (LoE), which are classified per outcome measured and per subgroup of population (children and adults) in hierarchical order.
The LoE for the studies on children were categorised as:
Standalone main LoE: studies on direct validated measures of the neurological function. These studies could, on their own, answer the sQ directly.
Complementary LoE: studies on endpoints that are relevant to neurological function but less direct than those included in standalone LoE. These studies, on their own, cannot answer the sQ but can be used as supporting evidence to the standalone LoEs.
Conclusions on the health effects are reached based on study design, considering the uncertainties in the BoE and in the methods.
Regarding sQ3b, the hazard identification step consisted of assessing the evidence for neurotoxicological or adverse neurodevelopmental effects in experimental animals caused by orally administered manganese. For these adverse effects, studies were grouped by the life stage of exposure as well as method of administration of manganese (for studies conducted with adult animals; see Section 3.4.2 for more details).
Hazard characterisation
At this step, evidence is integrated to select the critical effect(s) and identify a reference point (RP) for establishing the UL. As proposed in the guidance for establishing and applying ULs for vitamins and essential minerals (EFSA NDA Panel, 2022), when available data are insufficient to base on the UL, an indication should be given on the highest level of intake for which there is reasonable confidence on the absence of adverse effects (e.g. from the highest supplemental intake), drawing from the totality of the available evidence.
2.3. Dietary intake assessment (sQ5)
The assessment follows the approach outlined in the protocol for the intake assessments performed in the context of the revision of ULs for selected nutrients (EFSA, 2022). The principles of the data cleaning and methodology used for the present intake assessment are described in Annex B.
2.3.1. Data
Food intake data from the EFSA Comprehensive European Food Consumption Database (hereinafter referred as Comprehensive Database) 7 and data on manganese content in foods from the EFSA food composition database (FCDB) 8 as available in 2022 were used.
Food consumption data
The Comprehensive Database provides a compilation of existing national information on food consumption at individual level collected through repeated non‐consecutive 24‐h dietary recalls or dietary records (EFSA, 2011; EFSA ANS Panel, 2013). The latest version of the Comprehensive Database, updated in 2022, contains results from a total of 83 different dietary surveys carried out in 29 different European countries (including EU Member States, pre‐accession countries and the United Kingdom) covering 154,388 individuals. In the present assessment, food consumption surveys from 22 EU member states covering at least 2 days per subject were used.
Food composition data
Composition data for manganese in foods and beverages were derived from the EFSA Nutrient Composition Database, which was compiled as a deliverable of the procurement project ‘Updated food composition database for nutrient intake’ (Roe et al., 2013). Publicly available national food composition databases, the Mintel Global New Products Database (GNPD) 9 and data from published literature were used to complement EFSA's food composition database.
To complement EFSA's intake assessment, manganese intake estimates from natural sources, from addition to foods (i.e. fortified foods) and from food supplements based on nationally representative food consumption surveys without limitation on date of data collection or publication were collected. These data have been also used to evaluate the accuracy of the results obtained, comparing EFSA's estimates with published intake estimates from the same surveys with the same (or similar) window of data collection and population groups, when available (EFSA, 2022). Data were collected between September and November 2021 by contacting 64 competent authorities in 37 European countries through EFSA Focal Points 10 and the EFSA Food Consumption Network. 11 An additional search in sources of bibliographic information (Google Scholar, PubMed) was performed to collect reports of national surveys included in the Comprehensive Database that had not been obtained through the competent authorities. Between August and October 2022, EFSA contacted all EU Member States and Norway through the European Commission Working Group on Food supplements and Fortified foods 12 and collected data on the intake of manganese specifically from food supplements.
The Mintel GNPD was used as a data source to identify the type of manganese‐containing food supplements and fortified foods available on the EU market. The search was limited to the past 5 years, from November 2017 to November 2022. The Panel notes that this search captures only those products that were newly introduced on the market and for which the packaging was changed during this period. Therefore, the information collected is indicative and does not necessarily represent a comprehensive overview of the products available on the market.
2.3.2. Methodologies
Intake assessment from natural food sources
Composition data on manganese was extracted from the EFSA FCDB and was subject to a cleaning procedure. As the scope of the intake assessment was to consider natural sources of manganese only, a data cleaning strategy was applied to exclude fortified foods from the composition database (Annex B). This is with the exception of infant and follow‐on formula for which data from the Mintel's GNPD were used for the calculations. Indeed, the minimum content of manganese in these food categories is subject to regulatory requirements to guarantee an adequate supply of the nutrient to the consumers (Regulation (EU) 2016/127 13 and Regulation (EU) 2017/1522 14 ). As a result, a pooled database containing data from nine EU countries was created.
Manganese intake estimates were calculated by matching the food intake data from the Comprehensive Database and the data on manganese content in foods from the EFSA FCDB. The FoodEx2 classification and description system was used to facilitate the linkage between the databases (EFSA, 2015a).
Dietary intakes of manganese in mg/day from natural food sources were calculated at individual level. The resulting intakes per food item were summed up to obtain total daily intakes of manganese for each individual. The mean, P5, median and P95 of intakes were subsequently calculated for each survey by population group and sex, as well as total populations.
The data cleaning procedure and methodology followed for the assessment are described in details in Annex C.
Intake assessment from fortified foods and food supplements
Manganese intake data from recent national food consumption surveys conducted in European countries, including specific estimates of intake from food supplements and/or fortified foods, were extracted and are provided in Annex D.
Information on food products fortified with manganese and manganese‐containing supplements available on the EU market, and their manganese content as reported on the label, were extracted from the Mintel GNPD. These data were used qualitatively to describe the types of fortified foods and food supplements available and to gain insight into their potential contribution to total manganese intake.
2.4. Public consultation
In line with EFSA's policy on openness and transparency, and for EFSA to receive comments from the scientific community and stakeholders, the draft Scientific Opinion was released for public consultation from 29 August 2023 to 10 October 2023. 15 The outcome of the public consultation is described in a technical report published as Annex E to this Scientific Opinion.
3. ASSESSMENT
3.1. Chemistry
Manganese (Mn, CAS number: 7439‐96‐5, atomic mass of 54.9 Da) is a metal which can exist in a number of oxidation states, ranging from −3 to +7, with Mn2+ and Mn3+ being the predominant forms in biological systems. Manganese is found in nature in both inorganic and organic species. The inorganic forms include manganese dioxide (MnO2), which is the most common naturally‐occurring form, manganese dichloride (MnCl2), manganese sulfate (MnSO4), manganese phosphate (MnPO4), manganese tetroxide (Mn3O4) and manganese carbonate (MnCO3). Most manganese salts are readily soluble in water, with only phosphate and carbonate salts having lower solubilities. The manganese oxides are poorly soluble in water. 16 In natural water, manganese is mostly present as soluble Mn2+ species. Depending on the pH and dissolved oxygen content in water, Mn2+ compounds may undergo oxidation, e.g. as a consequence of chlorination and ozonisation (during water treatment) forming insoluble/particulate compounds such as manganese oxides, which can influence the organoleptic properties of water (Health Canada, 2019; WHO, 2021).
Manganese is a component of several metalloenzymes, such as arginase, pyruvate carboxylase and MnSOD (EFSA NDA Panel, 2013).
In the EU, several manganese salts are authorised for addition to foods or use in food supplements (Table 3).
3.2. Absorption, distribution, metabolism and excretion (ADME)
3.2.1. Absorption
Intestinal uptake and transfer of manganese occurs via active transport and passive diffusion in the small intestine, where it is mainly absorbed as Mn2+. The mechanisms of Mn2+ intestinal absorption and efflux from the enterocytes into the portal blood are not completely elucidated (Liu et al., 2021). The divalent metal transporter‐1 (DMT1) at the apical membrane of enterocytes may participate in manganese uptake, as well as other transporters that are not fully characterised. Several transporters, such as SLC40A1 (ferroportin, FPN), have been proposed to be involved in the efflux of manganese from the enterocytes. Mn2+ in portal blood is mostly taken up into the liver via SLC39A14 at the basolateral membrane of hepatocytes (Liu et al., 2021). When manganese is administered orally, it is exposed to a high first‐pass effect in the liver, where it is taken up by the hepatocytes and subsequently actively excreted into the bile, thus resulting in only very small amounts of manganese reaching the systemic circulation. The fraction of absorbed manganese which enters circulation is predominantly associated with carrier proteins such as transferrin, albumin and α2‐macroglobulin (Section 3.2.2).
The absorption of manganese from foods is generally low and considered to be below 10% (EFSA NDA Panel, 2013). The chemical properties of manganese compounds (i.e. form, solubility and oxidation state) can influence the absorption of manganese. In rats, soluble compounds (e.g. MnCl2, Mn2+) were found to be more readily absorbed than insoluble ones (e.g. MnO2, Mn4+) (Roels et al., 1997) and kidney and liver levels were significantly higher in mice fed manganese acetate or MnCO3, compared to MnCl2 or MnO2 (Komura & Sakamoto, 1991). However, data regarding the influence of the chemical form on manganese absorption are limited. In its previous evaluation of the safety of Mn2+ organic salts (i.e. manganese ascorbate, manganese aspartate, manganese bisglycinate and manganese pidolate 17 ), the ANS Panel assumed that these sources would ‘dissociate in the stomach and/or in the gastrointestinal fluids into their constituents, and that bioavailability of manganese from these sources would be at least similar to that from other dissociable sources of manganese’ (EFSA ANS Panel, 2009c). The composition of food matrices can influence the level of manganese absorption, depending on the presence of other dietary compounds, including other minerals (e.g. iron) or phytates (Davidsson et al., 1995). Using radiolabelled 54Mn manganese in adult men and women, average true absorption 18 rates from various foods were estimated to range between 1.7% and 5.2% (Davidsson et al., 1991; Johnson et al., 1991), and 8.9% for MnCl2 dissolved in water (Johnson et al., 1991).
The amount of manganese present in food may also influence manganese absorption. Using 54Mn in humans, Finley (1999) estimated an absorption rate of 4.9% in individuals receiving a ‘low’ manganese diet (0.7 mg/day) compared to 2.3% among those receiving a ‘high’ manganese diet (9.5 mg/day), in women with low iron status (serum ferritin < 5 μg/L). Among women with high iron status (serum ferritin > 50 μg/L), the absorption rate was similar under the respective diets (~ 1%). In a subsequent experiment, average percent manganese absorption was 1.8%–2.6% among women who consumed a ‘high’ manganese diet (20 mg/day) compared to 3.2%–3.7% among women who consumed a ‘low’ manganese diet (0.8 mg/day) (Finley et al., 2003). Upon administration of a multimineral supplement containing 2.5 mg of manganese, 18 mg of iron and 15 mg of zinc, manganese true absorption, measured after 30 weeks of supplementation, was found to be around ~ 1% (Sandström et al., 1990).
The Panel notes that the absorption of dietary manganese is low (< 10%). Although some evidence indicates that the oxidation state and solubility of manganese forms and the presence of some food compounds (e.g. iron, phytates) may affect manganese absorption, data on the influence of these factors on manganese absorption are limited. The Panel also notes that regulation at the level of its intestinal uptake and systemic transfer appear to be part of the homeostatic mechanisms which are involved in maintaining manganese levels in the organism. The regulatory mechanisms, e.g. at the level of manganese transporters involved in the intestinal uptake of manganese, are not yet elucidated.
3.2.2. Distribution and metabolism
Manganese is subject to high first‐pass clearance in the liver, with active excretion into the bile resulting in only a limited fraction of absorbed manganese reaching the systemic circulation under normal physiological conditions (Section 3.2.1). In the systemic circulation, most of the manganese is in the cellular components of blood, with the erythrocytes containing approximately 65%, lymphocytes and platelets 30% (Milne et al., 1990), and only a minor fraction is bound to plasma proteins such as albumin and α2‐macroglobulin (Mn2+) or transferrin (Mn3+) (Liu et al., 2021). Manganese blood concentrations in healthy adults are reported to range from 4 to 15 μg/L, with concentrations reported to be 5–10 times lower in plasma or serum (Forrer et al., 2001; Goullé et al., 2005; Heitland & Köster, 2006). Circulating manganese is generally rapidly cleared through either distribution to other tissues or excretion into the small intestine via hepato‐biliary secretion (Section 3.2.3).
Manganese in plasma is taken up by all tissues. The liver, pancreas, kidneys and tissues with high energy demand (e.g. brain) or high‐pigment content (e.g. retina, dark skin) contain the highest manganese concentrations. Bone represents the largest reservoir of manganese in the body (25%–40% of total body content) (Aschner & Aschner, 2005). Manganese secretion into breast milk was reported to be below 1% of intake in one balance study (Schäfer et al., 2004), although no correlation between maternal dietary intake and human milk Mn concentrations were reported elsewhere (Leotsinidis et al., 2005; Qian et al., 2010; Wünschmann et al., 2003). As summarised by EFSA (EFSA NDA Panel, 2013) mean manganese concentrations in milk vary from 0.8 to 30 μg/L. Miller et al. (1975) reported manganese content in rats' milk fed with normal diet to be 54 μg/L. Overall, the body burden of an adult human is about 10 mg (Lucchini et al., 2022).
Limited data suggest that manganese may undergo changes in its oxidation state in the body. The oxidation state of the manganese ion in several enzymes appears to be Mn3+, while most manganese intake from the environments is either Mn2+ or Mn4+ (Section 3.1). Mn2+ in plasma is presumed to be, in part, oxidised to Mn3+ over time, although the precise ratio of the two species and the mechanisms involved in this conversion are not elucidated (Liu et al., 2021; Roth, 2006).
The mechanism for cellular uptake of manganese has not been identified conclusively, but there is evidence that the uptake of Mn2+ into the cells takes place via cell type‐specific membrane‐bound transport mechanisms. These include high affinity metal transporters, such as DMT1, SLC39A8 (ZIP8) and SLC39A14 (ZIP14) (Liu et al., 2021). Mn3+ is thought to be transported into the cells via transferrin‐dependent mechanisms similar to Fe3+ (Gunter et al., 2013). In cells, manganese is mainly found in the mitochondrial and nuclear fractions (Gunter et al., 2004; Maynard & Cotzias, 1955).
Brain manganese concentrations between 1.1 and 2.9 μg/g have been reported in healthy human (Császma et al., 2003). Under conditions of excess exposure, manganese has been found to accumulate most prominently in the globus pallidus. Deposition of manganese in the brain causes distinct magnetic resonance imaging (MRI) brain appearances, with pronounced hyperintensity of the globus pallidus on T1‐weighted and hypointensity on T2‐weighted images (Li et al., 2014). In primates, brain regions such as frontal cortex have also been found to be affected by deposition of manganese and to exhibit neurodegenerative changes (Guilarte et al., 2006). Two possible routes for manganese to enter the brain from the blood stream are currently being discussed: (1) directly via the blood brain barrier (BBB) and (2) via the brain cerebrospinal fluid (CSF) barrier, followed by translocation to the brain (Schmitt et al., 2011). Several transporters and channels have been proposed to be involved in the uptake of manganese into the brain, including DMT1 and SLC39A8 (ZIP8) for Mn2+ species, transferrin receptor‐mediated process for Mn3+, calcium channels as well as other transporters such as citrate and choline transporters (Lockman et al., 2001; O'Neal & Zheng, 2015). The role of each of these transporters in the regulation of manganese uptake and efflux in brain tissues is still under investigation (Section 3.4.4).
3.2.3. Elimination/excretion
The liver plays a primary role in manganese homeostasis by taking up manganese from portal blood, thereby regulating the amount of manganese that enters the circulation for delivery to other organs (Sections 3.2.1 and 3.2.2), and by regulating excretion of manganese via the hepatobiliary route and elimination via the faeces. Manganese is excreted into the bile via SLC30A10 located at the apical canalicular membrane of hepatocytes. Hepatocyte SLC39A8 at the apical canalicular membrane reclaims manganese from the bile. Manganese in bile is secreted into the small intestine where a small fraction may undergo enterohepatic recirculation, while the rest is eliminated via faeces. Manganese in blood plasma may also be excreted directly by the intestine via SLC39A14 located on the enterocyte basolateral membrane and SLC30A10 located at the enterocyte apical membrane (Liu et al., 2021). Pancreatic excretion of manganese contributes only a small fraction of the absorbed manganese dose (Davis et al., 1993). Urinary excretion of Mn is generally low (normally below 1 μg/L) (Chen et al., 2018; Davis et al., 1993; Horning et al., 2015; Malecki et al., 1996).
Using 54Mn tracer techniques, estimations of average manganese half‐life have ranged between 14 and 48 days (Finley et al., 1994; Finley et al., 2003; Johnson et al., 1991; Sandström et al., 1986) In the study by Finley et al. (2003), where individuals received a ‘low’ (0.8 mg/day) versus ‘high’ (20 mg/day) manganese diet for 4 weeks before ingestion of the tracer dose, average manganese half‐lives were estimated to be about 30 days in the low manganese groups versus 15 days in the high manganese groups. Based on a two‐component exponential model, short (< 2 days) and long (9–27 days) half‐life components were predicted. The long half‐life was shorter when subjects consumed the high (12 days) versus the low Mn diet (22 days). After 60 days, the tracer retention was 0.7%–1% in participants consuming the low manganese diet compared to 0.1%–0.2% in participants consuming the high manganese diets, corresponding to 6–8 μg versus 18–34 μg of total manganese from the test meal retained in the body in the respective groups.
The Panel notes that manganese homeostasis is primarily achieved by biliary excretion. Manganese is removed from the blood by the liver where it is secreted into the bile and is excreted into the intestine and faeces. Biological half‐life in humans is 2–6 weeks. Homeostatic mechanisms appear to regulate manganese body content over a wide range of intakes. In the study by Finley et al. (2003), a 25‐fold increase in manganese intake (0.8–20 mg/day) resulted in a three‐ to four‐fold increase in retention of whole‐body manganese after 60 days. The Panel also notes that, under conditions of excess exposure, manganese can accumulate, in particular in the brain (Section 3.2.2). Available data are insufficient to characterise levels of dietary intake at which manganese excretion mechanisms may be overwhelmed, leading to excess manganese body burden.
3.2.4. Factors affecting ADME
3.2.4.1. Sex
Manganese concentrations in whole blood are generally higher in women than men (Finley et al., 1994). Lower absorption of manganese and longer half‐lives have been observed in men than in women (Finley et al., 1994). It has been suggested that the greater manganese absorption in women may be related to reduced iron stores in women that result in greater iron and likely manganese co‐absorption than in men (Finley et al., 1994) (Section 3.2.5.6). Some sex differences in manganese metabolism have been reported in rat studies (Gruden, 1988; Lee et al., 1990), but data are limited.
The Panel notes that available data regarding sex differences in the ADME of manganese are limited and thus require further investigation.
3.2.4.2. Age
Blood manganese concentrations have been found to be elevated at birth and gradually decrease during infancy and childhood. Hatano et al. (1983) reported three‐ to four‐fold higher erythrocyte manganese concentrations in 1‐month‐old Japanese infants than in adults; the concentration was found to decrease rapidly and was constant from 4 months to 11 years of age. Similarly, high blood manganese concentrations were reported in Japanese newborns (average 56 μg/L), while it gradually decreased over the first year of life and concentrations similar to adults were found in children and adolescents aged 1–18 years (Mizoguchi et al., 2001). A steady decrease in mean manganese serum concentration was reported by (Alarcón et al., 1996) among Venezuelan infants aged 5 days to 12 months. Examining individuals aged 1 month to 75 years in Germany, (Rükgauer et al., 1997) observed an age‐related decrease in serum manganese concentrations up to the age of 18 years.
Animal studies have reported higher manganese retention in early life than in adulthood (Keen et al., 1986; Kostial et al., 1978; Rehnberg et al., 1985) (Section 3.2.6). Although early data from immature rodents had suggested that elimination of manganese undergoes a period of maturation with adult patterns of excretion developing at about the time of weaning, later studies provided evidence that regulatory mechanisms were operating soon after birth (Ballatori et al., 1987; Kostial et al., 2005) (Section 3.2.6). Data in human infants are scarce. In a nutrient balance study in infants, Dörner et al. (1989) reported apparent relative retention of manganese from breast milk of 37% (average breast milk manganese content 6.2 μg/L) and 16%–31% from infant formulae (manganese content 77–99 μg/L). It is notable that manganese intakes of exclusively breastfed or formula‐fed infants are relatively low (some dozens of micrograms per day) until the diet starts being diversified (Section 3.3.3). This is due to the relatively low concentration of manganese in breast milk and infant formula (average breast milk concentrations: 3–30 μg/L (EFSA NDA Panel, 2013); average infant formula concentrations: 46 μg/100 g for powders, 100 μg/L for liquids 19 ) as compared to other foods (Section 3.3.2). Thus, enhanced percentages of manganese absorption and retention in early life as compared to later in life have been suggested to act as compensatory mechanisms for the scarcity of manganese in the diet at a time of high metabolic demand due to growth (Ballatori et al., 1987). Wilson et al. (1992) found no differences in mean plasma manganese concentrations between preterm infants fed maternal milk containing 4.1 μg/L or preterm infant formula containing 303 μg/L, which suggests that homeostatic mechanisms are effective over this range of manganese intake even in preterm infants (Aschner & Aschner, 2005).
In rats a higher uptake of manganese in the brain has been found in pups (aged ~ 1 week), which coincided with the period of peak brain growth, compared to older animals (Kostial et al., 1978; Takeda et al., 1999). These observations have raised concerns about a potential higher susceptibility of infants to accumulate manganese in the brain.
The Panel notes the scarcity of data regarding the maturation processes of manganese homeostatic mechanisms in human infants. Available data are inadequate to determine whether infants have a similar capacity as older age groups to regulate manganese body burden.
3.2.4.3. Pregnancy
Manganese blood concentrations are known to increase throughout pregnancy (Spencer, 1999; Tholin et al., 1995). Maternal blood concentrations of manganese in pregnant women at delivery have been measured to be at least twice as high as in non‐pregnant women, while manganese concentrations in cord blood were two‐ to three‐fold higher than in maternal blood (Oulhote et al., 2014; Yamamoto et al., 2022). This might be due to increased manganese absorption during pregnancy, as has been reported in rats (Kirchgessner et al., 1982), and/or changes in manganese metabolism during pregnancy related to physiological changes occurring during pregnancy as an adaptation to meet the metabolic demands of the developing foetus. Limited data suggest that manganese is transported actively across the placenta (Nandakumaran et al., 2016; Yoon et al., 2011). Several metal transporters including DMT1 are expressed in the placenta and may participate in the transfer. Further studies on placental manganese transfer are needed to elucidate the mechanisms involved and their regulation.
3.2.4.4. Hepatic function
Since liver is the organ responsible for manganese excretion (Section 3.2.3), pathologies affecting liver functions can lead to excess manganese retention. A high incidence of pallidal signal hyperintensity on T1‐weighted MRI has been reported in patients with chronic liver disease, the intensity of which was found to correlate with blood manganese concentrations and the presence of extrapyramidal symptoms (Spahr et al., 1996). A two‐ to seven‐fold increase of manganese in globus pallidus was also measured in autopsied patients with chronic liver disease, together with concomitant loss of dopamine D2 binding sites (Butterworth et al., 1995). Hyperintensity of T1‐weighted MRI signals was also detected in the globus pallidus of patients with acquired hepatocerebral degeneration secondary to impaired biliary excretion (Devenyi et al., 1994; Ikeda et al., 2000) or portosystemic shunts (Listik et al., 2012). Liver transplantation was found to normalise blood manganese concentrations and MRI signals in these patients.
The Panel notes that patients with liver diseases, especially cholestatic liver diseases, may be particularly susceptible to manganese‐induced neurotoxicity due to impaired manganese elimination/excretion.
3.2.4.5. Genetics
Mechanistic assays in cell culture and SLC30A10 or SLC39A14 knockout mice have provided evidence that SLC30A10 and SLC39A14 are critical transporters that mediate manganese excretion and play a protective role against manganese toxicity (Gurol et al., 2022) (Section 3.2.3).
Homozygous mutation in the SLC30A10 gene was reported in 2012 as the first hereditary disorder of manganese metabolism. It is characterised by hypermanganesemia, manganese accumulation in the liver and brain, dystonia, polycythemia and chronic liver disease (Quadri et al., 2012). The majority of patients present with dystonia during early childhood.
A few years later, a homozygous mutation in the SLC39A14 gene was described, which is characterised by progressive dystonia with variable parkinsonism and other neurological signs with onset during infancy or early childhood. It differs from SLC30A10 deficiency by absence of liver involvement and polycythaemia (Tuschl et al., 2016).
Both inherited Mn transporter defects are associated with MRI brain appearances with hyperintensity on T1‐weighted images of the globus pallidus and striatum, and the white matter of the cerebrum and cerebellum, midbrain, dorsal pons and medulla (Anagianni & Tuschl, 2019) To date, a few dozens of patients have been reported (Anagianni & Tuschl, 2019).
Mutations in other transporter proteins such as DMT‐1 and FPN have also been described that may affect manganese homeostasis; however, blood manganese concentrations remain unaffected and there is no evidence of manganese deposition (Anagianni & Tuschl, 2019).
The Panel notes that rare inherited disorders of manganese transport, involving SLC30A10 and SLC39A14 transporters, have been identified in the last decade, which are characterised by increased manganese body burden and neurological symptoms, with typical onset during early childhood.
3.2.4.6. Interaction with iron intake and status
Some evidence suggests that iron and manganese share common absorption and transport mechanisms, including transporters such as DMT‐1 and FPN (Bjørklund et al., 2020; Fitsanakis et al., 2010; Liu et al., 2020).
Early experiments in rats reported a decrease in iron absorption in animals exposed to high amounts of manganese through the diet (33 g MnCl2/kg diet) or intestinal perfusion (10 mmol/L MnCl2); no effect was found when the content of the diet was in the physiological range (up to 50 mg manganese/kg diet) or with perfusate concentration up to 5 mmol/L (Diez‐Ewald et al., 1968; Thomson et al., 1971). In a controlled human experiment using iron isotopes, Rossander‐Hultén et al. (1991) found that the addition of 7.5 mg or 15 mg manganese reduced the absorption of a dose of 3 mg nonheme iron by up to 40% in human subjects, suggesting direct competitive inhibition of manganese on iron absorption. In other human studies, manganese intake was not found to affect serum ferritin concentrations at a dietary intake of 20 mg/day for 56 days (Finley et al., 2003) or a supplemental dose of 15 mg/day for 125 days in addition to the background diet (Davis & Greger, 1992). Iron balance was not affected by manganese dietary intake of 20 mg/day for 56 days (Finley et al., 2003) or 9.5 mg manganese per day for 60 days (data not shown) (Finley, 1999). In these studies, the participants were maintained on their normal diet (Davis & Greger, 1992) or given a controlled diet supplying nutritionally adequate amounts of iron and other nutrients (Finley et al., 2003).
Conversely, elevated intestinal absorption of manganese has been described in iron‐depleted rats (Davis et al., 1992; Davis et al., 1993; Diez‐Ewald et al., 1968; Rodríguez‐Matas et al., 1998). Upon intravenous injection of 54Mn, Diez‐Ewald et al. (1968) observed a faster rate of manganese excretion in iron‐depleted rats compared to control rats or iron‐loaded rats, with similar manganese retention towards the end of the observation period between the iron‐depleted and control rats (~ 10% of the test dose after 65 days). Rodríguez‐Matas et al. (1998) found that the greater absorption of manganese was not reflected in the concentration of the mineral in the organs (i.e. liver, spleen, femur and sternum) after 40 days on an iron‐free diet containing 50.3 mg manganese/kg. In humans, intestinal absorption of manganese was found to be increased in individuals with iron deficiency (Mena et al., 1969; Sandström et al., 1986; Thomson et al., 1971). On the other hand, upon administration of an oral dose of 54Mn to individuals with iron deficiency versus normal iron stores, Thomson et al. (1971) found no difference in the average retention of manganese in the body. In a later study investigating the effect of iron status on manganese absorption and retention using 54Mn, Finley (1999) found a higher manganese absorption in women with low ferritin concentrations (< 15 μg/L) compared to those with high ferritin concentrations (> 50 μg/L), i.e. 2.3% versus 1.03% respectively after 60 days of consuming a diet supplying 9.5 mg manganese per day. Mean manganese half‐life was 13.0 days versus 11.8 days and mean manganese retention was 0.07% versus 0.03% in the respective groups.
It has been suggested that iron status could also influence cellular uptake and toxicity of manganese, especially in brain tissues (Roth & Garrick, 2003). In rats, (Erikson et al., 2002) have reported elevated manganese concentrations in the brain of iron deficient animals. There is little information about the manganese content in the brain of iron deficient humans. In a preliminary clinical study with a small sample size, elevated blood manganese concentrations were found in iron deficient patients compared to controls but measures of MRI signal intensity in the globus pallidus provided no evidence of elevated manganese concentration (Kim et al., 2005).
Overall, the Panel notes that there is evidence for manganese–iron interactions with regards to their absorption and distribution. Although manganese may compete with iron for intestinal absorption, data are lacking to characterise levels of chronic manganese intake which might affect iron status. There is no indication of an adverse effect of manganese intake on iron status at the manganese doses that were tested (i.e. 9.5–20 mg/day) in the limited studies available. The Panel also notes that there are indications that individuals with low to deficient iron status might have higher manganese absorption. Although it has been proposed that such individuals may accumulate greater amounts of manganese, particularly in the brain, thereby being more susceptible to manganese toxicity, human data confirming this hypothesis are currently lacking.
3.2.5. Manganese toxicokinetics in animal models
As in humans, regulation of biliary excretion of manganese acts as a critical homeostatic mechanism in rodents (Davis et al., 1993; Malecki et al., 1996; Miller et al., 1975; Papavasiliou et al., 1966) and other mammals (Klaassen, 1974), with SLC30A10 and SLC39A14 transporters in liver playing central roles in excretory processes (Liu et al., 2021). Regulation at the level of intestinal absorption is also likely, although the regulatory mechanisms remain to be elucidated (Liu et al., 2021; Scheiber et al., 2019). Using oral administration of tracer dose (54MnCl2), Davis et al. (1993) reported a manganese true absorption 20 of ~ 8% in young, growing rats fed a 45 mg of manganese/kg diet (mean endogenous faecal losses: ~ 3% of intake).
With habitual manganese intake levels, Kostial et al. (1978); Kostial et al. (1989) estimated whole body retentions of 40%–67% in suckling rats, compared to ~ 1%–6% in weaned juvenile rats and 0.2% in adult rats, 6 days after oral dosing of 54MnCl2. Immature homeostatic mechanisms in early life have been proposed to cause the higher retention rate observed in pups compared to older animals (Miller et al., 1975; Nordberg et al., 1978). Later studies indicate that excretory mechanisms are functional before the age of weaning (Ballatori et al., 1987; Kostial et al., 2005). Ballatori et al. (1987) observed a rapid increase in the rate of manganese excretion concurring with the transition from a maternal milk, low in manganese, to a diversified diet, with a two–three orders of magnitude higher content of manganese. Similar findings have been reported in mice (Miller et al., 1975). Thus, the higher relative retention of manganese in neonatal rats may be explained by the low content of this essential element in maternal milk relative to neonatal requirements (Ballatori et al., 1987).
In rats, Kostial et al. (2005) reported efficient placental and mammary transfer of manganese: after maternal exposure to ~ 270 mg manganese/kg bw per day administered during gestation and/or 480 mg manganese/kg bw per day during lactation, total body burdens in neonates and pups were found to be six to eight times higher than in controls, irrespective of the period and duration of exposure. When dams were treated with 360 and 482 mg manganese/kg bw per day during the gestation and lactation periods, manganese concentrations in the brain of rat pups were found to be elevated by about 2.5‐fold compared to controls (Oshiro et al., 2022; Pappas et al., 1997). The concentration of manganese in rodents' milk is low (~ 0.1–0.3 mg/L), even upon manganese overexposure of the dams (mean concentration 0.4 mg/L upon administration of ~ 320 mg manganese/kg bw per day throughout lactation) (Rehnberg et al., 1982). It is notable that similar increases in the brain of rat pups were found upon direct exposure via micropipette to substantially lower doses of manganese, e.g. two to three‐fold increases in whole brain concentrations upon exposure to 25 mg manganese/kg bw per day in the studies by (Kern et al., 2010) and (Beaudin et al., 2013; Beaudin, Strupp, Strawderman, & Smith, 2017).
Oral high dose exposure to manganese compounds leads to dose‐related increases in manganese concentrations in tissues such as the liver, kidneys, brain, testes and bones (Foster et al., 2018; O'Neal et al., 2014; Rehnberg et al., 1980). Upon prolonged exposure starting at birth, several folds increases have been observed during the first weeks of life, while the magnitude of increase became smaller later in life. For instance, Rehnberg et al. (1982) found that the manganese concentrations in, respectively, the brain and liver of rats, receiving about 320 mg manganese/kg bw per day (as Mn3O4) starting at birth, were elevated by 5.4 and 8.1‐fold compared to controls at post‐natal day (PND) 24, while the differences were 1.7 and 1.4‐fold at PND 60 and 1.2 and 1.4‐fold at PND 224. Similarly, in rats exposed to 50 mg manganese/kg bw per day (as MnCl2), brain concentrations were increased by three‐fold in comparison to control animals at PND 24 and by 1.2‐fold at PND 66 and beyond (Beaudin et al., 2013; Beaudin, Strupp, Strawderman, & Smith, 2017; Conley et al., 2020). Upon administration of 50 mg manganese/kg bw per day (as MnCl2) to adult rats by oral gavage 5 days per week for up to 10 weeks, O'Neal et al. (2014) reported a substantial increase in manganese concentration in the CSF (up to 10‐fold by 6–8 weeks) and a gradual increase in bone manganese concentrations (up to 2–3.2‐fold by 10 weeks); transient increases in manganese concentrations of plasma and muscle (peak after 2 and 4 weeks) were also observed. At doses of 76 and 153 mg manganese/kg bw per day administered to adult animals, Torrente et al. (2005) found ~two to three‐fold higher concentrations in the brain of treated rats versus controls after 19 weeks of exposure.
Whole body half‐life between 68 and 146 days were estimated in adult mice, rats, dogs and monkeys, after intravenous administration of 54Mn (Furchner et al., 1966). Upon cessation of manganese administration, initial manganese accumulation in brain tended to return to baseline levels after some weeks (Beaudin et al., 2013; Beaudin, Strupp, Strawderman, & Smith, 2017; Conley et al., 2020; Kern & Smith, 2011; Moreno et al., 2009; Reichel et al., 2006; Tran, Chowanadisai, Lönnerdal, et al., 2002; Vezér et al., 2007). Estimates of manganese half‐life in different brain regions ranged between 51 and 74 days in rats after intravenous injection (Takeda et al., 1994) and around 53 days in macaque monkeys after subcutaneous injection (Newland et al., 1987).
Foster et al. (2015) investigated the equivalence of gavage, dietary and drinking water exposure of manganese in rats. Adult male rats were allocated to a control diet (10 mg manganese/kg diet), high manganese diet (200 mg/kg diet), manganese supplemented drinking water and manganese gavage treatment groups for 61 days. In the latter two groups, the diet was supplemented with manganese chloride (MnCl2) in drinking water or once‐daily by gavage to provide a daily manganese intake equivalent to that seen in the high manganese diet group. The average intake of manganese was estimated to be 0.48, 11.1, 11.1 and 11.2 mg/kg bw per day, for the control, high manganese diet, drinking water and gavage exposure groups, respectively. Samples of bile and blood, as well as striatum, olfactory bulb, frontal cortex, cerebellum, liver, spleen and femur were analysed at the end of the study period (day 61). Liver and bile manganese concentrations were elevated in all treatment groups relative to controls. Bile manganese concentrations were 34.5 μg/g in the high manganese diet group, 38.6 μg/g in the drinking water group and 67.4 μg/g in the gavage group, compared to 1.48 μg/g in the control group. There were little differences between the diet and drinking water‐exposed groups and the control group regarding the striatum, frontal cortex and cerebellum manganese contents. In contrast, the highest increases in tissue manganese concentrations were observed in the group exposed to manganese via gavage, with significantly increased manganese concentrations found in the cerebellum, olfactory bulb, striatum, frontal cortex, femur and liver in the animals exposed through this route compared to controls. These results suggest that the dose rate (i.e. bolus vs. gradual intake) may be an important factor in the pharmacokinetics of orally ingested manganese.
The Panel notes that data indicate that neonatal and pre‐weaning animals have relatively higher retention of manganese in targeted organs (e.g. brain) than adult animals. There are also data to indicate that, upon prolonged overexposure to manganese, increases in manganese concentration in targeted organs will usually diminish over time. Also, the method of administration impacts manganese accumulation in targeted organs, i.e. administration by gavage was found to result in higher retention than administration via drinking water/feed.
3.2.6. Biomarkers of intake
As a result of the efficient homeostatic control of manganese body content, the association between external and internal exposure indicators at the individual level is weak (Lucchini et al., 2022). Normal concentrations of manganese in blood show a wide range (4–15 μg/L; Section 3.2.2), with relatively higher concentrations found among women versus men (Section 3.2.4.1), during infancy versus later in life (Section 3.2.4.2), and among pregnant women versus non‐pregnant women (Section 3.2.4.3). Normal urine concentrations are below 1 μg manganese/L (Section 3.2.3). The relatively short biological half‐life of manganese in urine (< 30 h) suggests that it may reflect rather recent exposure. Blood manganese concentration has been shown to be a useful indicator of exposure on a group basis in the context of occupational exposure (i.e. to distinguish exposed vs. unexposed workers); however, the individual measurements of blood manganese do not correspond to individual external exposure levels (Lucchini et al., 2022; Zheng et al., 2011). Blood/serum/plasma manganese levels become relevant in cases of very high exposure, in which case they may be useful to identify individuals with excess manganese intake (Section 3.4.1.7). Faecal manganese levels are also potentially useful biomarkers of recent dietary intake, since this is the main route of manganese excretion, but the limitation is that it is not possible to differentiate between unabsorbed manganese and that arising from hepato‐biliary excretion.
The manganese level in hair has been explored as a marker of exposure over a longer period, but it is affected by hair characteristics as well as external exposure to manganese (via dust or water). In general, manganese levels in hair do not correlate with manganese blood concentrations. Under controlled conditions, no correlation was found between internal manganese exposure and hair manganese concentrations in rodents (Balachandran et al., 2021).
MnSOD activity has been proposed as a marker of manganese exposure. In a trial involving 47 healthy women, changes in MnSOD activity in lymphocytes was measured over a 124‐days period upon supplementation with 15 mg/day manganese (with or without 60 mg/iron per day) or placebo (Davis & Greger, 1992). The average background intake of manganese during the intervention was estimated to be 1400–1800 μg/day. Manganese supplementation resulted in an increase in lymphocyte MnSOD activity (+0.7 U/mg protein and + 0.45 U/mg protein in the group receiving manganese alone or manganese in combination with iron, respectively). Serum manganese concentrations gradually increased in the manganese supplemented groups over the intervention period, reaching +2.7 μg/L at the end of the intervention. The biological relevance of these changes is unclear. MnSOD activity lacks specificity, as it can be affected by a variety of factors that induce oxidative stress, and is more likely to be useful to assess manganese insufficient intakes (Greger, 1998).
MRI is a promising biomarker as the images associated with manganese toxicity are relatively specific. MRI has been used to support a diagnosis of manganese neurotoxicity in welders, individuals receiving total parenteral nutrition and patients with hepatobiliary insufficiency (Kim et al., 2007; Sadek et al., 2003; Santos et al., 2014; Stewart et al., 2005) and has been useful in identifying manganese excess exposure as the potential cause of neurotoxicity in individual cases (Section 3.4.1.7). Bilateral symmetrical T1 hyperintensities in the globus pallidus of the basal ganglia are typical of manganese deposition. As manganese in the brain has a longer half‐life than in blood, pallidal signal intensity is likely to reflect the cumulative dose better than does blood manganese level (Lucchini et al., 2022). However, due to impracticality of its use in large studies, there is a lack of data on the relationship of this marker and dietary exposure to manganese.
Other biomarkers such as manganese in saliva, deciduous teeth, nails or the Mn/Fe ratio in plasma or erythrocytes are being explored, but they lack sufficient validation to date (Lucchini et al., 2022).
The Panel notes that several potential biomarkers of manganese exposure have been investigated, mostly in the context of occupational and environmental exposures. As manganese is actively controlled by homeostatic mechanisms, the associations between manganese concentrations in biological fluids and manganese exposure are typically weak at the individual level. Blood manganese concentrations may however be useful in suspected cases of overexposure, as they are found to be elevated in individuals exposed to excess manganese. Signal intensities in T1‐weighted MRI, because of their specificity, are a promising biomarker of manganese cumulative exposure. It has been mostly explored in the context of occupational exposure and further research is needed to assess its utility in the context of dietary risk assessment.
3.3. Intake assessment
This section provides harmonised intake estimates of manganese naturally present in foods (i.e., from the background diet) across European countries. These estimates were calculated using the EFSA Comprehensive food consumption and the EFSA food composition databases, following extensive data cleaning to exclude fortified foods (Section 2.3.2). Data available to EFSA in such databases were insufficient to provide harmonised intake estimates of manganese from fortified food and/or food supplements, thus data collected from national food consumption surveys (Section 2.2.1) are presented instead.
3.3.1. Sources of dietary manganese.
Manganese is naturally present in a wide variety of plant‐based products (Annex C). High concentrations (up to 5000 μg/100 g) are found in nuts, tea leaves, legumes, grains and some fruits such as pineapples, banana and berries, while lower concentrations (< 400 μg/100 g) are found in most fruits and vegetables. Milk products, meat (except offals), fish and eggs have a relatively low content of manganese (< 100 μg/100 g). Whole grains contain more manganese than polished grains as most of it is in the bran. A cup of tea (200 mL) may contain 300–1000 μg manganese (Hope et al., 2006). Other herbal infusions, such as maté and hibiscus infusions, also contain substantial amounts of manganese (> 500 μg/100 mL).
Manganese in water is predominantly present as soluble Mn2+ species (Section 3.1). As per Directive (EU) 2020/2184, 21 the parametric value for the manganese content of drinking water is 50 μg/L in the EU. In 2021, the WHO established a provisional HBGV of 80 μg/L for drinking water (WHO, 2021).
Fortified foods
Currently, in the EU, Mn carbonate, Mn chloride, Mn citrate, Mn gluconate, Mn glycerophosphate and Mn sulfate are authorised for addition to foods 22 and foods for specific groups 23 (Section 3.1). EU regulations set minimum and maximum content of manganese in infant and follow‐on formulae, 24 and maximum content of manganese in processed cereal‐based foods and baby foods for infants and children. 25
In the Mintel GNPD (from November 2017 to November 2022), a total of 1488 packaged food products available in 24 EU Member States and Norway were identified as containing added manganese in the ingredients list. Only 17% (n = 249) of the products had available data on content per serving. Among these, the Mintel categories with most products captured were ‘baby foods’, which include baby formulae and growing up milks (n = 675, median = 0.011 mg/100 g), baby cereals (n = 9, median = 1.17 mg/100 g) and baby yogurts or desserts (n = 5, median = 0.02 mg/100 g) and ‘nutritional drinks and other beverages’ in powder form (n = 120, median = 0.7 mg/serving) and reconstituted form (n = 52, median = 0.5 mg/serving). The highest manganese content declared in the label was found in eight meal replacement drinks in powder form (3–3.6 mg/serving), and five soups in powder form (3 mg/serving), under the category ‘nutritional drinks and other beverages’. In addition, 125 cereal or energy bars, mostly intended for use as meal replacements or weight control, were retrieved from the database. From these, data on the content per serving was only available for 30 products (median = 0.6 mg/serving).
Food supplements
In the EU, Mn carbonate, Mn chloride, Mn citrate, Mn gluconate, Mn glycerophosphate and Mn sulfate, Mn ascorbate, Mn L‐aspartate, Mn bisglycinate and Mn pidolate are authorised for use in food supplements 26 (Section 3.1).
A search in the Mintel GNPD (from November 2017 to November 2022) yielded a total of 693 products available in the ‘vitamins and dietary supplements’ category across 24 EU Member States and Norway. The median dose per serving 27 (as recommended by the manufacturer) declared on labels was 1.7 mg. About 74% of supplements contained 0.5–2 mg manganese per serving, and about 7% had doses > 3 mg per serving, with a maximum of 8 mg per serving (Figure 1).
FIGURE 1.

Distribution of manganese content in food supplements as displayed on labels in 24 EU Member States and Norway (mg/serving). Source: Mintel GNPD. Search for manganese‐containing supplements available in the EU market in the last 5 years (from November 2017 to November 2022). A total of 693 products available in 24 EU Member States and Norway were identified with complete data on mg/serving.
3.3.2. EFSA's intake assessment of manganese background intake
Background manganese intakes from natural food sources in European populations were calculated based on the data from the latest version of the EFSA Comprehensive Database and the EFSA FCDB (Annex C).
3.3.2.1. Estimated intakes across countries and age groups
The intake estimates are presented below by age group, sex and country of origin (Figures 2, 3 and 4). A summary overview, providing the ranges of means and 95th percentiles (P95) across EU surveys is given in Table 4.
FIGURE 2.

Mean, median, 5th and 95th percentiles of background manganese intakes in infants (≥ 4 to < 12 months), toddlers (≥ 1 year to < 3 years), young children (≥ 3 years to < 7 years), older children (≥ 7 years to < 10 years), intakes in young adolescents (≥ 10 to < 14 years) and older adolescents (≥ 14 to < 18 years), by sex and country. AT, Austria; BE, Belgium; BG, Bulgaria; CY, Cyprus; CZ, Czech Republic, DE, Germany; DK, Denmark; EE, Estonia; EL, Greece; ES, Spain; FI, Finland; FR, France; HU, Hungary; IT, Italy; LV, Latvia; NL, The Netherlands; PT, Portugal; RO, Romania; SE, Sweden; SI, Slovenia. Estimates for females are shown in orange and for males in blue. Squares correspond to medians and stars to means. Lines represent the range between the 5th and 95th percentiles. Estimated intakes from 5th and 95th percentiles are not presented when sample size is below 60 participants.
FIGURE 3.

Mean, median, 5th and 95th percentiles of background manganese intakes in adults (≥ 18 years to < 65 years old) and older adults (≥ 65 years), by sex and country. AT, Austria; BE, Belgium; CY, Cyprus; CZ, Czech Republic; DE, Germany; DK, Denmark; EE, Estonia; EL, Greece; ES, Spain; FI, Finland; FR, France; HR, Croatia; HU, Hungary; IE, Ireland; IT, Italy; LV, Latvia; NL, The Netherlands; PT, Portugal; RO, Romania; SE, Sweden; SI, Slovenia. Estimates for females are shown in orange and for males in blue. Squares correspond to medians and stars to means. Lines represent the range between the 5th and 95th percentiles. Estimated intakes from 5th and 95th percentiles are not presented when sample size is below 60 participants.
FIGURE 4.
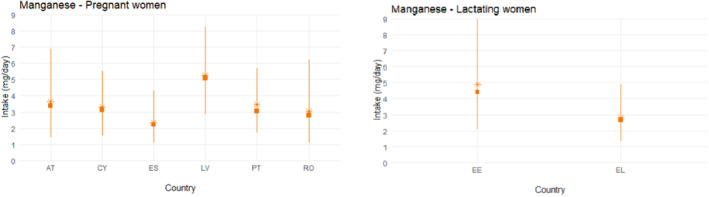
Mean, median, 5th and 95th percentiles of manganese intakes in pregnant women and lactating women by country. AT, Austria; CY, Cyprus; EE, Estonia; EL, Greece; ES, Spain; LV, Latvia; PT, Portugal; RO, Romania. Squares correspond to medians and stars to means. Lines represent the range between the 5th and 95th percentiles. Estimated intakes from 5th and 95th percentiles are not presented when sample size is below 60 participants.
TABLE 4.
Background manganese intake from food sources (supplements and fortified foods excluded) across European dietary surveys, by population group (mg/day).
| Population group, age range | N of surveys | Males | Females | ||||||
|---|---|---|---|---|---|---|---|---|---|
| Mean | P95 a | Mean | P95 a | ||||||
| Min. b | Max. b | Min. b | Max. b | Min. b | Max. b | Min. b | Max. b | ||
| Infants, ≥ 4 to < 12 mo | 12 | 0.59 | 1.51 | 1.26 | 2.92 | 0.60 | 1.42 | 1.41 | 2.78 |
| Toddlers, ≥ 1 to < 3 y | 15 | 1.47 | 2.68 | 2.47 | 4.52 | 1.28 | 2.41 | 1.91 | 4.66 |
| Young children, ≥ 3 to < 7 y | 20 | 1.95 | 4.13 | 3.14 | 5.98 | 1.90 | 3.62 | 3.17 | 5.68 |
| Older children, ≥ 7 to < 10 y | 15 | 2.52 | 4.06 | 4.65 | 6.88 | 2.26 | 3.62 | 3.30 | 6.15 |
| Young adolescents, ≥ 10 to < 14 y | 20 | 2.49 | 4.18 | 4.71 | 7.52 | 2.25 | 3.79 | 4.22 | 6.40 |
| Older adolescents, ≥ 14 to < 18 y | 19 | 3.04 | 4.99 | 5.01 | 7.87 | 2.37 | 3.81 | 4.51 | 7.20 |
| Adults, ≥ 18 to < 65 y | 22 | 2.60 | 5.25 | 4.81 | 9.87 | 2.20 | 4.69 | 3.94 | 8.48 |
| Older adults, ≥ 65 y | 23 | 2.41 | 5.57 | 4.06 | 9.28 | 2.20 | 5.25 | 4.13 | 8.93 |
| Pregnant women | 6 | – | – | – | – | 2.36 | 5.27 | 4.31 | 8.27 |
| Lactating women | 2 | – | – | – | – | 2.83 | 4.89 | 4.92 | 8.97 |
| Vegetarians c | 1 | 6.07 | 6.07 | 11.30 | 11.30 | 5.05 | 5.05 | 9.22 | 9.22 |
Abbreviations: mo, months; n, number; P, percentile; y, years.
The 95th percentile estimates obtained from dietary surveys and population groups with fewer than 60 subjects may not be statistically robust (EFSA, 2011) and are not considered in this table.
Minimum and maximum mean and 95th percentile estimates across European surveys, for each population group.
Age range (12–70 years).
EFSA's manganese intake estimates are generally in line with national estimates which reported on the intake from the background diet (i.e. excluding food supplements and fortified foods). Although some national estimates included both natural sources of manganese and fortified foods, the latter most probably have a negligible contribution to the total dietary intake of manganese (Section 3.3.2). Differences between EFSA's and national intake estimates may be due to the use of specific country FCDBs in most national intake assessments (as opposed to the pooled average manganese content across countries used in the EFSA estimates), the use of different methodologies to estimate habitual intakes (e.g. statistical models), as well as the use of slightly different age categories. It should be noted that data from only a few countries (i.e. 5 or less depending on the population group considered) were available for the same or similar age range to compare with the EFSA assessment.
3.3.2.2. Main food contributors
The main food groups contributing to background manganese intake were grains and grain‐based products (mainly bread and similar products and breakfast cereals), tea beverages and fruits (with highest contribution from banana) in all age groups, except for infants and toddlers, where instead of the tea beverages foods for the young populations (mostly cereal‐based products) were important contributors (Annex C).
In the one dietary survey on vegetarians from Romania, grain and grain‐based products remain the main contributor to total manganese intake, followed by legumes (especially pulses) (Annex C).
3.3.2.3. Sources of uncertainties
Sources of uncertainty and their potential impact on the intake estimates, where possible, are identified and further discussed in Annex B.
For this opinion, food composition data from nine European countries were pooled considering a common EU food market. Although this approach may mask country‐specific differences in the manganese concentration of different foods it allowed for a larger number of composition values to be considered for each food category, leading to a more robust database. However, most of the data (40%) was coming from one country (Germany), which adds some uncertainty regarding the representativeness of the manganese food composition data for the EU market.
As the scope of intake assessment was to consider natural food sources of manganese only, a data cleaning strategy was applied to exclude fortified foods from the composition database. Since fortification was not always clearly reported, assumptions had to be made to exclude suspected fortified foods. However, few foods appeared to be fortified with manganese on the EU market between 2017 and 2022 (Section 3.3.1), thus the impact of this uncertainty is expected to be negligible.
Tea beverages are one of the main contributors to the average manganese dietary intakes. The manganese content of tea infusions can vary substantially due to parameters such as the variability of manganese content in tea leaves (e.g. due to the use of fertilisers) or the manganese content of the water, as well as due to individual habits such as the duration of infusion or the quantity of tea leaves soaked in the drink (Başgel & Erdemoğlu, 2006; Długaszek & Kaszczuk, 2020; Samolińska et al., 2017). An average concentration of 284 μg/100 g of tea infusion was used in this assessment, which could lead to over‐ or underestimation of individual estimates, depending on the conditions described above. Also, there is high variability in manganese concentrations of other non‐tea herbal infusions (e.g. values from 5 μg/100 g in lime blossoms infusion to 908 μg/100 g in hibiscus infusion have been reported). A literature search was conducted to assign composition values that were representative of the specific infusion, to the extent possible (Annex C). However, assumptions had to be made regarding consumption occasions of unspecified herbal and other non‐tea infusions, or for those plants for which insufficient data were available in the literature, which could lead to over‐ or underestimation of the actual contribution of those beverages. For instance, an average concentration of 140 μg/100 g was assigned to fruit infusions, which takes into account that hibiscus is a common ingredient of these beverages.
For certain foods for which the amount consumed was reported in the national food consumption data in dry form before reconstitution (e.g. infant and follow‐on formula powder, dry porridges), the contribution of the water added for the preparation of the product might not always be considered, however in most of the cases water is reported as a separate record. It is acknowledged that the relative contribution of water to the overall content of these foods could be significant (e.g. the mineral water used for the preparation of infant formula could contribute about one third of the total manganese content 28 ). However, the overall impact on the intakes estimates is expected to be marginal, given that these food categories are small contributors to overall manganese intake of infants (1%–6%, Annex C), due to the limited numbers of exclusively formula‐fed infants in the surveys.
3.3.3. Data on fortified foods and food supplements
Data on manganese intake from fortified foods and food supplements in nationally representative consumption surveys and TDS were collected. Survey characteristics, mean and P95 intake estimates are presented in Annex D. Key information is summarised in the following paragraphs.
3.3.3.1. Intake from foods and fortified foods
There is no mandatory manganese fortification policy among EU countries and voluntary fortification practices have not been reported by European authorities contacted {EC, unpublished #582}.
Intake estimates from national surveys
Manganese intake has been estimated in seven national surveys conducted in seven countries: Austria (Österreichischer Ernährungsbericht 2017), Denmark (DANSDA 2011–2013), France (INCA 3, 2014–2015), Germany (NVS II, 2005–2007), Hungary (OHAT/NTP, 2019), Lithuania (Food consumption and nutrient intake study in Lithuania, 2019–2020) and Slovenia (National representative study on the dietary habits of Slovenian adolescents' 2003–2005). None of the survey reports distinguished between manganese intake from natural sources and intake resulting from manganese added to foods (i.e. fortified foods). The survey characteristics, intake estimates and bibliographic references are provided in Annex D.
The highest P95 intakes (P95 reported only in three countries) in males were found in the Danish national survey (all children 5.8 mg/day; adolescents 7.5 mg/day; adults 8.3 mg/day; elderly 8.3 mg/day). Estimated intakes for females were generally lower than for males in all surveys and age groups.
Intake estimates from total diet studies
Data from the Czech (Státní zdravotní ústav, 2021), French (ANSES, 2011), Italian (F. Cubadda, unpublished data) and German Total Diet Studies (TDS) (Sachse et al., 2019) were collected. None of the TDS used in this assessment distinguished between manganese intake from natural sources and intake resulting from manganese added to foods (i.e. fortified foods).
The highest estimated intakes of manganese for all age groups in the two countries where the TDS have been carried out are reported in the Italian TDS. At the P95, intake is up to 2.8 mg/day in toddlers, up to 3.9 mg/day in all children, up to 5.1 mg/day in all adolescents and all adults. Higher estimated intakes are found in the male population across all the age groups and countries evaluated.
The German TDS provided a P95 estimate for the general population (14 to 80 years, not including vegetarians or supplement users) of 83.2 μg per kg of body weight per day (upper bound approach 29 ). Assuming a body weight of 70 kg as basis for this population (EFSA NDA Panel, 2022), these values result in a calculated average intake of 5.8 mg/day.
3.3.3.2. Intake from food supplements
There are no nutritional guidelines or recommendations at national level in the EU advising supplementation with manganese.
Information on manganese supplementation was available from six surveys conducted in four countries (Denmark, Germany, Ireland and Poland). Data on manganese supplement use and contribution of supplements to the total manganese intake is described below. Survey characteristics and intake estimates are presented in Annex D.
The mean percent contribution of manganese‐containing supplements to total manganese intake in supplement users ranged from 1.9% to 10.6% across all age ranges. An exception was Denmark, where the contribution of supplements ranged between 16% and 26% of total manganese intake, with higher contributions in females than in males (all ages). Absolute intakes of manganese from food supplements in adults were available only from the national surveys in Germany and Poland and mean intakes ranged between 1.3 and 2.2 mg/day (Table 5).
TABLE 5.
Percent manganese supplement users in EU surveys and manganese intake from food supplements among users.
| Country Survey name (N subjects) Reference | Dietary method (N of days) | Sex | Age range | % Mn supplement users in total survey sample/among users | Mn intake from supplements P95 (mg/day) | % Contribution of supplements to total Mn intake in users, mean or median |
|---|---|---|---|---|---|---|
|
Denmark DANSDA 2011–2013 (n = 3936) (Hindborg, 2015, unpublished) |
NR |
m + f m f m f m f |
4–10 y 11–17 y 11–17 y 18–50 y 18–50 y 51–75 y 51–75 y |
60 a /NA 47 a /NA 43 a /NA 42 a /NA 49 a /NA 37 a /NA 54 a /NA |
NR |
22 b 20 b 26 b 16 b 20 b 20 b 24 b |
|
Ireland NPNS 2011–2012 (n = 500) (Kehoe & Walton, 2022) |
Weighted food records (4‐d) | m + f | 1–4 y | 3.0/14.0 | 3.8 | 5.3 c |
|
Ireland NCFS II 2017–2018 (n = 600) (Kehoe & Walton, 2022) |
Weighted food records (4‐d) | m + f | 5–12 y | 3.9/17.9 | 0.5 | 1.9 c |
|
Ireland NTFS II 2019–2020 (n = 428) (Kehoe & Walton, 2022) |
Weighted food records (4‐d) | m + f | 13–18 y | 4.5/31.9 | 2.0 | 8.4 c |
|
Germany NVS II 2005–2007 (n = 13,753) (Heuer et al., 2012) |
24‐h recall (2 d) |
m f |
15–80 y |
3.0/NR 4.0/NR |
2.0 2.0 |
10.5 c 10.6 c |
|
Poland National Dietary Survey 2019–2020 (n = 1831) (Stos et al., 2021) |
24‐h recall (2 d) + FPQ |
m f |
18–65+ y |
NR NR |
Mean ± SD 2.2 ± 0.9 1.3 ± 0.6 |
– |
Abbreviations: DANSDA, The Danish National Survey of Diet and Physical Activity; d, days; FPQ, food propensity questionnaire; h, hour; N, number; NA, not applicable; NCFS II, National Children's Food Survey II; NPNS, National Pre‐School Nutrition Survey; NTFS II, National Teen's Food Consumption Survey II; NVS II, Nationale Verzehrsstudie II; NR, not reported in the publication; y, years.
% users of multivitamin/mineral supplements. By default, multivitamin/mineral supplements were considered to contain manganese based on Danish households purchases data.
Median %.
Mean %.
Absolute manganese intakes from all sources among supplement users were reported in two surveys in two countries (Germany and the Netherlands) and are provided in Annex D.
3.3.4. Data on specific population groups
3.3.4.1. Vegetarians and vegans
Plant‐based foods are the main contributors to manganese intake (Section 3.3.2.2). Available evidence suggests that vegetarians have 1.5 to 2.4‐fold higher intakes of manganese compared with those following omnivorous diets (Donovan & Gibson, 1996; Haddad et al., 1999; Hunt et al., 1998). A study in Canada compared nutrient intakes of female adolescents following omnivorous, semi‐vegetarians (SV) and lacto‐ovo‐vegetarian (LOV) diets, using 3‐day weighed food records. The authors reported that LOV had higher mean intakes of manganese (4.1 ± 1.8 mg/day) than SV (3.2 ± 1.9 mg/day) and the omnivorous groups (2.8 ± 1.2 mg/day) (Donovan & Gibson, 1996). Another study followed 21 women (mean age 33 years; range: 20–42 years) consuming controlled LOV and non‐vegetarian diets during a period of 8 weeks. The mineral content of the diets was analysed, and the LOV diet was reported to provide more than twice the amount of manganese, 6 mg/day compared to 2.5 mg/day for the omnivorous diet (Hunt et al., 1998). Finally, a study in American adults, aged 20 to 60 years old, assessed dietary intakes using 4‐day dietary records of vegans (i.e. individuals excluding meat, fish, poultry, dairy products and eggs from their diets) and ‘non‐vegetarians’ (i.e. omnivores). Estimated intakes from foods only in women were 4.1 ± 2.5 mg/day in the vegan group compared with 2.3 ± 1.3 mg/day in the non‐vegetarian group. In men intakes were 5.6 ± 2.0 mg/day and 2.8 ± 1.6 mg/day for the vegan and non‐vegetarian groups, respectively (Haddad et al., 1999).
In line with these findings, slightly higher intakes were also reported among vegetarians (14–80 years old) in the German TDS performed in 2014–2015 (Sachse et al., 2019). Assuming a body weight of 70 kg, and using the upper bound approach, 30 median intake estimates in vegetarians were 3.3 mg/day (P95 = 7.5 mg/day), compared to 2.9 mg/day (P95 = 5.8 mg/day) in non‐vegetarians. Results for vegetarians stratified by sex are presented in Table 6.
TABLE 6.
Manganese intake among vegetarians in the German TDS (Sachse et al., 2019).
| Manganese intake (mg/day) | ||||
|---|---|---|---|---|
| Males | Females | |||
| Median | P95 | Median | P95 | |
| Vegetarians (14–80 y) ‐ lower bound a | 3.5 | 9.9 | 2.9 | 6.3 |
| Vegetarians (14–80 y) ‐ upper bound b | 3.8 | 10.3 | 3.3 | 6.6 |
Abbreviations: TDS, total diet study; y, years.
Lower bound: Non‐detects were replaced by zero.
Upper bound: Non‐detects were replaced by the corresponding Limit of Quantification.
3.3.4.2. Tea drinkers
Tea and other herbal infusions, such as maté and hibiscus infusions, contain substantial amounts of manganese (Section 3.3.1). Thus, high consumers of these beverages may have high manganese intake. Hope et al. (2006) compared the total dietary manganese intake between 24 black tea drinkers (consuming ≥ 1 L tea/day; mean age 45.6 ± 12.0 years) and 28 non‐tea drinkers (mean age 38.5 ± 13.2 years), using a 111‐food item FFQ. Manganese concentration in black tea infusions was estimated by the authors to be 0.51 mg Mn/100 mL. Additionally, a value of 0.14 mg/100 g from the UK food composition database was used in a parallel analysis. Mean manganese intakes were significantly greater in tea drinkers (5.5 mg/day [range 2–12 mg/day] or 10 mg/day [range 5–20 mg/day], according to the value used for Mn levels), than in non‐tea drinkers (3.2 mg/day [range 0.5–6.5 mg/day]).
3.3.5. Overall conclusions on intake data
The Panel notes that the P95 estimated background intake of manganese from natural food sources (i.e. without fortified foods and food supplements) is up to 2.92 mg/day in infants (4 to < 12 months), up to 4.66 mg/day in toddlers (1 to < 3 years), up to 5.98 mg/day in young children (3 to < 7 years), up to 6.88 mg/day in older children (7 to < 10 years), up to 7.52 mg/day in young adolescents (10 to < 14 years), up to 7.87 mg/day in older adolescents (14 to < 18 years), up to 9.87 mg/day in adults (≥ 18 years), up to 8.27 mg/day in pregnant women and up to 8.97 mg/day in lactating women across surveys included in EFSA's intake assessment (Table 4) (Annex C). Intakes are slightly lower in females, mainly due to smaller quantities of food consumed per day.
The Panel notes that the main contributors to manganese intake from the background diet are grain‐based products, tea and other manganese‐rich beverages (e.g. hibiscus, maté infusions), and that specific subgroups of the population, such as high consumers of tea and other manganese‐rich beverages, or vegans and vegetarians, may have a habitual intake of manganese in the higher range of the intake distribution of the general population.
In the EU market, manganese may be added to foods voluntarily. The Mintel GNPD database suggests that most foods fortified with manganese found in the EU market are infant and follow‐on formulae and meal replacement drinks, with very similar within‐group content of manganese.
Manganese is also used in food supplements. A search in the Mintel GNDP database indicates some variability in the dose per serving across food supplements, with most values between 1.1 and 2 mg of manganese per serving (see Figure 1), and about 7% of products with values > 3 mg (maximum 8 mg) per serving.
The Panel notes that estimates of the contribution of fortified foods and food supplements to manganese intake in EU populations are scarce.
3.4. Hazard identification
3.4.1. Human data
In the occupational setting (e.g. mining, welding), inhalation of air contaminated with manganese has been found to cause neurotoxic effects. Manganese neurotoxicity has been described as manganism: a neurological disorder that shares some similarities with idiopathic Parkinson's disease, including neuropsychological abnormalities and motor symptoms such as impaired motor skills, tremors, facial muscle spasms and difficulty walking (Balachandran et al., 2020; Guilarte & Gonzales, 2015).
The following sections review the available evidence from the pertinent studies retrieved through the systematic literature search on the relationship between the dietary intake of manganese and neurological effects in humans. Studies are grouped by lines of evidence, according to the type of endpoints and populations investigated.
3.4.1.1. Cognitive impairment in children
Regarding impairment of cognitive function in children, studies addressing functional measures of cognitive function and IQ scores are included in the standalone main LoE. Studies addressing academic achievement are included in a complementary LoE.
An overview of the eligible studies retrieved is provided in Table 7.
TABLE 7.
Outcome of the systematic search on dietary exposure to manganese and cognitive impairment in children.
| LoE | Endpoints | RCTs | PCs/NCCs | CS |
|---|---|---|---|---|
| LoE1. Standalone (main) | Functional measures of cognitive function and IQ scores | 0 | 2 | 8 |
| LoE2. Complementary | Measures of academic achievement | 0 | 0 | 1 |
Abbreviations: CS, cross‐sectional; LoE, line of evidence; NCC, nested‐case control; PC, prospective cohort; RCT, randomised controlled trial.
LoE1 (standalone): functional measures of cognitive function and IQ scores
Preliminary UA
Ten publications from five independent studies in children reported on the relationship between manganese exposure through drinking water and cognitive function. Two were prospective analyses (Dion et al., 2018; Rahman et al., 2017) and eight were cross‐sectional analyses (Wasserman et al., 2004; Wasserman et al., 2006; Wasserman et al., 2011). All studies used the manganese concentration in drinking water as a measure of exposure. Three papers also estimated manganese intake from drinking water (Bouchard et al., 2011; Bouchard et al., 2018) and one paper further investigated manganese intake from food sources (Bouchard et al., 2011). The study populations were in Canada, Brazil and Bangladesh. Eight publications reported associations with intelligence quotient (IQ) scores (Bouchard et al., 2011; Bouchard et al., 2018; Dion et al., 2018; Nascimento et al., 2015; Rahman et al., 2017;Wasserman et al., 2004; Wasserman et al., 2006; Wasserman et al., 2011), and two publications associations with various cognitive domains using specific tests (Nascimento et al., 2016; Oulhote et al., 2014). The evidence table is provided in Appendix C.
The studies are described below in increasing order of manganese concentrations in water observed for the study populations.
Studies in Brazil
In cross‐sectional analyses in Brazil among children (6–12 years of age) from a rural area and an urban area, the association between manganese concentrations in tap water and measures of cognitive function was investigated using the Raven's Coloured Progressive Matrices (RCPM) test (n = 59) (Nascimento et al., 2015) and the Brazilian Child Brief Neuropsychological Assessment Battery (NEUPSILIN‐Inf) (n = 63) (Nascimento et al., 2016). Mean (range) manganese concentrations in water, sampled in each household, were 0.020 (0.00003–0.280) mg/L in the rural area and 0.001 (0.001–0.002) mg/L in the urban area (Nascimento et al., 2015). Higher concentrations of iron were also found in the water samples from the rural areas versus urban areas. A negative correlation was reported between the manganese concentration in water and RCPM scores (r = − 0.317; p = 0.014) (Nascimento et al., 2015). The result was judged at high risk of bias (tier 3), due to the lack of information regarding the validation of the RCPM test for Brazilian children and the lack of adjustment for potential confounders (Appendix B.1). After adjustment for confounders, Nascimento et al. (2016) reported that higher manganese concentration in water was associated with lower language scores (β = −0.390, p = 0.002), written language score (β = −0.361, p = 0.007) and performance on a go/no go task (a test of executive function) (β = −0.547, p = 0.001). Associations with other endpoints (i.e. visual attention, visual perception, working memory, phonological awareness) were not observed. The study was judged at moderate risk of bias (tier 2) (Appendix B.1).
Studies in Canada
Two cross‐sectional analyses involved a sample of children (6–13 years of age) in Canada. The associations between manganese intake through drinking water and IQ scores and measures of cognitive functions were investigated (Bouchard et al., 2011). Water consumption from different sources (i.e. bottled, tap, tap filtered with a pitcher and tap with an attached filter) was estimated. The median (5th–95th percentiles) tap water manganese concentration, measured in each household, was 0.031 (0.0005–0.255) mg/L (arithmetic mean: 0.098 mg/L; geometric mean: 0.020 mg/L). The median (5th–95th percentiles) estimated manganese intake from water consumption was 0.008 (0–0.286) mg/kg bw per month.
Bouchard et al. (2011) reported findings on IQ scores, measured by the Wechsler Abbreviated Scale Of Intelligence (WASI) (n = 362). After adjustment for potential confounders, 10‐fold increases in manganese concentration in water and estimated manganese intake from water consumption were associated with a decrease of −2.4 full‐scale IQ points (95% CI –3.9, −0.9) and − 1.2 full‐scale IQ points (95% CI –2.3, −0.1), respectively. A decrease in mean full‐scale IQ scores was observed across quintiles of manganese concentration in water (−6.2 points lower IQ score in the 5th quintile [median 0.216 mg/L] vs. the 1st quintile [median 0.001 mg/L]), while no consistent pattern was observed across quintiles of estimated manganese intake from water consumption. In sex‐stratified analyses, a higher decrease was found for girls (β = −3.2 [95% CI –5.0, −1.5]) than for boys (β = −2.3 [95% CI –4.8, 0.2]). Stronger associations were found with performance IQ than with verbal IQ. The dietary intake of manganese from foods was also estimated using an FFQ. Median (5th–95th percentiles) of estimated manganese intakes from dietary sources was 2.335 (0.840–13.159) mg/kg bw per month. The authors reported that estimated dietary manganese intake was not associated with IQ scores (data not shown). The study was judged at low risk of bias (tier 1) (Appendix B.1).
Oulhote et al. (2014) used the California Verbal Learning test and the digit span test to construct a memory score and the Conners' continuous performance test to construct an attention score (n = 375). After adjustment for potential confounders, 10‐fold increases in estimated manganese intake from water consumption and water manganese concentration were associated with a decrease of −0.4 (95% CI: −0.9, 0.1) and − 1 (95% CI: −1.6, −0.4) points on the memory score, respectively. Association estimates were similar for boys and girls (data not shown). Using generalised additive models, evidence for departure from linearity was found for the relationships with estimated manganese intake from water and manganese concentration in water. For the latter a steeper decrease in memory score was reported at levels > 100 μg/L. No association was found between any of the exposure variables and the measures of attention. Associations with dietary intake estimates were not reported. The study was judged at low risk of bias (tier 1) (Appendix B.1).
In a prospective analysis of the same population, new samples of home tap water were collected during a follow‐up examination after an average of 4.4 years and IQ scores were re‐evaluated (n = 287) (Dion et al., 2018). Associations between IQ scores and manganese concentration in water at baseline and a time‐averaged manganese concentration (i.e. based on the manganese concentrations measured at baseline and follow‐up, accounting for changes to water supply in‐between analyses), were investigated. At follow‐up examination, manganese concentration in tap water ranged from 0.0002 to 0.961 mg/L (arithmetic mean, 0.058 μg/L; geometric mean, 0.015 μg/L). No association was found between time‐averaged manganese concentration and IQ scores when both sexes were analysed together. Stratified analyses by sex were conducted. After adjustment for potential confounders, a 10‐fold increase in time‐averaged manganese concentration was associated with a decrease in full IQ score (−2.5 [95% CI –4.5, −0.7]) in girls. The results were similar when baseline manganese concentration in water was used. In boys, no associations with time‐averaged manganese concentration were found; a 10‐fold increase in baseline manganese concentration in water was associated with an increase in IQ scores. Lower performance IQ scores were observed in girls across quintiles of time‐averaged manganese concentration, while the pattern was opposite among boys. Verbal IQ scores were not associated with manganese exposure in either sex. The study was judged at low risk of bias (tier 1) (Appendix B.1).
In a separate cross‐sectional study in Canada, Bouchard et al. (2018) investigated the association between exposure to manganese intake from drinking water and IQ scores in a population of 259 children consuming well water (6–14 years of age). Manganese intake from water consumption was estimated based on manganese concentrations in water measured in each household and in school's water fountains. Children's IQ was measured using the Wechsler Intelligence Scale For Children, 4th Edition (WISC‐IV). The median manganese concentration in home water was 0.005 mg/L; and 4.3% of samples contained > 0.400 mg/L (arithmetic mean: 0.062 mg/L; geometric mean: 0.006 mg/L). Manganese concentrations in water from school's water fountains were below 0.060 mg/L in all schools except one in which it was 0.532 mg/L. The estimated manganese intakes were not reported. No associations between estimates of manganese intake from water consumption or water manganese concentration and IQ scores were found when both sexes were analysed together. In sex‐stratified analyses, no consistent pattern was found when analysing the association between manganese intake from water or manganese concentration in water and IQ scores. Regarding full IQ scores, the associations were −1.29 (95% CI –3.21, 0.63) with estimated manganese intake and 0.09 (95% CI –2.00, 2.18) with manganese concentration in water in girls and −6.75 (95% CI –17.22, 3.72) and 1.10 (95% CI –0.97, 3.16) for the respective measures of exposure in boys. The study was judged at low risk of bias (tier 1) (Appendix B.1).
Studies in Bangladesh
In a study by Rahman et al. (2017), 1607 children born within the Maternal and Infant Nutrition Interventions in Matlab (MINIMat) trial in Bangladesh were invited for a follow‐up examination at 10 years of age, during which children's IQ was measured with tests from the WISC‐IV (n = 1265 included in the analysis). Drinking water was sampled during pregnancy and at 5 and 10 years of age from the wells used by each household. The median (range) manganese concentrations in water were 0.204 mg/L (0.0013–6.550 mg/L) during pregnancy, 0.228 mg/L (0.0001–6.550 mg/L) at 5 years and 0.339 mg/L (0.0001–8.680 mg/L) at 10 years. Positive associations were found between water manganese concentrations measured at the various timepoints and IQ score and its sub‐dimensions, which were largely attenuated after adjustment for potential confounders). In sex‐specific analysis among children with low arsenic content in water (< 20 μg/L), the adjusted associations of water manganese concentrations, measured during pregnancy or at 5 or 10 years of age, with the different cognitive measures, were generally inverse among boys. For girls, a linear spline regression analysis with prenatal manganese concentration in water indicated that, below 3000 μg/L, increasing manganese concentration in water was associated with increasing cognitive scores. Above 3000 μg/L (n = 27), these associations tended to be in the opposite direction (e.g. −5.4 [95% CI –13, 2.0] for full‐scale IQ). Considering manganese concentration in water measured at 5 and 10 years of age, no evidence for non‐linearity was found and the associations with cognitive measures tended to be positive. The study was judged at low risk of bias (tier 1) (Appendix B.1).
In cross‐sectional analyses, Wasserman et al. investigated associations between manganese concentrations in water and measures of cognition among several samples of offspring of participants of the Health Effects of Arsenic Longitudinal Study (HEALS) in Bangladesh (Wasserman et al., 2004; Wasserman et al., 2006; Wasserman et al., 2011). Cognitive function was assessed using a sub‐set of tests from the WISC, 3rd Edition (WISC‐III), adapted to Bangladeshi children. Water arsenic and manganese concentrations of tube wells at each child's home were measured.
In a sample of 201 children (10‐year old), no association was found between manganese concentration in water and IQ scores after adjustment for water arsenic concentration (Wasserman et al., 2004). The mean (SD) manganese concentration in water was 1.386 (0.927) mg/L. The study was judged at low risk of bias (tier 1) (Appendix B.1).
In a later analysis of the same sample, restricted to a subgroup of 142 children consuming drinking water with arsenic concentrations below 0.010 mg/L, a negative association between manganese concentration in water and full IQ score [−4.35, p < 0.001; −3.76 for performance IQ (p = 0.001) and − 0.63 for verbal IQ (p = 0.05)] was found (Wasserman et al., 2006). Mean (range) manganese concentration in water was 793 (4–3908) μg/L. Adjustment for water arsenic concentration did not affect the associations. Differences between children in the top category of manganese concentration in water (> 1 mg/L, n = 28) versus bottom category (< 0.2 mg/L, n = 38) were −21.28 for the full IQ score (p < 0.0001; −18.43 for performance IQ [p = 0.0001] and–3.19 for verbal IQ [p = 0.02]). The study was judged at low risk of bias (tier 1) (Appendix B.1).
In a subsequent analysis, different sample of 299 children (8–11 years old) was recruited and stratified according to water concentrations of arsenic (above and below 0.010 mg/L) and manganese (above and below 0.5 mg/L). The authors reported that neither manganese nor arsenic concentrations in water were found to be associated with IQ scores (data not shown) (Wasserman et al., 2011). Mean (SD) manganese concentration in water was 0.725 (0.730) mg/L. The study was judged at low risk of bias (tier 1) (Appendix B.1).
Conclusions
Overall, the Panel notes that evidence on an association between manganese exposure through drinking water (mostly assessed as manganese water concentration) and measures of cognitive functions is inconsistent.
The cross‐sectional studies among Brazilian children reported inconsistent associations between water manganese concentration and various measures of cognitive function (Nascimento et al., 2015). The Panel notes the relatively low water manganese concentration compared to the other studies. Dietary intake of manganese from food sources was not estimated in any of these studies.
In the studies conducted in a population of children in Quebec, an increase in manganese intake from water consumption and in water manganese concentration were associated with a decrease in IQ scores and measures of memory in cross‐sectional analyses, with stronger associations observed in girls than in boys (Bouchard et al., 2011). In a prospective analysis of the same population (Dion et al., 2018), no association with IQ score was found when both sexes were analysed together; an increase in water manganese concentration was associated with a decrease in IQ score in girls, while the opposite pattern was observed in boys. In another population of children in Canada (Bouchard et al., 2018), no evidence for a positive association between manganese exposure from water and an impairment of IQ score was found when both sexes were analysed together; the evidence from sex‐stratified analyses was inconclusive. The distributions of water manganese concentrations observed in the respective studies, and related estimated manganese intakes from water, were comparable. The Panel notes the low contribution of drinking water to total dietary intake of manganese relative to food sources in these studies.
Among the studies conducted in Bangladesh, which reported the highest manganese concentrations in water among the eligible studies, one study found no evidence that higher water manganese concentration measured at several timepoints (cross‐sectional and prospective analyses) was associated with lower IQ scores (Rahman et al., 2017). Results were inconsistent across several cross‐sectional analyses involving children selected through the HEALS cohort, after controlling for concomitant contamination with arsenic (Wasserman et al., 2004; Wasserman et al., 2006; Wasserman et al., 2011). Dietary intake of manganese from food sources was not estimated in these studies.
The available BoE has several limitations, including the partial characterisation of manganese dietary exposure (limited to measures of manganese concentration in tap water used at home in most studies), the small size of the study populations (in particular in the ‘high’ dose range), and the cross‐sectional design of most studies. The Panel also notes the inconsistent findings in sex‐specific analyses across studies.
Overall, the Panel considers that the available BoE is inconclusive. No comprehensive UA is performed.
LoE2 (complementary): measures of academic achievement
In a cross‐sectional study among 840 children from Bangladesh (8–11 years old), (Khan et al., 2012) examined the associations between manganese and arsenic concentrations in drinking water and academic achievement in languages and mathematics (annual scores obtained from school records). Median (range) water manganese concentration, measured in well water samples from each participant's household, was 1.302 mg/L (0.010–5.710 mg/L). After adjustment for sociodemographic confounders and water arsenic concentration, a decrease in math test scores was observed among children consuming water with manganese concentrations in the four ‘high’ exposure categories compared to the bottom category (≤ 0.400 mg/L); the adjusted decreases in scores were −7.1 (0.401–1.000 mg/L), −6.4 (1.001–1.440 mg/L), −5.5 (1.441–2.000 μg/L) and −5.9 (2.001–6.000 mg/L). When water manganese concentration was dichotomised (below 0.400 or above 0.400 mg/L), a decrease of −6.4 (95% CI–12.3, −0.5) in mathematics achievement test score was observed. No association was found with languages scores. The study was judged at moderate risk of bias (tier 2), due to concerns regarding the risk of residual confounding (Appendix B.1).
The Panel notes that the available evidence is scarce and cannot be used as supportive evidence for a positive relationship between dietary intake of manganese and impaired cognitive function.
Overall conclusions on cognitive impairment
The Panel considers that the available BoE is insufficient to conclude on a relationship between high dietary intake of manganese (from water and/or other sources) and impaired cognitive function in children over the range of exposures investigated in these studies. The Panel notes that the available studies mostly address manganese water concentration and that studies investigating the relationship between total dietary intake of manganese and this outcome are lacking.
3.4.1.2. Impairment of motor function in children
Regarding impairment of motor function in children, studies addressing functional measures of motor function are included in the standalone main LoE.
An overview of the eligible studies retrieved is provided in Table 8.
TABLE 8.
Outcome of the systematic search on dietary exposure to manganese and impairment of motor function in children.
| LoE | Endpoints | RCTs | PCs/NCCs | CS |
|---|---|---|---|---|
| LoE1. Standalone (main) | Functional measures of motor function | 0 | 0 | 3 a |
Abbreviations: CS, cross‐sectional; LoE, line of evidence; NCC, nested‐case control; PC, prospective cohort; RCT, randomised controlled trial.
Two cross‐sectional studies reported in three publications.
LoE1 (standalone): measures of motor function
Preliminary UA
Two cross‐sectional studies investigated the association between manganese from drinking water and measures of motor function. The evidence table is provided in Appendix C.
In the previously described study by Oulhote et al. (2014) (Section 3.4.1.1), a cross‐sectional analysis investigated the association between manganese exposure from drinking water and motor function performance among Canadian children (n = 375). A motor function score was derived from children's performance on the Santa Ana Pegboard test and the Fingertapping test. Estimated manganese intake from water ranged from 0 to 1.059 mg/kg bw per month (geometric mean 0.0055 mg/kg bw per month). Manganese concentration in water ranged from 0.001 to 2.701 mg/L (arithmetic mean 0.099 mg/L; geometric mean 0.020 mg/L). After adjustment for confounders, a 10‐fold increase in estimated manganese intake from water consumption was associated with a decrease in motor function score, −1.3 ([95% CI]: −2.4, −0.2). Similar results were found when using water manganese concentration as measure of exposure. Association estimates were similar for boys and girls (data not shown). Using generalised additive models to assess the dose–response relationship with manganese concentration in water, evidence for non‐linearity was found, indicating that scores decreased more steeply at concentrations above 0.180 mg/L. No evidence for departure from linearity was found for the relationship with estimated manganese intake from water. The study was judged at low risk of bias (tier 1) (Appendix B.1). The Panel notes the low contribution of drinking water to total dietary intake of manganese relative to food sources in these studies. In a subsample of this study, MRI examination was performed in 13 children consuming water with a manganese concentration below 0.030 mg/L and 10 children consuming water with a manganese concentration above 0.100 mg/L (Dion et al., 2016). No between‐group differences in standard pallidal index 31 was found, while lower pericranial pallidal index 32 was reported in the ‘high exposure’ group versus ‘low exposure’ group. These results were judged at moderate risk of bias (tier 2) (Appendix B.1), due to concerns regarding confounding.
In a cross‐sectional study among offspring of participants of the HEALS in Bangladesh, Parvez et al. (2011) investigated the association between manganese concentrations in water with motor function, using the Bruininks‐Oseretsky test (2nd edition, BOT‐2). Children (8–11 years) were recruited and grouped based on their home well‐water manganese and arsenic concentrations. In the two groups exposed to low arsenic concentration (< 10 μg/L), the mean (± SD) manganese concentrations were 1.111 (± 0.686) mg/L in the ‘high’ exposure group (n = 74) and 0.202 (± 0.145) mg/L in the ‘low’ exposure group (n = 77). No difference between the two groups was found on motor function scores. The study was judged at moderate risk of bias (tier 2) (Appendix B.1), due to lack of adjustment for potential confounders.
The Panel notes the paucity of data from observational studies that would allow the evaluation of an association between ‘high’ manganese intake and impaired motor function in children. No comprehensive uncertainty analysis (UA) is performed.
Overall conclusions on motor function
The Panel considers that the available BoE is insufficient to conclude on a relationship between high dietary intake of manganese (from water and/or other sources) and impaired motor function in children over the range of exposures investigated in these studies. The Panel notes that the available studies address manganese water concentration and that studies investigating the relationship between total dietary intake of manganese and this outcome are lacking.
3.4.1.3. Impairment of behaviour in children
Regarding impairment of behaviour in children, studies investigating measures of behaviour using standard behaviour scales are included in the standalone main LoE (Table 9).
TABLE 9.
Outcome of the systematic search on dietary exposure to manganese and impairment of behaviour in children.
| LoE | Endpoints | RCTs | PCs/NCCs | CS |
|---|---|---|---|---|
| LoE1. Standalone (main) | Measures of behaviour | 0 | 2 | 2 |
Abbreviations: CS, cross‐sectional; LoE, line of evidence; NCC, nested‐case control; PC, prospective cohort; RCT, randomised controlled trial.
LoE1 (standalone): measures of behaviour
Preliminary UA
Four papers examined the association between manganese intake and behavioural problems in children. Two were prospective analyses (Miyake et al., 2022) and two were cross‐sectional analyses (Rahman et al., 2017). Three studies used manganese concentration in drinking water as a measure of exposure (Oulhote et al., 2014) and one study assessed manganese intake from the diet (Miyake et al., 2022). The evidence table is provided in Appendix C.
In a cohort of 1199 Japanese mother–child pairs, Miyake et al. (2021) examined the association between dietary manganese intake during pregnancy, with offspring behavioural problems at 5 years of age, using the strengths and difficulties questionnaire (SDQ). Mean (IQR) maternal dietary manganese intake, estimated by semi‐quantitative comprehensive diet history questionnaire, was 3.6 (2.8–4.5) mg/day. After adjustments, no association was found between maternal intake of manganese and childhood behavioural problems (i.e. emotional problems, conduct, hyperactivity, peer problems and low prosocial behaviour). The study was judged at low risk of bias (tier 1) (Appendix B.1). The Panel notes that the dietary manganese intake in the study population is comparable to observed dietary intakes in European populations.
In the previously described study by Rahman et al. (2017) (Section 3.4.1.1), the association between water manganese concentrations and behavioural problems was examined in 1265 Bangladeshi children. Drinking water was sampled during pregnancy and at 5 and 10 years of age from the wells used by each household and behavioural problems were assessed using the SDQ at 10 years of age. The median (range) manganese concentration in water were 0.204 mg/L (0.0013–6.550 mg/L) during pregnancy, 0.228 mg/L (0.0001–6.550 mg/L) at 5 years and 0.339 mg/L (0.0001–8.680 mg/L) at 10 years. Higher water manganese concentrations at all timepoints were associated with increased conduct problems and lower prosocial behaviour, while they were associated with lower emotional problems; no association was found regarding hyperactivity or peer problems. In sex‐stratified analyses restricted to children using water with < 20 μg/L arsenic, a stronger association between manganese concentrations in water and increased conduct problems was found among boys than among girls (prenatal water manganese concentration: OR 1.43; 95% CI 1.06, 1.91 among boys, 1.18; 95% CI 0.95, 1.46) among girls). Among girls, increased manganese concentrations in water were associated with lower prosocial behaviour (prenatal water manganese concentration: OR 1.48; 95% CI 1.07, 2.06). In contrast, higher manganese concentrations in water were associated with decreased emotional problems especially in boys (prenatal water manganese concentration: OR 0.39; 95% CI 0.19, 0.82). The study was judged at low risk of bias (tier 1) (Appendix B.1).
In the previously described study by Oulhote et al. (2014) (Section 3.4.1.1), a cross‐sectional analysis investigated the association between manganese exposure from drinking water and hyperactivity among Canadian children (n = 375). Hyperactivity was assessed using the Conners' Rating Scales completed by a teacher (CRS‐T) and a parent (CRS‐P). Estimated manganese intake from water ranged from 0 to 1.059 mg/kg bw per month (geometric mean 0.0055 mg/kg bw per month). Manganese concentrations in water ranged from 0.001 to 2.701 mg/L (arithmetic mean 0.099 mg/L; geometric mean 0.020 mg/L). No association was found between manganese intake from water consumption or manganese concentration in water and hyperactivity. The study was judged at low risk of bias (tier 1) (Appendix B.1). The Panel notes the low contribution of drinking water to total dietary intake of manganese relative to food sources in this study.
In a cross‐sectional analysis among offspring of participants of the HEALS in Bangladesh, Khan et al. (2011) investigated the association between manganese concentration in water and classroom behaviour, using the child behaviour checklist‐teacher's report form. A total of 201 children (8–11 years) were included. Home well‐water manganese concentration was 0.889 ± 0.784 mg/L (range: 0.040–3.442 mg/L). An increase in manganese concentrations in water was associated with more problematic classroom behaviours after adjustment for confounders, including water arsenic concentration (β [CI 95%] for total behavioural score: 3.35 [0.86, 5.83]). Compared with the lowest quartile (Q1, 0–264 μg/L), estimated βs for Q2 (265–641 μg/L), Q3 (642–1279 μg/L) and Q4 (≥ 1280 μg/L) were 4.20 (95% CI 0.43, 7.97), 6.42 (95% CI 0.80, 12.06) and 6.80 (95% CI 1.42, 12.19), respectively. The study was judged at low risk of bias (tier 1) (Appendix B.1).
The Panel notes the paucity of data from observational studies that would allow the evaluation of an association between ‘high’ manganese intake and impaired behaviour in children. No comprehensive UA is performed.
Overall conclusions on behaviour impairment
The Panel considers that the available BoE is insufficient to conclude on a relationship between high dietary intake of manganese (from water and/or other sources) and impaired behaviour in children over the range of exposures investigated in these studies. The Panel notes that the available studies mostly address manganese water concentration and that studies investigating the relationship between total dietary intake of manganese and this outcome are lacking.
3.4.1.4. Impaired neurodevelopment in young children
Regarding impaired neurodevelopment in young children (1–3 years), studies with measures of neurodevelopment using standard neurodevelopment test batteries are included in a standalone main LoE.
An overview of the eligible studies retrieved is provided in Table 10.
TABLE 10.
Outcome of the systematic search on dietary exposure to manganese and impairment of neurodevelopment in young children.
| LoE | Endpoints | RCTs | PCs/NCCs | CS | Ecological |
|---|---|---|---|---|---|
| LoE1. Standalone (main) | Measures of neurodevelopment | 0 | 0 | 1 | 1 |
Abbreviations: CS, cross‐sectional; LoE, line of evidence; NCC, nested‐case control; PC, prospective cohort; RCT, randomised controlled trial.
LoE1 (standalone): measures of neurodevelopment
Preliminary UA
In a prospective birth cohort study, the association between manganese concentration in water, analysed in the first trimester of pregnancy and offspring neurodevelopment at 20–40 months of age, was investigated in two areas of Bangladesh (Pabna [n = 285] and Sirajdikhan [n = 239]) (Rodrigues et al., 2016). Bayley Scales Of Infant And Toddler Development, 3rd Edition (BSID‐III) were used. Water was collected from the tube well used by each household. Median (IQR) water manganese concentration was 0.515 (0.299, 0.969) mg/L in Pabna and 0.948 (0.164, 1.820) mg/L in Sirajdikhan. After adjustment for potential confounders, including water arsenic concentration and blood lead concentration, a positive association was found between manganese concentration in water and fine motor scores in Pabna (β2Ln water manganese −0.08 [0.03]), but not in Sirajdikhan. No association was found with cognitive scores, receptive and expressive language, or gross motor domains in both areas. The study was judged at moderate risk of bias (tier 2), due to the lack of adjustment for potential key confounders and attrition (35% of the initial sample excluded from analyses) (Appendix B.1).
An ecological study in the US examined the association between manganese concentrations in water in wells with prevalence of adverse neurodevelopmental effects (speech/language disorders and delayed milestones) among children up to 35 months of age from counties in North Carolina (Langley et al., 2015). Manganese concentrations in private wells were measured in each county (n = 73,220). Children with a ‘developmental speech or language disorder’, ‘delayed milestones’ or ‘sensorineural hearing loss’ were included in this analysis (based on the International Classification of Disease, 9th edition). A proportion of 7.9% of wells had manganese concentrations ≥ 0.200 mg/L and 5.2% were ≥ 0.300 mg/L. The authors reported positive associations between manganese concentrations in water and delayed milestones (RR [95% CI]: 1.48 [1.20, 1.84]) and hearing loss (RR [95% CI]: 1.15 [1.03, 1.30]). No association was found with speech/language problems. Ecological observations, because of their nature, are considered at high risk of bias.
The Panel notes the paucity of data from observational studies that would allow the evaluation of an association between ‘high’ manganese intake and impaired behaviour in children. No comprehensive UA is performed.
Overall conclusions on impaired neurodevelopment
The Panel considers that the available BoE is insufficient to conclude on a relationship between high dietary intake of manganese (from water and/or other sources) and impaired neurodevelopment in young children over the range of exposures investigated in these studies. The Panel notes that the available studies address manganese water concentration and that studies investigating the relationship between total dietary intake of manganese and this outcome are lacking.
3.4.1.5. Risk of attention‐deficit hyperactivity disorder (ADHD)
Regarding risk of attention‐deficit hyperactivity disorder (ADHD), studies investigating the incidence of ADHD are included in a standalone main LoE.
An overview of the eligible studies retrieved is provided in Table 11.
TABLE 11.
Outcome of the systematic search on dietary exposure to manganese and impairment of neurodevelopment in young children.
| LoE | Endpoints | RCTs | PCs/NCCs | CS | Ecological |
|---|---|---|---|---|---|
| LoE1. Standalone (main) | Incidence of ADHD | 0 | 1 | 0 | 0 |
Abbreviations: ADHD, attention‐deficit/hyperactivity disorder; CS, cross‐sectional; LoE, line of evidence; NCC, nested‐case control; PC, prospective cohort; RCT, randomised controlled trial.
LoE1 (standalone): risk of ADHD
Preliminary UA
A nationwide population‐based cohort study in Denmark investigated the association between manganese concentrations in drinking water during childhood and later risk of ADHD (Schullehner et al., 2020). A total of 643,401 children were included. Mn measurements from 82,574 drinking water samples collected from 3509 public waterworks were used to estimate exposure during the first 5 years of life. Mn concentrations in water were assigned to all cohort members based on longitudinal spatial linkage of their residential history and water supply areas. Exposure was modelled as the highest level of manganese in drinking water that each individual was exposed to during the first 5 years of life or a time‐weighted average manganese concentration. Sex‐specific hazard ratios (HRs) were estimated after adjusting for sociodemographic variables. The authors reported that, of all 82,574 drinking water samples, 67% were below the analytical detection limit. In the total study population, 20% of the children were exposed to more than 0.100 mg/L manganese at some point during their first 5 years of life. No association between higher concentrations of manganese in drinking water and risk of overall ADHD was observed. When restricting the analyses to ADHD‐Inattentive subtype, girls exposed to water manganese concentrations above 0.005 mg/L at least once during their first 5 years of life had an increased risk of ADHD‐Inattentive compared to girls exposed to < 0.005 mg/L (HR [95% CI] across exposure categories: 1 [reference], 1.28 [1.00, 1.65], 1.50 [1.16, 1.93], 1.55 [1.21, 1.99], 1.53 [1.19, 1.96]). A similar pattern was observed in boys (HR [95% CI] across exposure categories: 1 [reference], 1.08 [0.90, 1.27], 0.99 [0.83, 1.18], 1.19 [1.00, 1.40], 1.20 [1.01, 1.43]). No exposure–response pattern was observed in the association with ADHD‐Combined subtype in either sex. In the time‐weighted average analysis, water manganese concentration was positively associated with the risk of ADHD‐Inattentive subtype (HR [95% CI] across exposure categories in girls: 1 [reference], 1.16 [0.79, 1.72], 1.53 [1.08, 2.17], 1.31 [0.96, 1.79]; in boys: 1 [reference], 1.06 [0.78, 1.43], 1.40 [1.06, 1.83], 1.38 [1.08, 1.76]). The study was judged at low risk of bias (tier 1) (Appendix B.1). The Panel notes that dietary intake of manganese from food sources was not estimated in this study. At the manganese concentrations observed in drinking water, the contribution of water to overall manganese intake is expected to be low as compared to the rest of the diet.
The Panel notes the paucity of data from observational studies that would allow the evaluation of an association between ‘high’ manganese intake and risk of ADHD in children. No comprehensive UA is performed.
Overall conclusions on ADHD
The Panel considers that the available BoE is insufficient to conclude on a relationship between high dietary intake of manganese (from water and/or other sources) and risk of ADHD in children over the range of exposures investigated in the eligible study. The Panel notes that the available study addresses manganese water concentration and that studies investigating the relationship between total dietary intake of manganese and this outcome are lacking.
3.4.1.6. Impaired neurological functions in adults
Regarding impairment of neurological functions in adults, studies addressing functional measures of neurological functions are included in a standalone main LoE.
An overview of the eligible studies retrieved is provided in Table 12.
TABLE 12.
Outcome of the systematic search on dietary exposure to manganese and neurological function in adults.
| LoE | Endpoints | RCTs | PCs/NCCs | CS | Ecological |
|---|---|---|---|---|---|
| LoE1. Standalone (main) | Measures of neurological functions | 1 | 0 | 2 | 3 |
Abbreviations: CS, cross‐sectional; LoE, line of evidence; NCC, nested‐case control; PC, prospective cohort; RCT, randomised controlled trial.
Intervention study
In a randomised cross‐over trial, healthy women (n = 16) were randomly assigned to receive 0.8 mg or 20 mg manganese per day (as MnSO4) for 8 weeks (a 1 week wash‐out period was applied). Ten participants received 15% of total daily energy from cocoa butter, while six participants received 15% of total daily energy from corn oil (Finley et al., 2003). During the last week of each dietary period, participants were examined by a neurologist for the presence and severity of neurological signs and symptoms, including tests of steadiness and ability to control muscular tremor, signs of Parkinson's and related neurologic diseases, as well as tests to determine a range of components related to hostility and anger [by Buss‐Durkee Hostility Inventory (BDHI), the State–Trait Anger Expression Inventory (STAXI) and the interpersonal behaviour survey (IBS)]. The total amount of manganese absorbed was 0.030 ± 3 and 0.450 ± 3 mg from the low and high manganese diets, respectively (estimated through the use of manganese stable‐isotope in a test meal), independent from the fat source. The authors reported that no signs or symptoms of neurological impairment were detected by clinical examination in any dietary treatment group. There was no consistent effect of dietary ‘high’ manganese intake on the psychological functions measured by the BDHI, STAXI or IBS. Changes from baseline (mean ± SEM) on self‐confidence score in the low manganese groups were −1.6 ± 2.8% (corn oil group) and 14.3 ± 3.8% (cocoa butter) versus −4.2 ± 2.8% (corn oil group) and −3.9 ± 5.8% (cocoa butter) in the high manganese groups. Changes from baseline (mean ± SEM) on requesting help score in the low manganese groups were 0.7 ± 2.1% (corn oil group) and 7.9 ± 2.8% (cocoa butter) versus 7.7 ± 2.1% (corn oil group) and −14.2 ± 4.3% (cocoa butter) in the high manganese groups. The study was judged at moderate risk of bias (tier 2), due to uncertainties regarding the blinding of the outcome assessor (not reported) (Appendix B.1).
The Panel notes that no adverse effect on neurological functions was identified in this study with a supplemental dose of 20 mg manganese/day for 8 weeks. However, due to its small size and relatively short duration, the Panel considers that this study cannot be used to establish the long‐term safety of this dose.
Cross‐sectional and ecological studies
Kondakis et al. (1989) investigated neurological signs in residents (n = 188; > 50 years of age) from three areas from the same region in Greece, with different levels of manganese concentrations in drinking water, i.e. one area with ‘high’ manganese concentrations (1.8–2.3 mg/L; n = 77 participants), one area with ‘intermediate’ concentrations (0.082–0.250 mg/L; n = 49 participants) and one area with ‘low’ concentrations (0.004–0.015 mg/L; n = 62 participants). Participants were examined by a neurologist and a neurological score was given based on the presence and severity of neurological signs, and their diagnostic value for parkinsonism. The mean (range) neurological scores were 5.2 (0–29) in the ‘high exposure’ area, 3.9 (0–43) in the ‘intermediate exposure’ area and 2.7 (0–21) in the ‘low exposure’ areas. The study was judged at moderate risk of bias (tier 2) due to concerns regarding the exposure characterisation and the lack of adjustment for potential confounders (Appendix B.1). The water supply of the ‘high’ and ‘intermediate’ manganese concentration areas was then changed. Thirteen years later, water manganese concentration was analysed again and found to be 30–60 μg/L in both areas (‘high’ and ‘intermediate’ concentrations) and, upon examination of people living there, the authors reported that ‘no more neurological disturbances were observed’ (number of subjects NR; criteria and method for the neurological examination NR) (Ermidou‐Pollet et al., 2003).
In a cross‐sectional study in Germany, neurological examination was performed among adults (41–84 years old) who consumed drinking water from wells with ‘high’ water manganese concentrations (0.30–2.16 mg/L; N participants = 41) versus ‘low’ water manganese concentrations (< 0.05 mg/L; N participants = 74) for at least 10 years (Vieregge et al., 1995). Mean age was similar between the two groups. Similarities between the two groups were also observed regarding the consumption of alcohol, mineral water and other beverages, smoking, dietary habits and drug use. A neurologist blinded to participants' status performed a standardised neurological examination of each participant. No difference was found between the two groups on any of the neurological signs and symptoms evaluated. Fine motor skills abilities were also tested using the standard ‘Motorische Leistungsserie’ (MLS, Motor Performance Series) test battery. There was no between‐group difference regarding the performance on these tests. The study was judged at moderate risk of bias (tier 2) due to concerns regarding the lack of adjustment for potential confounders and attrition (68% of the initial sample excluded from analysis) (Appendix B.1).
Iwami et al. (1994) studied manganese concentrations in food and environmental samples in a Japanese town which reportedly had a high incidence of motor neuron disease (MND). Manganese intake for the local rice eater (5.79 mg/day), when coupled with low manganese concentration in drinking water (0.0023 mg/L), was positively correlated with the incidence of MND (r 2 = 0.99), while no correlation was found with manganese concentration in drinking water (latter already reported in previous study by this group of researchers [Iwami, Watanabe, Moon, Nakatsuka, & Ikeda, 1994]). Ecological observations, because of their nature, are considered at high risk of bias.
The Panel considers that the available BoE is insufficient to conclude on a relationship between high dietary intake of manganese (from water and/or other sources) and impaired neurological functions in adults, over the range of exposures investigated in these studies. The Panel notes that the available studies mostly address manganese water concentration and that studies investigating the relationship between total dietary intake of manganese and the outcomes investigated are lacking.
3.4.1.7. Case reports
Six published cases of suspected manganese intoxication were identified, two in children and four in adults.
Severe neurotoxicity symptoms (withdrawn behaviour, less verbal with repetitive stuttered speech and decline in balance, coordination and fine motor skills) were described in a 6‐year old girl from Canada, with severe iron deficiency and polycythaemia (Brna et al., 2011; Sahni et al., 2007). MRI indicated manganese accumulation in the basal ganglia and manganese concentration in blood was elevated (39.7 μg/L; reference range: 4.3–15.9 μg/L). Elevated blood cobalt concentration was also observed. No source of manganese inhalation exposure was identified. The family of the child was found to regularly use well water for drinking and cooking, with manganese concentrations of 1700–2400 μg/L. The sister of the child and other family members were asymptomatic, suggesting an individual susceptibility to manganese toxicity.
A 10‐year old boy in the USA was found to have an elevated blood manganese concentration (38.2 μg/L; reference value: < 14 μg/L) (Woolf et al., 2002). The family was found to have consumed well water with elevated manganese concentrations (1210 μg/L) for 5 years. Water was also found to have an elevated iron concentration. MRI did not reveal Mn accumulation in brain. His neurological examination was normal. As a result of cognitive tests, impaired visual and verbal memory was found. Other cognitive skills and IQ were normal.
Ghosh et al. (2020) reported neurological symptoms in a 40‐year old Indian man, which included chorea, multi‐domain cognitive impairment, dysarthria and generalised rigidity. MRI suggested manganese deposition in the brain basal ganglia. The serum manganese levels were 3281 nmol/L (reference value < 320 nmol/L). Screening for mutations for SLC39A14, SLC30A10 and SLC39A8 was negative. Acquired manganism related to high consumption of black tea for over 10 years was suspected. The patient was found to consume an average of 3L (20 cups) of tea per day, which was estimated to correspond to 26 mg manganese per day. After chelation therapy, the majority of symptoms were improved or resolved.
Sista and Dronacharya (2021) reported a case of symmetric parkinsonism and vertical gaze paresis in a 70‐year old woman with elevated serum manganese concentration (60.1 ng/mL, reference range: 4.7–18.3 ng/mL). MRI suggested manganese accumulation in the bilateral globus pallidus and subthalamic nuclei. The patient was found to have consumed a food supplement providing over ‘500% of recommended daily allowance for manganese’. 33 After stopping the supplement intake, serum concentrations were reported to normalise with partial clinical improvement, but the MRI results remained unchanged a year later.
(Ohtake et al., 2005) described the case of a 62‐year old Japanese man with chronic renal failure due to diabetic nephropathy, managed by haemodialysis, who was admitted to the hospital due to impaired motor function. The results of his MRI scan suggested manganese deposition in the bilateral basal ganglia. Manganese concentrations in serum (0.8 μg/dL; reported value for patients with haemodialysis: 0.2 ± 0.1 μg/dL) and cerebrospinal fluid (2 μg/L; reported value in healthy individuals: 0.88 ± 0.76 μg/L) were found to be elevated. The patient was found to have consumed several food supplements (including a Chlorella extract containing 139 μg manganese/g) for over 4 years, which were estimated to provide 2.2 mg manganese per day. Chelation therapy improved the MRI abnormalities and the symptoms. The authors noted that excess intake of manganese from supplements alone could not fully explain the onset of the patient's condition and hypothesised that long‐term haemodialysis may have contributed to their manifestation through unknown mechanisms.
Schuh (2016) reported the case of an African American woman (37 years old) diagnosed with Parkinson's disease. The patient reported to have consumed multiple herbal preparations and food supplements over the previous years. Among those, the patient reported taking 100 mg manganese per day for more than 2 years. The blood manganese concentration was normal (1 ng/mL). No MRI was performed. The authors attributed the symptoms to excess manganese intake, although it was unclear whether manganese was the unique cause due to multiple concomitant supplement uses.
The Panel notes that these case reports are consistent with a potential neurotoxicological effect of manganese with oral exposure. However, the limited number of cases, uncertain and partial characterisation of the overall dietary intake of manganese, and concomitant supplementation with other substances in some cases, preclude using these data to identify any critical intake level.
3.4.2. Animal data
A systematic review of the literature was conducted on studies which investigated the impact of manganese upon oral exposure to the nervous system and behavioural changes in experimental animals at different life stages (see protocol in Annex A). The PRISMA flow chart is provided in Appendix A.2.
Manganese chloride was used as test substance in all eligible studies. The endpoints tested belonged to three families of neurological functions, i.e. motor and sensory functions, cognitive functions and anxiety. The results of the multiple dose studies are discussed below. Whenever available, measures of tissue manganese concentrations are discussed, as indicative of internal exposure.
The key characteristics and findings of eligible multiple dose studies are tabulated in Appendix D.1 and are discussed below for the purpose of identifying a reference point for manganese toxicity.
A number of single dose studies were also retrieved (key characteristics and findings tabulated in Appendix D.2). The Panel notes that these studies were designed to investigate potential mechanisms of manganese neurotoxicity and, upon review, they did not bring additional information that could be used in support of the multiple dose studies to identify a reference point for manganese‐induced toxicity.
3.4.2.1. Developmental studies
Eleven multiple dose studies investigated the effect of neonatal exposure to manganese on neurological functions, tested either early in life or during adulthood (Table 13). Key findings are summarised in Appendix D.1 and discussed below.
Table 13.
Overview of multiple dose developmental studies.
| Mn exposure mg/kg bw per day | Exposure window | Motor and sensory functions | Cognition | Anxiety | |||||||||||||||||||
|---|---|---|---|---|---|---|---|---|---|---|---|---|---|---|---|---|---|---|---|---|---|---|---|
| Reference | Species | Treatment doses a | Background diet | Open‐field – locomotor activity c | Acoustic startle response | Negative geotaxis, righting | Reflexes (others) d | Balance beam | Grip strength | Montoya staircase | Homing | Automated activity monitoring | Motor/postural behaviour observations ob | Burrowing detour | Spatial maze learning e | Novel object recognition | Differential reinforcement | Choice reaction time | Passive avoidance | Cognitive tasks in WGTA f | CANTAB | Elevated plus maze | |
| Pappas et al. ( 1997 ) | Rat | DE: 0, 119, 482 b | 5 | GD1‐PND30 | ● | ●○ | ○ | ||||||||||||||||
| Oshiro et al. ( 2022 ) | Rat | DE: 0, 180, 360 | 6 | GD7‐PND21 | ○ | ● | ○ | ○ | |||||||||||||||
| Ohishi et al. ( 2012 ) | Rat | DE: 1, 6, 29 | 9 | GD10‐PND21 | ○ | ● | ● | ● | ○ | ○ | |||||||||||||
| Tran et al. ( 2002,b) | Rat | 1.3, 6, 12 b | n | PND 1–21 | ● | ● | ○ | ●○ | |||||||||||||||
| Reichel et al. ( 2006 ) | Rat | 0, 5, 15 b | n | PND 1–21 | ●○ | ● | ○ | ● | |||||||||||||||
| Brenneman et al. ( 1999 ) | Rat | 0, 8.5, 17 b | n | PND 1–21 | ● | ||||||||||||||||||
| Dorman et al. ( 2000 ) | Rat | 0, 8.5, 17 b | n | PND 1–21 | ● | ● | ● | ||||||||||||||||
| Conley et al. ( 2020 ) | Rat | 0, 25, 50 | n | PND 1–21 | ● | ||||||||||||||||||
| Kern et al. ( 2010 ), Kern & Smith ( 2011 ) | Rat | 0, 25, 50 | n | PND 1–21 | ●○ | ● | ● | ||||||||||||||||
| Beaudin et al. ( 2013 ), Beaudin, Strupp, Strawderman, et al. ( 2017 ) | Rat | 0, 25, 50 | n | PND 1–21 | ○ | ○ | |||||||||||||||||
| Foster et al. ( 2018 ) | Mice | 0, 11, 25, (50) | n | PND 1–21 | ● | ||||||||||||||||||
| Goullé et al. ( 2005 ) | Monkey | 0.02, 0.11, 0.32 | n | PND 1–120 | ● | ● | ● | ● | |||||||||||||||
Abbreviations: CANTAB, Cambridge Neuropsychological Test Automated Batteries; DE, dams exposure; GD, gestational day; n, negligible (maternal milk); PND, post‐natal day; WGTA, Wisconsin General Test Apparatus; ●, tested in early life; ○, tested during adulthood.
Treatment doses are standardised to daily doses of manganese by kg body weight (see Section 2.2.2.2).
After conversion from the test substance to elemental manganese (see Section 2.2.2.2).
The testing conditions in open‐field tests differed across studies in terms of the apparatus used, mode of activity recording (most often computer‐assisted or automated) and test conditions (dark/light, habituation period yes/no), the number of test repetitions (from 1 to 5 testing days), and the duration of the testing session (from 1 min [Reichel et al., 2006] to 72 min Dorman et al., 2000).
Pupillary reflex, pain reflex.
Morris water maze, Biel water maze, radial arm maze.
Tasks of visual object discrimination (OD), delayed nonmatch to sample (DNMS), position learning and reversal learning.
Maternal exposure (in utero and via milk
In three studies, rat dams were exposed to manganese through drinking water or diet throughout gestation up to post‐natal day (PND) 21 and neurological functions were assessed in their offspring (Ohishi et al., 2012; Oshiro et al., 2022; Pappas et al., 1997).
(Ohishi et al., 2012) exposed rat dams to 0, 119 and 482 mg manganese/kg bw per day via drinking water (background diet calculated: 5 mg/kg bw per day). Their offspring were maintained on the same regimen post‐weaning (until PND 30), corresponding to 81 mg/kg bw and 406 mg/kg per day. Higher activity (locomotor activity and number of rears) was found among the offspring of the high dose group, compared to the low dose and control groups (PND 17), while no between‐group differences were found on a Morris water maze (MWM) test (PND 25). At PND 32, mean manganese concentrations in rats brain were elevated in the treatment groups compared to controls (by 1.4 and 2.5 fold in the low and high dose groups, respectively). When tested later in life (PND 90–95), no between‐group differences were found on the MWM test, a 12‐arm radial maze test or an elevated plus maze.
At doses of 0, 180 and 360 mg/kg bw per day (background diet calculated: 6 mg/kg bw per day), with or without application of a perinatal stress paradigm, (Oshiro et al., 2022) found no consistent evidence of an adverse effect using a novel object recognition task at PND 34–37. At PND 22, mean manganese concentrations in rats brain were elevated in the treatment groups compared to controls (by 1.7 and 2.4 fold in the low and high dose groups, respectively). Later in life, no adverse effects of manganese treatments were found on a MWM test and a differential reinforcement of low‐rates procedure (DRL task; a test of associative learning, timing perception and impulsivity) (PND 62–77). On cued and uncued two‐choice reaction time tests performed at PND 135–140, a decreased accuracy of responses (cued only, males only) and decision time (uncued only, both sexes) were found in both dose groups not subject to perinatal stress compared to controls, while the trend was the opposite when manganese treatment was combined with stress; no adverse effects on movement time or anticipatory responses were found.
Upon addition of manganese doses of 0, 1, 6 and 29 mg/kg bw per day to a diet providing 9 mg manganese/kg bw per day, (Conley et al., 2020) found no effect on sensory function and reflexes early in life (surface righting [PND 10], pupillary, Preyer's and pain reflex [PND 21]), except for a dose‐dependent decrease in the number of animals showing normal air righting reflex in both sexes (PND 15). In the absence of effect on the other reflexes measured, the latter finding was considered incidental. Later in life, no between‐group differences were found in a Biel water maze (BWM) test (learning ability) (PND 55–57) or in locomotor activity and grip strength (PND 71). Mean cerebellum concentrations were slightly elevated in the mid and high dose groups at PND 21 [1.3 and 1.2 higher than control in the respective groups (not dose‐related)]; no between‐group differences were detected when brain manganese concentrations were analysed at PND 77. The Panel notes that the reported doses represent marginal manganese amounts as compared to the manganese intake provided by the rodent chow.
The Panel notes that the three available studies did not identify adverse effects of maternal manganese exposure, except for an indication of hyperactivity in the offspring of the dams exposed to the highest manganese dose (482 mg/kg bw per day) in the study by Reichel et al. (2006). No effect on learning abilities were found up to 360 mg/kg bw per day Conley et al. (2020) and 482 mg/kg bw per day (Pappas et al., 1997). The three studies were considered at moderate risk of bias (tier 2) (Appendix B.2), mostly due to insufficient reporting. Information was lacking on the blinding of behavioural outcome assessors and on the randomisation process/similarity in baseline characteristics between the experimental and control groups, allocation concealment and blinding of the research personnel. There was largely no concern regarding the purity of the test substance, description of experimental conditions across study groups or attrition/exclusion bias.
Neonatal exposure
In nine studies, manganese was administered directly to pups (by micropipette), from birth to PND 21 Kern et al. (2010). In these studies, the additional manganese intake provided by maternal milk to suckling animals is assumed to be negligible as compared to the test doses, in view of the low concentration reported in rodents' milk (0.1–0.3 mg/L) Reichel et al. (2006).
In the study by Tran, Chowanadisai, Crinella, et al. (2002), which used three manganese doses (0, 1.3, 6, 12 mg/kg bw per day), rat pups in the mid and high dose groups tended to have slower surface righting reflex (mean 2 seconds) than those in the low dose and control groups (mean 1 second) (PND 6) and prolonged time on a homing test was found in the high dose group compared to the other groups (mean 39, 46, 37 and 75 seconds in the control, low, mid and high dose groups, respectively) (PND 10). In a passive avoidance test, the number of foot‐shocks received tended to increase with the dose (mean 1.2, 1.6, 2.8 and 3.8 for the control, low, mid and high doses, respectively); other standard endpoints were not reported, particularly step‐through latency and time spent in the dark chamber, although the latter was reported indirectly as number of shocks at 2‐second intervals (PND 32). No between‐group differences were found on a burrowing detour test and on the passive avoidance test conducted at later timepoints (PND 50–56 and PND 60–64, respectively) (Tran, Chowanadisai, Lönnerdal, et al., 2002). Manganese concentrations in brain and other tissues were analysed at PND 40 and did not differ among treated and control animals (Tran, Chowanadisai, Crinella, et al., 2002).
In the study by Reichel et al. (2006), motor and sensory functions measured in rat pups were not altered at doses of 5 and 15 mg manganese/kg bw per day [open‐field test; negative geotaxis test; homing test; performed between PND 8 and 14]. No between‐group differences were found regarding locomotor activity and neuromuscular coordination (balance beam task) tested in the adult animals (PND 91). Manganese in the brain striatum of the high dose group was found to be elevated by five and three‐fold compared to controls, when analysed at PND 14 and 21, respectively. Striatum contents were similar on PND 90.
Brenneman et al. (1999) observed a higher activity in rat pups treated with 17 mg manganese/kg bw per day (restricted to the last 30 min of observation), while no difference was found between the group treated with 8.5 mg/kg bw per day and the control group (PND 21). In a further experiment with the same dose levels, the same laboratory did not detect between‐group differences in locomotor activity (PND 13, 17, 21) and in a passive avoidance test (PND 21) Vezér et al. (2007). Elevated acoustic startle responses were found during pulse‐elicited trials in both dose groups compared to controls (by 1.2 fold, not dose‐related), while no between‐group differences were found in prepulse‐elicited trials (PND 21). In both studies, manganese concentrations in the various tissues of the brain were found to be elevated in both dose groups compared to controls, in a dose‐related fashion (by around 1.5‐fold in the mid dose and two‐fold in the high dose groups).
In the study by Kern et al. (2010), where rats received doses of 0, 25 and 50 mg manganese/kg bw per day, impairment in cognitive performance was reported as tested through variants of the 8‐arm radial maze test. During the acquisition phase (PND 27–32), the learning performance of both treatment groups was lower than controls, i.e. both ability and speed of reaching the learning criterion dose‐dependently affected. On the trial days (PND 33–46), a higher number of errors were found in the treatment groups compared to controls (mean number of reference errors: 48, 55 and 62 in the control, low and high dose groups [p for ANOVA = 0.01]; working errors: 11, 17 and 19 [p = 0.06]), which was accompanied by a more frequent use of a stereotypic response strategy (mean number of test days when utilised: 1.9, 4.5 and 5.8, p for Dunnett's test < 0.05). An increased locomotor activity and increased activity in the centre zone in the open‐field (behavioural disinhibition) were also observed in the high dose group (PND 23). No between‐group differences were found on an elevated plus maze test (PND 23). Manganese concentrations in the brain and blood were elevated in both treatment groups compared to controls on PND 24 (by 1.8 and 2.6‐fold in the brain of the mid and high dose groups), while differences in brain concentrations were small when measured on PND 36 (1.1 and 1.2‐fold higher than controls in the respective groups; blood not measured). When tested later in life (PND 97), no between‐group differences were found regarding locomotor activity (Kern & Smith, 2011). No between‐group differences were found in blood and brain manganese concentrations measured on PND 107.
After administration of 0, 25 and 50 mg/kg bw per day to rats, (Beaudin et al., 2015) reported increased total distance travelled at both levels across 5 days of testing in an open‐field (PND 24–29) (not dose‐related). Unlike Brenneman et al. (1999), increased locomotor activity was restricted to the first period of the test (first 5–10 min of observation). Manganese tissue concentrations were not measured in early life.
In an investigation of long‐lasting effects of neonatal exposure (PND 1–21) to 0, 25 or 50 mg manganese/kg bw per day in rats, no difference was found between the low dose and the control groups on a Montoya staircase test (skilled forelimb performance) conducted between PND 120 and 150 with different pellet sizes, i.e. 45 mg and 20 mg pellets (8 days of habituation and training with 45 mg, 12 days of testing with 45 mg and 5 days of testing with 20 mg pellets) Beaudin et al. (2013). Animals in the high dose group were found to have more reaching difficulty than controls (lower number of pellets taken from the most distant steps), but there was no indication of impaired ability to manipulate pellets (the numbers of pellets eaten [from each step and total] or misplaced were comparable between groups). The data suggest that basal ganglia systems involved in forelimb extension versus reaching and grasping/retrieval movements in the rat are differentially sensitive to high dose manganese, but more data would be necessary to clarify this. Effects on attention were also assessed using different variants of a five‐choice serial reaction time task (i.e. with fixed cue duration [visual discrimination], with combinations of variable pre‐cue delays and fixed or variable visual cue duration [tests of focused attention] or with use of olfactory distractors [tests of selective attention]) starting at PND 80 (Beaudin, Strupp, Strawderman, & Smith, 2017). A lower performance in the selective attention task using olfactory distractors was found in the two treatment groups compared to controls (no dose–response) and a lower performance of the low dose group compared to both the control and high dose groups on the focused attention task. In the same experiment, the effect of life‐long exposure at the same dose levels were also investigated, with inconsistent findings (i.e. lower performance in the focused and selective attention tasks in the high dose group only) (Section 3.4.2.2). Overall, the pattern of findings regarding attention is inconsistent. The brain and blood concentrations measured on PND 24 were substantially elevated in both dose groups compared to controls (by about three‐fold in the brain and by 8 to 11‐fold in the blood), while they were similar in all groups when analysed on PND 66 and ~ 400.
In a study in mice, Ohishi et al. (2012) compared the effects of manganese exposure in wild‐type (C57BL/6J) and parkin mice (with Park2 gene defect, a model which develops motor dysfunction and other neurologic effects during ageing). Exposure doses were selected based on their previous experiment in rats (Brenneman et al., 1999), i.e. 0, 11, 25 and 50 mg/kg bw per day. Severe weight loss and high mortality rates were observed in the high dose group and the authors therefore reduced the highest dose to 25 mg Mn/kg bw per day. In contrast to rats, lower motor activity was reported in the mice pups exposed to manganese (PND 19–22). The decrease tended to be more pronounced in the highest dose group and in the wild‐type strain. The same trend was observed in both dose groups when tested again at PND 29–32. The Panel, however, notes that the number of mice tested were unbalanced across dose groups and timepoints (between 13 and 28 per test group). At PND 29, dose‐dependent increases in manganese concentrations were found in brain tissues (by two to three‐fold in the low dose group and 3.6 to 4‐fold in the high dose group) and other tissues (femur, liver and olfactory bulb), which were comparable in both mouse strains. The reason for the high mortality rate observed among mice receiving 50 mg/kg bw per day is unclear. In an experiment in juvenile mice (C57Bl/6), no signs of severe toxicity was found upon administration of a daily manganese dose of 50 mg/kg bw (as manganese chloride) by gavage (PND 21–34) (Streifel et al., 2012); doses up to 731 mg manganese/kg bw per day (as manganese sulfate) and 2250 mg manganese/kg bw per day (as manganese chloride) were found to be tolerated by adult mice without lethality (Dorman et al., 2000).
The Panel notes that for some studies, there are uncertainties related to the assumptions applied to express the treatment doses as elemental manganese (Section 2.2.2), as it was not always clear whether the reported doses referred to elemental manganese, manganese chloride dihydrate or manganese chloride tetrahydrate Reichel et al. (2006). The impact of these uncertainties on the characterisation of the overall manganese exposure can be substantial, especially when the test doses are low. The quality of reporting was low in most studies and the majority of studies were considered at moderate risk of bias (tier 2) and one study at high risk of bias (tier 3) (Kern et al., 2010; Kern & Smith, 2011). In particular, information was lacking on the identity of the test substance (producer or purity not reported; Beaudin et al., 2013; Beaudin, Strupp, Strawderman, et al., 2017; Conley et al., 2020; Kern et al., 2010; Kern & Smith, 2011; Tran, Chowanadisai, Crinella, et al., 2002; Tran, Chowanadisai, Lönnerdal, et al., 2002), on the blinding of behavioural outcome assessors (Brenneman et al., 1999; Dorman et al., 2000; Kern et al., 2010; Kern & Smith, 2011; Reichel et al., 2006; Torrente et al., 2005; Tran, Chowanadisai, Crinella, et al., 2002; Tran, Chowanadisai, Lönnerdal, et al., 2002), and on the randomisation process/similarity in baseline characteristics between the experimental and control groups, allocation concealment and blinding of the caregivers/researchers. There was largely no concern regarding the identity of description of the experimental conditions across study groups or attrition/exclusion bias, except for the study by Foster et al., (2018), due to substantial differences in the numbers of mice tested across groups and timepoints. The studies by Kern et al. (Kern et al., 2010; Kern & Smith, 2011), which used a comprehensive battery of tests, provide the most consistent findings, with dose‐dependent effects found on several endpoints when tested in early life, at doses of 25 and 50 mg/kg bw per day. However, the Panel considers that, due to the concerns regarding their internal validity (lack of reporting on the randomisation process of the animals to the groups, on the blinding of the research personnel and outcome assessors, on the purity and producer of the test substance), which categorised this study to be high risk of bias (tier 3; Appendix B.2) these studies cannot be used to derive of a reference point for manganese‐induced neurotoxicity.
One study investigated the effect of neonatal exposure to manganese in Rhesus monkey (Golub et al., 2005). Male animals (n = 8/group) were exclusively fed with a commercial cow's milk based formula (control group, 0.02 mg manganese/kg bw per day), a commercial soy protein based formula (low dose group, 0.11 mg manganese/kg bw per day) or the same soy formula with added manganese (high dose group, 0.32 mg Mn/kg bw per day) for the first 120 days of life (as noted in erratum, Golub et al., 2012). After that, the monkeys received a standard primate diet containing 44 mg manganese/kg dry matter (corresponding to ~ 1.3–2.2 mg/kg bw per day 34 ) over a 18‐month period. Throughout that period, a battery of tests was conducted, which included measures of motor and cognitive functions and sociability. No adverse effect of manganese exposure was detected regarding gross motor development (1–14 weeks of age). Between‐group differences in measures of activity during rest/activity cycles, tested at 4 and 8 months of age, showed inconsistent patterns across time points. Compared to controls, the groups fed with the two soy‐based formulae had less play behaviour and a higher frequency of clinging in dyadic social interactions and the group receiving the soy formula + manganese had more rough play than the two other groups (1–5.5 months). Few between‐group differences were found on cognitive tests (5–18 months) but considered as isolated findings. The Panel notes that the standard laboratory diet, to which all animals transitioned after 4 months of age, supplied several times higher amounts of manganese compared to the formulas. The Panel also notes that cow's milk based formula, which was used as control, differs from soy‐based formulas in other aspects than just manganese content which may contribute to the observed differences in behaviour between groups of animals.
Finally, the study lacked information regarding the purity of the test substance, the blinding of behaviour outcomes assessors and research personnel and randomisation of the animals to the groups (high risk of bias (tier 3); Appendix B.2). Therefore, the Panel considers that this study cannot be used to derive a reference point for manganese‐induced neurotoxicity.
3.4.2.2. Neurotoxicity studies in adult animals (sub‐acute and sub‐chronic)
Ten studies investigated the effect of sub‐acute or sub‐chronic oral exposure to manganese on neurological functions in rodents (Table 14). Studies were further divided as per method of administration of Mn, i.e. by gavage or via drinking water due to different toxicokinetic profile (Section 3.2.5).
TABLE 14.
Overview of multiple dose sub‐acute, sub‐chronic and chronic neurotoxicity studies.
| Mn exposure mg/kg bw per day | Exposure duration | Motor and sensory functions | Cognition | Anxiety | ||||||||||||
|---|---|---|---|---|---|---|---|---|---|---|---|---|---|---|---|---|
| Reference | Species | Treatment doses a | Background diet | Open‐field – locomotor activity d | Acoustic startle response | Negative geotaxis, righting | Reflexes (others) e | Rotarod | Grip strength | Montoya staircase | Auditory brainstem response | Spatial maze learning f | Choice reaction time | Passive avoidance | Open‐field – anxiety g | |
| Sentürk and Öner ( 1996 ) | Rat | 0, 0.4, 0.7 | 5.5 | 30 d | ● | |||||||||||
| Dorman et al. ( 2000 ) | Rat | 0, 8.5, 17 b | 9 | 21 d | ● | ● | ● | ● | ● | ● | ||||||
| Vezér et al. ( 2005 , 2007 ) | Rat | 0, 3, 11 b , i | 8 c | 70 d | ● | ● | ● | |||||||||
| Torrente et al. ( 2005 ) | Rat | 0, 76, 153 b | 8 c | 133 d | ● | ● | ● | |||||||||
| Avila et al ( 2008 ) | Rat | 0, 260, 629 | 8 c | 30 d | ● | |||||||||||
| Beaudin et al. ( 2013 ), Beaudin, Strupp, Strawderman, et al. ( 2017 ) | Rat | 0, 25, 50 | 11 | PND 1‐150 h | ● | ● | ||||||||||
| Bonilla et al. ( 1984 ) | Rat | 0, 9, 450 | 8 c | 240 d | ● | |||||||||||
| Moreno et al. ( 2009 ) | Mice |
0, 4, 13 b 0, 4, 13 b 0, 4, 13 b |
17 c 17 c 17 c |
14 d (PND 20–34) 49 d (wk 12–20) 14 + 49 d (PND 20–34 + wk 12–20) |
● | ● | ||||||||||
| Yang et al. ( 2021 ) | Mice | 0, 7, 14, 28 b | 17 c | 90 d | ● | ● | ||||||||||
| Ohgami et al. ( 2016 ) | Mice | 0, 0.3, 3 | 17 c | 28 d | ● | ● | ||||||||||
Abbreviations: d, day; PND, post‐natal day; wk, week.
Treatment doses are standardised to daily doses of manganese by kg body weight (see Section 2.2.2.2).
After conversion from the test substance to elemental manganese (see Section 2.2.2.2).
Not reported; inferred based on the average content of standard rodent chows (see Section 2.2.2.2).
The testing conditions in open‐field tests differed across studies in terms of the apparatus used, mode of activity recording (most often computer‐assisted or automated) and test conditions (dark/light, habituation period yes/no), the number of test repetitions (from 6 min [Reichel et al., 2006] to 72 min [Dorman et al., 2000]).
Pupillary, pain reflex.
Morris water maze, radial arm maze.
As measured by the time spent in the margin of the arena.
Until end of behavioural tests.
Administered 5 days per week.
Exposure by gavage
Five studies administered manganese by gavage (Avila et al., 2010; Bonilla, 1984; Vezér et al., 2007).
Sentürk and Oner (1996) investigated the effects of 0, 0.4 and 0.7 mg manganese/kg bw per day administered to female albino rats by gavage for 30 days (background diet: 5.5 mg/kg bw per day). After 15 and 30 days of exposure, the time required to reach the food in a T‐maze test was three‐fold longer in the low and high manganese dose groups (~ 100–120 s), compared to the control group (~ 30 s). In both groups treated with manganese, the concentrations of the element in brain tissues and serum were elevated compared to the control groups (by up to 2.5 and 2.9‐fold, respectively). The Panel notes that the reported doses represent marginal manganese amounts as compared to the average manganese intake provided by the rodent chow, and this contrasts with the substantial increases reported in the tissue concentrations of manganese.
Vezér et al. (2005, 2007, one experiment published twice) treated adult rats (Wistar) with 0, 4 and 16 mg manganese/kg bw, administered by gavage for 5 days a week (which gives daily doses of 0, 3 and 11 mg/kg bw) for 70 days (assumed background diet: 8 mg/kg bw per day). Variants of an eight‐arm radial maze test were conducted throughout the duration of the study. Results of the majority of tests showed impaired performance on the spatial learning and memory tasks in both treatment groups and in a dose‐dependent manner. The pattern was the same when the working memory tasks were repeated 3–5 weeks post‐treatment. Lower activity was found in both dose groups compared to controls after 35 and 70 days of exposure. When tested after a 49‐days recovery period, locomotor activity was comparable between the treatment and control groups. After 70 days, the number of acoustic startle responses decreased in a dose‐dependent manner, associated with increased onset latency (similar in both dose groups). The effect of pre‐pulse inhibition was also reduced in the two treatment groups compared to the control group, with a more pronounced effect found in the low dose group. At the end of the recovery period, the same pattern was observed regarding the number of acoustic startle responses across dose groups, while no differences were observed when tested with pre‐pulse inhibition. Compared to controls, the high dose group had 1.5 times higher manganese concentrations in brain tissues after 35 and 70 days of exposure, accompanied by elevated manganese concentrations in blood and other tissues. Manganese concentrations in the brain, blood and other tissues concentrations in the low dose group were comparable to controls, except for a 1.5‐fold increase in hippocampus tissues reported after 35 days. Considering an additional manganese intake from the background diet of 8 mg/kg per bw day (Table 2), the total manganese intakes would be 11 and 19 mg manganese/kg bw per day in the respective treatment groups.
In another experiment in adult rats (Sprague Dawley) using comparable doses (0, 8.5 and 17 mg manganese/kg bw per day) by gavage (background diet: 9 mg manganese/kg bw per day), Dorman et al. (2000) found no between‐group differences on locomotor activity in open‐field, surface righting and other reflexes, grip strength and passive avoidance test after 21 days of treatment. A lower acoustic startle responses in the rats from the low dose groups, compared to the high dose and control groups was reported; this isolated finding is considered incidental. Elevated manganese concentrations were found in brain tissues in the treatment groups compared to controls, which were generally more pronounced in the high dose group (e.g. by 1.7‐fold in the cerebellum and striatum).
The Panel notes that the studies by Vezér et al. (2005, 2007) and Ohishi et al. (2012) provide inconsistent results, although careful interpretation is needed given that several factors might have contributed to this heterogeneity [e.g. different rat strains (Wistar vs. Sprague Dawley), tests and durations of exposure]. Further uncertainty relates to the lack of characterisation of the manganese content of the rodent chow used in the study by Vezér et al. (2005, 2007). In addition, there are concerns given that its results were duplicated in two publications 35 (Vezér et al., 2005, 2007). In view of these limitations, the Panel considers that the experiment by Vezér et al. (2005, 2007) cannot be used to derive a reference point for manganese‐induced neurotoxicity.
In a study in mice, Moreno et al. (2009) investigated the effect of 0, 4 or 13 mg manganese/kg bw per day by gavage (assumed background diet: 17 mg/kg bw per day). Three exposure time windows were tested: a juvenile exposure (14 days, PND 20–34), adult exposure (49 days, PND 84–140) and a combined juvenile + adult exposure (14 days, PND 20–34 + 49 days, PND 84–140). Under the juvenile or adult exposure regimen, no between‐group differences were found on locomotor activity (both sexes), while decreased time in the margin of the arena was found in both treatment groups of males subject to juvenile exposure (indicative of disinhibited behaviour) but not to adult exposure. In contrast, in the combined exposure regimen, male mice spent more time in the margin of the arena in both treatment groups compared to controls (indicative of increased anxiety). Regarding locomotor activity, a reduction in the total numbers of movements was observed in the high dose group in males only, with no differences detected on the other parameters of locomotor activity (total distance travelled and rearing movements) (both sexes). In the combined juvenile + adult exposure group, modest differences were found between the treatment and control groups regarding manganese concentrations in serum and brain tissues, while under the other two exposure regimens, substantially elevated concentrations of manganese were measured in various brain tissues in both dose groups compared to controls (by three‐fold and five‐fold in the cortex of mice subject to juvenile and adult exposure, respectively). The Panel notes that the number of animals across the groups varied from 11 to 18 for the juvenile mice and 8–10 for the adult mice and as such presents a source of bias. The Panel also notes the contrasting findings regarding the effect of manganese on mice behaviour across exposure regimens (disinhibition vs. null effect vs. anxiety in males; no effect in females). They are considered as incidental and cannot serve as a basis to derive a reference point for manganese‐induced neurotoxicity.
In another study in adult mice, animals were treated with 0, 7, 14 and 28 mg manganese/kg bw per day by gavage for 90 days (calculated background diet: 17 mg/kg bw per day) (Reichel et al., 2006; Tran, Chowanadisai, Crinella, et al., 2002). No between‐group differences were found in performance on a rotarod test. A Morris water maze test was performed on six consecutive days, starting 48‐hours after the last manganese administration. During the first 5 days (acquisition period), no differences in escape latency were observed between the groups. On the last day (probe trial), the animals in the high dose group crossed the platform less times in comparison to controls (mean (range) number of platform crossings: 1.7, 1.5, 1.1 and 0.8, in the control, low, mid and high dose groups, respectively). No consistent pattern was observed regarding the swimming path lengths in the target quadrant. Manganese content of mice hippocampi were slightly elevated in the three dose groups compared to controls (ca. 1.3‐fold higher; not dose‐related) (no other tissues analysed). The Panel considers that the findings regarding the number of platform crossings in the probe trial provide weak evidence for an adverse effect of the manganese treatment and are insufficient to derive a reference point for manganese‐induced neurotoxicity from this study.
Exposure through drinking water
Five studies administered manganese through drinking water (Dorman et al., 2000; Ohishi et al., 2012; Vezér et al., 2007).
Torrente et al. (2005) exposed adult rats to 0, 76 and 153 mg manganese/kg bw per day via drinking water for 133 days (assumed background diet: 8 mg/kg bw per day). In addition, half of the animals from each dose groups were subject to a restraint stress. Locomotor activity in an open‐field was recorded and passive avoidance test and water maze test were performed, indicating no consistent patterns. Among animals not subject to stress, higher number of rearings and increased distance in the centre were found in the low dose compared to control groups, but not in the high dose group (open‐field test), while lower performance compared to controls was found on the water maze task in the high dose group only. Among the animals subject to stress, no between‐group differences were found on those tests, except for a reduced total distance travelled in the high dose versus control groups (open‐field). No between‐group differences were found on the passive avoidance test under neither of the stress regimens. Manganese concentrations in whole brain and cerebellum were found to be elevated in all groups treated with manganese compared to controls (by two to three‐fold; not dose‐related).
In an experiment in which adult rats were administered 0, 260 and 629 mg manganese/kg bw per day for 30 days via drinking water (assumed background diet: 8 mg/kg bw per day), (Beaudin et al., 2015) reported decreased ambulation (both dose groups), lower incidence of vacuous chewing movements (high dose group), and lower frequency of tongue protrusion (both dose groups), compared to controls. The numbers of rearing were similar across groups. Manganese content of brain or other tissues was not reported in this study.
In the above‐mentioned study by (Foster et al., 2018; Moreno et al., 2009; Yang et al., 2021), long‐term effects of manganese exposure were assessed in additional groups of rats by administrating 0, 25 and 50 mg manganese/kg bw per day from the neonatal period throughout adulthood [via micropipette (PND 1–21) and drinking water (≥ PND 22)]. The post‐weaning background diet provided 10.6 mg manganese/kg bw per day. Montoya staircase test was conducted between PND 120 and 150. Animals in the low and high dose group had more reaching difficulty than controls (lower number of pellets taken from the most distant steps), with some indication of impaired ability to manipulate pellets (lower number of pellets eaten from more distant steps, lower percent grasping success [i.e. (pellets eaten/pellets taken) × 100] on more distant steps, higher number of pellets misplaced). The effects were more pronounced in the low dose than the high dose group. Overall, no between‐group differences were detected in the total number of pellets eaten. Effects on attention were also tested using the same variants of a five‐choice serial reaction time task as described above, starting on PND 80 (see Section 3.4.2.1) Foster et al. (2018). Lower % response accuracy on the focused attention task (with the 3 and 6 second pre‐cue delays) and the selective attention task (when applying an odour distractor) were found in the high dose compared to the low dose and control groups. No between‐group differences were found regarding the % of premature responses or omission errors on either tests. When tested at PND 66 and ~ 400, manganese blood and brain concentrations were higher in the treatment groups compared to the control, although the differences in brain content were small [mean 2.14 μg/g dw (control); 2.36 μg/g dw (low dose, NS vs. control); 2.58 μg/g dw (high dose, p < 0.05 vs. control) at PND 66] compared to those observed upon neonatal exposure [mean 4.28 μg/g dw (control); 11.5 μg/g dw (low dose, p < 0.05 vs. control); 13.4 μg/g dw (high dose, p < 0.05 vs. control) at PND 24]. The Panel notes that the low dose group had more pronounced impairment of motor function than the high dose group. Therefore, in the absence of a consistent and reliable dose–response, this study is not suitable to identify a reference point for manganese‐induced neurotoxicity.
The same laboratory conducted a similar experiment in which rats were treated with 0 and 50 mg manganese/kg bw per day from PND 1 to PND 145 (Beaudin et al., 2015; Beaudin, Strupp, Uribe, et al., 2017). On the Montoya staircase test conducted from PND 110 to 140, the percent grasping success was lower on the more distant steps, and the total number of pellets eaten was lower in the treated group versus control group; the number of pellets taken from more distant steps tended to be lower in the treated versus control group (not statistically significant) Yang et al. (2021). In the baseline attention task, which started at PND 85, no between‐group differences were found (% response accuracy, premature responses and omission errors) Ohgami et al. (2016). In the selective attention task, an increase in % premature (when applying the odour distractor) were observed in treatment versus control groups (no differences in % omission errors and decrease in % accurate response restricted to the trial with 2‐sec odour distractor). At PND 145, blood manganese concentration was elevated in the treatment group to a level comparable to those reported by Beaudin et al. (2013); Beaudin, Strupp, Strawderman, and Smith (2017); manganese concentration in the brain was not determined. The Panel notes that the two experiments found consistent evidence for an impairment of fine motor functions at a dose of 50 mg/kg bw per day Foster et al. (2018). In contrast, the pattern of findings regarding measures of attention were inconsistent Streifel et al. (2012).
Upon administration of 0, 9 and 450 mg manganese/kg bw per day to rats via drinking water for 240 days (assumed background diet: 8 mg/kg bw per day), Bonilla (1984) reported increased activity in both dose groups compared to controls after 1 month of exposure. No between‐group differences were detected during the following months of exposure until activity was found to be lower in both dose groups compared to controls towards the last months of observation (starting at 6 month). The Panel notes that the level of activity increased gradually in the control group over the course of the study and was generally similar in both dose groups (no dose‐dependency). Manganese concentration of the brain or other tissues was not reported in this study.
Ohgami et al. (2016) tested auditory brainstem response in young adult wild‐type mice exposed to manganese in doses of 0, 0.3 and 3 mg/kg bw per day for 28 days via drinking water (assumed background diet: 17 mg/kg bw per day). Mice of both dose groups showed acceleration of age‐related hearing loss compared to controls (dose‐dependent). Decreased density of spinal ganglion neurons with increased number of lipofuscin granules was reported in the high dose group (findings in low dose group NR). The Panel notes that the doses used provided marginal manganese amounts as compared to the average manganese intake provided by standard rodent diets. In a single dose study by Muthaiah et al. (2016), no difference in auditory brainstem response was found between rats exposed to 359 mg manganese/kg bw per day for 90 days via drinking water and controls. The Panel notes that the studies evaluating possible manganese‐induced ototoxicity are scarce.
Conclusions on neurotoxicity studies in adult animals
The Panel notes that in several studies, the low (and sometimes high) experimental doses represented marginal increases as compared to the manganese intake from the background diet (Tables 13 and 14) (Moreno et al., 2009; Ohgami et al., 2016; Sentürk & Oner, 1996; Vezér et al., 2005; Vezér et al., 2007; Yang et al., 2021). There are uncertainties regarding the total oral exposure to manganese in most studies as only three out of 10 studies reported the manganese content of the background diet (Beaudin et al., 2013; Beaudin, Strupp, Strawderman, et al., 2017; Dorman et al., 2000; Sentürk & Oner, 1996). Another uncertainty relates to the assumptions applied to express the treatment doses as elemental manganese (Section 2.2.2), as it was not always clear whether the reported doses referred to elemental manganese, manganese chloride dihydrate or manganese chloride tetrahydrate (Moreno et al., 2009; Torrente et al., 2005; Vezér et al., 2005; Vezér et al., 2007; Yang et al., 2021). The impact of these uncertainties on the characterisation of the overall manganese exposure can be substantial, especially when the test doses are low. The quality of reporting was low in most studies and the majority of studies were considered at moderate risk of bias (tier 2) and one study at high risk of bias (tier 3) (Bonilla, 1984) (Appendix B.2). Information was lacking on the identity of the test substance [producer or purity not reported; seven studies (Bonilla, 1984; Sentürk & Oner, 1996; Dorman et al., 2000; Torrente et al., 2005; Moreno et al., 2009; Beaudin et al., 2013; Beaudin, Strupp, Strawderman, et al., 2017; Yang et al., 2021)], on the blinding of behavioural outcome assessors (Bonilla, 1984; Torrente et al., 2005; Vezér et al., 2005; Vezér et al., 2007; Avila et al., 2008; Moreno et al., 2009; Yang et al., 2021) and on the randomisation process/similarity in baseline characteristics between the experimental and control groups, allocation concealment and blinding of the caregivers/researchers. There was largely no concern regarding the identity of the experimental conditions across study groups or attrition/exclusion bias, except for the study by Moreno et al. (2009) due to substantial differences in the numbers of mice tested across groups. Overall, the Panel considers that none of the studies can be used to identify a reference point for manganese‐induced neurotoxicity.
3.4.3. Mode of action of manganese‐induced neurotoxicity
The molecular and cellular mechanisms underlying detrimental effects of manganese on the nervous system remain poorly understood, although several mechanisms have been proposed and studied, including mitochondrial dysfunction, oxidative stress, inflammation, apoptotic cell death, protein accumulation, endoplasmic reticulum stress (ER stress), autophagy and glutamatergic and dopaminergic neurotoxicity (Nyarko‐Danquah et al., 2020; Pajarillo et al., 2020).
Data suggest that the lysosomes, the Golgi apparatus, the endosome, mitochondria as well as the nucleus may be significant pools of intracellular manganese and targets of its toxicity with most studies focusing on mitochondrial dysfuntion (Chen et al., 2018).
3.4.3.1. Mitochondria
Mn2+ may have a special affinity for mitochondria, as these organelles are preferable targets for manganese intracellular accumulation (Gavin et al., 1992) with the highest manganese accumulation rate after chronic exposure observed in the mitochondria of astrocytes and neurons (Moreno et al., 2009). When in excess, manganese has been reported to disrupt mitochondrial ATP production and induce oxidative stress (Gunter et al., 2012; Malecki, 2001; Zheng et al., 1998). Other proposed mechanisms include direct neuronal toxicity by the inhibition of mitochondrial respiration, leading to energy failure, impaired functions of glial cells (astrocytes and microglia), oxidative stress and excitotoxicity (Morcillo et al., 2021; Nyarko‐Danquah et al., 2020).
A possible further molecular mechanism is proposed by an in vitro study conducted by Diessl et al (2022), who reported that excess cellular manganese selectively disrupts biosynthesis of coenzyme Q (CoQ) via erroneous insertion of manganese in the diiron centre of Coq7, resulting in failure of mitochondrial bioenergetics.
3.4.3.2. Astrocytes, oxidative stress and neuroinflammation
Hazell et al. (2006) reported that rats dosed intraperitoneally with 50 mg MnCl2/kg bw (once or daily for 4 days), had astrocytosis (nuclear pallor, chromatin margination, swollen processes) in both cortical and sub‐cortical structures (1%–5% of all astrocytes after 1 day, 10%–20% after 4 days treatment). Astrocytosis was prevented by co‐treatment with the antioxidant manganese chelator CDTA or N‐acetylcysteine, suggesting mediation via oxidative stress. The authors suggested that effects of manganese on mitochondria are consistent with evidence that manganese produces oxidative stress in astrocytes via production of reactive oxygen species (ROS).
It is also suggested that manganese can impair the function of astrocytic glutamate transporters (glutamate transporter 1, GLT‐1 and glutamate aspartate transporter, GLAST) and glutamate uptake, leading to disruption of glutamate homeostasis and excitotoxic neuronal injury, eventually causing neurodegeneration (Fumagalli et al., 2008; Karki et al., 2015; Lee et al., 2009; Pajarillo et al., 2022).
Several studies noted that hepatic encephalopathy (HE) is another neuropathological condition associated with astrocyte‐mediated manganese toxicity, which is characterised by brain oedema secondary to astrocyte swelling (Karki et al., 2015; Krieger et al., 1995; Norenberg, 1987; Rama Rao et al., 2007).
Since one of the roles of astrocytes is regulation of immune responses with production of cytokines and inflammatory mediators, several studies have shown that dysregulation of mitochondrial bioenergetics in astrocytes may result in neuroinflammation, leading to neuronal injury (Kirkley et al., 2017; Pajarillo et al., 2022; Sarkar et al., 2018; Verina et al., 2011; Zhao et al., 2009).
3.4.3.3. Mechanisms involving alterations in neurotransmitter systems
The build‐up of manganese in the brain might affect many different neurotransmitter systems as well as their brain activity, but the evidence is mainly coming from in vitro studies (Soares et al., 2020; Kim et al., 2022). Manganese mainly seems to accumulate in the globus pallidus and basal ganglia regions of the brain, which have a highly complex network of neurotransmitters and therefore might result in a multitude of deviations from optimum physiology and behaviour (Balachandran et al., 2020). At the molecular level, manganese is involved as an essential co‐factor for a range of enzymes including astrocytic glutamine synthetase involved in glutamate‐GABA‐glutamine cycles, the urea cycle enzymes Arginase 1 and 2, Mn superoxide dismutase (MnSOD) involved in mitochondrial oxidative stress response as well as insulin and insulin growth factor receptor signalling which has been discussed to modulate acute Mn‐induced acute oxidative stress and neurotoxicity.
3.4.4. Adverse health effects not related to neurotoxicity
3.4.4.1. Infant mortality
An association between manganese concentrations in drinking water and all‐cause infant mortality has been investigated in some ecological and cross‐sectional studies.
In a pilot ecological study conducted in North Carolina, manganese concentrations in groundwater (mean concentration across counties 78 μg/L, range 3–3468 μg/L) was positively associated with infant mortality. Using stepwise multiple regression analysis, a 2.074 increase in county level infant deaths per 1000 live births for every log increase in groundwater manganese concentration was reported (Spangler & Spangler, 2009).
The remaining studies identified were all conducted in Bangladesh. In a cross‐sectional study, Hafeman et al. (2007) investigated the relationship between manganese concentrations in well water (median 1280 μg/L, range 0 to 8610 μg/L) and infant mortality rate among a sub‐set of participants in the HEALS study (n = 3824 infants born from mothers drinking from the same well for most of their childbearing age). Infants exposed to manganese concentration in well water ≥ 400 μg/L had an increased risk of mortality in the first year (OR = 1.8; 95% CI 1.2, 2.6) compared to those exposed to manganese concentrations < 400 μg/L. Adjustment for water arsenic and social class among other variables had low impact on the results. Conversely, no relationship was found between water concentration in tube‐wells (mean 660 μg/L, range 10–3780 μg/L) and infant death in an ecological study (Cherry et al., 2010) for which data was available for 600 villages, including details on 29,744 live births and 934 infant deaths over a period of 2 years (OR = 1.11; 95% CI 0.76, 1.61 for manganese concentration in tube‐wells water ≥ 400 μg/L vs. < 400 μg/L). Similarly, in a population‐based cohort study Rahman et al. (2013), no increased risk of spontaneous abortion (n = 158; OR = 0.65; 95% CI 0.43, 0.99) or perinatal mortality (n = 70; OR = 0.69; 95% CI 0.28, 1.71) was found among women (n = 1875) consuming water in the highest tertile of manganese concentration (median = 1292 μg/L) versus the lowest (median = 56 μg/L).
The Panel notes the inconsistency of the findings and that none of these studies reported on manganese intake.
3.4.4.2. Birth‐related outcomes
Preterm birth
Two prospective cohort studies have investigated the relationship between maternal blood concentrations of manganese in the first and/or second trimester of gestation and risk of preterm birth. One was conducted in Japan (n = 14,847 pregnant women, mean concentrations of manganese in blood =15.3 μg/L) (Tsuji et al., 2018) and the other in Suriname (n = 380 pregnant women; concentrations of manganese in blood < 13 μg/L = 36.1% and ≥ 13 μg/L = 63.9%; (Sewberath Misser et al., 2022). Preterm delivery was defined as < 34 and 37 weeks of gestation, respectively. None of these studies report an increased risk of preterm delivery at higher manganese concentrations in maternal blood.
One cross‐sectional study conducted in Spain (n = 327 mother‐infant pairs) (Freire et al., 2019) reported an OR for preterm birth (< 37 weeks of gestation) of 1.08 (95% CI, 0.91–1.26) for each 10% increase in placental manganese concentrations. In a case control study from Indonesia (n = 51 women; 26 preterm deliveries (cases) and 25 term deliveries (controls) (Irwinda et al., 2019), manganese concentrations in maternal and cord blood did not significantly differ between groups, whereas placental concentrations of manganese were significantly lower in the preterm group (099 vs. 0.42 μg/g, p < 0.001). The Panel notes than none of these studies reported a positive association between manganese concentrations in the placenta and risk of preterm delivery.
Finally, the only study investigating manganese intake in relation to preterm birth was a prospective cohort study conducted in Iran (n = 1033 pregnant women) (Bakouei et al., 2015). Maternal manganese intake was assessed through an FFQ during the second trimester of pregnancy and preterm delivery was defined as < 34 weeks of gestation. Baseline mean (SD) daily intake of manganese was significantly higher in mothers with preterm delivery (n = 72; 3.60 [3.21] mg) versus those delivering at term (n = 961; 2.99 [2.35] mg), (p = 0.03). In multiple logistic regression analysis adjusting for maternal characteristics and maternal dietary intakes of macronutrients and other micronutrients, the manganese intake was positively associated with the risk for preterm birth (OR = 1.12; 95% CI 1.02, 1.23). The Panel notes that the unit increase in manganese intake associated with the reported OR was not provided in the publication.
Birthweight
A number of cross‐sectional and prospective cohort studies conducted in different geographical areas (US, Canada, China, Japan, Suriname, Korea, Iran, Costa Rica) have addressed the relationship between manganese concentrations in maternal or cord blood and/or maternal tissues (teeth, hair) and birthweight (as continuous variable or as dichotomous variable as risk of being small for gestational age [SGA]) mostly in infants born at term.
Some studies reported an inverted U‐ or J‐shape associations between maternal manganese concentrations in blood at delivery and birth weight (Ashley‐Martin et al., 2018; Chen et al., 2014; Zota et al., 2009) or risk of being SGA (Eum et al., 2014; Yamamoto et al., 2019) (infant males only) in cross‐sectional analyses, whereas no relationship was shown when blood samples were taken in the first or second trimester in longitudinal analyses (Ashley‐Martin et al., 2018; Daniali et al., 2023; Mora et al., 2015; Sewberath Misser et al., 2022).
Except for one study conducted in China which reported an inverted U‐shape relationship (Guan et al., 2014), no association was found between manganese concentrations in cord blood and birthweight (Ashley‐Martin et al., 2018; Chen et al., 2014; Zota et al., 2009).
Two studies have used manganese concentrations in mothers' teeth or hair as indicators of long‐term manganese exposure. In the Wayne County Health, Environmental, Allergy and Asthma Longitudinal Study (WHEALS; n = 138) (Cassidy‐Bushrow et al., 2019) manganese concentrations in teeth during the second and third trimester of pregnancy were positively associated with birthweight Z‐scores at delivery (β = 0.21, 95% CI; 0.05, 0.37, p = 0.01 for both time points), whereas hair manganese concentrations were positively associated only with chest circumference in a cohort of 380 mother–infant pairs of the Infants' Environmental Health Study (ISA) in Costa Rica (Mora et al., 2015).
Few animal studies, retrieved for the systematic review of manganese neurotoxicity (see Section 3.4.2), investigated the effects of manganese treatment during pregnancy on birthweight (Ohishi et al., 2012; Oshiro et al., 2022; Pappas et al., 1997). No differences in birthweight between treatment and control groups were reported.
Birth defects
Case–control studies have addressed the relationship between congenital malformations and manganese concentrations in water, placenta, milk and maternal hair.
Higher manganese concentrations in drinking water (range 0.015–1.116 mg/L) were statistically significantly associated with a higher prevalence of conotruncal heart defects (Prevalence Ratio for ≥ 90th percentile versus ≤ 50th percentile: 1.6, 95% CI 1.1, 2.5) in a semi‐ecological study which included 20,151 infants with selected birth defects (cases) identified by the North Carolina Birth Defects Monitoring Program (BDMP) and 668,381 infants (controls) with no congenital malformations (Sanders et al., 2014). No significant association between manganese concentrations in drinking water and other measured birth defects was found.
Two additional studies were conducted in China. One study (80 cases, 50 controls) assessed the relationship between placental manganese concentrations and risk of neural tube defects (NTDs) (Liu et al., 2013). Median placental manganese concentration was significantly higher in cases than in controls (131.60 ng/g [95% CI 99.25, 166.76] vs. 101.54 ng/g [95% CI 80.14, 119.79], respectively), whereas a placental manganese concentration above the median (> 117.89 ng/g) was associated with a 4.26‐fold increased risk of NTDs (95% CI 1.23, 14.79), mostly driven by spina bifida, whereas the risk for anencephaly was not significant. The second study (322 cases, 333 controls) (Wang et al., 2022) assessed the risk of congenital heart defects (CHD) and reported higher concentrations of manganese in maternal hair in cases versus controls, where mothers with high manganese concentration in hair (≥ 3.01 μg/g) were more likely to have children with CHDs compared with mothers with medium manganese concentration (adjusted OR = 2.68, 95% CI = 1.44–4.99, p < 0.002).
A study conducted in India (Dang et al., 1983) reported slightly higher manganese concentrations in mother's milk between cases of congenital hydrocephalus (n = 7) and meningomyelocele (n = 2), and controls (n = 16). Mean (SD) manganese concentrations in milk, measured at 1.5–3 months post‐partum were 25.3 (13.8) ng/g and 23.0 (8.3) ng/g, respectively.
No animal study, retrieved for the purposes of systematic review, reported birth defects and malformations in treated animals.
The Panel notes that human data on birth defects are scattered regarding both the exposure and the endpoints assessed, and the limitations of case–control studies to infer causality.
3.4.4.3. Metabolic syndrome
Case–control and cross‐sectional studies have addressed the relationship between dietary intake of manganese and prevalence of metabolic syndrome (MetS). All the studies identified were conducted in Asia (China, Korea).
Case–control studies reported no association or an inverse association between manganese intake and MetS. Data from 5136 adults (2084 men, 3052 women) was collected in the context of the 2007–2008 Korea National Health and Nutrition Examination Survey (KNHANES), among which 540 men (25.9%) and 748 women (24.5%) met the diagnostic criteria for MetS. Dietary data were collected through 24‐h dietary recalls (unclear how many days per subject). Manganese intake was significantly lower in women with MetS(+) versus women without MetS(−) (3.55 vs. 3.81 mg/day; p = 0.0086), whereas no difference was observed in men. No association between manganese intake and prevalence of MetS or any of its components was found in any sex (Choi & Bae, 2013). In another study conducted in China (221 cases and 329 controls) dietary manganese intake (3‐day food diary, 2 weekdays and one weekend day) of cases and controls was not significantly different (3.68 vs. 4.02 mg/day; p = 0.30) (Li et al., 2013). All quartiles of manganese intake were associated with a lower risk of MetS as compared to the lower quartile (adjusted OR: 0.47, 95% CI, 0.29–0.79 for the highest vs. the lowest).
In a cross‐sectional study conducted also in China, data was collected in the context of the 5th Chinese National Nutrition and Health Survey [n = 2111 adults, 998 men and 1113 women, of which 580 MetS(+), 237 men and 353 women]. Intake data was assessed using 3‐day 24‐h dietary recalls. Higher manganese intake was associated with a decreased risk of MetS in men and with an increased risk of MetS in women (OR for the highest vs. the lowest quartile = OR = 0.62; 95% CI 0.42, 0.92 for men and OR = 1.56; 95% CI 1.02, 2.45 for women, respectively; p‐per‐trend across quartiles = 0.043 for men and 0.078 for women). Intakes of manganese Q1 and Q4 were < 5.12 and > 6.87 mg/day for men and < 4.26 and > 5.79 mg/day for women. Manganese intake was inversely associated with abdominal obesity (p‐trend = 0.016) and hypertriglyceridemia (p‐trend = 0.029) in men, but positively associated with low HDL‐cholesterol in both men (p‐trend = 0.003) and women (p‐trend < 0.001). No significant associations between manganese intake and other components of the MetS were found in any sex.
In a recent systematic review and meta‐analysis on the relationship between different indicators of exposure to manganese (dietary intake, serum, urine, whole blood) and MetS, nine cross‐sectional and three case–control studies were included, among which the only three studies reporting on dietary intake are described above. No increased risk of MetS was detected when comparing the highest versus the lowest manganese exposure levels for any exposure indicator (Wong et al., 2022).
3.5. Hazard characterisation
3.5.1. Selection of the critical effect
The Panel retains neurotoxicity as the critical effect of excess manganese dietary intake.
The neurotoxic effects in humans of chronic exposure to high manganese concentrations by inhalation, in particular in occupational settings, are well documented. However, the doses associated with adverse effects cannot be readily extrapolated to the oral exposure route in view of the toxicokinetic differences between inhalation and oral intake. As an essential element, manganese concentration is actively controlled by homeostatic mechanisms regulating absorption, distribution and excretion. However, when the hepatic regulatory mechanisms of manganese body burden are impaired (e.g. chronic liver disease, genetic mutation affecting manganese transporters), dietary exposure to manganese can cause neurotoxicity (Sections 3.2.4.4 and 3.2.4.5). In the general population, some cases of dietary intoxication with manganese have also been reported, where typical signs and symptoms of manganism were associated with MRI signals indicative of manganese accumulation in the globus pallidus (Section 3.4.1.7). In human observational studies, drinking water has been the most studied source of exposure. In addition to the ecological studies previously assessed by the SCF (SCF, 2000), several observational studies (mostly cross‐sectional) have become available which investigated the association between manganese concentration in drinking water and neurological outcomes, especially in infants and children (Sections 3.4.1.1, 3.4.1.4). Overall, limited conclusions can be drawn from these studies due to the insufficient characterisation of manganese dietary exposure (e.g. water concentration as a proxy for manganese exposure through drinking water, no quantification of other dietary sources of manganese), concerns regarding incomplete adjustment for confounding (e.g. other environmental and lifestyle risk factors) and/or uncertainties regarding the temporality of the relationship (evidence mostly from ecological or cross‐sectional designs). Of note, except in cases of contaminated drinking water (e.g. due to anthropogenic activities), this source of manganese is a minor contributor to total manganese dietary intake. One randomised controlled trial (Finley et al., 2003) among adult female volunteers investigated the potential effects of consuming a supplemental dose of 20 mg manganese per day (as MnSO4) for 8 weeks on the nervous system and clinical neuropsychological tests (Section 3.4.1.6). Although no adverse effect was identified in that study, due to its' small size and relatively short duration, it cannot be used to establish the long‐term safety of this dose.
The evidence from animal experiments was also reviewed (Section 3.4.2). The Panel notes that eligible studies in animals were mostly mechanistic and were not designed to identify a reference point. The individual studies had several methodological limitations, which affect the Panel's confidence in the robustness of the available data. Despite these limitations, the Panel considers that the body of evidence indicates that oral exposure to manganese can affect neurological functions in rodents. Both motor and learning abilities were found to be affected. The Panel notes that there are indications that manganese may increase in the brain at a higher rate in the neonatal phase (Beaudin et al., 2013; Dorman et al., 2000) or juvenile phase (Moreno et al., 2009) compared to adulthood. However, data to assess whether rodents may be more susceptible to the effects of manganese during the developmental period compared to adulthood are limited. The few studies which investigated the effect of manganese in early life versus adult under similar exposure and behavioural testing conditions provided little evidence for a higher susceptibility to the neurotoxic effects of manganese in early life (Beaudin et al., 2013; Beaudin et al., 2015; Beaudin, Strupp, Strawderman, & Smith, 2017; Dorman et al., 2000; Moreno et al., 2009).
Finally, the Panel notes that MnCl2 was used in all animal studies included in this assessment (Section 3.4.2). Regarding human data, most of the evidence relates to manganese forms as present in drinking water (Section 3.4.1). Although some data indicate the oxidation state and solubility of manganese forms and the presence of some food compounds (e.g. iron, phytates) may affect manganese intestinal absorption (Section 3.2.1), data on the influence of these factors on dietary manganese toxicity profile are limited.
Overall, the Panel considers that available human and animal studies support neurotoxicity as a critical effect of excess dietary intake of manganese. However, data are not sufficient and suitable to characterise a dose–response relationship and identify a reference point for manganese‐induced neurotoxicity.
3.5.2. Derivation of health‐based guidance values
In the absence of adequate data to characterise a dose–response relationship and identify a reference point for manganese‐induced neurotoxicity, no UL for manganese intake can be established for any population group. For nutrients for which there are no, or insufficient, data on which to base an UL, the Panel is requested to ‘give an indication on the highest level of intake where there is reasonable confidence in data on the absence of adverse effects’ (see Section 1.1), i.e. a safe level of intake (EFSA NDA Panel, 2022).
The Panel notes that there is no indication in the general population that manganese intake is associated with adverse effects, including neurotoxicological effects, at the levels of background dietary intake (i.e. manganese intake from natural dietary sources only). Therefore, the Panel considers that the estimated background dietary intakes of manganese observed among high consumers (95th percentile) in representative groups of the population can provide an indication of the highest level of intake where there is reasonable confidence on the absence of adverse effects. The P95 estimates of background intakes of manganese derived in this assessment (Section 3.3.2) are used to establish safe levels of intake of manganese. The Panel decided to take the average value of the four highest P95 estimates across countries for the respective population groups (rounded to the nearest milligram), and the following values of safe level of intake are derived: 8 mg for adults ≥ 18 years (including pregnant and lactating women), 7 mg for adolescents aged ≥ 14 to < 18 years, 6 mg for children and young adolescents aged ≥ 7 to < 14 years, 5 mg for children aged ≥ 3 to < 7 years and 4 mg for toddlers aged ≥ 1 to < 3 years. As data are insufficient to determine when manganese homeostatic processes become fully mature during infancy, a more conservative approach is taken for infants, by calculating the average value of all available P95 across countries for this age group. A safe level of intake of 2 mg is derived for infant aged ≥ 4 months to < 1 year. The Panel considers that these safe levels of intake apply to total manganese intake from all dietary sources, including fortified foods and food supplements.
3.6. Risk characterisation
The Panel notes that the application of safe levels of intake for risk assessment and risk management is more limited than an UL because the proportion of people at risk of adverse effects in a population cannot be estimated, as the intake level at which the risk of adverse effects starts to increase is not defined.
The Panel also notes that the main contributors to manganese intake from the background diet are grain‐based products, tea and other manganese‐rich beverages (e.g. hibiscus, maté infusions) (Section 3.3.2.2). The Panel notes that specific subgroups of the population, such as high consumers of tea and other manganese‐rich beverages or vegetarians, may have habitual intakes of manganese in the higher range of the intake distribution in the general population (Section 3.3.4). The potential risk of adverse effects related to additional consumption of manganese from other sources (e.g. fortified foods and/or food supplements) among high consumers of manganese from natural sources is unknown.
Individuals with impaired hepatic function or with iron deficiency have been suggested to be possibly at higher risk of manganese toxicity (Section 3.2.4.6). In addition, evidence from some case reports indicates that some individuals in the population may be particularly vulnerable to manganese toxicity due to specific genetic mutations of manganese transporters impairing manganese excretion (Section 3.2.4.5). The Panel considers that current data are insufficient to characterise subgroups of the population who may be potentially at higher risk of manganese toxicity.
4. CONCLUSIONS
No UL for manganese can be established for any population group. The Panel establishes the safe levels of intake of manganese reported in Table 15, based on observed background intake of manganese among high consumers from the general population (P95 estimates). The Panel considers that these safe levels of intake apply to total manganese intake from all dietary sources, including fortified foods and food supplements.
TABLE 15.
Safe levels of intake for manganese.
| Age | Safe level of intake (mg/day) |
|---|---|
| ≥ 4 months to < 1 year | 2 |
| ≥ 1 to < 3 years | 4 |
| ≥ 3 to < 7 years | 5 |
| ≥ 7 to < 14 years | 6 |
| ≥ 14 to <18 years | 7 |
| ≥ 18 years a | 8 |
Including pregnant and lactating women.
5. RECOMMENDATIONS FOR RESEARCH
There is a lack of biomarkers of exposure and biomarkers of effect that can be used for the risk assessment of dietary manganese. Further investigation of homeostatic and adaptive responses to excess manganese intakes and of the mode(s) of action of manganese neurotoxicity may allow the identification of specific biomarkers of effect (e.g. neurological biomarkers) and/or early signs of toxicity, which could support the characterisation of a dose–response.
Observational studies in humans have mostly investigated associations between manganese water concentration and neurological functions. Further studies investigating the relationship between total dietary intake of manganese and adverse effects on neurological functions especially during developmental phase and in populations with high dietary exposure are needed.
Further investigation of potential specific susceptibility (e.g. age, iron status) to manganese toxicity is needed. Genetic traits that may influence individual susceptibility also requires further investigation, including the prevalence of specific mutations of manganese transporters in European populations.
Additional research is needed regarding potential differences in the toxicity profile of the various dietary forms of manganese (e.g. organic vs. inorganic manganese).
Additional research is needed regarding potential manganese toxicity on other endpoints besides neurotoxicity.
For the intake assessment of manganese and risk characterisation, there is a need to generate more data on manganese intake from food supplements and fortified/enriched foods among users of those products.
ABBREVIATIONS
- Ach
acetylcholine
- AD
Alzheimer's disease
- ADHD
attention‐deficit hyperactivity disorder
- ADME
absorption, distribution, metabolism and excretion
- AIs
adequate intake
- ANOVA
analysis of variance
- Anses
French Agency for Food, Environmental and Occupational Health & Safety
- ANS Panel
Panel on Food Additives and Flavourings
- AR
average requirement
- As
arsenic
- ASR
acoustic startle response
- αSy
α‐Synuclein
- ATP
adenosine triphosphate
- ATSDR
US Agency for Toxic Substances and Disease Registry
- Aβ
amyloid‐β
- BBB
blood brain barrier
- BDHI
Buss‐Durkee Hostility Inventory
- BDMP
Birth Defects Monitoring Program
- BMI
body mass index
- BoE
body of evidence
- BOT‐2
Bruininks‐Oseretsky test, 2nd edition
- BSID‐III
Bayley Scales of Infant and Toddler Development, 3rd edition
- bw
body weight
- BWM
Biel water maze
- CANTAB
Cambridge Neuropsychological Test Automated Batteries
- CAS
Chemical Abstracts Service
- CHD
congenital heart defects
- CI
confidence interval
- CRS‐P
Conners' Rating Scales‐Parent's version
- CRS‐T
Conners' Rating Scales‐Teacher's version
- CS
cross‐sectional
- CSF
cerebrospinal fluid
- DA
dopamine
- DANSDA
The Danish National Survey of Diet and Physical Activity
- DE
Dams exposure
- DMT1
divalent metal transporter‐1
- DNMS
delayed no match to sample
- DRL
differential reinforcement of low rates of responding
- EPA
US Environmental Protection Agency
- EVM
Expert Group on Vitamins and Minerals
- FAO
Food and Agriculture Organization
- FCDB
EFSA Food composition database
- FEEDAP Panel
Panel on Additives and Products or Substances used in Animal Feed
- FFQs
Food frequency questionnaires
- FoodEx
Food classification and description system
- FPN
ferroportin
- FPQ
food propensity questionnaire
- GABA
gamma aminobutyric acid
- GD
gestational day
- GNPD
Global New Products Database
- HBGVs
health‐based guidance values
- HCT
human controlled trial
- HDL
high‐density lipoprotein
- HEALS
Health Effects of Arsenic Longitudinal Study
- HOME
Home Observation for Measurement of Environment
- HR
hazard ratio
- IBS
interpersonal behaviour survey
- INCA 3
Third French Individual and National Food Consumption Survey
- IOM
Institute of Medicine
- IQ
intelligence quotient
- IQR
interquartile range
- ISA
Infants' Environmental Health Study
- KNHANES
The Korea National Health and Nutrition Examination Survey
- LOAEL
lowest‐observed adverse effect level
- LoE
lines of evidence
- LOV
lacto‐ovo‐vegetarian
- MetS
metabolic syndrome
- MINIMat
Maternal and Infant Nutrition Interventions in Matlab
- MLS
motor performance series
- Mn3O4
Manganese tetroxide
- MnCl2
Manganese dichloride
- MnCO3
Manganese carbonate
- MND
Motor neuron disease
- MnO2
Manganese dioxide
- MnPO4
Manganese phosphate
- MnSO4
Manganese sulfate
- MnSOD
manganese superoxide dismutase
- MRI
magnetic resonance imaging
- MRL
minimal risk levels
- mRNA
messenger RNA
- MWM
Morris water maze
- NCFS II
National children's food survey II
- NDA Panel
EFSA Panel on Nutrition, Novel Foods and Food Allergens
- NOAEL
no‐observed adverse effect level
- NA
not applicable
- NCC
nested‐case control
- NEUPSILIN‐Inf
Brazilian Child Brief Neuropsychological Assessment Battery
- NPNS
National Pre‐School Nutrition Survey
- NR
not reported
- NTDs
neural tube defects
- NTFS
National Teen's Food Consumption Survey II
- NTP
National Toxicology Program
- NVS II
Nationale Verzehrsstudie II
- OD
object discrimination
- OHAT
Office of Health Assessment and Translation
- OR
odds ratio
- OTAP
Office of Health Assessment and Translation
- PC
prospective cohort
- PD
Parkinson's Disease
- PND
post‐natal day
- PPI
pre‐pulse inhibition
- PRI
population reference intake
- PRISMA
Preferred Reporting Items for Systematic Reviews and Meta‐Analyses
- P5
5th percentile
- P95
95th percentile
- RCPM
Raven's Coloured Progressive Matrices
- RCT
randomised control trial
- RfD
reference dose
- RNA
ribonucleic acid
- RoB
risk of bias
- ROS
reactive oxygen species
- RP
Reference point
- RR
relative risk
- SC
Scientific Committee
- SCF
Scientific Committee on Food
- SD
Sprague Dawley
- SD
standard deviation
- SDQ
strengths and difficulties questionnaire
- SEM
standard error of the mean
- SGA
small for gestational age
- sQ
sub‐question
- SOD
superoxide dismutase
- STAXI
State–Trait Anger Expression Inventory
- SUL
safe upper level
- SV
semi‐vegetarians
- TA
time averaged
- TDI
tolerable daily intake
- TDS
total Diet Study
- UA
uncertainty analysis
- UF
uncertainty factor
- UL
tolerable upper intake level
- WASI
Wechsler Abbreviated Scale of Intelligence
- WG
Working Group
- WGTA
Wisconsin General Test Apparatus
- WHEALS
Wayne County Health, Environmental, Allergy and Asthma Longitudinal Study
- WHO
World Health Organization
- WISC‐IV
Wechsler Intelligence Scale for Children, 4th Edition
CONFLICT OF INTEREST
The declarations of interest of all scientific experts active in EFSA's work are available at https://ess.efsa.europa.eu/doi/doiweb/doisearch.
REQUESTOR
European Commission
QUESTION NUMBER
EFSA‐Q‐2021‐00371
PANEL MEMBERS
Dominique Turck, Torsten Bohn, Jacqueline Castenmiller, Stefaan De Henauw, Karen Ildico Hirsch‐Ernst, Helle Katrine Knutsen, Alexandre Maciuk, Inge Mangelsdorf, Harry J McArdle, Androniki Naska, Kristina Pentieva, Alfonso Siani, Frank Thies, Sophia Tsabouri and Marco Vinceti.
COPYRIGHT FOR NON‐EFSA CONTENT
EFSA may include images or other content for which it does not hold copyright. In such cases, EFSA indicates the copyright holder and users should seek permission to reproduce the content from the original source.
Supporting information
Protocol for the Scientific Opinion on the revision of the EFSA's Tolerable Upper Intake Level of manganese
Methodological considerations in the calculation of intake estimates for manganese in European countries
EFSA's intake assessment of manganese
Manganese intake data from Competent Authorities in European countries
Public consultation on the draft scientific opinion on the tolerable upper intake level for manganese
ACKNOWLEDGEMENTS
The Panel wishes to thank for their contribution to this output: the WG on Upper Levels: Peter Aggett, Brandy Beverly, Torsten Bohn, Julia Bornhorst, Marta Crous‐Bou, Francesco Cubadda, Aymeric Dopter, Susan Fairweather‐Tait, Rex FitzGerald, Susan Lanham New, Georg Lietz, Harry J McArdle, Anne Molloy, Giovanni Passeri, Kristina Pentieva, Marco Vinceti and Misha Vrolijk; hearing expert: Peter Willatts, individual scientific advisor (ISA) expert: Keyvin Darney and EFSA staff members: Constanza De Matteu Monteiro, Jean‐Lou Dorne, Alessandra Giarola, Irene Muñoz Guajardo, Nena Karavasiloglou, Laura Ciccolallo, Roanne Marie Saad, Angeliki Sofroniou and Silvia Valtueña Martínez. The Panel also wishes to thank Carmen Peláez for her contribution as member of the NDA Panel until June 2023. The Panel acknowledges Thorhallur I Halldorsson, Bryndis Eva Birgisdottir, Anete Dudele, Jacob Juel Christensen and Birna Thorisdottir for the preparatory work as part of a procurement procedure. The Panel also wishes to acknowledge the contribution of all national institutions in European countries that provided consumption data for this scientific output.
APPENDIX A. LITERATURE SCREENING AND SELECTION
A.1. Flow Diagram for the selection of human studies for sub‐question 3a

A.2. Flow chart for the selection of animal studies for sub‐question 3b
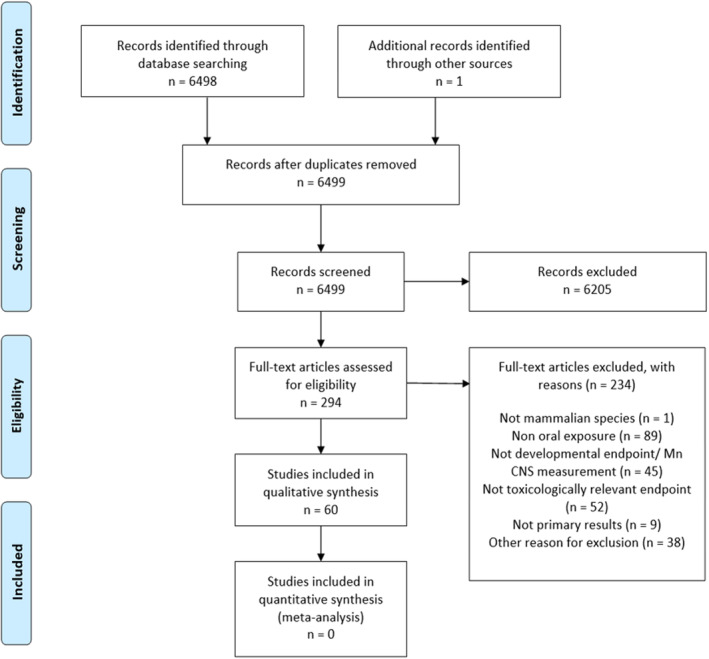
APPENDIX B. RISK OF BIAS APPRAISAL
B.1. Risk of bias (RoB) appraisal of human studies
B.1.1. Intervention study
| Reference | Outcome | Tier a | Risk of bias domains b | |||||||
|---|---|---|---|---|---|---|---|---|---|---|
| Reference | Design | Outcome | Tier | Confidence in exposure (KEY) | Confidence in outcome (KEY) | Randomisation (KEY) | Allocation concealment | Blinding | Attrition | Other threats to internal validity |
| Finley et al. (2003) | RCT | Steadiness | 2 | + | + | − | + | − | + | + |
| RCT | Hostility | 2 | + | + | − | + | − | + | + | |
| RCT | Anger | 2 | + | + | − | + | − | + | + | |
| RCT | Behaviour | 2 | + | + | − | + | − | + | + | |
Abbreviations: RCT, Randomised cross‐over trial.
The individual rating for each question was combined by an algorithm and translated to an overall tier of reliability for each individual study (RoB tier 1: low RoB; RoB tier 2: moderate RoB; RoB tier 3: high RoB).
Expert judgement was translated into a rating scale for each question to be answered as follows: (++): definitely low RoB; (+): probably low RoB; (NR): not reported; (−): probably high RoB; (− −): definitively high RoB.
B.1.2. Observational studies
| Reference | Outcome | Tier a | Risk of bias domains b | ||||||
|---|---|---|---|---|---|---|---|---|---|
| Reference | Design | Outcome | Tier | Confidence in exposure (KEY) | Confidence in outcome (KEY) | Confounding (KEY) d | Appropriate comparison groups | Attrition | Other threats to internal validity |
| Cohort studies | |||||||||
| Dion et al. (2018) | PC | IQ | 1 | + | + | + | + | − | + |
| Miyake et al. (2022) | PC | Behaviour | 1 | + | + | + | + | − | + |
| Rahman et al. (2017) | PC | IQ | 1 | + | ++ | + | + | + | + |
| PC | Behaviour | 1 | + | ++ | + | + | + | + | |
| Schullehner et al. (2020) | PC | ADHD | 1 | + | ++ | + | + | + | + |
| Rodrigues et al. (2016) | PC | Neurodevelopment | 2 | + | + | − | + | − | + |
| Cross‐sectional studies | |||||||||
| Bouchard et al. (2011) | CS | IQ | 1 | + | ++ | + | + | + | + |
| Bouchard et al. (2018) | CS | IQ | 1 | + | ++ | + | + | + | + |
| Khan et al. (2011) | CS | Behaviour | 1 | + | + | + | + | + | + |
| Oulhote et al. (2014) | CS | Memory | 1 | + | + | + | + | + | + |
| CS | Attention | 1 | + | + | + | + | + | + | |
| CS | Motor | 1 | + | + | + | + | + | + | |
| CS | Hyperactivity | 1 | + | + | + | + | + | + | |
| Dion et al. (2016) | CS | MRI | 2 | + | ++ | − | + | + | + |
| Wasserman et al. (2004) | CS | IQ | 1 | + | + | + | + | + | + |
| Wasserman et al. (2006) | CS | IQ | 1 | + | + | + | + | + | + |
| Wasserman et al. (2011) | CS | IQ | 1 | + | ++ | + | + | + | + |
| Khan et al. (2012) | CS | Academic achievement | 2 | + | + | − | + | + | + |
| Kondakis et al. (1989) | CS | Neurological symptoms | 2 | − | + | − | + | + | + |
| Nascimento et al. (2016) | CS | Cognitive function | 2 | + | + | − c | + | + | + |
| Parvez et al. (2011) | CS | Motor function | 2 | + | ++ | − | + | + | + |
| Vieregge et al. (1995) | CS | Neurological symptoms | 2 | + | ++ | − | + | − | + |
| Nascimento et al. (2015) | CS | IQ | 3 | + | NR | −− | − | + | + |
Abbreviations: ADHD, attention‐deficit hyperactivity disorder; CS, cross‐sectional; IQ, intelligence quotient; PC, prospective cohort.
The individual rating for each question was combined by an algorithm and translated to an overall tier of reliability for each individual study (RoB tier 1: low RoB; RoB tier 2: moderate RoB; RoB tier 3: high RoB).
Expert judgement was translated into a rating scale for each question to be answered as follows: (++): definitely low RoB; (+): probably low RoB; (NR): not reported; (−): probably high RoB; (− −): definitively high RoB.
Different from the preparatory work, the Panel identified cause for concern regarding the risk for confounding.
For pregnancy and children studies, the following factors were considered as key confounders: offspring age, offspring sex, maternal (or parental) socioeconomic status and/or education, prematurity (conditional), maternal smoking (conditional), maternal alcohol consumption (conditional), parity/number of siblings (conditional), other contaminants (conditional), birth weight (conditional); for pregnancy and children studies, the following factors were considered as key confounders: age at outcome assessment, sex, socioeconomic status and/or education, smoking, ethnicity (conditional), other contaminants (conditional).
B.2. Risk of bias (RoB) appraisal of animal studies
| Doses (how many) and outcome(s) | Tier | Risk of bias domains a | |||||||||
|---|---|---|---|---|---|---|---|---|---|---|---|
| Reference | No. Doses | Outcome(s) | Tier | Randomisation | Allocation concealment | Identical experimental conditions | Blinding | Attrition | Confidence in exposure | Confidence in outcome | Other biases (litter effects) |
| Studies in rats | |||||||||||
| Sprowles et al. (2018) | 1 | Elevated zero mazeLight↔dark testOpen‐fieldPPI of acoustic startleCincinnati water mazeMorris water mazeLatent inhibition | 1 | + | NR | ++ | NR | − | + | + | ++ |
| Avila et al. (2010) | 1 | Open‐fieldRotarod test | 1 | + | NR | ++ | NR | ++ | + | + | |
| Avila et al. (2008) | 2 | Open‐field | 2 | NR | NR | ++ | NR | ++ | + | NR | |
| Beaudin et al. (2013) | 2 | Staircase test | 2 | NR | NR | ++ | NR | + | NR | + | ++ |
| Beaudin, Strupp, Uribe, et al. (2017) | 2 | Focused Attention TasksSelective Attention Task with Olfactory Distracters | 2 | NR | NR | ++ | + | ++ | NR | + | ++ |
| Brenneman et al. (1999) | 2 | Motor function | 2 | NR | NR | ++ | NR | + | ++ | NR | ++ |
| Conley et al. (2020) | 2 | Open‐field | 2 | NR | ++ | + | ++ | + | NR | ++ | ++ |
| Dorman et al. (2000) | 2 | Motor functionPassive Avoidance Acoustic startle | 2 | + | NR | ++ | NR | + | + | NR | ++ |
| Kern et al. (2010) | 2 | Elevated plus maze | 2 | NR | NR | ++ | NR | + | NR | + | |
| Ohishi et al. (2012) | 3 | Functional examination in F1 Grip strength in F1 T‐maze test in F1 | 2 | + | NR | ++ | NR | ++ | + | NR | ++ |
| Oshiro et al. (2022) | 2 | Novel object recognition Morris water maze Two‐choice reaction time | 2 | NR | NR | ++ | NR | + | + | NR | ++ |
| Pappas et al. (1997) | 2 | Elevated plus maze on PND90 Spontaneous motor activity on PND17 Morris water maze on PND 25–20 Radial arm maze on PND90 | 2 | + | NR | ++ | NR | + | + | NR | + |
| Reichel et al. (2006) | 2 | Developmental landmarks (PND 1 to 21) Sensory and motor function (PND 9 to 13) Negative geotaxis (PND 8 to 12) Locomotor activity and | 2 | NR | NR | ++ | NR | + | + | NR | ++ |
| Sentürk and Oner (1996) | 2 | T‐maze | 2 | NR | NR | + | NR | + | + | + | |
| Torrente et al. (2005) | 2 | Open‐field Water maze task Passive avoidance | 2 | NR | NR | ++ | NR | ++ | + | NR | |
| Tran, Chowanadisai, Lönnerdal, et al. (2002) | 3 | Burrowing detour test Passive avoidance test | 2 | + | NR | + | NR | + | NR | NR | NR |
| Tran, Chowanadisai, Crinella, et al. (2002) | 3 | Righting test on PND 6 Homing test on PDN 10 Passive avoidance test | 2 | + | NR | + | NR | + | NR | NR | |
| Vezér et al. (2005, 2007) | 2 | 8 arm maze Open‐field | 2 | NR | NR | ++ | NR | − | + | NR | |
| Amos‐Kroohs et al. (2015) | 1 | Locomotor activity Sucrose preference Elevated zero maze | 2 | NR | NR | ++ | NR | + | NR | + | |
| Amos‐Kroohs et al. (2017) | 1 | Cincinnati water maze Morris water maze | 3 | NR | NR | ++ | NR | + | NR | NR | |
| Andrade et al. (2017) | 1 | Motor function | 2 | + | NR | NR | NR | + | + | NR | |
| Bailey et al. (2019) | 1 | Cincinnati water maze Morris water maze Conditioned freezing Open‐field test | 2 | NR | NR | ++ | NR | ++ | + | + | + |
| Beaudin et al. (2015) | 1 | Skilled forelimb performance Staircase test | 2 | + | NR | ++ | NR | ++ | NR | NR | ++ |
| Beaudin, Strupp, Uribe, et al. (2017) | 1 | Baseline attention task Selective attention task | 2 | NR | NR | ++ | NR | ++ | NR | + | |
| Betharia and Maher (2012) | 1 | Morris water maze Open‐field | 2 | NR | NR | ++ | NR | − | + | NR | + |
| Betharia and Maher (2012) | 1 | Surface righting reflex on PND1 to 10 | 2 | NR | NR | ++ | NR | − | + | + | + |
| Fordahl et al. (2012) | 1 | Home Cage | 2 | + | NR | ++ | NR | ++ | NR | NR | |
| Kwieciński and Nowak (2009) | 1 | Elevated plus maze Vogel conflict drinking test | 3 | NR | NR | ++ | NR | ++ | NR | NR | |
| Leung et al. (1982) | 1 | Open‐field test non‐injected | 3 | NR | NR | ++ | NR | + | NR | NR | |
| McDougall et al. (2008) | 1 | Rotarod test Fixed and progressive ratio tests | 3 | NR | NR | ++ | NR | −− | NR | NR | ++ |
| Molina et al. (2011) | 1 |
Elevate Pluz maze |
2 | + | NR | ++ | NR | − | + | NR | + |
| Muthaiah et al. (2016) | 1 | Distortion product otoacoustic emissions (DPOE) Compound action potential (CAP) Auditory brainstem response (ABR) Cochleogram | 2 | + | NR | ++ | NR | + | NR | NR | |
| Nachtman et al. (1986) | 1 | Locomotor activity at 5 weeks Locomotor activity with d‐amphetamine at 14 and 65 weeks | 3 | NR | NR | NR | NR | ++ | NR | NR | |
| Nkpaa, Amadi, Wegwu, and Farombi (2019) | 1 | Open‐field test Forelimb grip test Negative Geotaxis | 2 | + | NR | − | + | + | + | NR | |
| Nkpaa et al. (2019) | 1 | Morris water maze | 2 | + | NR | + | NR | − | + | NR | |
| Nkpaa et al. (2022) | 1 | Locomotive activities | 2 | + | NR | + | NR | ++ | + | NR | |
| Nowak et al. (2011) | 1 | Oral activity Yawning behaviour Stereotyped behaviour | 3 | NR | NR | + | NR | + | NR | NR | NR |
| Oner and Sentürk (1995) | 1 | T‐maze | 2 | NR | NR | NR | NR | ++ | + | NR | |
| Su et al. (2017) | 1 | Morris Water Maze Test | 2 | + | NR | ++ | NR | + | ++ | NR | |
| Sun et al. (2020) | 1 | Morris water maze | 3 | NR | NR | NR | NR | NR | NR | NR | |
| Takács et al. (2012) | 1 | Open‐field ECoG | 3 | NR | NR | NR | NR | + | NR | NR | |
| Wang et al. (2020) | 1 | Locomotive activities | 2 | + | NR | + | NR | + | NR | NR | |
| Zhang et al. (2021) | 1 | Sunflower seed‐eating test Beam walking test | 2 | + | NR | ++ | NR | + | NR | NR | |
| Kern and Smith (2011) | 2 | Open arena | 3 | NR | NR | ++ | NR | + | NR | NR | |
| Kern et al. (2010) | 2 | Open arena 8‐arm radial maze | 3 | NR | NR | ++ | NR | + | NR | NR | |
| Bonilla (1984) | 2 | Behavioural testing ‐ Motor function | 3 | NR | NR | + | NR | + | NR | NR | |
| Studies in mice | |||||||||||
| Foster et al. (2018) | 2 | Motor function | 2 | + | −− | + | NR | −− | + | NR |
++ |
| Moreno et al. (2009) | 2 | Open‐field | 2 | NR | NR | ++ | NR | − | + | NR | |
| Ohgami et al. (2016) | 2 | Hearing measurements (ABR) | 2 | NR | NR | ++ | NR | + | + | − | |
| Yang et al. (2021) | 3 | Rotarod test Morris water maze test | 2 | + | NR | ++ | NR | ++ | + | NR | |
| Biswas et al. (2019) | 1 | Elevated plus maze | 2 | NR | NR | + | NR | ++ | + | NR | |
| Biswas et al. (2019) | 1 | Morris water maze | 2 | NR | NR | + | NR | ++ | + | + | |
| Chepukosi et al. (2021) | 1 | Rapid murine comma and behaviour scale | 2 | + | NR | + | NR | + | NR | NR | |
| Freeman et al. (2020) | 1 | Beam traversal test Cylinder test | 2 | NR | NR | + | NR | + | + | + | |
| Freeman et al. (2020) | 1 | Rotarod test | 2 | NR | NR | + | NR | + | + | NR | |
| Hill et al. (2015) | 1 | Tube test Marble burying 3‐chambered box Nest building | 2 | + | NR | + | NR | + | + | NR | ++ |
| Kim et al. (2017) | 1 | Open‐field | 2 | NR | NR | NR | NR | NR | + | NR | |
| Krishna et al. (2014) | 1 | Open‐field Grip strength Forced swim test Pole test | 2 | NR | NR | ++ | NR | + | NR | + | |
| Wilcox et al. (2022) | 1 | Elevated zero maze Locomotor activity Grip strength Rotarod | 2 | + | NR | ++ | NR | + | NR | NR | |
| Wilcox et al. (2022) | 1 | Y‐maze Nest building | 2 | + | NR | ++ | NR | + | NR | + | |
| Anjum et al. (2019) | 1 | Elevated plus maze Morris water maze | 3 | NR | NR | ++ | NR | − | NR | NR | |
| Chandra et al. (1979) | 1 | Locomotor activity | 3 | NR | NR | ++ | NR | + | NR | NR | |
| Komura and Sakamoto (1991) | 1 | Motor function | 3 | NR | NR | ++ | NR | + | NR | NR | |
| Komura and Sakamoto (1992) | 1 | Motor function | 3 | NR | NR | + | NR | + | NR | NR | |
| Peneder et al. (2011) | 1 | Motor function | 3 | NR | NR | + | NR | + | NR | NR | |
| Streifel et al. (2012) | 1 | Open‐field Elevated plus maze | 3 | NR | NR | ++ | NR | + | NR | NR | NR |
| Studies in primates | |||||||||||
| Golub et al. (2005) | 2 | Motor function (1–14 weeks) Automated activity monitoring (4 and 8 months) Dyadic social interactions (1 to 5.5 months) | 3 | NR | NR | ++ | NR | + | NR | NR | |
Expert judgement was translated into a rating scale for each question to be answered as follows: (++): definitely low RoB; (+): probably low RoB; (NR): not reported; (−): probably high RoB; (− −): definitively high RoB.
APPENDIX C. EVIDENCE TABLE FOR HUMAN STUDIES
C.1.
|
Author, year Country Study design Follow‐up Funding |
Original cohort (N total) Exclusion criteria Study population (n) |
Ascertainment of outcome |
Exposure groups n/person‐years Exposure assessment method |
Mean scores | Model covariates | Results |
|---|---|---|---|---|---|---|
|
Nascimento et al. (2015, 2016) Brazil CS Funding: public |
N = 90 Population sample: Children from two different areas, rural and urban recruited through school principals Exclusion criteria: NR n for NEUPSILIN‐Inf battery = 63 (rural: 43, urban: 20) n for RCPM test = 59 (rural: NR, urban: NR) Sex (% girls): 49 Age: 6–12 y |
Neuropsychological functions assessed by the Brazilian Child Brief Neuropsychological Assessment Battery NEUPSILIN‐Inf, composed of Attention, Perception, Working Memory, Phonological Awareness, Written Language and Executive Function Raven's Coloured Progressive Matrices (RCPM) test (nonverbal IQ) |
Mean (min‐max) water manganese (WMn) concentration (mg/L) Rural area: 0.02 (0.00003–0.28) Urban area: 0.001 (0.001–0.002) Water collected from tap in children's homes and Mn measured by ICP‐MS |
Mean (SEM) scores Attention Rural: 44.7 (1.4) Urban: 49.6 (1.3) Perception Rural: 3.4 (0.2) Urban: 3.8 (0.1) Working memory Rural: 24.3 (3.9) Urban: 34.3 (3.9) Phonological awareness Rural: 5.4 (0.8) Urban: 8.4 (0.7) Language Rural: 50.9 (4.2) Urban: 59.5 (3.7) Go/no go task Rural: 54.5 (3.8) Urban: 53.7 (3.2) Non verbal IQ Rural: 39.1 (3.5) Urban: 64.2 (4.6) |
IQ, age, gender and parents' education |
Change in NEUPSILIN‐Inf scores by WMn increase (mg/L) Word/nonword reading: β = −0.307, p = 0.019 Word/nonword written: β = −0.253, p = 0.045 Written language: β = −0.361, n = 0.007 Language: β = −0.390, p = 0.002 Executive function: β = −0.547, p = 0.001 Visual attention, perception, working memory and phonological awareness: no association. Spearman's correlation between WMn and nonverbal IQ score: r = −0.317, p = 0.014 |
|
Bouchard et al. (2011) Canada CS Funding: public |
N = 696 Population sample: Children living in the same house for > 3 months, in eight municipalities in Quebec, Canada, where presence of Mn is naturally elevated (2007–2009) Exclusion criteria: NR n = 362 (52% participation rate) Sex (% girls): 54 Age [mean (SD)]: 9.3 y (1.8) |
Children's cognitive abilities assessed with WASI (Verbal IQ, Performance IQ and Full‐scale IQ) |
Median/arithmetic mean/geometric mean (P5, P95) WMn (mg/L): 0.031/0.098/0.020 (0.005, 0.255) Median (P5, P95) Mn intake from water consumption (mg/kg bw per month): 0.008 (0, 0.286) Median (P5, P95) Mn intake from diet (mg/kg bw per month): 2.335 (0.840, 6.418) Water sampled directly from kitchen tap of children's homes and Mn measured with ICP‐MS Mn intake estimated from diet and water consumption with orally administered semiquantitative FFQ answered by parent and child |
NR |
Model 1: maternal education, maternal nonverbal intelligence, family income, home stimulation score and family structure Model 2: model 1 + sex and age of child, IQ testing session time, source of water and iron concentration in tap water |
Change in IQ for a 10‐fold increase in WMn (log 10 ‐transformed) β (95% CI) Full‐scale IQ Unadjusted model: −2.1 (−3.5, −0.8) Model 1: −1.9 (−3.1, −0.7) Model 2: −2.4 (−3.9, −0.9) Performance IQ Unadjusted model: −2.4 (−4.0, −0.7) Model 1: −2.3 (−3.7, −0.8) Model 2: −3.1 (−4.9, −1.3) Verbal IQ Unadjusted model: −1.4 (−2.6, −0.2)* Model 1: −1.5 (−2.6, −0.3) Model 2: −1.2 (−2.7, 0.3) *p < 0.05, **p < 0.01 Change in IQ per 10‐fold increase Mn intake from water consumption (log 10 ‐transformed) β (95% CI) Full‐scale IQ Unadjusted model: −1.3 (−2.5, −0.2) Model 1: −1.2 (−2.3, −0.1) Model 2: −1.2 (−2.3, −0.1) Performance IQ Unadjusted model: −1.6 (−3.0, −0.3) Model 1: −1.6 (−2.9, −0.3) Model 2: −1.9 (−3.3, −0.4) Verbal IQ Unadjusted model: −0.7 (−1.7, 0.3) Model 1: −0.6 (−1.6, 0.3) Model 2: −0.3 (−1.4, 0.7) *p < 0.05, **p < 0.01 No relationship with Mn intake from diet |
|
Oulhote et al. (2014) Canada CS Funding: public |
N = 696 Population sample: Children living in the same house for > 3 months, in eight municipalities in Quebec, Canada, where presence of Mn is naturally elevated (2007–2009) Exclusion criteria: NR N = 375 Sex (% girls): 53 Age: 6–13 y |
Children's cognition assessed with CVLT‐C (memory), CPT II (sustained attention), Digit Span (working memory) Children's motor function evaluated with Santa Ana Pegboard test and manual Finger tapping Children's behaviour evaluated Conners' Rating Scales completed by a teacher (CRS‐T) and a parent (CRS‐P) |
Arithmetic mean/geometric mean (range) WMn (mg/L): 0.099/0.020 (0.001–2.791) Geometric mean (range) Mn intake from water consumption (mg/kg bw per month): 0.0055 (0–1.059) Mn concentration measured, by ICP‐MS, in home tap water samples. Mn intake estimated from diet and water consumption with orally administered semiquantitative FFQ answered by parents and children |
NR | Child's sex, age, maternal education, maternal nonverbal intelligence, family income, maternal depressive symptoms and tap water lead concentrations |
Change in outcome per 10‐fold increase in WMn (log 10 ‐transformed) β (95% CI) Memory: −1.0 (−1.6, −0.4), p < 0.01 Attention: 0.5 (−0.4, 1.3), p = 0.31 Motor function: −1.2 (−2.7, 0.3), p = 0.11 Hyperactivity: −0.2 (−1.2, 0.8) p = 0.71 Change in outcome per 10‐fold increase Mn intake from water consumption (log 10 ‐transformed) β (95% CI) Memory: −0.4 (−0.9, 0.1), p = 0.13 Attention: 0.1 (−0.6, 0.8), p = 0.80 Motor function: −1.13 (−2.4, −0.2), p = 0.02 Hyperactivity: 0.2 (−0.5, 0.9), p = 0.51 |
|
Dion et al. (2016) Canada CS Funding: public |
N = 362 Population sample: Children living in the same house for > 3 months, in 8 municipalities in Quebec, Canada, where presence of Mn is naturally elevated (2007–2009). Among the initial sample (Oulhote et al., 2014), children were selected based on the concentration of manganese in the tap water of their house. Exclusion criteria: families who had moved or changed source of drinking wter after the initial study. n = 13 children consuming water with manganese concentration < 0.030 mg/L (‘low exposure’ (LE) group) and 10 children consuming water with manganese concentration > 0.100 mg/L (‘high exposure’ (HE) group) Sex (% girls): 60 Age [mean (SD)]: 12.5 y (1.3) and 11.9 y (1.9) |
MRI measurements: a standard pallidal index and a pericranial pallidal index were calculated, based on the signal intensity ratio of the globus pallidus relative to the frontal white matter or the pericranial muscles, respectively, on T1‐weighted images |
Mean (SD) WMn (mg/L) LE group: 0.0009 (0.009) HE group: 0.145 (0.054) Mean (SD) manganese intake from water consumption (mg/month/kg) LE group: 0.0006 (0.0006) HE group: 0.058 (0.087) Mn concentration measured, by ICP‐MS, in home tap water samples. Mn intake estimated from water consumption with orally administered questionnaire answered by the child with parents help |
None |
Mean ranks in LE group versus HE group (p‐value for group comparison by Mann–Whitney U tests) Standard pallidal index: 12.9 versus 10.8, p = 0.5 Paricranial pallidal index: 14.9 versus 8.2, p = 0.02 T1 relaxation time: 9.7 versus 15.0, p = 0.07 |
|
|
Dion et al. (2018) Canada PC Follow‐up time 4–5 years Funding: public |
N = 380 Population sample: Children in Quebec recruited in Bouchard et al. (2011) in 2007–2009, invited for a follow‐up in 2012–2013 Exclusion criteria: NR n = 287 Sex (% girls): 53 Age [mean (SD)]: 13.7 y (1.8) |
Children's cognitive abilities assessed with WASI (Verbal IQ, Performance IQ and Full‐scale IQ) |
Arithmetic mean/geometric mean (range) WMn (mg/L) at follow‐up: 0.058/0.015 (0.0002–0.961) Water was sampled directly from kitchen tap of children's homes and Mn measured with ICP‐MS Parents were interviewed to collect information on water supply to the house, including changes from original study Analyses used baseline MnW and a time‐averaged MnW (TAWMn), taking into consideration changes to water supply made in‐between studies |
NR | Maternal nonverbal intelligence, maternal education and family income |
Change in IQ scores per 10‐fold increase in baseline WMn (log 10 ‐transformed) β (95% CI) for boys/girls Full‐scale IQ Unadjusted: 2.4 (0.1, 4.8)/−2.1 (−4.0, −0.3) Adjusted: 2.4 (0.3, 4.6)/−2.3 (−4.1, −0.6) Performance IQ Unadjusted: 3.8 (1.1, 6.5)/−2.9 (−5.0, −0.8) Adjusted: 3.9 (1.4, 6.4)/−2.8 (−4.8, −0.8) Verbal IQ Unadjusted: 1.1 (−1.7, 3.9)/−1.4 (−3.6, 0.9) Adjusted: 1.0 (−1.7, 3.7)/−1.9 (−4.2, 0.3) #p < 0.1, * p < 0.05, **p < 0.01 Change in IQ scores per 10‐fold increase in TAWMn (μg/L) β (95% CI) for boys/girls Full‐scale IQ Unadjusted: 0.5 (−1.9, 2.9)/−2.0 (−4.0, 0.0) Adjusted: 0.3 (−1.9, 2.5)/−2.5 (−4.5, −0.7) Performance IQ Unadjusted: 1.5 (−1.3, 4.4)/−2.7 (−4.9, −0.5) Adjusted: 1.4 (−1.2, 4.0)/−3.1 (−5.2, −1.0) Verbal IQ Unadjusted: −0.6 (−3.4, 2.3)/−1.3 (−3.7, 1.2) Adjusted: −0.7 (−3.5, 2.0)/−2.1 (−4.4, 0.3) #p < 0.1, * p < 0.05, **p < 0.01 |
|
Bouchard et al. (2018) Canada CS Funding: unclear |
N = 307 Population sample: Children from 10 schools in rural areas of New Brunswick, Canada (2010–2012) Exclusion criteria: Children whose house was connected to municipal aqueduct and children who had been living in the current house <4 months or did not drink tap water N = 259 Sex (% girls): 51 Age [mean (range)]: 9.4 y (5.9–13.7) |
IQ assessed with four sub‐tests of WISC‐IV (Verbal IQ, Performance IQ and Full‐scale IQ) |
Median/arithmetic mean/geometric mean (range) WMn in home water (mg/L): 0.005/0.062/0.006 (0–1.046) WMn in school's water fountains < 0.060 mg/L in all schools except one in which it was 0.532 mg/L Mn concentration measured, by ICP‐MS, in home tap water samples and school's water fountains |
Mean (SD) scores Full‐Scale IQ: 101.2 (12.9) Verbal IQ: 101.4 (11.8) Performance IQ: 100.6 (13.9) |
Child's age, maternal nonverbal intelligence, maternal education, family income, IQ tester |
Change in IQ scores per 10‐fold increase in WMn (log 10 ‐transformed) β (95% CI) Full‐Scale IQ All: −0.58 (−2.27, 1.12) Boys/girls: −6.75 (−17.22, 3.72)/−1.29 (−3.21, 0.63) Verbal IQ All: −0.99 (−2.48, 0.05) Boys/girls: −2.41 (−11.63, 6.81)/−0.88 (−2.78, 1.01) Performance IQ All: 0.12 (−1.68, 1.91) Boys/girls: 1.99 (−0.75, 4.72)/−1.13 (−3.21, 0.95) |
|
Rahman et al. (2017) MINIMat Bangladesh CS and PC Follow‐up 10 years Funding: public |
N = 1607 Population sample: Mother–child cohort initially nested in a randomised food and micronutrient supplementation trial (MINIMat) conducted in pregnant women living in Matlab, in rural Bangladesh. Singleton children born between 2002 and 2003 were invited for a follow‐up examination after 10 years Exclusion criteria: NR n = 1265 Sex (% girls): 48 Age [mean (SD)]: 9.5 y (0.1) |
Cognitive functions assessed with WISC‐IV (all sub‐tests) at 10 years of age Behaviour assessed using a 25‐item, parent‐reported SDQ at 10 years of age |
Median (P5, P95) WMn During pregnancy (n = 1265): 0.204 (0.023, 2.494) At 5 y (n = 1162): 0.228 (0.0082, 2.605) At 10 y (n = 1530): 0.339 (0.004, 3.203) Drinking water sampled during pregnancy and after 5 and 10 years Mn measured by ICP‐MS |
Mean (SD) WISC‐IV scores Full‐Scale IQ: 131 (34) SDQ scores Conduct: 2.9 (1.7) Attention: 4.5 (1.7) Relationships: 2.1 (1.3) Emotional: 1.6 (1.4) Prosocial: 6.6 (1.8) |
Model 1: age and gender Model 2: mother's IQ, socioeconomic status, child age, gender, education, height for age at 10y, haemoglobin concentration, school type, Home Observation for Measurement of Environment (HOME), tester, number of siblings and urinary As concentrations at each respective timepoint (natural log–transformed) |
No association between IQ and WMn exposure during pregnancy and at 5 and 10 y of age Estimates: β (95% CI) Exposure during pregnancy (n = 554) Full‐Scale IQ: 0.42 (−1.6, 2.5) Verbal: 0.070 (−0.62, 0.76) Perceptual reason: 0.16 (−0.65, 0.96) Working memory: 0.072 (−0.33, 0.47) Processing speed: 0.12 (−0.64, 0.88) In boys (n = 288) Full‐Scale IQ: −1.8 (−5.3, 1.7) Verbal: −0.62 (−1.8, 0.53) Perceptual reason: −0.22 (−1.6, 1.2) Working memory: −0.32 (−1.0, 0.39) Processing speed: −0.64 (−1.9, 0.59) In girls (n = 266/n = 27) Full‐Scale IQ: 5.2 (1.8, 8.6)/−5.4 (−13, 2.0) Verbal: 1.5 (0.31, 2.6)/−1.7 (−4.2, 0.81) Perceptual reason: 1.4 (0.03, 2.7)/1.3 (−4.2, 1.5) Working memory: 0.7 (0.08, 1.4)/−0.5 (−1.9, 0.88) Processing speed: 1.6 (0.29/3.0)/−1.9 (−4.8, 1.0) Exposure at 5y (n = 705) Full‐Scale IQ: −0.37 (−2.3, 1.5) Verbal: −0.10 (−0.73, 0.52) Perceptual reason: 0.10 (−0.64, 0.84) Working memory: −0.043 (−0.43, 0.34) Processing speed: −0.32 (−1.0, 0.40) In boys (n = 345) Full‐Scale IQ: −3.2 (−6.4, 0.065) Verbal: −0.88 (−1.9, 0.17) Perceptual reason: −1.1 (−2.3, 0.18) Working memory: −0.70 (−1.4, −0.022) Processing speed: −0.52 (−1.7, 0.67) In girls (n = 350) |
|
Full‐Scale IQ: 0.92 (−1.4, 3.3) Verbal: 0.26 (−0.53, 1.0) Perceptual reason: 0.65 (−0.27, 1.6) Working memory: 0.38 (−0.074, 0.84) Processing speed: −0.37 (−1.3, 0.57) Exposure at 10y (n = 801) Full‐Scale IQ: 0.18 (−1.3, 1.6) Verbal: −0.33 (−0.81, 0.15) Perceptual reason: −0.050 (−0.63, 0.53) Working memory: 0.12 (−0.17, 0.40) Processing speed: 0.44 (−0.13, 1.0) In boys (n = 406) Full‐Scale IQ: −0.56 (−3.0, 1.8) Verbal: −0.59 (−1.4, 0.17) Perceptual reason: −0.35 (−1.3, 0.60) Working memory: −0.058 (−0.53, 0.41) Processing speed: 0.44 (−0.44, 1.3) In girls (n = 395) Full‐Scale IQ: 0.70 (−1.2, 2.6) Verbal: −0.16 (−0.78, 0.46) Perceptual reason: 0.17 (−0.55, 0.90) Working memory: 0.23 (−0.13, 0.59) Processing speed: 0.45 (−0.31, 1.2) OR (95% CI) for raised conduct problems per 0.001 mg/L increase in WMn Exposure in pregnancy: 1.20 (1.04, 1.39), p = 0.013 5 y: 1.20 (1.03, 1.39), p = 0.016 10 y: 1.17 (1.04, 1.31). p = 0.007 |
||||||
|
Wasserman et al. (2006) HEALS Bangladesh CS Funding: unclear |
N = 11,749 Population sample: Children who had been drinking water low in As (< 0.01 mg/L) and high in Mn. Recruited in two phases (2002 and 2004) Exclusion criteria: Children who had taken part in a previous study or had siblings (Wasserman, 2004) n = 142 Sex (% girls): 50 Age: 9.5–10.5 y |
IQ assessed with WISC‐III (Verbal IQ, Performance IQ and Full‐scale IQ) |
Mean (SD) WMn (mg/L): 0.795 (0.755) Mn measured in well water by ICP‐MS |
Mean (SD) scores Full‐scale IQ: 71.2 (22.9) Verbal IQ: 15.9 (5.4) Performance IQ: 55.4 (18.9) |
Maternal education, maternal intelligence, house type, TV access, height and head circumference |
Association between IQ score and WMn (μg/L). β (unstandardised) Full‐Scale IQ Unadjusted: −5.20, p < 0.001 Adjusted: −4.35, p < 0.001 Performance IQ Unadjusted: −4.43, p < 0.001 Adjusted: −3.76, p < 0.001 Verbal sIQ Unadjusted: −0.80, p < 0.05 Adjusted: −0.63, p < 0.05 |
|
Wasserman et al. (2011) HEALS Bangladesh CS Funding: public |
N ∼ 12,000 (HEALS adult cohort) Population sample: Children from adult participants of the HEALS cohort. Household were visited until ~75 children in each of four categories of WAs x WMn exposure had been enrolled (i.e. WAs < or >0.010 mg/L and WMn < or >0.500 mg/L) Exclusion criteria: twins and share the same as other participants n = 303 [Low As‐Low Mn (n = 77); Low As‐High Mn (n = 74); High As‐Low Mn (n = 73); High As‐High Mn (n = 79)] Sex (% girls): 50 Age [mean (SD)]: 9.64 (0.77) |
Children's cognitive ability assessed with WISC‐IV; a Full‐Scale score (not standardised; calculated as the sum of all scores) and scores for specific cognitive domains (verbal comprehension, perceptual reasoning, working memory and processing speed) were analysed |
Mean (SD) WMn (mg/L) Overall: 0.726 (0.730) Low As‐Low Mn: 0.202 (0.145) Low As‐High Mn: 1.111 (0.686) High As‐Low Mn: 0.184 (0.146) High As‐High Mn: 1.367 ± 0.692 Mn measured in drinking water wells and analysed with high resolution ICP‐MS |
Mean (SD) scores Full‐Scale IQ 108.50 (31.32) Verbal Comprehension 23.80 (8.77) Perceptual Reasoning 31.24 (11.24) Working Memory 20.25 (6.06) Processing Speed 33.21 (13.48) |
N/A |
Mean (SD) raw scores by WAs x WMn categories Full‐Scale Low As‐Low Mn: 107.39 (30.90) Low As‐High Mn: 107.73 (27.34) High As‐Low Mn: 110.74 (32.51) High As‐High Mn: 108.22 (34.45) Verbal Comprehension Low As‐Low Mn: 25.56 (8.32) Low As‐High Mn: 22.93 (7.91) High As‐Low Mn: 23.82 (8.41) High As‐High Mn: 23.85 (10.26) Perceptual Reasoning Low As‐Low Mn: 30.21 (10.61) Low As‐High Mn: 30.69 (10.16) High As‐Low Mn: 32.86 (10.53) High As‐High Mn: 31.25 (13.30) Working Memory Low As‐Low Mn: 20.05 (5.79) Low As‐High Mn: 20.28 (6.01) High As‐Low Mn: 20.42 (6.87) High As‐High Mn: 20.24 (5.66) Processing Speed Low As‐Low Mn: 32.57 (12.12) Low As‐High Mn: 33.82 (11.35) High As‐Low Mn: 33.63 (13.46) High As‐High Mn: 32.87 (13.07) |
|
Khan et al. (2012) Bangladesh CS Funding: public |
N = 1925 Population sample: Subjects were recruited through 14 different school in Araihazar, a rural area of Bangladesh Exclusion criteria: Twins, disability orchronic disease. n = 840 [952 children from initial sample randomly selected, of which 840 children agreed to participate] Sex (% girls): 53 Age [median (range)]: 9.3 (8.0–11.0) |
Children's annual scores from the academic achievement records in their school was obtained for three disciplines (Bangla, English and mathematics) |
Mean (SD; range) WMn in wells (mg/L): 1.388 (0.866; 0.01–5.710) Mn measured in well water from children's homes and schools and analysed by ICP‐MS |
Model 1: arsenic water concentration (Was) Model 2: log‐transformed WAs, school‐grade, maternal education, paternal education and head circumference and controlling for within‐teacher correlations in rating the children |
Associations between WMn (> 0.400 vs. ≤0.400 mg/L) and academic scores β (95% CI) Bangla Language score Model 1: −0.16 (−5.45, 5.12) Model 2: −1.01 (−6.14, 4.12) English Language score Model 1: −2.33 (−6.93, 2.24) Model 2: −2.66 (−7.16, 1.83) Math score Model 1: −6.67 (−13.42, 0.25) p < 0.06 Model 2: −6.37 (−12.27, −0.46) p < 0.05 Adjusted mean (SEM) academic scores by categories of WMn Bangla Language score ≤ 0.400: 49.8 (3.1) 0.401–1.000: 48.1 (2.1) 1.001–1.440: 49 (2.1) 1.441–2.000: 48.1 (1.6) 2.001–6.000: 48.8 (2.1) English Language score ≤ 0.400: 51.3 (3.2) 0.401–1.000: 46.9 (1.9) 1.001–1.440: 49.3 (2.4) 1.441–2.000: 49.3 (1.7) 2.001–6.000: 48.8 (2.4) Math score ≤ 0.400: 58.9 (3.7) 0.401–1.000: 51.7 (1.9) 1.001–1.440: 52.8 (2.1) 1.441–2.000: 53.5 (1.7) 2.001–6.000: 53.0 (2.1) |
|
|
Parvez et al. (2011) HEALS Bangladesh CS Funding: unclear |
N ∼ 12,000 (HEALS adult cohort) Population sample: Children from adult participants of the HEALS cohort. Household were visited until ~ 75 children in each of four categories of WAs x WMn exposure had been enrolled (i.e. WAs < or > 0.010 mg/L and WMn < or > 0.500 mg/L) Exclusion criteria: twins and share the same as other participants. n = 303 [Low As‐Low Mn (n = 77); Low As‐High Mn (n = 74); High As‐Low Mn (n = 73); High As‐High Mn (n = 79)] Sex (% girls): 50 Age [mean (SD)]: 9.64 (0.77) |
Motor function was assessed with BOT 2nd edition |
Mean (SD) WMn (mg/L) Overall: 0.726 (0.730) Low As‐Low Mn: 0.202 (0.145) Low As‐High Mn: 1.111 (0.686) High As‐Low Mn: 0.184 (0.146) High As‐High Mn: 1.367 ± 0.692 Mn measured in drinking water wells and analysed with high resolution ICP‐MS |
Mean (SD) Fine Manual Control 42.3 (8.6) Manual Coordination 38.9 (7.3) Body Coordination 41.3 (6.0) Strength and Agility 37.4 (3.7) Total Motor Composite 160.0 (18.5) |
N/A |
Mean (SD) BOT scores by WAs x WMn categories (p for ANOVA) Fine Manual Control Low As‐Low Mn: 43.7 (7.6) Low As‐High Mn: 42.8 (9.6) High As‐Low Mn: 41.7 (8.8) High As‐High Mn: 41.2 (8.2) p = 0.26 Manual Coordination Low As‐Low Mn: 39.7 (6.9) Low As‐High Mn: 39.2 (7.8) High As‐Low Mn: 38.4 (8.2) High As‐High Mn: 38.2 (6.4) p = 0.56 Body Coordination Low As‐Low Mn: 42.7 (5.9) Low As‐High Mn: 41.2 (6.0) High As‐Low Mn: 41.2 (6.5) High As‐High Mn: 40.0 (5.7) p = 0.07 Strength and Agility Low As‐Low Mn: 37.7 (3.7) Low As‐High Mn: 37.5 (3.5) High As‐Low Mn: 37.3 (3.9) High As‐High Mn: 37.2 (3.8) p = 0.81 Total Motor Composite Low As‐Low Mn: 162.5 (17.3) Low As‐High Mn: 161.2 (19.8) High As‐Low Mn: 159.2 (19.8) High As‐High Mn: 157.2 (17.2) p = 0.33 |
|
Miyake et al. (2021) KOMCHS Japan PC Follow‐up 5 years Funding: mixed |
N = 1757 Population sample: Mother–child pairs who lived on eight prefectures in Japan in 2007–2008. They were recruited through hospitals Exclusion criteria: NR n = 1199 Sex (% girls): 53 Maternal age (mean): 32 |
Childhood behavioural problems assessed at 5 years of age using Japanese parent–report version of the Strengths and Difficulties Questionnaire (SDQ) which has five scales: emotional problems, conduct problems, hyperactivity, peer problems and prosocial scale |
Median (IQR) Mn intake (mg/day): 3.6 (2.8–4.5) Quartile median Mn intake (mg/day) Q1: 2.4 Q2: 3.2 Q3: 4.0 Q4: 5.2 Dietary intake assessed with semi‐quantitative diet history questionnaire |
Overall prevalence of emotional problems, conduct problems, hyperactivity problems, peer problems and low prosocial behaviour was 12.9%, 19.4%, 13.1%, 8.6% and 29.2%, respectively % cases in each quartile Emotional Problems: 13.7, 14.7, 13.3, 10.0 Conduct Problems: 19.4, 19.0, 22.0, 17.3 Hyperactivity Problems: 12.7, 16.0, 11.0, 12.7 Peer Problems: 10.4, 7.7, 9.0, 7.3 Low prosocial behaviour: 31.8, 32.0, 27.3, 25.7 |
Maternal age, gestation at baseline, region of residence at baseline, number of children at baseline, maternal and paternal education, household income, maternal depressive symptoms during pregnancy, maternal alcohol intake during pregnancy, maternal smoking during pregnancy, child's birth weight, child's sex, breastfeeding duration and smoking in the household during the first year of life. Model for Emotional problems is additionally adjusted for maternal intake of vitamin B2 and calcium. Model for Hyperactivity problems is additionally adjusted for maternal vitamin C, B2 and calcium. Model for Prosocial behaviour is additionally adjusted for maternal B2, vitamin V and folate. |
Odds ratios (95% CI) for behavioural problems by quartile of maternal Mn intake during pregnancy. Emotional Problems Q1: ref Q2: 1.16 (0.71, 1.89) Q3: 1.03 (0.62, 1.71) Q4: 0.76 (0.42, 1.38) p per tend = 0.39 Conduct Problems Q1: ref Q2: 0.97 (0.64, 1.48) Q3: 1.28 (0.85, 1.93) Q4: 0.86 (0.56, 1.32) p per tend = 0.83 Hyperactivity Problems Q1: ref Q2: 1.45 (0.89, 2.36) Q3: 1.06 (0.62, 1.79) Q4: 1.35 (0.79, 2.32) p per tend = 0.52 Peer Problems Q1: ref Q2: 0.70 (0.39, 1.25) Q3: 0.89 (0.51, 1.55) Q4: 0.72 (0.39, 1.29) p per tend = 0.41 Low prosocial behaviour Q1: ref Q2: 1.08 (0.75, 1.56) Q3: 0.99 (0.67, 1.45) Q4: 0.98 (0.64, 1.49) p per tend = 0.83 |
|
Khan et al. (2011) HEALS Bangladesh CS Funding: public |
N ∼ 12,000 (HEALS adult cohort) Population sample: Children from adult participants of the HEALS cohort; 772 children randomly selected; children who attended one of 10 elementary schools in the HEALS study area Exclusion criteria: Family had moved or wasn't home at the time of visit, shared same wells as other participants; ill or disabled children, twin siblings, irregular school attendance, family had switched wells since initial visit or refusing to participate n = 201 Sex (% girls): 50 Age [median (range)]: 9.6 y (8.0–10.9) |
Children's classroom behaviour assessed with teacher reported CBLC‐TRF standardised form. Two subscales from internalising domain (anxious/depressed and withdrawn), and two from externalising domain (attention problems and aggressive behaviour) were used for the analysis |
Mean/median (SD; range) WMn in wells (mg/L): 0.889/0.650 (0.784; 0.04–3.443) Mn measured in well water from children's homes and analysed by high resolution ICP‐MS |
Mean (SD) score TRF total: 47.8 (18.3) TRF externalising behaviour: 31.7 (14.0) TRF internalising behaviour: 16.7 (6.1) |
Model 1: water arsenic concentration (WAs) Model 2: WAs, sex, maternal education, arm circumference and log‐transformed BMI |
Change in TRF scores per μg/L WMn increase β (95% CI) TRF Total scores Model 1: 2.59, (0.14, 5.02) p = 0.04 Model 2: 3.35 (0.86, 5.83), p = 0.008 TRF externalising scores Model 1: 2.04 (0.26, 3.81), p = 0.02 Model 2: 2.59 (0.81, 4.37), p = 0.004 TRF internalising scores Model 1: 0.60 (−0.11, 1.32), p = 0.10 Model 2: 0.82 (0.08, 1.56), p = 0.03 |
|
Rodrigues et al. (2016) Bangladesh PC Follow‐up max 49 months (from 1st trimester of pregnancy to 20–40‐month age) Funding: public |
N = 812 Population sample: Mother–child pairs in Sirajdikhan and Pabna districts in Bangladesh recruited between 2008 and 2011; when children were 12–40 months, parents were offered to participate in this study Exclusion criteria: NR n = 524 Sex (% girls): 50 Age [median (range)]: 2.3 y (1.8–3.4) |
Neurodevelopmental outcomes assessed at 20–40 months using the BSID‐III tests of cognitive function, receptive language, expressive language, fine motor and gross motor functions |
Median (P25, P75) WMn (mg/L) Sirajdikhan: 1st trimester (n = 239): 0.54 (0.03, 0.96) 1 month (n = 238): 0.56 (0.039, 0.89) 12 months (n = 92): 1.15 (0.217, 2.0) 20–40 months (n = 239): 0.948 (0.164, 1.82) Pabna: 1st trimester (n = 286): 0.5 (0.27, 0.9) 1 month (n = 278): 0.545 (0.34, 1.06) 12 months (n = 99): 0.464 (0.244, 0.891) 20–40 months (n = 286): 0.515 (0.299, 0.969) Water sampled from tube wells used by the family as drinking water and Mn concentration analysed with ICP‐MS. |
NR |
Maternal age, maternal education, child's gender, exposure to second‐hand smoke, HOME score, maternal Raven score and child haematocrit levels. Models used age‐adjusted BSID‐III scores |
Association between natural log WMn (μg/L) and cognitive scores β(SE) Sirajdikhan: 0.02 (0.02), p = 0.35 Pabna: −0.06 (0.07), p = 0.33 Association between natural log WMn and fine motor scores β(SE) Sirajdikhan: −0.04 (0.03), p = 0.21 Pabna: 0.85 (0.39), p = 0.03 No association found with children's scores on receptive and expressive language or gross motor domains (data not shown) |
|
Schullehner et al. (2020) Denmark PC Follow‐up to 19 years Funding: public |
N = 815,810 Population sample: All singletons born in Denmark between 1992 and 2007. Cohort members had to be living in Denmark on their fifth birthday and mothers had to be residents 9 months before giving birth as well as using water source with available data for > 7 months before pregnancy and > 4 years for the children Exclusion criteria: Children given a ADHD diagnoses before 5 years of age, and private well users n = 643,401 Sex (% girls): 49 Age: not reported |
Clinical diagnoses of AHDH were obtained from the Danish Psychiatric Central Research Register and the Danish National Patient Register |
Mn (mg/L) measured in 82,574 drinking water samples from 3509 active public waterworks. Exposure period from 1997 to 2012 Females N by exposure groups (mg/L) < 0.005: 60,501 0.005–0.019: 69,352 > 0.019–0.034: 58,403 > 0.034–0.100: 63,505 > 0.100: 61,652 Exposure groups (time‐weighted average Exposure, mg/L) n: < 0.005: 220,043 0.005–0.01: 31,832 > 0.01–0.025: 31,211 > 0.025: 30,327 Males N by exposure groups (mg/L): < 0.005: 63,144 0.005–0.019: 73,341 > 0.019–0.034: 61,454 > 0.034–0.100: 66,900 > 0.100: 65,149 Exposure groups (time‐weighted average Exposure, mg/L) n: < 0.005: 231312 0.005–0.01: 33631 > 0.01–0.025: 33112 > 0.025: 31933 |
Overall prevalence of ADHD diagnosis was 3.5%, or 22,730 out of 643,401 Female Exposure groups (highest exposure, mg/L) Cases/Person‐years at risk: < 0.005: 1082/535831 0.005–0.01: 1404/735445 > 0.01–0.025: 1355/695611 > 0.025: 1542/810171 Exposure groups (time‐weighted average Exposure, mg/L) n: < 0.005: 4648/2343484 0.005–0.01: 754/417242 > 0.01–0.025: 775/420688 > 0.025: 787/434323 Male Exposure groups (highest exposure, mg/L) Cases/Person‐years at risk: < 0.005: 2856/548913 0.005–0.01: 3301/765728 > 0.01–0.025: 2977/723183 > 0.025: 3168/846375 Exposure groups (time‐weighted average Exposure, mg/L) n: < 0.005: 10878/2427506 0.005–0.01: 1635/434162 > 0.01–0.025: 1654/439435 > 0.025: 1599/451072 |
For the main analysis – age and birth year. Fully adjusted analysis adjustment for maternal education, parental education and urbanicity |
Hazard ratios (95% CI) for the association between time‐weighted average WMn during the first 5 y of life and ADHD‐Overall and ADHD subtypes. ADHD‐Overall (n = 6964) Females WMn < 0.005: ref WMn 0.005–0.01: 0.94 (0.80, 1.10) WMn > 0.01–0.025: 1.11 (0.96, 1.28) WMn > 0.025: 1.11 (0.98, 1.27) p‐trend: 0.055 Males WMn < 0.005: ref WMn 0.005–0.01: 0.96 (0.86, 1.06) WMn > 0.01–0.025: 1.07 (0.97, 1.18) WMn > 0.025 1.02 (0.93, 1.12) p‐trend: 0.33 ADHD‐Inattentive subtype Females WMn < 0.005: ref WMn 0.005–0.01: 1.16 (0.79, 1.72) WMn > 0.01–0.025: 1.53 (1.08, 2.17) WMn > 0.025: 1.31 (0.96, 1.79) p‐trend: 0.011 Males WMn < 0.005: ref WMn 0.005–0.01: 1.06 (0.78, 1.43) WMn > 0.01–0.025: 1.40 (1.06, 1.83) WMn > 0.025: 1.38 (1.08, 1.79) p‐trend: 0.0009 ADHD‐Combined subtype Females WMn < 0.005: ref WMn 0.005–0.01: 1.06 (0.87, 1.29) WMn > 0.01–0.025: 1.09 (0.90, 1.32) WMn > 0.025: 1.19 (1.01, 1.40) p‐trend: 0.038 Males WMn < 0.005: ref WMn 0.005–0.01: 0.92 (0.81, 1.04) WMn > 0.01–0.025: 1.09 (0.97, 1.22) WMn > 0.025: 0.97 (0.88, 1.08) p‐trend: 0.86 |
Abbreviations: ADHD, Attention‐deficit hyperactivity disorder; BSID‐III, Bayley Scales of Infant and Toddler Development, 3rd edition; BOT 2nd, Bruininks‐Oseretsky test, 2nd edition; CBLC‐TRF, Child Behaviour Checklist‐Teacher's Report Form; CI, Confidence Interval; CPT, Conners' Continuous Performance Test II; CS, Cross‐sectional; CRS, Conners' Rating Scale; CVLT‐C, California Verbal Learning Test–Children's Version; FFQ, food frequency questionnaire; HE, high exposure; ICP‐MS, Inductively coupled plasma mass spectrometry; IQ, Intelligence quotient; IQR, Interquartile range; LE, low exposure; Mn, manganese; NR, not reported; PC, Prospective cohort; RCPM, Raven's Coloured Progressive Matrices; SD, Standard deviation; SDQ, Strengths and Difficulties Questionnaire; SEM, Standard Error of the Mean; WAs, water arsenic concentration; WMn, water manganese concentration; WASI, Wechsler Abbreviated Scale of Intelligence; WISC, Wechsler Intelligence Scale for Children y, year.
APPENDIX D. EVIDENCE TABLES FOR ANIMAL STUDIES
D.1. Animal multiple dose‐level studies
Developmental studies
| Reference | Study protocol | Neurobehavioural endpoints | |||||||
|---|---|---|---|---|---|---|---|---|---|
| Motor and sensory function | Learning and memory | Anxiety | |||||||
| Species (strain); No of animals/group |
Dose levels (mg/kg bw per day); Duration; Administration method |
Time of testing; Type of the test |
NOAEL | LOAEL | NOAEL | LOAEL | NOAEL | LOAEL | |
| Overall (administered dose + background exposure) | |||||||||
| (mg/kg bw per day) | (mg/kg bw per day) | (mg/kg bw per day) | |||||||
| Maternal exposure | |||||||||
| Pappas et al. (1997) |
Rats (SD); n = 22 (F1) n = 10 (12‐arm radial maze), 16 (MWM and elevated plus maze) |
0, 119 and 482; Via F0 from GD 1 to PND 22; 0, 81 and 406; From PND 22 to 30; Drinking water |
PND 17; Open‐field PND 90; 12‐arm radial maze, elevated plus maze PND 25 and 95; MWM |
124 (F0) | 487 (in F0) (↑ hyperactivity of F1 in open‐field) | 411 (F1) | – | 411 (F1) | – |
| Oshiro et al. (2022) |
Rats (LE); n = 12–15 (F1) |
0, 180 and 360; Via F0 from GD 7 to PND 22; Drinking water |
PND 34; Open‐field PND 34–37; NOR PND 62: MWM PND 77: DRL |
366 (F0) | – | – | 186 (F0) (↓ attention and decision time/processing speed) | 366 | – |
| Ohishi et al. (2012) |
Rats [Crl:CD®(SD)] n = 8–16 (depending on the test) (F1) |
0, 1, 6 and 29; Via F0 from GD 10 to PND 21; Feed |
Up to PND 21; Surface and air righting, pupillary and pain reflexes PND 55–57; Biel's T‐maze PND 71; Open‐field, grip strength and ASR |
10 (F0) | 15 (F0) (impaired air righting reflex) | 38 | – | ||
| Neonatal exposure | |||||||||
| Tran, Chowanadisai, Crinella, et al. (2002) | Rats (SD) n = 13 |
0, 1.3, 6.1 and 12; From PND 1 to 21; Gavage |
PND 6; Surface righting PND 10; Olfactory orientation PND 32; Passive avoidance |
6 | 12 (↑ mean latency in homing ability) | 12 | – | ||
| Tran, Chowanadisai, Lönnerdal, et al. (2002) |
Rats (SD) n = 8 |
0, 1.3, 6.1 and 12; From PND 1 to 21; Gavage |
PND 50–56; Burrowing detour PND 60–64; Passive avoidance |
12 | – | ||||
| Reichel et al. (2006) |
Rats (SD) n = 8–9 |
0, 5.1 and 15.3; From PND 1 to 21; Micropipette |
PND 8, 10 and 12; Negative geotaxis PND 9, 11 and 13; Olfactory orientation PND 10, 12 and 14; Open‐field PND 91; Balance beam |
15 | – | ||||
| Brenneman et al. (1999) |
Rats (CD) n = 15 |
0, 8.5 and 17; From PND 1 to 21; Per os |
PND 21; Open‐field |
8.5 | 17 (↑ hyperactivity in open‐field) | ||||
| Dorman et al. (2000) | Rats (SD) |
0, 8.5 and 17; From PND 1 to 21; Micropipette |
PND 13, 17 and 21; Open‐field PND 21; ASR, passive avoidance |
– | 8.5 (↑ pulse‐elicit ASR) | ||||
| Kern et al. (2010) |
Rats (SD) n = 15–20 |
0, 25 and 50; From PND 1 to 21; Micropipette |
PND 23; Open‐field, elevated plus maze PND 33–46; 8‐arm radial maze |
25 | 50 (↑ hyperactivity in open‐field) | – | 25 (↓ performance in 8‐arm radial maze & ↑ stereotypic behaviour) | 25 | 50 (↑ disinhibition of exploratory behaviour in open‐field) |
| Kern & Smith (2011) |
Rats (SD) n = 15–20 |
0, 25 and 50; From PND 1 to 21; Micropipette |
PND 97; Open‐field |
50 | – | ||||
| Conley et al. (2020) |
Rats (LE) n = 21–23 |
0, 25 and 50; From PND 1 to 21; Micropipette |
PND 24; Open‐field |
– | 25 (↑ hyperactivity in open‐field) | ||||
| Foster et al. (2018) |
Mice (C57BL/6J) n = 13–28 |
0, 11 and 25; From PND 1 to 28; Micropipette |
PND 19–22 and 29–32; Open‐field |
– | 11 (↓ hypoactivity and total movements in open‐field) | ||||
| Beaudin et al. (2013) |
Rats (LE) n = 11–12 |
‘Early‐life exposure’ 0, 25 and 50; From PND 1–21; Micropipette |
PND 120–150; Montoya staircase |
50 | – | ||||
|
‘Life‐long exposure’ 0, 25 and 50; From PND 1–21, from PND 22 to the end of study; Preweaning: micropipette; Post‐weaning: feed and drinking water |
– | 36 (↓ skilled forelimb performance) | |||||||
| Beaudin, Strupp, Uribe, et al. (2017) |
Rats (LE) n = 21–23 |
‘Early‐life exposure’ 0, 25 and 50; From PND 1–21; Micropipette |
PND 101–121 and 122–133; Focused attention task PND > 100; Selective attention tasks with olfactory distracters |
‐ | 25 (↓ in accurate responses in selective attention task) | ||||
|
‘Life‐long exposure’ 0, 25 and 50; From PND 1–21, from PND 22 to the end of study; Preweaning: micropipette, post‐weaning: feed and drinking water |
‐ | 36 (↓ in accurate responses in selective attention task) | |||||||
| Golub et al. (2005) |
Monkeys (rhesus) n = 8 |
0.02, 0.11 and 0.32; From PND 1 to 120; Milk based formula |
PND 7 to 540; Battery of tests on motor and cognitive function and sociability |
0.32 | – | 0.02 | 0.11 (sleeping pattern) | 0.02 | 0.11 (changes in sociability) |
Abbreviations: ASR, acoustic startle response; bw, body weight; Crl, CD, Charles River Laboratories caesarean‐derived; DRL, differential reinforcement of low rates procedures; F0, founding generation; F1, filial generation; GD, gestational day; LE, Long Evans; LOAEL, lowest‐observed‐adverse‐effect‐level; MWM, Morris water maze; NOR, novel object recognition; NOAEL, no‐observed‐adverse‐effect‐level; PND, post‐natal day; SD, Sprague Dawley.
Neurotoxicity studies
| Reference | Study protocol | Neurobehavioural endpoints | |||||||
|---|---|---|---|---|---|---|---|---|---|
| Motor and sensory function | Learning and memory | Anxiety | |||||||
|
Species (strain); No of animals/group |
Dose levels (mg/kg bw per day); Duration |
Time of testing; Type of the test |
NOAEL | LOAEL | NOAEL | LOAEL | NOAEL | LOAEL | |
| Overall (administered dose + background exposure) | |||||||||
| (mg/kg bw per day) | (mg/kg bw per day) | (mg/kg bw per day) | |||||||
| Exposure by gavage | |||||||||
| Sentürk and Öner (1996) |
Rats (albino) n = 9–10 |
0, 0.4 and 0.7; 30 days |
D 15 and 30; T‐maze |
– | 5.9 | ||||
| Vezér et al. (2005, 2007) |
Rats (Wistar) n = 12–16 |
0, 4 and 16; 70 days (5 days/week, thus 0, 3 and 11 mg/kg bw per day) |
D 35, 70 and D 49 post administration; Open‐field and ASR Weekly and D 21–35 post administration; 8‐arm radial maze |
‐ | 11 (↓ hypoactivity in open‐field and ↓ acoustic startle response) | – | 11 (↓ performance in 8‐arm radial maze) | ||
| Dorman et al. (2000) |
Rats (SD) n = 20 |
0, 8.5 and 17; 21 days |
D 18; Grip strength, pupillary and air righting reflex D 21; Open‐field and ASR, passive avoidance |
– | 17.5 (↓ mean overall AS amplitude) | 26 | – | ||
| Moreno et al. (2009) |
Mice (C57BI/6) n = 11–18 (juvenile) n = 8–10 (adults) |
0, 4 and 13; PND 20–34 (juvenile), PND 84–140 (adults) |
Every 2 days (juvenile), weekly (adults); Open‐field |
30 | – | – | 21 (↑ disinhibition of exploratory behaviour, juvenile males only) | ||
| Yang et al. (2021) |
Mice (C57BL/6) n = 8 |
0, 7, 14 and 28; 90 days |
D 90; Rotarod, MWM |
45 | – | 31 | 45 (↓ in No of platform crossing in MWM) | ||
| Exposure via drinking water | |||||||||
| Torrente, Colomina, and Domingo (2005) |
Rats (SD) n = 15 |
0, 76 and 153; 133 days |
D 133; Open‐field D 140; MWM D 142; Passive avoidance |
161 | – | 84 | 161 (↓ performance in water maze) | 161 | – |
| Avila et al. (2008) | Rats (Wistar) n = 5 |
0, 260 and 629; 30 days |
D 0–30; Open‐field |
– | 268 (↓ hypoactivity in open‐field) | ||||
| Bonilla (1984) |
Rats (SD) n = 8 |
0, 9 and 450; 240 days |
Weekly; Open‐field |
– | 17 (changes in locomotor activity in different directions throughout the duration of the study) | ||||
| Ohgami et al. (2016) |
Mice (WT C57BL/6) n = 10 |
0, 0.3 and 3; 28 days |
D 14; Hearing measurements |
– | 17.3 (hearing loss) | ||||
Abbreviations: ASR, acoustic startle response; bw, body weight; d, day; LOAEL, lowest‐observed‐adverse‐effect‐level; MWM, Morris water maze; NOAEL, no‐observed‐adverse‐effect‐level; PND, post‐natal day; SD, Sprague Dawley; WT, wild‐type.
D.2. Animal single dose‐level studies
| Reference | Study protocol | Neurobehavioural endpoints | |||||||
|---|---|---|---|---|---|---|---|---|---|
| Motor and sensory function and other neurological effects | Learning and memory | Anxiety | |||||||
|
Species (strain); No of animals/group |
Dose levels (mg/kg bw per day); Duration; Administration method |
Time of testing; Type of the test |
NOAEL | LOAEL | NOAEL | LOAEL | NOAEL | LOAEL | |
| (mg/kg bw per day) | (mg/kg bw per day) | (mg/kg bw per day) | |||||||
| Maternal exposure | |||||||||
| Betharia and Maher (2012) |
Rats (SD); n = 11–13 (F1) |
0 and 377; Via F0 from GD 1 to PND 20; Drinking water |
PND 24 and 59; Open‐field |
– | 377 (in F0) (↓ in locomotor activity) | ||||
|
PND 1 to 10; Surface righting reflex |
377 (in F0) | – | |||||||
|
PND 21–25 and 56–60; MWM |
– | 377 (in F0) (impaired memory, females) | |||||||
|
PND 24 and 59; Open‐field; defecation frequency and latency of first occurrence in the ‘core zone’. |
– | 374 (in F0) (↑ anxiety) | |||||||
| Chandra et al. (1979) |
Mice (I.T.R.C. colony); n = 10 |
0 and 270; Via F0 from PND 2 to 25 and post‐weaning until the end of study 0.54 mg/kg bw per day Drinking water |
PND 55, 85, 115, 145, 175 and 205; Open‐field |
270 (F0) | – | ||||
| Hill et al. (2015) | Mice (C57BL/6J) n = 12 |
0 and 8.5; Via F0 from GD 1 to 10.5; Drinking water |
PND 84–140; Nest building, marble burying, three‐chambered social testing apparatus, tube test for social dominance |
– | 8.5 (↓ No of buried marbles, losses in tube test dominance) | ||||
| Kwiecinski and Nowak (2009) |
Rats (Wistar); n = 10 |
0 and 178; Via F0 from GD 1 to PND 1; Drinking water |
PND 84; Elevated plus maze and the Vogel conflict drinking test |
178 (in F0) | – | ||||
| Leung et al. (1982) |
Rats (Wistar); n = 9–10 |
0 and 258; Via F0 from GD 1 to PND 21 and from PND 21 to 80; Drinking water |
PND 80; Open‐field |
258 | – | ||||
| Molina et al. (2011) |
Rats (SD); n = 24 |
0 and 261; Via F0 from GD 1 to PND 24; Drinking water |
PND 24; Elevated plus maze |
– | 261 (in F0) (↓ anxiety‐related behaviour) | ||||
| Neonatal and juvenile exposure | |||||||||
| Amos‐Kroohs et al. (2015) |
Rats (SD); n = 6 |
0 and 29; PND 4 to 28; Post‐weaning 12 mg/kg bw per day Pre‐weaning: gavage Post‐weaning: diet |
PND 29 and 62–66; Open‐field PND 29 or 60; Elevated zero maze |
– | 29 (↑ locomotor activity) | – | 29 (↑ disinhibition of exploratory behaviour at PND 60) | ||
| Amos‐Kroohs et al. (2017) |
Rats (SD); i = 216 in total |
0 and 29; PND 4 to 28; Post‐weaning 12 mg/kg bw per day Pre‐weaning: gavage Post‐weaning: diet |
PND 63 and 65; Straight channel swimming path |
29 | – | ||||
|
PND 64–93; MWM PND 66; CWM |
– | – | 29 (impairments in MWM and CWM) | ||||||
|
PND 30 or 61; Sucrose preference test |
29 | – | |||||||
| Bailey et al. (2019) |
Rats (SD); n = 23 |
0 and 25; PND 4 to 28; Gavage |
PND 70; Straight channel swimming path |
– | 25 (↑ latency to find the platform) | ||||
|
PND 71–90; CWM |
– | 25 (↑ No of errors) | |||||||
|
PND 91–104; MWM |
– | 25 (impaired performance regarding acquisition and reversal latency and path efficiency) | |||||||
|
PND 107–109; Conditioned freezing |
25 | – | |||||||
|
PND 110; Open‐field |
25 | – | |||||||
| Beaudin et al. (2015) |
Rats (LE); n = 10 |
0 and 61; PND 1 to 21; PND 22 to the end of the study providing 61 mg/kg bw per day; Pre‐weaning: micropipette Post‐weaning: feed and drinking water |
PND 110–140; Montoya staircase | – | 61 (↓ skilled forelimb performance) | ||||
| Beaudin, Strupp, Uribe, et al. (2017) |
Rats (LE); n = 10 |
0 and 61; PND 1 to 21; PND 22 to the end of the study providing 61 mg/kg bw per day; Pre‐weaning: micropipette Post‐weaning: feed and drinking water |
PND 107; Baseline attention task and selective attention task with olfactory distractors |
– | 61 (↑ in premature responses) | ||||
| McDougall et al. (2008) |
Rats (SD); n = 24 |
0 and 25; PND 1 to 21; Micropipette |
PND 90; Rotarod |
25 | – | ||||
| Sprowles et al., 2018 |
Rats (SD); n = 56, 175 in control |
0 and 26; PND 4 to 28; Gavage |
PND 62; Open‐field |
26 | – | ||||
|
PND 63; PPI acoustic startle |
– | 26 (↓ V max) | |||||||
|
PND 64; Straight channel swimming path |
26 | – | |||||||
|
PND 65–83; CWM |
26 | – | |||||||
|
PND 83–103; MWM PND 104–105; Cued MWM PND 106–112; MWM cue rotation PND 113–120; MWM with distractor cues |
26 | – | |||||||
|
PND 114; Latent inhibition |
– | 26 (↓ reduced freezing with tone) | |||||||
|
PND 60; Elevated zero maze |
26 | – | |||||||
|
PND 61; Light–dark cycle |
– | 26 (↑ latency to enter dark chamber, only males) | |||||||
| Streifel et al. (2012) |
Mice (C57BL/6, wild‐type); n = 7–10 |
0 and 74; PND 20 to 34; Gavage |
Every second day; Open‐field (motor activity and margin time) |
– | 74 (↑ locomotor activity) | 74 | – | ||
|
PND 34; Elevated plus maze |
73 | – | |||||||
| Su et al. (2017) |
Rats (SD); n = 6 |
0 and 8; D 30; Drinking water |
D 31; MWM |
8 | – | ||||
| Sun et al. (2020) |
Rats (SD); n = unknown |
0 and 10; D 28, 56 and 84; Not reported |
D 28, 56 and 84; MWM |
– | 10 (impaired performance in MWM) | ||||
| Wilcox et al. (2022) |
Mice (wild‐type); n = 6–8 |
0 and 494; PND 21 to |
D 58; Open‐field |
‐ | 494 (↑ locomotor activity in females only) | ||||
|
D 56; Rotarod |
494 | – | |||||||
| Post‐weaning exposure | |||||||||
| Andrade et al. (2017) |
Rats (Wistar); n = 6 |
0 and 11; D 8; Not reported |
– | 11 (↓ in locomotor activity) | |||||
| Anjum et al. (2019)a |
Mice (Swiss albino); n = 8 |
0 and 11; D 60; Drinking water |
Not reported; MWM, elevated plus maze |
‐ | 11 (impaired performance in MWM) | – | 11 (↑ in anxiety) | ||
| Avila et al. (2010) |
Rats (Wistar); n = 5 |
0 and 13; D 120; Drinking water |
D 120; Open‐field and rotarod |
– | 13 (↓ in locomotor activity and performance in rotarod) | ||||
| Chepukosi et al. (2021) |
Mice (Swiss albino); n = 10 |
0 and 740; D 12; Drinking water |
D 12; RMCBS |
– | 740 (↓ in RMCBS score) | ||||
| Fordahl et al. (2012) |
Rats (SD); n = 6 |
0 and 35; D 42; Drinking water |
D 28–42; Home cage surveillance |
– | 35 (↑ in locomotor activity) | ||||
| Freeman et al. (2020) |
Mice (C57/BL6); n = 10 |
0 and 36.5; D 42; Drinking water |
Every second week; Cylinder test |
36.5 (↓ rearing behaviour) | |||||
|
D 43; Rotarod |
– | 36.5 (impairment in balance in males) | |||||||
|
Every week; Beam traversal test |
36.5 (impairment in motor coordination and balance in males) | ||||||||
| Kim et al. (2017) | Mice (C57Bl/6J0); n = not reported |
0 and 28; D 30; Gavage |
D 31; Open‐field |
– | 28 (↓ in locomotor activity) | ||||
| Komura & Sakamoto (1991) |
Mice (ddy); n = 8 |
0 and 426; D 100; Feed |
D 101; Open‐field |
426 | – | ||||
| 0 and 426 mg MnCO3 kg/bw per day | |||||||||
| Komura & Sakamoto (1991) |
Mice (ddy); n = 6 |
0 and 320; D 365; Feed |
Throughout the treatment period; Open‐field |
320 | – | ||||
| 0 and 320 mg MnCO3 kg/bw per day | |||||||||
| Krishna et al. (2014) |
Mice (C57BL/6); n = 8 |
0 and 99; D 56; Drinking water |
D 49; Open‐field (motor activity and anxiety) and pole test |
99 | – | ||||
|
D 49; Grip strength |
– | 99 (↓ in grip strength) | ‐ | 99 (↑ disinhibition of exploratory behaviour) | |||||
|
D 49; Forced swim test |
– | 99 (↓ swimming) | |||||||
| Leung et al. (1982) |
Rats (Wistar); n = 9–10 |
0 and 258; Via F0 from GD 1 to PND 21 and from PND 21 to 80; Drinking water |
PND 80; Open‐field |
258 | – | ||||
| Muthaiah et al. (2016) |
Rats (SD); n = 6 |
0 and 359; D 90; Drinking water |
D 132; Auditory tests |
359 | – | ||||
| Nachtman et al. (1986) |
Rats (SD); n = 12 |
0 and 41; D 35; Drinking water |
D 35; Open‐field |
– | 41 (↑ in locomotor activity) | ||||
| Nkpaa, Amadi, Wegwu, and Farombi (2019) |
Rats (Wistar); n = 10 |
0 and 16; D 35; Oral treatment (no further information) |
D 36; Open‐field, grip strength and negative neotaxis |
– | 16 (↓ in locomotor activity, impairments in negative geotaxis and grip strength tests) | ||||
| Nkpaa, Amadi, et al. (2019) |
Rats (Wistar); n = 6 |
0 and 16; D 35; Oral treatment (no further information) |
D 36; MWM |
– | 16 (impaired performance in MWM) | ||||
| Nkpaa et al. (2022) |
Rats (Wistar); n = 10 |
0 and 16; D 35; Gavage |
D 36; Open‐field, grip strength and negative neotaxis |
– | 16 (↓ in locomotor activity, impairments in negative geotaxis and grip strength tests) | ||||
| Peneder et al. (2011) | Mice (C57BL/6J); n = 20 |
0 and 88; D 90 or 480 Diet |
Every 2nd month; Open‐field |
– | 88 (↑ in locomotor activity) | ||||
| Wang et al. (2020) |
Rats (SD); n = 8 |
0 and 14; D 35; Drinking water |
D 35; Open‐field |
– | 14 (↓ in locomotor activity) | ||||
| Wilcox et al. (2022) |
‘Young’ mice (wild‐type); n = 6–8 |
0 and 494; PND 21 to 77; Diet |
D 78; EZM D 79; Grip strength D 81–83; Rotatod |
494 | – | 494 | – | ||
|
D 79; Open‐field |
– | 494 (↑ locomotor activity in females only) | |||||||
|
‘Aged’ mice (wild‐type); n = 7–8 |
0 and 494; PND 365 to 421; Diet |
D 495; EZM |
494 | – | |||||
|
D 496; Open‐field and grip strength D 497–499; Rotarod D 503; Y‐maze alteration D 505; Nest building |
494 | – | 494 | – | |||||
| Zhang et al. (2021) |
Rats (SD); n = 6–9 |
0 and 38.5; D 90; Drinking water |
D 90; Sunflower seed‐eating test |
– | 38.5 (impairment in skilled movements) | ||||
|
D 90; Footprint analysis |
– | 38.5 (perturbed gait) | |||||||
|
D 90; Beam walking |
– | 38.5 (impairment in balance) | |||||||
Abbreviations: bw, body weight; CWM, Cincinnati water maze; D, day; ddY, Deutschland, Denken and Yoken; EZM, elevated zero maze; F0, founding generation; F1, filial generation; GD, gestational day; I.T.R.C., Industrial Toxicology Research Centre; LE, Long Evans; LOAEL, lowest‐observed‐adverse‐effect‐level; MWM, Morris water maze; NOAEL, no‐observed‐adverse‐effect‐level; PND, post‐natal day; RMCBS, Rapid murine comma and behaviour scale; SD, Sprague Dawley; V max, maximum startle amplitude.
The same results reported in Biswas et al., 2019 (duration of exposure was reported to be 90 days).
APPENDIX E. CALCULATIONS OF TOTAL MANGANESE EXPOSURE IN ANIMAL STUDIES
E.1.
| Reference | Reported doses by the study authors | Calculations and assumptions done to convert to elemental Mn | Exposure via background diet |
|---|---|---|---|
| Multiple dose group studies | |||
| Pappas et al. (1997) | 2 and 10 mg/mL |
Authors report the dosing as ‘Mn Salt (manganese chloride)’. Doses are therefore scaled to elemental Mn from MnCl2 using scaling factor 0.339. Authors measured Mn intake in pregnant dams (premating bw was used): 0.35 mg/g bw day (350 mg/kg bw per day) 1.42 mg/g bw day (1420 mg/kg bw per day) |
PRO LAB chow (containing 60.1 mg Mn/kg). Using conversion factor for sub‐chronic exposure (0.09) this would give 5.4 mg Mn/kg bw |
| Oshiro et al. (2022) | 2 and 4 mg/mL |
Dose calculated using sub‐chronic conversion factor (0.09). No conversion to elemental Mn as conc. reported as mg Mn/mL by the authors. |
In discussion section, authors report: ‘Control Mn concentrations of ~ 0.6 μg Mn/g tissue reflects consumption by dams of a diet containing approximately 71 ppm of Mn (Purina 5008, PMI Nutrition International, Richmond, IN)’. Using sub‐chronic conv. fact. (0.09) this gives a background intake of 6.39 mg/kg bw day. |
| Ohishi et al. (2012) | 32, 160, 800 or 1600 ppm in diet |
Authors report doses in mg/kg bw per day for MnCl2*4H2o in results section: 4 mg/kg bw per day (32 ppm), 21 mg/kg bw per day (160 ppm), 105 mg/kg bw per day (800 ppm). Authors report doses in mg/kg bw per day for Mn in discussion section: 1.13 mg/kg bw per day (32 ppm), 5.73 mg/kg bw per day (160 ppm) 29.21 mg/kg bw per day (800 ppm). Authors also report total intake of Mn including Mn from background diet: 8.94 mg/kg bw per day (0 ppm), 10.34 mg/kg bw per day (32 ppm), 15.10 mg/kg bw per day (160 ppm), 38.76 mg/kg bw per day (800 ppm). Authors report doses in Mn, so no further conversion performed. |
CRF‐1 basal diet Diet is Oriental Yeast Co., Ltd. with 7.27 mg(Mn)/100 g. Animals consumed 8.94 mg Mn/kg bw per day from this diet. |
| Tran, Chowanadisai, Crinella, et al. (2002) | 50, 250 or 500 μg MnCl2 in 10% sucrose solution per day |
Dose per body weight was calculated using male/female pup weights on PND 0, 4,7,11,13, 17 and 21, as provided by Charles River for SD ratsa, as authors don't report body weights, and then calculating weighted average per dose: 3.42/3.58 mg/kg bw per day (50 μg MnCl2) 17.09/17.91 mg/kg bw per day 34.17/35.82 mg/kg bw per day (500 μg MnCl2) Exposure reported in MnCl2 and converted to elemental Mn using scaling factor 0.339. Thereby elemental Mn doses are on average (M/F) 1.19 (1.16/1.21) mg/kg bw per day (50 μg Mn) 5.93 (5.79/6.07) mg/kg bw per day (250 μg Mn) 11.86 (11.59/12.14) mg/kg bw per day (500 μg Mn) |
Authors provide information that on average pups intake 3 μg Mn per day through milk. Using average rat pup body weight over 21 days of lactation from Charles River chartsa (average for male and female pups over 21 days = 21.7 g) this leads to an average background intake of: 0.14 mg/kg bw per day (during lactation). After weaning, they were fed with purified diet and deionised water – Mn content not reported, thus default 8 mg Mn/kg bw per day was used |
| Tran, Chowanadisai, Lönnerdal, et al. (2002) | 50, 250 or 500 μg MnCl2 in 10% sucrose solution per day |
Dose per body weight was calculated using male/female pup weights on PND 0, 4,7,11,13, 17 and 21 provided by Charles River for SD ratsa, as authors don't report body weights and then calculating weighted average per dose: 3.42/3.58 mg/kg bw per day (50 μg MnCl2) 17.09/17.91 mg/kg bw per day 34.17/35.82 mg/kg bw per day (500 μg MnCl2) Exposure reported in MnCl2 and converted to elemental Mn using scaling factor 0.339. Thereby elemental Mn doses are on average (M/F) 1.19 (1.16/1.21) mg/kg bw per day (50 μg Mn) 5.93 (5.79/6.07) mg/kg bw per day (250 μg Mn) 11.86 (11.59/12.14) mg/kg bw per day (500 μg Mn) |
In Tran, Chowanadisai, Crinella, et al. (2002), the same authors provide information that on average pups intake was 3 μg Mn/day through milk. Using average rat pup body weight over 21 days of lactation from Charles River charts (average for male and female pups over 21 days = 21.7 g) this leads to an average background intake of 0.14 mg/kg bw per day (during lactation). After weaning, F1 received ad lib access to purified control diet with a defined level of Mn (35 μg/g) ‐ presumably elemental form. Using sub‐chronic conversion factor (0.09) this gives 3.15 mg/kg bw per day (weaning‐behavioural testing) |
| Reichel et al. (2006) | 250 or 750 μg Mn (dissolved in 25 μL of 10% sucrose solution) |
Doses calculated as weighted average of the doses calculated using data from Table 3: 14.97 mg/kg bw day (250 μg) 45.17 mg/kg b.w. day (750 μg) Scaling to elemental Mn performed using scaling factor 0.339 |
Standard rodent chow (Harlan‐Tekland #8604) and water According manufacturer, this feed contains 100 mg Mn/kg. Using the sub‐chronic conv. factor (0.09), background Mn intake is 9 mg Mn/kg bw. |
| Brenneman et al. (1999) | 25 or 50 mg Mn/kg per day | Scaled to elemental Mn using scaling factor 0.339 since it is not clear which form was used (in majority of cases, the authors would refer to MnCl2, but under Materials and Methods, they also mentioned Mn(II)Cl2.4H2O) | – |
| Dorman et al. (2000) | 25 and 50 mg/kg bw per day | Scaling to elemental Mn performed using scaling factor 0.339 since it is not clear which form was used (in majority of cases, the authors would refer to MnCl2, but under Materials and Methods, they also mentioned Mn(II)Cl2.4H2O) |
Pelleted diet (NIH‐07) (containing approx. 100 mg Mn/kg) and water (containing approx. < 0.2 mg/L) were available ad lib Using conv. factor for sub‐acute exposure (0.12; for both feed and water), background Mn intake is 12.02 mg Mn/kg bw per day |
| Kern et al. (2010) | 25 or 50 mg/kg bw per day | Dose reported as mg Mn/kg bw, thus no conversion to elemental Mn |
Fed Harlan Teklad rodent chow #2018 which is reported by the manufacturer to contain 118 mg Mn/kg. Using sub‐acute conv. factor (0.120), background exposure is 14.16 mg/kg bw per day |
| Kern and Smith (2011) | 25 or 50 mg Mn/kg per day | Dose reported as mg Mn/kg bw, thus no conversion to elemental Mn |
Fed Harlan Teklad rodent chow #2018 which is reported by the manufacturer to contain 118 mg Mn/kg Using sub‐chronic conv. factor (0.09), background exposure is 10.62 mg/kg bw per day |
| Conley et al. (2020) | 25 or 50 mg Mn/kg per day | Dose reported as mg Mn/kg bw, thus no conversion to elemental Mn |
Harlan Teklad rodent chow #2920 (reported by the manufacturer to contain 80 mg Mn/kg) Using sub‐chronic conv. factor (0.09), background Mn intake is 7.2 mg/kg bw per day |
| Foster et al. (2018) | 11 or 25 mg Mn/kg per day | Dose reported as mg Mn/kg bw, thus no conversion to elemental Mn |
’A pelleted, semi‐purified AIN‐93G certified diet from Bio‐ Serv (Frenchtown, New Jersey) formulated to contain 10 ppm Mn and 35 ppm iron was fed to all animals’. Using sub‐acute conv. factor (0.2), background Mn from diet is 2 mg/kg bw day |
| Beaudin et al. (2013) | 25 or 50 mg Mn/kg per day | Dose reported as mg Mn/kg bw, thus no conversion to elemental Mn |
Harlan Teklad rodent chow #2018 which is reported by the manufacturer to contain 118 mg Mn/kg. Using sub‐chronic conv. factor (0.09) for exposures ‘to the end of experiment’, background Mn intake is 10.62 mg/kg bw per day |
| Beaudin, Strupp, Uribe, et al. (2017) | 25 or 50 mg/kg bw per day | Dose reported as mg Mn/kg bw, thus no conversion to elemental Mn |
Animals (dams and weaned pups) were fed Harlan Teklad rodent chow #2018 (reported by the manufacturer to contain 118 mg Mn/kg) Using sub‐chronic conv. factor (0.09) for exposures ‘to the end of experiment’, background Mn intake is 10.62 mg/kg bw per day |
| Golub et al. (2005) |
17, 109 and 333 mg/kg bw per day (PND 16) 18, 106 and 323 mg/kg bw per day (months 1–4) Doses correctedb to μg/kg bw per day |
Dose reported as mg Mn/kg bw, thus no conversion to elemental Mn |
Commercial nonhuman primate diet (Lab Diet #5047, PMI Nutrition International, St. Louis, MO) containing 44 mg Mn/kg dry matter Assuming that Rhesus monkeys weight approx. 3–4 kg at 18 months of age and that their daily consumption of feed is approx. 3%–5% of their body weight, background Mn intake is 1.3–2.2 mg/kg bw per day |
| Sentürk and Öner (1996) | 357 and 714 μg Mn/kg bw | Authors report dose as μg MnCl2.4H20, thus scaling factor of 0.278 was used. |
Background diet contained 59.5 ± 29.3 μg Mn/g dry wt from normal feed and 1.04 ± 0.44 μg Mn/L from water Using sub‐chronic conv. factor (0.09), background Mn intake is 5.5 mg Mn/kg bw per day |
| Vezér et al. (2007) | 15 and 59 mg/kg bw |
Dose given 5 days per week Daily dose was calculated to correct for the 2 days without Mn exposure. Scaling to elemental Mn performed using scaling factor 0.278 since the authors stated to select the doses based on the LD50 for MnCl2 tetrahydrate |
No information on feed provided/available, thus default 8 mg Mn/kg bw per day was used |
| Moreno et al. (2009) | 10 or 30 mg/kg bw per day | Since the authors mentioned that the amount of Mn delivered was adjusted for the molar concentration in the tetrahydrate form to achieve a precise dose and since the doses were reported as mg/kg bw MnCl2, conversion was made based on MnCl2 using scaling factor 0.437 | Laboratory chow (no further details) and water ad lib mentioned, thus default 17 mg Mn/kg bw per day was used |
| Yang et al. (2021) | 25, 50 or 100 mg/kg bw day | Exposure reported in terms of MnCl2*4H2O. Converted to elemental Mn using scaling factor 0.278 |
‘Mice were allowed ad libitum access to deionised water and food (Guangxi Medical University, SCXK Jing 2014–0010)’ – reported by the manufacturer to contain 80 mg Mn/kg Using sub‐chronic conv. factor (0.2), background exposure is 16 mg/kg bw per day |
| Torrente et al. (2005) | 275 and 550 mg/kg bw per day | Scaling to elemental Mn performed using scaling factor 0.278 |
Habituation period of 14 days with 137.5 mg/kg/day in water supply (habituation period also with water only) Feed was a standard rat chow (Panlab, Barcelona) and drinking water was available ad lib No additional info available on the composition of this chow, thus default 8 mg Mn/kg bw per day was used |
| Avila et al. (2008) |
10 and 25 mg (MnCl2)/mL (2.8 and 6.9 mg of Mn/mL) |
Dose calculated using sub‐chronic conversion factor (0.09) Authors report dose in elemental Mn, thus no further scaling performed |
Food and water ad lib Only information on feed provided is producer: Guabi‐RS, Brazil; thus default 8 mg Mn/kg bw per day was used |
| Bonilla (1984) | 0.1 and 5.0 mg (Mn)/mL |
Dose calculated using sub‐chronic conversion factor (0.09) Doses reported as elemental Mn, thus no further scaling performed |
Rat laboratory chow (Protinal‐Maracaibo) ad lib No further information on feed available, thus default 8 mg Mn/kg bw per day was used |
| Ohgami et al. (2016) | 1.65 and 16.50 mg (Mn)/L |
Dose calculated using sub‐acute conversion factor (0.18) The authors report dosing as mg Mn/mL, thus no scaling to elemental Mn performed |
No information on feed provided, thus default 19.8 mg Mn/kg bw per day was used |
| Single dose group studies | |||
| Betharia & Maher (2012) | 2 mg/mL |
Authors measure water intake and calculate daily dose: Gestation: 237.51 mg/kg bw per day Lactation: 511.19 mg/kg bw per day Average dose = 374 mg/kg bw per day The authors report dosing as mg Mn/mL, thus no scaling to elemental Mn performed. |
Purina Rodent Lab Chow #5001 containing 59 mg Mn/kg. The authors calculated the daily intake of 2.9 mg Mn/kg bw. |
| Chandra et al. (1979) |
5 mg/mL during lactation 3 μg/mL after weaning |
Dose calculated using following conversion factors as authors report water intake, but not body weight (the mice used are a local colony of mice and growth charts are not available); F0 ‘sub‐acute’ 0.18 (900 mg/kg bw per day) F1: 30 days – ‘sub‐acute’ 0.18 (0.54 mg/kg bw per day) 60, 90, 150, 190 days ‘sub‐chronic’ 0.15 (0.45 mg/kg bw per day) Scaled to elemental Mn for F0 intake using scaling factor 0.278. No scaling to elemental Mn performed for F1 intake as authors report dose as 3 μg Mn2+/mL. |
Free access to pellet diet (Gold Mohur Laboratory Animals feeds, India) and water. The average consumption of drinking solution by each dam was 30mL/day. The pups' consumption of solution was on an average 10, 12 and 25mL/day up to 60, 90 and 120 days, respectively; it was 30mL/day per animal during the rest of the experimental period. No information on feed composition available, thus default 19.8 mg Mn/kg bw per day was used. |
| Hill et al. (2015) | 10 ppm Mn |
Dose calculated using ‘Sub‐acute’ conversion factor: 0.18 (1.8 mg/kg bw per day). Authors write: 10 ppm Mn as manganese chloride (CAS# 13446‐34‐9, manganese(II) chloride tetrahydrate), therefore scaling to elemental Mn performed using scaling factor 0.278. |
Free access to food and water (Harlan Teklad Rodent Diet #8606, Ralston Purina, St. Louis, MO). No further information on feed available, thus default 8 mg Mn/kg bw per day was used. |
| Kwieciński & Nowak (2009) | 5000 ppm MnCl2 |
Dose calculated using ‘Sub‐acute’ conversion factor: 0.12 (600 mg/kg bw per day) Scaled to elemental Mn using scaling factor 0.278. |
Standard rat chow (Altromin‐1324, Lage, Germany; reported by the manufacturer to contain 95.06 mg Mn/kg). Using sub‐acute conv factor 0.12, background Mn intake from diet is 11.4 mg/kg bw per day. |
| Leung et al. (1982) | 10 mg/mL |
Dose calculated using ‘Sub‐chronic’ conversion factor 0.09 (900 mg/kg bw per day). Conversion to elemental Mn performed using scaling factor 0.278. |
No information on feed provided/available, thus default 8 mg Mn/kg bw per day was used. |
| Molina et al. (2011) | 4.79 mg/mL |
Authors report Mn intake in Table 1: Gestation: 564.54 mg/kg bw per day, Lactation: 1255.65 mg/kg bw per day. Average dose = 910 mg/kg bw per day. Conversion to elemental Mn performed using scaling factor 0.278. |
Animals had ad libitum access to food (Purina Rodent Lab Chow #5001) (containing approx. 70 ppm Mn) and reverse osmosis (RO) deionised water. Using sub‐acute conversion factor (0.12), background Mn intake from diet is 8.4 mg/kg bw per day |
| Amos‐Kroohs et al. (2015, 2017) | 100 mg/kg bw every other day |
Since dose was given every other day, it was calculated to the daily dose. Conversion performed using scaling factor 0.339. |
NIH‐07 diet (reported by the manufacturer to contain approx. 103 ppm Mn) was provided ad libitum. Consumption not reported. Using sub‐acute conversion factor (0.12), background Mn intake from diet is 12.36 mg/kg bw per day. |
| Bailey et al. (2019) | 100 mg/kg bw per day |
Since dose was given every other day, it was calculated to the daily dose. Conversion performed using scaling factor 0.339. |
Ad libitum access to NIH‐07 diet (#5018, TestDiet, Richmond, IN) and reverse osmosis‐filtered/UV‐sterilised water. No information on feed composition available, thus default 8 mg Mn/kg bw per day was used. |
| Beaudin et al. (2015, 2017) | 50 mg Mn/kg bw per day | Doses reported as elemental Mn, thus no further scaling performed. |
Harlan Teklad rodent chow No. 2018 (reported by the manufacturer to contain 118mg Mn/kg). Water bottle weights were recorded at refilling to determine Mn intake per cage but consumption not reported. Drinking water Mn concentrations were adjusted weekly as needed to maintain target daily oral Mn intake levels of 50 mg/kg/day based on measured water intake rates. Using sub‐chronic conversion factor (0.09), background Mn intake from diet is 10.62 mg/kg bw per day. |
| McDougall et al. (2008) | 750 μg Mn per day |
Dose calculated as average of doses calculated using bw data provided in Table 1. 39.43 mg/kg bw per day Conversion to elemental Mn performed using scaling factor 0.339. |
Rats had free access to standard rodent chow (#8604; Harlan Teklad, Madison, WI, USA ‐ reported by the manufacturer to contain 100 mg Mn/kg) and water. Consumption not reported. Using sub‐acute conversion factor (0.12), background Mn intake from diet is 12.0 mg/kg bw per day. |
| Sprowles et al. (2018) | 100 mg/kg bw per day |
Since dose was given every other day, it was calculated to the daily dose. Conversion to elemental Mn performed using scaling factor 0.278 since the authors mentioned that ‘Mn dose was 100 mg/kg Mn chloride tetrahydrate’. |
NIH‐07 rodent chow (reported by the manufacturer to contain approx 103 ppm Mn) with consistent levels of metals and minerals was provided ad lib along with reverse osmosis‐filtered, UV sterilised water. Using sub‐chronic conversion factor(0.12), background Mn intake from diet is 12.36 mg/kg bw per day. |
| Streifel et al. (2012) | 50 mg/kg | Authors write: ‘The dose of Mn was adjusted for the molar stoichiometry in the tetrahydrate form and administered at 50 mg/kg based upon daily weighing of each animal’, therefore no conversion to elemental Mn is made. |
Standard laboratory chow ad libitum (2018 Harlan‐Teklad Global 18% Protein Rodent Diet including 118 μg/g Mn ‐ yielding a baseline consumption of approximately 0.2–0.3 mg Mn/day). Using sub‐acute conversion factor (0.2), background Mn intake from diet is 23.6 mg/kg bw per day. |
| Su et al. (2017) | 4.484 mg/kg bw |
Since dose was given every third day, it was calculated to the daily dose. Converted to elemental Mn using scaling factor 0.278. |
No information on feed provided/available, thus default 8 mg Mn/kg bw per day was used. |
| Sun et al. (2020) | 6.55 mg/kg | Conversion to elemental Mn performed using scaling factor 0.339. | No information on feed provided/available, thus default 8 mg Mn/kg bw per day was used. |
| Wilcox et al. (2022) | 2400 ppm Mn |
Dose calculated using ‘Sub‐chronic’ conversion factor: 0.2. Authors report the dose ‘2400 ppm Mn’, therefore no conversion to elemental Mn is performed. |
Food and water available ad libitum. Standard lab chow (LabDiet 5L0D, TX) containing approximately 70 ppm Mn. Using sub‐chronic conversion factor (0.2), background Mn intake from diet is 14 mg/kg bw per day. |
| Andrade et al. (2017) | 10 mg/kg bw per day | Conversion to elemental Mn performed using scaling factor 0.278. | No information on feed provided/available, thus default 8 mg Mn/kg bw per day was used. |
| Anjum et al. (2019) | 10 mg/kg bw per day |
Authors reported MnCl2.4H20. Conversion to elemental Mn performed using scaling factor 0.278. |
No information on feed provided/available, thus default 8 mg Mn/kg bw per day was used. |
| Avila et al. (2010) | 13.7 mg/kg bw per day | Conversion to elemental Mn performed using scaling factor 0.382. | No information on feed provided/available, thus default 8 mg Mn/kg bw per day was used. |
| Chepukosi et al. (2021) | 4 g/L |
Dose calculated using ‘Sub‐acute’ conversion factor: 0.18 (720 mg/ kg bw per day). No conversion to elemental Mn as reported as Mn++ dissolved in water to make a concentration. |
No information on feed provided/available, thus default 19.8 mg Mn/kg bw per day was used. |
| Fordahl et al. (2012) | 1 g/L |
Authors estimated approximate Mn intake at 100 mg/kg bw per day using average water consumption by rats. Conversion to elemental Mn performed using scaling factor 0.339. |
Formulated diet was obtained from Dyets Inc. (Bethlehem, PA), AIN‐93G diet (10 mg/kg Mn) with deionised water. Free access to food and water. Average water consumption from a previous study used to estimate dose (10–12 mL per 100 g bw). However water levels were monitored but not reported. Using sub‐chronic conversion factor (0.09), background Mn intake from diet is 0.9 mg/kg bw per day. |
| Freeman et al. (2020) | 0.5 g/L |
Authors report Mn intake in Figure 3–60 mg/kg bw per day. Conversion to elemental Mn performed using scaling factor 0.278. |
No information on Mn content in feed provided/available, thus default 19.8 mg Mn/kg bw per day was used. |
| Kim et al. (2017) | 30 mg/kg bw per day | Conversion to elemental Mn performed using scaling factor 0.278. | No information on Mn content in feed provided/available, thus default 19.8 mg Mn/kg bw per day was used. |
| Komura & Sakamoto (1991) | 2 g Mn/kg |
Dose calculated using ‘Chronic’ conversion factor: 0.15. No scaling to elemental Mn performed as dose reported as g Mn/kg. |
Standard laboratory mouse chow (130 mg Mn/kg, Sankyo Laboratories Service Co., Japan) Using chronic conv factor 0.15, background Mn intake from diet is 19.5 mg/kg bw per day. |
|
Dose calculated using ‘Sub‐chronic’ conversion factor: 0.2. No scaling to elemental Mn performed as dose reported as g Mn/kg. |
Standard laboratory mouse chiow (130 ~ mg Mn/kg, Sankyo Laboratories Service Co., Japan). Using sub‐chronic conv factor 0.2, background Mn intake from diet is 26 mg/kg bw per day. |
||
| Krishna et al. (2014) | 0.4 g Mn/L |
Dose calculated using data from Figure 1B (water intake ca. 200 mL/kg bw per day). No scaling to elemental Mn as authors reported as 0.4 g Mn /L. |
No information on Mn content in feed provided/available, thus default 19.8 mg Mn/kg bw per day was used. |
| Muthaiah et al. (2016) | 10 mg/L and as 260–310 mg per day |
For estimates, it was assumed that the authors reported wrong concentration in water, and correct Mn daily intake. For estimation of daily Mn intake per kg bw data from Charles River bw charts for SD male rats at the age of 2 months (start of experiment) was used ‐ 275 g. 1036.37 mg/kg bw per day. Conversion to elemental Mn performed using scaling factor 0.339. |
No information on feed provided/available, thus default 8 mg Mn/kg bw per day was used. |
| Nachtman et al. (1986) | 1 mg/mL |
Dose calculated using ‘Sub‐acute’ conversion factor: 0.12 for the exposure 5 weeks. Conversion to elemental Mn performed using scaling factor 0.278. |
No information on feed provided/available, thus default 8 mg Mn/kg bw per day was used. |
|
Nkpaa, Amadi, Wegwu, and Farombi (2019), Nkpaa et al. (2019) |
30 mg/kg bw per day | Conversion to elemental Mn using scaling factor 0.278. | Rat pellets obtained from Ladokun Feeds, Ibadan, with unlimited access to water. Amount not reported. Since no information on Mn content in feed provided/available, default 8 mg Mn/kg bw per day was used. |
| Peneder et al. (2011) | 1% MnCl2 in the diet |
Authors reported average daily feed intake of 4 g and average body weight of mice of 40 g. Conversion to elemental Mn performed using scaling factor 0.339. |
No information on Mn content in feed provided/available, thus default 19.8 mg Mn/kg bw per day was used. |
| Wang et al. (2020) | 200 mg/L |
Dose calculated using ‘Sub‐chronic’ conversion factor: 0.09 (18 mg/kg bw per day). Conversion to elemental Mn performed using scaling factor 0.339. |
No information on Mn content in feed provided/available, thus default 8 mg Mn/kg bw per day was used. |
| Zhang et al. (2012) | 1 mg/mL |
Dose calculated using ‘Sub‐chronic’ conversion factor: 0.09 (90 mg/kg bw per day). Converted to elemental Mn using scaling factor 0.339. |
No information on Mn content in feed provided/available, thus default 8 mg Mn/kg bw per day was used. |
Available at the following link: https://www.criver.com/sites/default/files/Technical%20Resources/Postnatal%20Growth%20Development%20and%20Behavioral_Functional%20Evaluation%20Crl‐CD%20_SD_IGS%20BR%20Rats%20‐%20March%202002.pdf
Golub, M.S. (2012). Erratum. Neurotoxicology and Teratology, 34(1), 220.
APPENDIX F. LIST OF ANNEXES
F.1.
Annex A – Protocol for the Scientific Opinion on the revision of the EFSA's Tolerable Upper Intake Level of manganese.
Annex B – Methodological considerations in the calculation of intake estimates for manganese in European countries.
Annex C – EFSA's intake assessment of manganese.
Annex D – Manganese intake data from Competent Authorities in European countries.
EFSA NDA Panel (EFSA Panel on Nutrition, Novel Foods and Food Allergens) , Turck, D. , Bohn, T. , Castenmiller, J. , de Henauw, S. , Hirsch‐Ernst, K.‐I. , Knutsen, H. K. , Maciuk, A. , Mangelsdorf, I. , McArdle, H. J. , Pentieva, K. , Siani, A. , Thies, F. , Tsabouri, S. , Vinceti, M. , Bornhorst, J. , Cubadda, F. , Dopter, A. , FitzGerald, R. , … Naska, A. (2023). Scientific opinion on the tolerable upper intake level for manganese. EFSA Journal, 21(11), e8413. 10.2903/j.efsa.2023.8413
Adopted: 26 October 2023
Annexes are available under the Supporting Information section .
Note: A plain language summary of this scientific opinion is available at https://efsa.onlinelibrary.wiley.com/doi/10.2903/j.efsa.2023.p211201
Notes
Regulation (EC) No 1925/2006 of the European Parliament and of the Council of 20 December 2006 on the addition of vitamins and minerals and of certain other substances to foods. OJ L 404, 30.12.2006, p. 26–38.
Directive 2002/46/EC of the European Parliament and of the Council of 10 June 2002 on the approximation of the laws of the Member States relating to food supplements. OJ L 183, 12.7.2002, p. 51–57.
EFSA Mandate No M‐2021‐00058 of 7 June 2021.
SCF (2000). Scientific Committee on Food. Guidelines of the Scientific Committee on Food for the Development of Tolerable Upper Intake Levels for Vitamins and Minerals. in: Scientific Committee on Food, Scientific Panel on Dietetic Products, Nutrition and Allergies (2006). Tolerable Upper Intake Levels for Vitamins and Minerals. European Food Safety Authority. SCF (2001). Scientific Committee on Food. Opinion of the Scientific Committee on Food on the Tolerable Upper Intake Level of Magnesium. in: Scientific Committee on Food, Scientific Panel on Dietetic Products, Nutrition and Allergies (2006). Tolerable Upper Intake Levels for Vitamins and Minerals. European Food Safety Authority.
That is the AI for the population group under consideration was derived by multiplication of the AI of adults with the ratio between the typical weight of each population group and the weight of group adults.
The expert panel was composed of Michael Aschner, (Albert Einstein College of Medicine, New York, USA), Julia Bornhorst (Food Chemistry, Faculty of Mathematics and Natural Sciences, University of Wuppertal, DE) and Donald Smith (Department of Microbiology and Environmental Toxicology, University of California, USA).
The Mintel GNPD contains information on over three million food and beverage products, of which more than one million are or have been available on the European food market. Twenty five out of the 27 EU Member States and Norway are present in the database. The database provides the compulsory ingredient information reported on product labels and the nutrition declaration when available. https://www.mintel.com/globalnew‐products‐database
Working Group consisting of representatives of 27 EU Member States and Norway.
Commission Delegated Regulation (EU) 2016/127 of 25 September 2015 supplementing Regulation (EU) No 609/2013 of the European Parliament and of the Council as regards the specific compositional and information requirements for infant formula and follow‐on formula and as regards requirements on information relating to infant and young child feeding. OJ L 25, 2.2.2016, p. 1–29.
Commission Delegated Regulation (EU) 2017/1522 of 2 June 2017 supplementing Regulation (EU) No 609/2013 of the European Parliament and of the Council as regards the specific compositional and information requirements for total diet replacement for weight control. C/2017/3664. OJ L 230, 6.9.2017, p. 1–9.
Water solubility at 20°C: manganese dichloride (MnCl2): 799 g/L; manganese sulfate (MnSO4): 450 g/L; manganese dioxide (MnO2): 0.073 mg/L; manganese oxide (MnO): 0.85 mg/L. European Chemicals Agency (ECHA) substance infocard. https://echa.europa.eu/substance‐information
Water solubility was described as follows: manganese pidolate: readily soluble in water; manganese aspartate: soluble in water; manganese ascorbate and manganese bisglycinate: slightly soluble in water.
True absorption is calculated as manganese dietary intake minus total faecal losses of manganese plus endogeneous gut losses of manganese.
Median of MINTEL GDP data for the respective food categories.
See footnote 18.
Directive (EU) 2020/2184 of the European Parliament and of the Council of 16 December 2020 on the quality of water intended for human consumption (recast). OJ L 435, 23.12.2020, p. 1–62.
Regulation (EC) No 1925/2006 of the European Parliament and of the Council of 20 December 2006 on the addition of vitamins and minerals and of certain other substances to foods. OJ L 404, 30.12.2006, p. 26–38.
Regulation (EU) No 609/2013 of the European Parliament and of the Council of 12 June 2013 on food intended for infants and young children, food for special medical purposes and total diet replacement for weight control and repealing Council Directive 92/52/EEC, Commission Directives 96/8/EC, 1999/21/EC, 2006/125/EC and 2006/141/EC, Directive 2009/39/EC of the European Parliament and of the Council and Commission Regulations (EC) No 41/2009 and (EC) No 953/2009. OJ L 181, 29.6.2013, p. 35–56.
Commission Delegated Regulation (EU) 2016/127 of 25 September 2015 supplementing Regulation (EU) No 609/2013 of the European Parliament and of the Council as regards the specific compositional and information requirements for infant formula and follow‐on formula and as regards requirements on information relating to infant and young child feeding.
Commission Directive 2006/125/EC of 5 December 2006 on processed cereal‐based foods and baby foods for infants and young children, OJ L 339, 6.12.2006, p. 16.
Directive 2002/46/EC of the European Parliament and of the Council of 10 June 2002 on the approximation of the laws of the Member States relating to food supplements. OJ L 183, 12.7.2002, p. 51–57.
The Mintel GNPD provides data on the content of supplements per serving which may not always reflect the daily dose recommended by the manufacturer.
Considering an average manganese content of 46 μg/100 g in the powder and an average concentration of in 2.5 μg/100 mL in mineral water and a dilution factor of 8.
At the upper bound approach non‐detect results were replaced by the limit of quantification.
Non‐detects were replaced by the corresponding Limit of Quantification.
The standard pallidal index is a marker of manganese accumulation in the brain defined as the signal intensity ratio of the globus pallidus relative to the frontal white matter on T1‐weighted images.
This index was defined as the signal intensity ratio of the globus pallidus relative to the pericranial muscles on T1‐weighted images.
This corresponds to 9000 μg/day considering the RDA for manganese of 1800 μg/day for adult women in the US established by the IOM (2001).
Mn intake was calculated under the assumptions that Rhesus monkeys weight approx. 3–4 kg at 18 months of age and that their daily consumption of feed is approx. 3%–5% of their body weight.
REFERENCES
- Ahn, J. H. , Yoo, C. I. , Lee, C. R. , Lee, J. H. , Lee, H. , Kim, C. Y. , Park, J. K. , Sakai, T. , Yoon, C. S. , & Kim, Y. (2003). Calcification mimicking manganese‐induced increased signal intensities in T1‐weighted MR images in a patient taking herbal medicine: Case report. NeuroToxicity, 24(2003), 835–838. 10.1016/S0161-813X(03)00060-3 [DOI] [PubMed] [Google Scholar]
- Alarcón, O. M. , Reinosa‐Fuller, J. A. , Silva, T. , Ramirez de Fernandez, M. , & Gamboa, J. (1996). Manganese levels in serum of healthy Venezuelan infants living in Mérida. Journal of Trace Elements in Medicine and Biology, 10, 210–213. 10.1016/s0946-672x(96)80037-x [DOI] [PubMed] [Google Scholar]
- Amos‐Kroohs, R. M. , Bloor, C. P. , Qureshi, M. A. , Vorhees, C. V. , & Williams, M. T. (2015). Effects of developmental exposure to manganese and/or low iron diet: Changes to metal transporters, sucrose preference, elevated zero‐maze, open‐field, and locomotion in response to fenfluramine, amphetamine, and MK‐801. Toxicology Reports, 2, 1046–1056. 10.1016/j.toxrep.2015.07.015 [DOI] [PMC free article] [PubMed] [Google Scholar]
- Amos‐Kroohs, R. M. , Davenport, L. L. , Atanasova, N. , Abdulla, Z. I. , Skelton, M. R. , Vorhees, C. V. , & Williams, M. T. (2017). Developmental manganese neurotoxicity in rats: Cognitive deficits in allocentric and egocentric learning and memory. Neurotoxicol Teratol, 59, 16–26. 10.1016/j.ntt.2016.10.005 [DOI] [PMC free article] [PubMed] [Google Scholar]
- Anagianni, S. , & Tuschl, K. (2019). Genetic disorders of manganese metabolism. Current Neurology and Neuroscience Reports, 19, 33. 10.1007/s11910-019-0942-y [DOI] [PMC free article] [PubMed] [Google Scholar]
- Andrade, V. , Mateus, M. L. , Batoréu, M. C. , Aschner, M. , & Dos Santos, A. M. (2017). Toxic mechanisms underlying motor activity changes induced by a mixture of Lead, arsenic and manganese. EC Pharmacol Toxicol, 3(2), 31–42. [PMC free article] [PubMed] [Google Scholar]
- Anjum, A. , Biswas, S. , Rahman, M. , Rahman, A. , Siddique, A. E. , Karim, Y. , Aktar, S. , Nikkon, F. , Haque, A. , Himeno, S. , Hossain, K. , & Saud, Z. A. (2019). Butyrylcholinesterase‐a potential plasma biomarker in manganese‐induced neurobehavioral changes. Environmental Science and Pollution Research International, 26(7), 6378–6387. 10.1007/s11356-018-04066-1 [DOI] [PubMed] [Google Scholar]
- ANSES (French agency for food, environmental and occupational health and safety) . (2011). Second French Total Diet Study (TDS 2). Report 1. Inorganic contaminants, minerals, persistent organic pollutants, mycotoxins and phytoestrogens .
- Aschner, J. L. , & Aschner, M. (2005). Nutritional aspects of manganese homeostasis. Molecular Aspects of Medicine, 26, 353–362. 10.1016/j.mam.2005.07.003 [DOI] [PMC free article] [PubMed] [Google Scholar]
- Ashley‐Martin, J. , Dodds, L. , Arbuckle, T. E. , Ettinger, A. S. , Shapiro, G. D. , Fisher, M. , Monnier, P. , Morisset, A. S. , Fraser, W. D. , & Bouchard, M. F. (2018). Maternal and cord blood manganese (Mn) levels and birth weight: The MIREC birth cohort study. International Journal of Hygiene and Environmental Health, 221, 876–882. 10.1016/j.ijheh.2018.05.015 [DOI] [PubMed] [Google Scholar]
- ATSDR (Agency for Toxic Substances and Disease Registry, US Department of Health and Human Services) . (2012). Toxicological profile for manganese. Atlanta. [PubMed] [Google Scholar]
- Avila, D. S. , Colle, D. , Gubert, P. , Palma, A. S. , Puntel, G. , Manarin, F. , Noremberg, S. , Nascimento, P. C. , Aschner, M. , Rocha, J. B. , & Soares, F. A. (2010). A possible neuroprotective action of a vinylic telluride against Mn‐induced neurotoxicity. Toxicological sciences : an official journal of the Society of Toxicology, 115(1), 194–201. 10.1093/toxsci/kfq036 [DOI] [PMC free article] [PubMed] [Google Scholar]
- Avila, D. S. , Gubert, P. , Fachinetto, R. , Wagner, C. , Aschner, M. , Rocha, J. B. , & Soares, F. A. (2008). Involvement of striatal lipid peroxidation and inhibition of calcium influx into brain slices in neurobehavioral alterations in a rat model of short‐term oral exposure to manganese. Neurotoxicology, 29, 1062–1068. 10.1016/j.neuro.2008.08.004 [DOI] [PubMed] [Google Scholar]
- Bailey, R. A. , Gutierrez, A. , Kyser, T. L. , Hemmerle, A. M. , Hufgard, J. R. , Seroogy, K. B. , Vorhees, C. V. , & Williams, M. T. (2019). Effects of Preweaning manganese in combination with adult striatal dopamine lesions on monoamines, BDNF, TrkB, and cognitive function in Sprague‐Dawley rats. Neurotoxicity Research, 35(3), 606–620. 10.1007/s12640-018-9992-1 [DOI] [PubMed] [Google Scholar]
- Bakouei, S. , Reisian, F. , Lamyian, M. , Haji Zadeh, E. , Zamanian, H. , & Taheri Kharameh, Z. (2015). High intake of manganese during second trimester, increases the risk of preterm delivery: A large scale cohort study. Glob J Health Sci, 7, 226–232. 10.5539/gjhs.v7n5p226 [DOI] [PMC free article] [PubMed] [Google Scholar]
- Balachandran, R. C. , Mukhopadhyay, S. , McBride, D. , Veevers, J. , Harrison, F. E. , Aschner, M. , Haynes, E. N. , & Bowman, A. B. (2020). Brain manganese and the balance between essential roles and neurotoxicity. The Journal of Biological Chemistry, 295, 6312–6329. 10.1074/jbc.REV119.009453 [DOI] [PMC free article] [PubMed] [Google Scholar]
- Balachandran, R. C. , Yanko, F. M. , Cheng, P. , Prince, L. M. , Rivers, C. N. , Morcillo, P. , Akinyemi, A. J. , Tabbassum, S. , Pfalzer, A. C. , Nie, L. H. , Aschner, M. , & Bowman, A. B. (2021). Rodent hair is a poor biomarker for internal manganese exposure. Food and Chemical Toxicology, 157, 112555. 10.1016/j.fct.2021.112555 [DOI] [PubMed] [Google Scholar]
- Ballatori, N. , Miles, E. , & Clarkson, T. W. (1987). Homeostatic control of manganese excretion in the neonatal rat. The American Journal of Physiology, 252, R842–R847. 10.1152/ajpregu.1987.252.5.R842 [DOI] [PubMed] [Google Scholar]
- Başgel, S. , & Erdemoğlu, S. B. (2006). Determination of mineral and trace elements in some medicinal herbs and their infusions consumed in Turkey. Sci Total Environ, 359, 82–89. 10.1016/j.scitotenv.2005.04.016 [DOI] [PubMed] [Google Scholar]
- Beaudin, S. A. , Nisam, S. , & Smith, D. R. (2013). Early life versus lifelong oral manganese exposure differently impairs skilled forelimb performance in adult rats. Neurotoxicology and Teratology, 38, 36–45. 10.1016/j.ntt.2013.04.004 [DOI] [PMC free article] [PubMed] [Google Scholar]
- Berndtsson, J. , Broeskamp, F. , Habernig, L. , Kohler, V. , Vazquez‐Calvo, C. , Nandy, A. , Peselj, C. , Drobysheva, S. , Pelosi, S. , Vögtle, F. N. , Pierrel, F. , Ott, M. , & Büttner, S. (2022). Manganese‐driven CoQ deficiency. Nature communications, 13(1), 6061. 10.1038/s41467-022-33641-x [DOI] [PMC free article] [PubMed] [Google Scholar]
- Beaudin, S. A. , Strupp, B. J. , Lasley, S. M. , Fornal, C. A. , Mandal, S. , & Smith, D. R. (2015). Oral methylphenidate alleviates the fine motor dysfunction caused by chronic postnatal manganese exposure in adult rats. Toxicological Sciences, 144, 318–327. 10.1093/toxsci/kfv007 [DOI] [PMC free article] [PubMed] [Google Scholar]
- Beaudin, S. A. , Strupp, B. J. , Strawderman, M. , & Smith, D. R. (2017). Early postnatal manganese exposure causes lasting impairment of selective and focused attention and arousal regulation in adult rats. Environmental Health Perspectives, 125, 230–237. 10.1289/EHP258 [DOI] [PMC free article] [PubMed] [Google Scholar]
- Beaudin, S. A. , Strupp, B. J. , Uribe, W. , Ysais, L. , Strawderman, M. , & Smith, D. R. (2017). Methylphenidate alleviates manganese‐induced impulsivity but not distractibility. Neurotoxicology and Teratology, 61, 17–28. 10.1016/j.ntt.2017.03.005 [DOI] [PMC free article] [PubMed] [Google Scholar]
- Betharia, S. , & Maher, T. J. (2012). Neurobehavioral effects of lead and manganese individually and in combination in developmentally exposed rats. Neurotoxicology, 33(5), 1117–1127. 10.1016/j.neuro.2012.06.002 [DOI] [PubMed] [Google Scholar]
- Biswas, S. , Anjum, A. , Banna, H. U. , Rahman, M. , Siddique, A. E. , Karim, Y. , Nikkon, F. , Haque, A. , Hossain, K. , & Saud, Z. A. (2019). Manganese attenuates the effects of arsenic on neurobehavioral and biochemical changes in mice co‐exposed to arsenic and manganese. Environmental Science and Pollution Research International, 26(28), 29257–29266. 10.1007/s11356-019-06112-y [DOI] [PubMed] [Google Scholar]
- Bjørklund, G. , Dadar, M. , Peana, M. , Rahaman, M. S. , & Aaseth, J. (2020). Interactions between iron and manganese in neurotoxicity. Archives of Toxicology, 94, 725–734. 10.1007/s00204-020-02652-2 [DOI] [PubMed] [Google Scholar]
- Bonilla, E. (1984). Chronic manganese intake induces changes in the motor activity of rats. Experimental Neurology, 84, 696–700. 10.1016/0014-4886(84)90216-4 [DOI] [PubMed] [Google Scholar]
- Bouchard, M. F. , Sauvé, S. , Barbeau, B. , Legrand, M. , Brodeur, M. , Bouffard, T. , Limoges, E. , Bellinger, D. C. , & Mergler, D. (2011). Intellectual impairment in school‐age children exposed to manganese from drinking water. Environmental Health Perspectives, 119, 138–143. 10.1289/ehp.1002321 [DOI] [PMC free article] [PubMed] [Google Scholar]
- Bouchard, M. F. , Surette, C. , Cormier, P. , & Foucher, D. (2018). Low level exposure to manganese from drinking water and cognition in school‐age children. Neurotoxicology, 64, 110–117. 10.1016/j.neuro.2017.07.024 [DOI] [PubMed] [Google Scholar]
- Brenneman, K. A. , Cattley, R. C. , Ali, S. F. , & Dorman, D. C. (1999). Manganese‐induced developmental neurotoxicity in the CD rat: Is oxidative damage a mechanism of action? Neurotoxicology, 20, 477–487. [PubMed] [Google Scholar]
- Brna, P. , Gordon, K. , Dooley, J. M. , & Price, V. (2011). Manganese toxicity in a child with iron deficiency and polycythemia. Journal of Child Neurology, 26, 891–894. 10.1177/0883073810393962 [DOI] [PubMed] [Google Scholar]
- Butterworth, R. F. , Spahr, L. , Fontaine, S. , & Layrargues, G. P. (1995). Manganese toxicity, dopaminergic dysfunction and hepatic encephalopathy. Metabolic Brain Disease, 10, 259–267. 10.1007/BF02109357 [DOI] [PubMed] [Google Scholar]
- Cassidy‐Bushrow, A. E. , Wu, K. H. , Sitarik, A. R. , Park, S. K. , Bielak, L. F. , Austin, C. , Gennings, C. , Curtin, P. , Johnson, C. C. , & Arora, M. (2019). In utero metal exposures measured in deciduous teeth and birth outcomes in a racially‐diverse urban cohort. Environmental Research, 171, 444–451. 10.1016/j.envres.2019.01.054 [DOI] [PMC free article] [PubMed] [Google Scholar]
- Chandra, S. V. , Shukla, G. S. , & Saxena, D. K. (1979). Manganese‐induced behavioral dysfunction and its neurochemical mechanism in growing mice. Journal of Neurochemistry, 33(6), 1217–1221. 10.1111/j.1471-4159.1979.tb05267.x [DOI] [PubMed] [Google Scholar]
- Chen, L. , Ding, G. , Gao, Y. , Wang, P. , Shi, R. , Huang, H. , & Tian, Y. (2014). Manganese concentrations in maternal–infant blood and birth weight. Environmental Science and Pollution Research, 21, 6170–6175. 10.1007/s11356-013-2465-4 [DOI] [PubMed] [Google Scholar]
- Chen, P. , Bornhorst, J. , & Aschner, M. (2018). Manganese Metabolism in Humans. Front Biosci (Landmark Ed), 23, 1655–1679. 10.2741/4665 [DOI] [PubMed] [Google Scholar]
- Chepukosi, K. W. , Nyariki, J. N. , Jillani, N. E. , Okanya, P. W. , & Isaac, A. O. (2021). Manganese exacerbated chronic khat‐induced neurological deficits, inflammation and organ toxicity in a mouse model. Toxicol. Environ. Health Sci., 13, 337–350. 10.1007/s13530-021-00091-9 [DOI] [Google Scholar]
- Cherry, N. , Shaik, K. , McDonald, C. , & Chowdhury, Z. (2010). Manganese, arsenic, and infant mortality in Bangladesh: An ecological analysis. Archives of Environmental & Occupational Health, 65, 148–153. 10.1080/19338240903390362 [DOI] [PubMed] [Google Scholar]
- Choi, M.‐K. , & Bae, Y.‐J. (2013). Relationship between dietary magnesium, manganese, and copper and metabolic syndrome risk in Korean adults: The Korea National Health and nutrition examination survey (2007–2008). Biological Trace Element Research, 156, 56–66. 10.1007/s12011-013-9852-z [DOI] [PubMed] [Google Scholar]
- Conley, T. E. , Beaudin, S. A. , Lasley, S. M. , Fornal, C. A. , Hartman, J. , Uribe, W. , Khan, T. , Strupp, B. J. , & Smith, D. R. (2020). Early postnatal manganese exposure causes arousal dysregulation and lasting hypofunctioning of the prefrontal cortex catecholaminergic systems. Journal of Neurochemistry, 153, 631–649. 10.1111/jnc.14934 [DOI] [PMC free article] [PubMed] [Google Scholar]
- Cortese, M. , Chitnis, T. , Ascherio, A. , & Munger, K. L. (2019). Total intake of different minerals and the risk of multiple sclerosis. Neurology, 92, e2127–e2135. 10.1212/wnl.0000000000006800 [DOI] [PMC free article] [PubMed] [Google Scholar]
- Császma, I. , Andrási, E. , Lásztity, A. , Bertalan, É. , & Gawlik, D. (2003). Determination of Mo and Mn in human brain samples by different techniques. Journal of Analytical Atomic Spectrometry, 18, 1082–1087. 10.1039/B301732J [DOI] [Google Scholar]
- Dang, H. S. , Jaiswal, D. D. , Wadhwani, C. N. , Somasunderam, S. , & Dacosta, H. (1983). Infants with a congenital anomaly and the concentration of Mo, As, Mn, Zn and Cu in the mother's milk. The Science of the total environment, 27(1), 43–47. 10.1016/0048-9697(83)90121-3 [DOI] [PubMed] [Google Scholar]
- Daniali, S. S. , Yazdi, M. , Heidari‐Beni, M. , Taheri, E. , Zarean, E. , Goli, P. , & Kelishadi, R. (2023). Birth size outcomes in relation to maternal blood levels of some essential and toxic elements. Biological Trace Element Research, 201, 4–13. 10.1007/s12011-022-03121-w [DOI] [PubMed] [Google Scholar]
- Davidsson, L. , Almgren, A. , Juillerat, M. A. , & Hurrell, R. F. (1995). Manganese absorption in humans: The effect of phytic acid and ascorbic acid in soy formula. The American Journal of Clinical Nutrition, 62, 984–987. 10.1093/ajcn/62.5.984 [DOI] [PubMed] [Google Scholar]
- Davidsson, L. , Cederblad, A. , Lönnerdal, B. , & Sandström, B. (1991). The effect of individual dietary components on manganese absorption in humans. The American Journal of Clinical Nutrition, 54, 1065–1070. 10.1093/ajcn/54.6.1065 [DOI] [PubMed] [Google Scholar]
- Davis, C. D. , & Greger, J. L. (1992). Longitudinal changes of manganese‐dependent superoxide dismutase and other indexes of manganese and iron status in women. The American Journal of Clinical Nutrition, 55, 747–752. 10.1093/ajcn/55.3.747 [DOI] [PubMed] [Google Scholar]
- Davis, C. D. , Wolf, T. L. , & Greger, J. L. (1992). Varying levels of manganese and iron affect absorption and gut endogenous losses of manganese by rats. The Journal of Nutrition, 122, 1300–1308. 10.1093/jn/122.6.1300 [DOI] [PubMed] [Google Scholar]
- Davis, C. D. , Zech, L. , & Greger, J. L. (1993). Manganese metabolism in rats: An improved methodology for assessing gut endogenous losses. Proceedings of the Society for Experimental Biology and Medicine, 202, 103–108. 10.3181/00379727-202-43518 [DOI] [PubMed] [Google Scholar]
- Devenyi, A. G. , Barron, T. F. , & Mamourian, A. C. (1994). Dystonia, hyperintense basal ganglia, and high whole blood manganese levels in Alagille's syndrome. Gastroenterology, 106, 1068–1071. 10.1016/0016-5085(94)90769-2 [DOI] [PubMed] [Google Scholar]
- Diessl, J. , Berndtsson, J. , Broeskamp, F. , Habernig, L. , Kohler, V. , Vazquez‐Calvo, C. , Nandy, A. , Peselj, C. , Drobysheva, S. , Pelosi, L. , Vögtle, F. N. , Pierrel, F. , Ott, M. , & Büttner, S. , (2022). Manganese‐driven CoQ deficiency. Nature communications, 13(1), 6061. 10.1038/s41467-022-33641-x [DOI] [PMC free article] [PubMed] [Google Scholar]
- Diez‐Ewald, M. , Weintraub, L. R. , & Crosby, W. H. (1968). Interrelationship of iron and manganese metabolism. Proceedings of the Society for Experimental Biology and Medicine, 129, 448–451. 10.3181/00379727-129-33341 [DOI] [PubMed] [Google Scholar]
- Dion, L. A. , Bouchard, M. F. , Sauvé, S. , Barbeau, B. , Tucholka, A. , Major, P. , Gilbert, G. , Mergler, D. , & Saint‐Amour, D. (2016). MRI Pallidal Signal in Children Exposed to Manganese in Drinking Water. Neurotoxicology, 53, 124–131. 10.1016/j.neuro.2016.01.004 [DOI] [PubMed] [Google Scholar]
- Dion, L. A. , Saint‐Amour, D. , Sauvé, S. , Barbeau, B. , Mergler, D. , & Bouchard, M. F. (2018). Changes in water manganese levels and longitudinal assessment of intellectual function in children exposed through drinking water. Neurotoxicology, 64, 118–125. 10.1016/j.neuro.2017.08.015 [DOI] [PubMed] [Google Scholar]
- Długaszek, M. , & Kaszczuk, M. (2020). Assessment of the nutritional value of various teas infusions in terms of the macro‐ and trace elements content. Journal of Trace Elements in Medicine and Biology, 59, 126428. 10.1016/j.jtemb.2019.126428 [DOI] [PubMed] [Google Scholar]
- Donovan, U. M. , & Gibson, R. S. (1996). Dietary intakes of adolescent females consuming vegetarian, semi‐vegetarian, and omnivorous diets. The Journal of Adolescent Health, 18, 292–300. 10.1016/1054-139x(95)00133-d [DOI] [PubMed] [Google Scholar]
- Dorman, D. C. , Struve, M. F. , Vitarella, D. , Byerly, F. L. , Goetz, J. , & Miller, R. (2000). Neurotoxicity of manganese chloride in neonatal and adult CD rats following subchronic (21‐day) high‐dose oral exposure. Journal of Applied Toxicology, 20, 179–187. [DOI] [PubMed] [Google Scholar]
- Dörner, K. , Dziadzka, S. , Höhn, A. , Sievers, E. , Oldigs, H. D. , Schulz‐Lell, G. , & Schaub, J. (1989). Longitudinal manganese and copper balances in young infants and preterm infants fed on breast‐milk and adapted cow's milk formulas. The British Journal of Nutrition, 61, 559–572. 10.1079/bjn19890143 [DOI] [PubMed] [Google Scholar]
- EFSA (European Food Safety Authority) . (2010). Application of systematic review methodology to food and feed safety assessments to support decision making. EFSA Journal, 8(6), 90. 10.2903/j.efsa.2010.1637 [DOI] [Google Scholar]
- EFSA (European Food Safety Authority) . (2011). Use of the EFSA comprehensive European food consumption database in exposure assessment. EFSA Journal, 9(3), 34. 10.2903/j.efsa.2011.2097 [DOI] [Google Scholar]
- EFSA (European Food Safety Authority) . (2015a). The food classification and description system FoodEx 2 (revision 2). EFSA Supporting Publication, 12(5), 90. 10.2903/sp.efsa.2015.EN-804 [DOI] [Google Scholar]
- EFSA (European Food Safety Authority) . (2015b). Principles and process for dealing with data and evidence in scientific assessments. EFSA Journal, 13, 4121. 10.2903/j.efsa.2015.4121 [DOI] [Google Scholar]
- EFSA (European Food Safety Authority) . (2022). Protocol for the intake assessments performed in the context of the revision of tolerable upper intake levels for selected nutrients. EFSA Supporting Publications, 19, E200801E. 10.2903/sp.efsa.2022.e200801 [DOI] [Google Scholar]
- EFSA ANS Panel (EFSA Panel on Food Additives and Nutrient Sources added to Food) . (2009a). Inability to assess the safety of calcium amino acid chelate, copper amino acid chelate, magnesium amino acid chelate, manganese amino acid chelate and zinc amino acid chelate added for nutritional purposes to food supplements based on the supporting dossiers. EFSA Journal, 7, 1077. 10.2903/j.efsa.2009.1077 [DOI] [Google Scholar]
- EFSA ANS Panel (EFSA Panel on Food Additives and Nutrient Sources added to Food) . (2009b). Inability to assess the safety of manganese ethanolamine phosphate added for nutritional purposes as a source of manganese to food supplements and the bioavailability of the manganese from this source, based on the supporting dossier. EFSA Journal, 7, 1115. 10.2903/j.efsa.2009.1115 [DOI] [Google Scholar]
- EFSA ANS Panel (EFSA Panel on Food Additives and Nutrient Sources added to Food) . (2009c). Manganese ascorbate, manganese aspartate, manganese bisglycinate and manganese pidolate as sources of manganese added for nutritional purposes to food supplements. EFSA Journal, 7, 1114. 10.2903/j.efsa.2009.1114 [DOI] [Google Scholar]
- EFSA ANS Panel (EFSA Panel on Food Additives and Nutrient Sources added to Food) . (2013). Scientific opinion on (6S)‐5‐methyltetrahydrofolic acid, glucosamine salt as a source of folate added for nutritional purposes to food supplements. EFSA Journal, 11(10), 20. 10.2903/j.efsa.2013.3358 [DOI] [Google Scholar]
- EFSA FEEDAP Panel (EFSA Panel on Additives and Products or Substances used in Animal Feed) . (2010). Scientific opinion on the safety of a manganese chelate of hydroxy analogue of methionine (Mintrex®Mn) as feed additive for all species. EFSA Journal, 8(1), 12. 10.2903/j.efsa.2010.1424 [DOI] [Google Scholar]
- EFSA FEEDAP Panel (EFSA Panel on Additives and Products or Substances used in Animal Feed) . (2013a). Scientific opinion on the safety and efficacy of manganese compounds (E5) as feed additives for all species: Manganese chelate of amino acids, hydrate, based on a dossier submitted by Zinpro animal nutrition Inc. EFSA Journal, 11, 3324. 10.2903/j.efsa.2013.3324 [DOI] [Google Scholar]
- EFSA FEEDAP Panel (EFSA Panel on Additives and Products or Substances used in Animal Feed) . (2013b). Scientific opinion on the safety and efficacy of manganese compounds (E5) as feed additives for all species: Manganous oxide and manganous sulphate monohydrate, based on a dossier submitted by Eramet & Comilog Chemicals S.A. EFSA Journal, 11, 3435. 10.2903/j.efsa.2013.3435 [DOI] [Google Scholar]
- EFSA FEEDAP Panel (EFSA Panel on Additives and Products or Substances used in Animal Feed) . (2016a). Safety and efficacy of manganese compounds (E5) as feed additives for all animal species: Manganous carbonate; manganous chloride, tetrahydrate; manganous oxide; manganous sulphate, monohydrate; manganese chelate of amino acids, hydrate; manganese chelate of glycine, hydrate, based on a dossier submitted by FEFANA asbl. EFSA Journal, 14, 4395. 10.2903/j.efsa.2016.4395 [DOI] [Google Scholar]
- EFSA FEEDAP Panel (EFSA Panel on Additives and Products or Substances used in Animal Feed) . (2016b). Safety and efficacy of manganese hydroxychloride as feed additive for all animal species. EFSA Journal, 14, 4474. 10.2903/j.efsa.2016.4474 [DOI] [Google Scholar]
- EFSA NDA Panel (EFSA Panel on Dietetic Products, Nutrition and Allergies) . (2013). Scientific Opinion on Dietary Reference Values for manganese.
- EFSA NDA Panel (EFSA Panel on Nutrient, Novel Foods and Food Allergens) . (2022). Guidance for establishing and applying tolerable upper intake levels for vitamins and essential minerals. Draft for Internal Testing. [DOI] [PMC free article] [PubMed] [Google Scholar]
- EFSA Scientific Committee . (2011). Statistical Significance and Biological Relevance. EFSA Journal, 9, 2372. 10.2903/j.efsa.2011.2372 [DOI] [Google Scholar]
- EFSA Scientific Committee . (2012). Guidance on selected default values to be used by the EFSA scientific committee, scientific panels and units in the absence of actual measured data. EFSA Journal, 10, 2579. 10.2903/j.efsa.2012.2579 [DOI] [Google Scholar]
- EFSA Scientific Committee . (2017a). Guidance on the assessment of the biological relevance of data in scientific assessments. EFSA Journal, 15, 73. 10.2903/j.efsa.2017.4970 [DOI] [PMC free article] [PubMed] [Google Scholar]
- EFSA Scientific Committee . (2017b). Guidance on the use of the weight of evidence approach in scientific assessments. EFSA Journal, 15(8), 67. 10.2903/j.efsa.2017.4971 [DOI] [PMC free article] [PubMed] [Google Scholar]
- EFSA Scientific Committee . (2018). Guidance on uncertainty analysis in scientific assessments. EFSA Journal, 16(1), 5123. 10.2903/j.efsa.2018.5123 [DOI] [PMC free article] [PubMed] [Google Scholar]
- EFSA Scientific Committee . (2020). Draft for internal testing scientific committee guidance on appraising and integrating evidence from epidemiological studies for use in EFSA's scientific assessments. EFSA Journal, 18(8), 83. 10.2903/j.efsa.2020.6221 [DOI] [PMC free article] [PubMed] [Google Scholar]
- Erikson, K. M. , Shihabi, Z. K. , Aschner, J. L. , & Aschner, M. (2002). Manganese accumulates in iron‐deficient rat brain regions in a heterogeneous fashion and is associated with neurochemical alterations. Biological Trace Element Research, 87, 143–156. 10.1385/bter:87:1-3:143 [DOI] [PubMed] [Google Scholar]
- Ermidou‐Pollet, S. , Sdougas, N. , Bahou, M. , Bonatsos, D. , Makris, N. , Karydas, A. , & Pollet, S. (2003). Health status of inhabitants of a region of the Northwest Peloponnese, Greece, having drunk Mn‐contaminated water some years ago. Trace Elements and Electrolytes, 20, 187–191. 10.5414/TEP20187 [DOI] [Google Scholar]
- Eum, J. H. , Cheong, H. K. , Ha, E. H. , Ha, M. , Kim, Y. , Hong, Y. C. , Park, H. , & Chang, N. (2014). Maternal blood manganese level and birth weight: A MOCEH birth cohort study. Environmental Health, 13, 31. 10.1186/1476-069x-13-31 [DOI] [PMC free article] [PubMed] [Google Scholar]
- EVM (Expert Group on Vitamins and Minerals; UK: Food Standards Agency) . (2003). Safe upper levels for vitamins and minerals . https://cot.food.gov.uk/sites/default/files/vitmin2003.pdf , Publications FSA, http://www.food.gov.uk/multimedia/pdfs/vitmin2003.pdf
- FAO/WHO (Food and Agriculture Organization of the United Nations/World Health Organization) . (2004). Vitamin and mineral requirements in human nutrition. WHO and FAO (eds.). 2nd Edition .
- FAO/WHO (Food and Agriculture Organization of the United Nations/World Health Organization) . (2009). Principles and methods for the risk assessment of Chemicals in Food. Environmental Health Criteria, 240. [Google Scholar]
- Finley, J. W. (1999). Manganese absorption and retention by young women is associated with serum ferritin concentration. The American Journal of Clinical Nutrition, 70, 37–43. 10.1093/ajcn/70.1.37 [DOI] [PubMed] [Google Scholar]
- Finley, J. W. , Johnson, P. E. , & Johnson, L. K. (1994). Sex affects manganese absorption and retention by humans from a diet adequate in manganese. The American Journal of Clinical Nutrition, 60, 949–955. 10.1093/ajcn/60.6.949 [DOI] [PubMed] [Google Scholar]
- Finley, J. W. , Penland, J. G. , Pettit, R. E. , & Davis, C. D. (2003). Dietary manganese intake and type of lipid do not affect clinical or neuropsychological measures in healthy young women. The Journal of Nutrition, 133, 2849–2856. 10.1093/jn/133.9.2849 [DOI] [PubMed] [Google Scholar]
- Fitsanakis, V. A. , Zhang, N. , Garcia, S. , & Aschner, M. (2010). Manganese (Mn) and iron (Fe): Interdependency of transport and regulation. Neurotoxicity Research, 18, 124–131. 10.1007/s12640-009-9130-1 [DOI] [PMC free article] [PubMed] [Google Scholar]
- Fordahl, S. , Cooney, P. , Qiu, Y. , Xie, G. , Jia, W. , & Erikson, K. M. (2012). Waterborne manganese exposure alters plasma, brain, and liver metabolites accompanied by changes in stereotypic behaviors. Neurotoxicol Teratol, 34(1), 27–36. 10.1016/j.ntt.2011.10.003 [DOI] [PMC free article] [PubMed] [Google Scholar]
- Forrer, R. , Gautschi, K. , & Lutz, H. (2001). Simultaneous measurement of the trace elements Al, As, B, Be, Cd, Co, Cu, Fe, Li, Mn, Mo, Ni, Rb, Se, Sr, and Zn in human serum and their reference ranges by ICP‐MS. Biological Trace Element Research, 80, 77–93. 10.1385/bter:80:1:77 [DOI] [PubMed] [Google Scholar]
- Foster, M. L. , Bartnikas, T. B. , Johnson, L. C. , Herrera, C. , Pettiglio, M. A. , Keene, A. M. , Taylor, M. D. , & Dorman, D. C. (2015). Pharmacokinetic evaluation of the equivalency of gavage, dietary, and drinking water exposure to manganese in F344 rats. Toxicological Sciences, 145, 244–251. 10.1093/toxsci/kfv047 [DOI] [PMC free article] [PubMed] [Google Scholar]
- Foster, M. L. , Bartnikas, T. B. , Maresca‐Fichter, H. C. , Mercadante, C. , Dash, M. , Miller, C. , & Dorman, D. C. (2018). Neonatal C57BL/6J and parkin mice respond differently following developmental manganese exposure: Result of a high dose pilot study. Neurotoxicology, 64, 291–299. 10.1016/j.neuro.2017.10.002 [DOI] [PMC free article] [PubMed] [Google Scholar]
- Freeman, D. M. , O'Neal, R. , Zhang, Q. , Bouwer, E. J. , & Wang, Z. (2020). Manganese‐Induced Parkinsonism in Mice Is Reduced Using a Novel Contaminated Water Sediment Exposure Model. Environ Toxicol Pharmacol., 78, 103399. 10.1016/j.etap.2020.103399 [DOI] [PubMed] [Google Scholar]
- Freire, C. , Amaya, E. , Gil, F. , Murcia, M. , Llop, S. , Casas, M. , Vrijheid, M. , Lertxundi, A. , Irizar, A. , Fernández‐Tardón, G. , Castro‐Delgado, R. V. , Olea, N. , & Fernández, M. F. (2019). Placental metal concentrations and birth outcomes: The environment and childhood (INMA) project. International Journal of Hygiene and Environmental Health, 222, 468–478. 10.1016/j.ijheh.2018.12.014 [DOI] [PubMed] [Google Scholar]
- Fukushima, T. , Tan, X. , Luo, Y. , & Kanda, H. (2010). Relationship between blood levels of heavy metals and Parkinson's disease in China. Neuroepidemiology, 34(1), 18–24. 10.1159/000255462 [DOI] [PubMed] [Google Scholar]
- Fumagalli, E. , Funicello, M. , Rauen, T. , Gobbi, M. , & Mennini, T. (2008). Riluzole enhances the activity of glutamate transporters GLAST, GLT1 and EAAC1. European Journal of Pharmacology, 578, 171–176. 10.1016/j.ejphar.2007.10.023 [DOI] [PubMed] [Google Scholar]
- Furchner, J. E. , Richmond, C. R. , & Drake, G. A. (1966). Comparative metabolism of radionuclides in mammals‐III retention of Manganese‐54 in the mouse, rat, monkey and dog. Health Physics, 12, 1415–1424. [DOI] [PubMed] [Google Scholar]
- Gavin, C. E. , Gunter, K. K. , & Gunter, T. E. (1992). Mn2+ sequestration by mitochondria and inhibition of oxidative phosphorylation. Toxicology and Applied Pharmacology, 115, 1–5. 10.1016/0041-008x(92)90360-5 [DOI] [PubMed] [Google Scholar]
- Ghosh, R. , Dubey, S. , Chatterjee, S. , Ghosh, M. , Ray, B. K. , & Benito‐León, J. (2020). Hypermanganesemia induced chorea and cognitive decline in a tea seller. Tremor Other Hyperkinet Mov (N Y), 10, 45. 10.5334/tohm.537 [DOI] [PMC free article] [PubMed] [Google Scholar]
- Golub, M. S. , Hogrefe, C. E. , Germann, S. L. , Tran, T. T. , Beard, J. L. , Crinella, F. M. , & Lonnerdal, B. (2005). Neurobehavioral evaluation of rhesus monkey infants fed cow's milk formula, soy formula, or soy formula with added manganese. Neurotoxicology and teratology, 27(4), 615–627. 10.1016/j.ntt.2005.04.003 [DOI] [PubMed] [Google Scholar]
- Golub, M. S. , Hogrefe, C. E. , Germann, S. L. , Tran, T. T. , Beard, J. L. , Crinella, F. M. , & Lonnerdal, B. (2012). Erratum to “neurobehavioral evaluation of rhesus monkey infants fed cow's milk formula, soy formula, or soy formula with added manganese” [Neurotoxicology and teratology 27 (2005) 615–627]. Neurotoxicology and Teratology, 34, 220. 10.1016/j.ntt.2011.11.002 [DOI] [PubMed] [Google Scholar]
- Goullé, J. P. , Mahieu, L. , Castermant, J. , Neveu, N. , Bonneau, L. , Lainé, G. , Bouige, D. , & Lacroix, C. (2005). Metal and metalloid multi‐elementary ICP‐MS validation in whole blood, plasma, urine and hair. Reference Values. Forensic Sci Int, 153, 39–44. 10.1016/j.forsciint.2005.04.020 [DOI] [PubMed] [Google Scholar]
- Greger, J. L. (1998). Dietary standards for manganese: Overlap between nutritional and toxicological Studies1, 2. The Journal of Nutrition, 128, 368S–371S. 10.1093/jn/128.2.368S [DOI] [PubMed] [Google Scholar]
- Gruden, N. (1988). The effect of age and sex upon iron‐manganese interaction in different segments of the Rat's intestine. In Hurley L. S., Keen C. L., Lönnerdal B., & Rucker R. B. (Eds.), Trace elements in man and animals 6 (pp. 557–558). Springer US. [Google Scholar]
- Guan, H. , Wang, M. , Li, X. , Piao, F. , Li, Q. , Xu, L. , Kitamura, F. , & Yokoyama, K. (2014). Manganese concentrations in maternal and umbilical cord blood: Related to birth size and environmental factors. European Journal of Public Health, 24, 150–157. 10.1093/eurpub/ckt033 [DOI] [PubMed] [Google Scholar]
- Guilarte, T. R. , Chen, M. K. , McGlothan, J. L. , Verina, T. , Wong, D. F. , Zhou, Y. , Alexander, M. , Rohde, C. A. , Syversen, T. , Decamp, E. , Koser, A. J. , Fritz, S. , Gonczi, H. , Anderson, D. W. , & Schneider, J. S. (2006). Nigrostriatal dopamine system dysfunction and subtle motor deficits in manganese‐exposed non‐human primates. Experimental Neurology, 202, 381–390. 10.1016/j.expneurol.2006.06.015 [DOI] [PubMed] [Google Scholar]
- Guilarte, T. R. , & Gonzales, K. K. (2015). Manganese‐induced parkinsonism is not idiopathic Parkinson's disease: Environmental and genetic evidence. Toxicological Sciences, 146, 204–212. 10.1093/toxsci/kfv099 [DOI] [PMC free article] [PubMed] [Google Scholar]
- Gunter, T. E. , Gavin, C. E. , & Gunter, K. K. (2012). The role of mitochondrial oxidative stress and ATP depletion in the pathology of manganese toxicity. In Li Y. V. & Zhang J. H. (Eds.), Metal ion in stroke (pp. 591–606). Springer. [Google Scholar]
- Gunter, T. E. , Gerstner, B. , Gunter, K. K. , Malecki, J. , Gelein, R. , Valentine, W. M. , Aschner, M. , & Yule, D. I. (2013). Manganese transport via the transferrin mechanism. Neurotoxicology, 34, 118–127. 10.1016/j.neuro.2012.10.018 [DOI] [PMC free article] [PubMed] [Google Scholar]
- Gunter, T. E. , Miller, L. M. , Gavin, C. E. , Eliseev, R. , Salter, J. , Buntinas, L. , Alexandrov, A. , Hammond, S. , & Gunter, K. K. (2004). Determination of the oxidation states of manganese in brain, liver, and heart mitochondria. Journal of Neurochemistry, 88, 266–280. 10.1046/j.1471-4159.2003.02122.x [DOI] [PubMed] [Google Scholar]
- Gurol, K. C. , Aschner, M. , Smith, D. R. , & Mukhopadhyay, S. (2022). Role of excretion in manganese homeostasis and neurotoxicity: A historical perspective. American Journal of Physiology. Gastrointestinal and Liver Physiology, 322, G79–g92. 10.1152/ajpgi.00299.2021 [DOI] [PMC free article] [PubMed] [Google Scholar]
- Haddad, E. H. , Berk, L. S. , Kettering, J. D. , Hubbard, R. W. , & Peters, W. R. (1999). Dietary intake and biochemical, hematologic, and immune status of vegans compared with nonvegetarians. The American Journal of Clinical Nutrition, 70, 586s–593s. 10.1093/ajcn/70.3.586s [DOI] [PubMed] [Google Scholar]
- Hafeman, D. , Factor‐Litvak, P. , Cheng, Z. , van Geen, A. , & Ahsan, H. (2007). Association between manganese exposure through drinking water and infant mortality in Bangladesh. Environmental Health Perspectives, 115, 1107–1112. 10.1289/ehp.10051 [DOI] [PMC free article] [PubMed] [Google Scholar]
- Halldorsson, T. I. , Birgisdottir, B. E. , Anete Dudele, A. , Christensen, J. J. , & Thorisdottir, B. (2023). Preparatory work for the update of the tolerable upper intake levels for manganese. EFSA supporting publication, 133. 10.2903/sp.efsa.2023.EN-8193 [DOI] [Google Scholar]
- Hatano, S. , Nishi, Y. , & Usui, T. (1983). Erythrocyte manganese concentration in healthy Japanese children, adults, and the elderly, and in cord blood. The American Journal of Clinical Nutrition, 37, 457–460. 10.1093/ajcn/37.3.457 [DOI] [PubMed] [Google Scholar]
- Hazell, A. S. , Normandin, L. , Norenberg, M. D. , Kennedy, G. , & Yi, J. H. (2006). Alzheimer type II astrocytic changes following sub‐acute exposure to manganese and its prevention by antioxidant treatment. Neuroscience Letters, 396, 167–171. 10.1016/j.neulet.2005.11.064 [DOI] [PubMed] [Google Scholar]
- Health Canada (Health Canada) . (2019). Guidelines for Canadian drinking water quality: Guideline technical document – Manganese. Ontario. [Google Scholar]
- Heitland, P. , & Köster, H. D. (2006). Biomonitoring of 37 trace elements in blood samples from inhabitants of northern Germany by ICP‐MS. Journal of Trace Elements in Medicine and Biology, 20, 253–262. 10.1016/j.jtemb.2006.08.001 [DOI] [PubMed] [Google Scholar]
- Heuer, T. , Walter, C. , Krems, C. , & Hoffmann, I. (2012). Nährstoffzufuhr über Supplemente – Ergebnisse der Nationalen Verzehrsstudie II. 86–97 pp. (Max Rubner‐Institut).
- Hill, D. S. , Cabrera, R. , Wallis Schultz, D. , Zhu, H. , Lu, W. , Finnell, R. H. , & Wlodarczyk, B. J. (2015). Autism‐like behavior and epigenetic changes associated with autism as consequences of in utero exposure to environmental pollutants in a mouse model. Behav Neurol, 2015, 426263. 10.1155/2015/426263 [DOI] [PMC free article] [PubMed] [Google Scholar]
- Hindborg H (DTU Food National Institute.), 2015, Unpublished. Dietary supplements may contribute to an adequate micronutrient intake in Danish adults but increase the risk of overdose in children. [Google Scholar]
- Hope, S. , Daniel, K. , Gleason, K. L. , Comber, S. , Nelson, M. , & Powell, J. J. (2006). Influence of tea drinking on manganese intake, manganese status and leucocyte expression of MnSOD and cytosolic aminopeptidase P. European Journal of Clinical Nutrition, 60, 1–8. 10.1038/sj.ejcn.1602260 [DOI] [PubMed] [Google Scholar]
- Horning, K. J. , Caito, S. W. , Tipps, K. G. , Bowman, A. B. , & Aschner, M. (2015). Manganese is essential for neuronal health. Annual Review of Nutrition, 35, 71–108. 10.1146/annurev-nutr-071714-034419 [DOI] [PMC free article] [PubMed] [Google Scholar]
- Hunt, J. R. , Matthys, L. A. , & Johnson, L. K. (1998). Zinc absorption, mineral balance, and blood lipids in women consuming controlled lactoovovegetarian and omnivorous diets for 8 wk. The American Journal of Clinical Nutrition, 67, 421–430. 10.1093/ajcn/67.3.421 [DOI] [PubMed] [Google Scholar]
- Ikeda, S. , Yamaguchi, Y. , Sera, Y. , Ohshiro, H. , Uchino, S. , Yamashita, Y. , & Ogawa, M. (2000). Manganese deposition in the globus pallidus in patients with biliary atresia. Transplantation, 69. [DOI] [PubMed] [Google Scholar]
- IOM (Institute of Medicine, US, Panel on Micronutrients) . (2001). Dietary Reference Intakes for Vitamin A, Vitamin K, Arsenic, Boron, Chromium, Copper, Iodine, Iron, Manganese, Molybdenum, Nickel, Silicon, Vanadium, and Zinc. Washington (DC), National Academies Press (US). https://www.ncbi.nlm.nih.gov/books/NBK222310/, 10.17226/10026 [DOI] [PubMed]
- Irwinda, R. , Wibowo, N. , & Putri, A. S. (2019). The concentration of micronutrients and heavy metals in maternal serum, placenta, and cord blood: A cross‐sectional study in preterm birth. Journal of Pregnancy, 2019, 5062365. 10.1155/2019/5062365 [DOI] [PMC free article] [PubMed] [Google Scholar]
- Iwami, O. , Watanabe, T. , Moon, C. S. , Nakatsuka, H. , & Ikeda, M. (1994). Motor neuron disease on the Kii peninsula of Japan: Excess manganese intake from food coupled with low magnesium in drinking water as a risk factor. Science Total Environment, 149, 121–135. 10.1016/0048-9697(94)90010-8 [DOI] [PubMed] [Google Scholar]
- Iwata, S. (1977). Study of the effects of environmental factors on the local incidence of amyotrophic lateral sclerosis. Ecotoxicology and environmental safety, 1(3), 297–303. 10.1016/0147-6513(77)90021-5 [DOI] [PubMed] [Google Scholar]
- Johnson, P. E. , Lykken, G. I. , & Korynta, E. D. (1991). Absorption and biological half‐life in humans of intrinsic and extrinsic 54Mn tracers from foods of plant origin. The Journal of Nutrition, 121, 711–717. 10.1093/jn/121.5.711 [DOI] [PubMed] [Google Scholar]
- Karki, P. , Smith, K. , Johnson, J., Jr. , Aschner, M. , & Lee, E. (2015). Role of transcription factor yin yang 1 in manganese‐induced reduction of astrocytic glutamate transporters: Putative mechanism for manganese‐induced neurotoxicity. Neurochemistry International, 88, 53–59. 10.1016/j.neuint.2014.08.002 [DOI] [PMC free article] [PubMed] [Google Scholar]
- Keen, C. L. , Bell, J. G. , & Lönnerdal, B. (1986). The effect of age on manganese uptake and retention from Milk and infant formulas in rats. The Journal of Nutrition, 116, 395–402. 10.1093/jn/116.3.395 [DOI] [PubMed] [Google Scholar]
- Kehoe, L. , & Walton, J. (Munster Technological University). (2022). Report on the intake of micronutrients (Vitamin A, β‐carotene, retinol, vitamin D, vitamin E, vitamin B6, folic acid, iron and manganese) from food supplements in the Irish population .
- Kern, C. H. , & Smith, D. R. (2011). Preweaning Mn exposure leads to prolonged astrocyte activation and lasting effects on the dopaminergic system in adult male rats. Synapse, 65, 532–544. 10.1002/syn.20873 [DOI] [PMC free article] [PubMed] [Google Scholar]
- Kern, C. H. , Stanwood, G. D. , & Smith, D. R. (2010). Preweaning manganese exposure causes hyperactivity, disinhibition, and spatial learning and memory deficits associated with altered dopamine receptor and transporter levels. Synapse, 64, 363–378. 10.1002/syn.20736 [DOI] [PMC free article] [PubMed] [Google Scholar]
- Khan, K. , Factor‐Litvak, P. , Wasserman, G. A. , Liu, X. , Ahmed, E. , Parvez, F. , Slavkovich, V. , Levy, D. , Mey, J. , van Geen, A. , & Graziano, J. H. (2011). Manganese exposure from drinking water and children's classroom behavior in Bangladesh. Environmental Health Perspectives, 119, 1501–1506. 10.1289/ehp.1003397 [DOI] [PMC free article] [PubMed] [Google Scholar]
- Khan, K. , Wasserman, G. A. , Liu, X. , Ahmed, E. , Parvez, F. , Slavkovich, V. , Levy, D. , Mey, J. , van Geen, A. , Graziano, J. H. , & Factor‐Litvak, P. (2012). Manganese exposure from drinking water and children's academic achievement. Neurotoxicology, 33, 91–97. 10.1016/j.neuro.2011.12.002 [DOI] [PMC free article] [PubMed] [Google Scholar]
- Kim, D. S. , Jin, H. , Anantharam, V. , Gordon, R. , Kanthasamy, A. , & Kanthasamy, A. G. (2017). p73 gene in dopaminergic neurons is highly susceptible to manganese neurotoxicity. Neurotoxicology, 59, 231–239. 10.1016/j.neuro.2016.04.012 [DOI] [PMC free article] [PubMed] [Google Scholar]
- Kim, E. A. , Cheong, H. K. , Choi, D. S. , Sakong, J. , Ryoo, J. W. , Park, I. , & Kang, D. M. (2007). Effect of occupational manganese exposure on the central nervous system of welders: 1H magnetic resonance spectroscopy and MRI findings. Neurotoxicology, 28, 276–283. 10.1016/j.neuro.2006.05.013 [DOI] [PubMed] [Google Scholar]
- Kim, H. , Harrison, F. E. , Aschner, M. , & Bowman, A. B. (2022). Exposing the role of metals in neurological disorders: a focus on manganese. Trends in molecular medicine, 28(7), 555–568. 10.1016/j.molmed.2022.04.011 [DOI] [PMC free article] [PubMed] [Google Scholar]
- Kim, Y. , Park, J. K. , Choi, Y. , Yoo, C.‐I. , Lee, C. R. , Lee, H. , Lee, J.‐H. , Kim, S.‐R. , Jeong, T.‐H. , Yoon, C. S. , & Park, J.‐H. (2005). Blood manganese concentration is elevated in iron deficiency anemia patients, whereas Globus Pallidus signal intensity is minimally affected. Neurotoxicology, 26, 107–111. 10.1016/j.neuro.2004.06.004 [DOI] [PubMed] [Google Scholar]
- Kirchgessner, M. , Sherif, Y. S. , & Schwarz, F. J. (1982). Changes in absorption of manganese during gravidity and lactation. Annals of Nutrition & Metabolism, 26, 83–89. 10.1159/000176549 [DOI] [PubMed] [Google Scholar]
- Kirkley, K. S. , Popichak, K. A. , Afzali, M. F. , Legare, M. E. , & Tjalkens, R. B. (2017). Microglia amplify inflammatory activation of astrocytes in manganese neurotoxicity. Journal of Neuroinflammation, 14, 99. 10.1186/s12974-017-0871-0 [DOI] [PMC free article] [PubMed] [Google Scholar]
- Klaassen, C. D. (1974). Biliary excretion of manganese in rats, rabbits, and dogs. Toxicology and Applied Pharmacology, 29, 458–468. 10.1016/0041-008X(74)90117-3 [DOI] [PubMed] [Google Scholar]
- Komura, J. , & Sakamoto, M. (1991). Short‐term oral‐administration of several manganese compounds in mice ‐ physiological and behavioral alterations caused by different forms of manganese. Bulletin of Environmental Contamination and Toxicology, 46, 921–928. 10.1007/bf01689739 [DOI] [PubMed] [Google Scholar]
- Komura, J. , & Sakamoto, M. (1992). Effects of manganese forms on biogenic amines in the brain and behavioral alterations in the mouse: Long‐term oral administration of several manganese compounds. Environmental Research, 57(1), 34–44. 10.1016/s0013-9351(05)80017-9 [DOI] [PubMed] [Google Scholar]
- Kondakis, X. G. , Makris, N. , Leotsinidis, M. , Prinou, M. , & Papapetropoulos, T. (1989). Possible health effects of high manganese concentration in drinking water. Archives of Environmental Health, 44, 175–178. 10.1080/00039896.1989.9935883 [DOI] [PubMed] [Google Scholar]
- Kostial, K. , Blanusa, M. , Maljković, T. , Kello, D. , Rabar, I. , & Stara, J. F. (1989). Effect of a metal mixture in diet on the toxicokinetics and toxicity of cadmium, mercury and manganese in rats. Toxicology and Industrial Health, 5, 685–698. 10.1177/074823378900500509 [DOI] [PubMed] [Google Scholar]
- Kostial, K. , Blanusa, M. , & Piasek, M. (2005). Regulation of manganese accumulation in perinatally exposed rat pups. Journal of Applied Toxicology, 25, 89–93. 10.1002/jat.1039 [DOI] [PubMed] [Google Scholar]
- Kostial, K. , Kello, D. , Jugo, S. , Rabar, I. , & Maljković, T. (1978). Influence of age on metal metabolism and toxicity. Environmental Health Perspectives, 25, 81–86. 10.1289/ehp.782581 [DOI] [PMC free article] [PubMed] [Google Scholar]
- Krieger, D. , Krieger, S. , Theilmann, L. , Jansen, O. , Gass, P. , & Lichtnecker, H. (1995). Manganese and chronic hepatic encephalopathy. The Lancet, 346, 270–274. 10.1016/S0140-6736(95)92164-8 [DOI] [PubMed] [Google Scholar]
- Krishna, S. , Dodd, C. A. , Hekmatyar, S. K. , & Filipov, N. M. (2014). Brain deposition and neurotoxicity of manganese in adult mice exposed via the drinking water. Arch Toxicol, 88(1), 47–64. 10.1007/s00204-013-1088-3 [DOI] [PMC free article] [PubMed] [Google Scholar]
- Kwieciński, A. , & Nowak, P. (2009). Gestational manganese intoxication and anxiolytic‐like effects of diazepam and the 5‐HT1A receptor agonist 8‐OH‐DPAT in male Wistar rats. Pharmacological Reports, 61(6), 1061–1068. 10.1016/s1734-1140(09)70168-9 [DOI] [PubMed] [Google Scholar]
- Langley, R. L. , Kao, Y. , Mort, S. A. , Bateman, A. , Simpson, B. D. , & Reich, B. J. (2015). Adverse neurodevelopmental effects and hearing loss in children associated with manganese in well water, North Carolina, USA. J Environ Occup Sci, 4, 62–69. 10.5455/jeos.20150403060427 [DOI] [PMC free article] [PubMed] [Google Scholar]
- Lao, Y. , Dion, L. A. , Gilbert, G. , Bouchard, M. F. , Rocha, G. , Wang, Y. , Leporé, N. , & Saint‐Amour, D. (2017). Mapping the basal ganglia alterations in children chronically exposed to manganese. Scientific reports, 7, 41804. 10.1038/srep41804 [DOI] [PMC free article] [PubMed] [Google Scholar]
- Lee, D.‐Y. , Korynta, E. , & Johnson, P. E. (1990). Effects of sex and age on manganese metabolism in rats. Nutrition Research, 10, 1005–1014. 10.1016/S0271-5317(05)80042-9 [DOI] [Google Scholar]
- Lee, E. S. , Sidoryk, M. , Jiang, H. , Yin, Z. , & Aschner, M. (2009). Estrogen and tamoxifen reverse manganese‐induced glutamate transporter impairment in astrocytes. Journal of Neurochemistry, 110, 530–544. 10.1111/j.1471-4159.2009.06105.x [DOI] [PMC free article] [PubMed] [Google Scholar]
- Leotsinidis, M. , Alexopoulos, A. , & Kostopoulou‐Farri, E. (2005). Toxic and essential trace elements in human milk from Greek lactating women: Association with dietary habits and other factors. Chemosphere, 61, 238–247. 10.1016/j.chemosphere.2005.01.084 [DOI] [PubMed] [Google Scholar]
- Leung, T. K. C. , Lai, J. C. K. , Tricklebank, M. , Davison, A. N. , & Lim, L. (1982). Chronic manganese treatment of rats alters Synaptosomal uptake of dopamine and the Behavioural response to amphetamine administration. Journal of Neurochemistry, 39, 1496–1499. 10.1111/j.1471-4159.1982.tb12599.x [DOI] [PubMed] [Google Scholar]
- Li, D. , Wu, Q. , Xu, W. , Zheng, H. , Tong, Y. , & Li, Y. (2020). Dietary manganese intake is inversely associated with depressive symptoms in midlife women: A cross‐sectional study. Journal of Affective Disorders, 276, 914–919. 10.1016/j.jad.2020.07.070 [DOI] [PubMed] [Google Scholar]
- Li, S. J. , Jiang, L. , Fu, X. , Huang, S. , Huang, Y. N. , Li, X. R. , Chen, J. W. , Li, Y. , Luo, H. L. , Wang, F. , Ou, S. Y. , & Jiang, Y. M. (2014). Pallidal index as biomarker of manganese brain accumulation and associated with manganese levels in blood: A meta‐analysis. PLoS One, 9, e93900. 10.1371/journal.pone.0093900 [DOI] [PMC free article] [PubMed] [Google Scholar]
- Li, Y. , Guo, H. , Wu, M. , & Liu, M. (2013). Serum and dietary antioxidant status is associated with lower prevalence of the metabolic syndrome in a study in Shanghai, China. Asia Pacific Journal of Clinical Nutrition, 22, 60–68. 10.6133/apjcn.2013.22.1.06 [DOI] [PubMed] [Google Scholar]
- Listik, C. , Machado‐Porto, G. C. L. , Oliveira, M. O. , & Porto, F. H. G. (2012). Acquired hepatocerebral degeneration: A case report. Dementia & Neuropsychologia, 6, 59–63. [DOI] [PMC free article] [PubMed] [Google Scholar]
- Liu, J. , Jin, L. , Zhang, L. , Li, Z. , Wang, L. , Ye, R. , Zhang, Y. , & Ren, A. (2013). Placental concentrations of manganese and the risk of fetal neural tube defects. Journal of Trace Elements in Medicine and Biology, 27, 322–325. 10.1016/j.jtemb.2013.04.001 [DOI] [PubMed] [Google Scholar]
- Liu, Q. , Barker, S. , & Knutson, M. D. (2021). Iron and manganese transport in mammalian systems. Biochim Biophys Acta Mol Cell Res, 1868, 118890. 10.1016/j.bbamcr.2020.118890 [DOI] [PMC free article] [PubMed] [Google Scholar]
- Liu, W. , Xin, Y. , Li, Q. , Shang, Y. , Ping, Z. , Min, J. , Cahill, C. M. , Rogers, J. T. , & Wang, F. (2020). Biomarkers of environmental manganese exposure and associations with childhood neurodevelopment: A systematic review and meta‐analysis. Environmental Health, 19, 104. 10.1186/s12940-020-00659-x [DOI] [PMC free article] [PubMed] [Google Scholar]
- Lockman, P. R. , Roder, K. E. , & Allen, D. D. (2001). Inhibition of the rat blood‐brain barrier choline transporter by manganese chloride. Journal of Neurochemistry, 79, 588–594. 10.1046/j.1471-4159.2001.00589.x [DOI] [PubMed] [Google Scholar]
- Lucchini, R. G. , Aschner, M. , & Kim, Y. (2022). Chapter 21 ‐ Manganese. In Nordberg G. F. & Costa M. (Eds.), Handbook on the toxicology of metals (fifth edition) (pp. 501–538). Academic Press. [Google Scholar]
- Maitiniyazi, G. , Cao, X. , Chen, Y. , Zhang, R. , Liu, Y. , Li, Z. , Gu, D. , Li, T. , & Xia, S. (2022). Impact of gut microbiota on the association between diet and depressive symptoms in breast cancer. Nutrients, 14. 10.3390/nu14061186 [DOI] [PMC free article] [PubMed] [Google Scholar]
- Malecki, E. A. (2001). Manganese toxicity is associated with mitochondrial dysfunction and DNA fragmentation in rat primary striatal neurons. Brain Research Bulletin, 55, 225–228. 10.1016/s0361-9230(01)00456-7 [DOI] [PubMed] [Google Scholar]
- Malecki, E. A. , Radzanowski, G. M. , Radzanowski, T. J. , Gallaher, D. D. , & Greger, J. L. (1996). Biliary manganese excretion in conscious rats is affected by acute and chronic manganese intake but not by dietary fat. The Journal of Nutrition, 126, 489–498. 10.1093/jn/126.2.489 [DOI] [PubMed] [Google Scholar]
- Maynard, L. S. , & Cotzias, G. C. (1955). The partition of manganese among organs and intracellular organelles of the rat. The Journal of Biological Chemistry, 214, 489–495. [PubMed] [Google Scholar]
- McDougall, S. A. , Reichel, C. M. , Farley, C. M. , Flesher, M. M. , Der‐Ghazarian, T. , Cortez, A. M. , Wacan, J. J. , Martinez, C. E. , Varela, F. A. , Butt, A. E. , & Crawford, C. A. (2008). Postnatal manganese exposure alters dopamine transporter function in adult rats: Potential impact on nonassociative and associative processes. Neuroscience, 154(2), 848–860. 10.1016/j.neuroscience.2008.03.070 [DOI] [PMC free article] [PubMed] [Google Scholar]
- Mena, I. , Horiuchi, K. , Burke, K. , & Cotzias, G. C. (1969). Chronic manganese poisoning. Individual susceptibility and absorption of iron. Neurology, 19, 1000–1006. 10.1212/wnl.19.10.1000 [DOI] [PubMed] [Google Scholar]
- Miller, S. T. , Cotzias, G. C. , & Evert, H. A. (1975). Control of tissue manganese: Initial absence and sudden emergence of excretion in the neonatal mouse. The American Journal of Physiology, 229, 1080–1084. 10.1152/ajplegacy.1975.229.4.1080 [DOI] [PubMed] [Google Scholar]
- Milne, D. B. , Sims, R. L. , & Ralston, N. V. (1990). Manganese content of the cellular components of blood. Clinical Chemistry, 36, 450–452. [PubMed] [Google Scholar]
- Miyake, Y. , Tanaka, K. , Fukushima, W. , Sasaki, S. , Kiyohara, C. , Tsuboi, Y. , Yamada, T. , Oeda, T. , Miki, T. , Kawamura, N. , Sakae, N. , Fukuyama, H. , Hirota, Y. , & Nagai, M. (2011). Dietary intake of metals and risk of Parkinson's disease: A case‐control study in Japan. Journal of the Neurological Sciences, 306, 98–102. 10.1016/j.jns.2011.03.035 [DOI] [PubMed] [Google Scholar]
- Miyake, Y. , Tanaka, K. , Okubo, H. , Sasaki, S. , Furukawa, S. , & Arakawa, M. (2017). Manganese intake is inversely associated with depressive symptoms during pregnancy in Japan: Baseline data from the Kyushu Okinawa maternal and child health study. Journal of Affective Disorders, 211, 124–129. 10.1016/j.jad.2017.01.016 [DOI] [PubMed] [Google Scholar]
- Miyake, Y. , Tanaka, K. , Okubo, H. , Sasaki, S. , Tokinobu, A. , & Arakawa, M. (2021). Maternal metal intake during pregnancy and childhood behavioral problems in Japan: The Kyushu Okinawa maternal and child health study. Nutritional Neuroscience, 25, 1641–1649. 10.1080/1028415x.2021.1885241 [DOI] [PubMed] [Google Scholar]
- Mizoguchi, N. , Nishimura, Y. , Ono, H. , & Sakura, N. (2001). Manganese elevations in blood of children with congenital portosystemic shunts. European Journal of Pediatrics, 160, 247–250. 10.1007/s004310000720 [DOI] [PubMed] [Google Scholar]
- Molina, R. M. , Phattanarudee, S. , Kim, J. , Thompson, K. , Wessling‐Resnick, M. , Maher, T. J. , & Brain, J. D. (2011). Ingestion of Mn and Pb by rats during and after pregnancy alters iron metabolism and behavior in offspring. Neurotoxicology, 32, 413–422. 10.1016/j.neuro.2011.03.010 [DOI] [PMC free article] [PubMed] [Google Scholar]
- Moludi, J. , Ebrahimi, B. , Maleki, V. , Saiedi, S. , Tandoroost, A. , Jafari‐Vayghyan, H. , Alizadeh, S. , & Djafarian, K. (2020). Comparison of dietary macro and micronutrient intake with physical activity levels among children with and without autism: A case‐control study. Progress in Nutrition, 21, 49–55. 10.23751/pn.v21i2-S.6578 [DOI] [Google Scholar]
- Mora, A. M. , van Wendel de Joode, B. , Mergler, D. , Córdoba, L. , Cano, C. , Quesada, R. , Smith, D. R. , Menezes‐Filho, J. A. , & Eskenazi, B. (2015). Maternal blood and hair manganese concentrations, fetal growth, and length of gestation in the ISA cohort in Costa Rica. Environmental Research, 136, 47–56. 10.1016/j.envres.2014.10.011 [DOI] [PMC free article] [PubMed] [Google Scholar]
- Morcillo, P. , Cordero, H. , Ijomone, O. M. , Ayodele, A. , Bornhorst, J. , Gunther, L. , Macaluso, F. P. , Bowman, A. B. , & Aschner, M. (2021). Defective mitochondrial dynamics underlie manganese‐induced neurotoxicity. Molecular Neurobiology, 58, 3270–3289. 10.1007/s12035-021-02341-w [DOI] [PMC free article] [PubMed] [Google Scholar]
- Moreno, J. A. , Yeomans, E. C. , Streifel, K. M. , Brattin, B. L. , Taylor, R. J. , & Tjalkens, R. B. (2009). Age‐dependent susceptibility to manganese‐induced neurological dysfunction. Toxicological Sciences, 112, 394–404. 10.1093/toxsci/kfp220 [DOI] [PMC free article] [PubMed] [Google Scholar]
- Muthaiah, V. P. K. , Chen, G.‐D. , Ding, D. , Salvi, R. , & Roth, J. A. (2016). Effect of manganese and manganese plus noise on auditory function and cochlear structures. Neurotoxicology, 55, 65–73. 10.1016/j.neuro.2016.05.014 [DOI] [PubMed] [Google Scholar]
- Nachtman, J. P. , Tubben, R. E. , & Commissaris, R. L. (1986). Behavioral effects of chronic manganese administration in rats: Locomotor activity studies. Neurobehavioral Toxicology and Teratology, 8(6), 711–715. [PubMed] [Google Scholar]
- Nakamura, M. , Miura, A. , Nagahata, T. , Shibata, Y. , Okada, E. , & Ojima, T. (2019). Low zinc, copper, and manganese intake is associated with depression and anxiety symptoms in the Japanese working population: Findings from the eating habit and well‐being study. Nutrients, 11. 10.3390/nu11040847 [DOI] [PMC free article] [PubMed] [Google Scholar]
- Nandakumaran, M. , Al‐Sannan, B. , Al‐Sarraf, H. , & Al‐Shammari, M. (2016). Maternal‐fetal transport kinetics of manganese in perfused human placental lobule in vitro. The Journal of Maternal‐Fetal & Neonatal Medicine, 29, 274–278. 10.3109/14767058.2014.998193 [DOI] [PubMed] [Google Scholar]
- Nascimento, S. , Baierle, M. , Göethel, G. , Barth, A. , Brucker, N. , Charão, M. , Sauer, E. , Gauer, B. , Arbo, M. D. , Altknecht, L. , Jager, M. , Dias, A. C. , de Salles, J. F. , Saint' Pierre, T. , Gioda, A. , Moresco, R. , & Garcia, S. C. (2016). Associations among environmental exposure to manganese, neuropsychological performance, oxidative damage and kidney biomarkers in children. Environmental Research, 147, 32–43. 10.1016/j.envres.2016.01.035 [DOI] [PubMed] [Google Scholar]
- Nascimento, S. N. , Barth, A. , Göethel, G. , Baierle, M. , Charão, M. F. , Brucker, N. , Moro, A. M. , Bubols, G. B. , Sobreira, J. S. , Sauer, E. , Rocha, R. , Gioda, A. , Dias, A. C. , Salles, J. F. , & Garcia, S. C. (2015). Cognitive deficits and ALA‐D‐inhibition in children exposed to multiple metals. Environmental Research, 136, 387–395. 10.1016/j.envres.2014.10.003 [DOI] [PubMed] [Google Scholar]
- Newland, M. C. , Cox, C. , Hamada, R. , Oberdörster, G. , & Weiss, B. (1987). The clearance of manganese chloride in the primate. Fundamental and Applied Toxicology, 9, 314–328. 10.1016/0272-0590(87)90054-6 [DOI] [PubMed] [Google Scholar]
- Nkpaa, K. W. , Amadi, B. A. , Wegwu, M. O. , & Farombi, E. O. (2019). Ethanol increases manganese‐induced spatial learning and memory deficits via oxidative/nitrosative stress induced p53 dependent/independent hippocampal apoptosis. Toxicology, 418, 51–61. 10.1016/j.tox.2019.03.001 [DOI] [PubMed] [Google Scholar]
- Nkpaa, K. W. , Awogbindin, I. O. , Amadi, B. A. , Abolaji, A. O. , Adedara, I. A. , Wegwu, M. O. , & Farombi, E. O. (2019). Ethanol exacerbates manganese‐induced neurobehavioral deficits, striatal oxidative stress, and apoptosis via regulation of p53, Caspase‐3, and Bax/Bcl‐2 ratio‐dependent pathway. Biological Trace Element Research, 191(1), 135–148. 10.1007/s12011-018-1587-4 [DOI] [PubMed] [Google Scholar]
- Nkpaa, K. W. , Nkpaa, B. B. , Amadi, B. A. , Ogbolosingha, A. J. , Wopara, I. , Belonwu, D. C. , Patrick‐Iwuanyanwu, K. C. , Nwaichi, E. O. , Wegwu, M. O. , & Orisakwe, O. E. (2022). Selenium abates manganese‐induced striatal and hippocampal toxicity via abrogation of neurobehavioral deficits, biometal accumulation, oxidative stress, inflammation, and caspase‐3 activation in rats. Psychopharmacology (Berl), 239, 399–412. 10.1007/s00213-021-06010-7 [DOI] [PubMed] [Google Scholar]
- Nordberg, G. , Fowler, B. , Friberg, L. , Jernelov, A. , Nelson, N. , Piscator, M. , Sandstead, H. , Vostal, J. , & Vouk, V. (1978). Factors influencing metabolism and toxicity of metals: A consensus report. Environmental Health Perspectives, 25, 3–41. 10.1289/ehp.25-1637186 [DOI] [PMC free article] [PubMed] [Google Scholar]
- Norenberg, M. D. (1987). The role of astrocytes in hepatic encephalopathy. Neurochemical Pathology, 6, 13–33. 10.1007/bf02833599 [DOI] [PubMed] [Google Scholar]
- Nowak, P. , Bojanek, K. , Szkilnik, R. , Jośko, J. , Boroń, D. , Adwent, M. , Gorczyca, P. , Kostrzewa, R. M. , & Brus, R. (2011). Ontogenetic exposure of rats to pre‐ and post‐natal manganese enhances behavioral impairments produced by perinatal 6‐hydroxydopamine. Neurotoxicity Research, 19(4), 536–543. 10.1007/s12640-010-9184-0 [DOI] [PubMed] [Google Scholar]
- Nyarko‐Danquah, I. , Pajarillo, E. , Digman, A. , Soliman, K. F. A. , Aschner, M. , & Lee, E. (2020). Manganese accumulation in the Brain via various transporters and its neurotoxicity mechanisms. Molecules, 25. 10.3390/molecules25245880 [DOI] [PMC free article] [PubMed] [Google Scholar]
- OHAT/NTP (Office of Health Assessment and Translation, Division of the National Toxicology Program) . (2019). Handbook for Conducting a Literature‐Based Health Assessment Using OHAT Approach for Systematic Review and Evidence Integration. 102 pp. https://ntp.niehs.nih.gov/ntp/ohat/pubs/handbookmarch2019_508.pdf
- OHAT‐NTP (Office of Health Assessment and Translation‐Division of the National Toxicology Program) . (2015). OHAT risk of bias rating tool for human and animal studies. 37 pp. https://ntp.niehs.nih.gov/ntp/ohat/pubs/riskofbiastool_508.pdf
- Ohgami, N. , Yajima, I. , Iida, M. , Li, X. , Oshino, R. , Kumasaka, M. Y. , & Kato, M. (2016). Manganese‐mediated acceleration of age‐related hearing loss in mice. Scientific Reports, 6, 36306. 10.1038/srep36306 [DOI] [PMC free article] [PubMed] [Google Scholar]
- Ohishi, T. , Wang, L. , Akane, H. , Shiraki, A. , Goto, K. , Ikarashi, Y. , Suzuki, K. , Mitsumori, K. , & Shibutani, M. (2012). Reversible aberration of neurogenesis affecting late‐stage differentiation in the hippocampal dentate gyrus of rat offspring after maternal exposure to manganese chloride. Reproductive Toxicology, 34, 408–419. 10.1016/j.reprotox.2012.04.009 [DOI] [PubMed] [Google Scholar]
- Ohtake, T. , Negishi, K. , Okamoto, K. , Oka, M. , Maesato, K. , Moriya, H. , & Kobayashi, S. (2005). Manganese‐induced parkinsonism in a patient undergoing maintenance hemodialysis. American Journal of Kidney Diseases, 46, 749–753. 10.1053/j.ajkd.2005.05.033 [DOI] [PubMed] [Google Scholar]
- O'Neal, S. L. , Hong, L. , Fu, S. , Jiang, W. , Jones, A. , Nie, L. H. , & Zheng, W. (2014). Manganese accumulation in bone following chronic exposure in rats: Steady‐state concentration and half‐life in bone. Toxicology Letters, 229, 93–100. 10.1016/j.toxlet.2014.06.019 [DOI] [PMC free article] [PubMed] [Google Scholar]
- O'Neal, S. L. , & Zheng, W. (2015). Manganese toxicity upon overexposure: A decade in review. Current Environmental Health Reports, 2, 315–328. 10.1007/s40572-015-0056-x [DOI] [PMC free article] [PubMed] [Google Scholar]
- Oner, G. , & Sentürk, U. K. (1995). Reversibility of manganese‐induced learning defect in rats. Food and Chemical Toxicology, 33(7), 559–563. 10.1016/0278-6915(95)00020-3 [DOI] [PubMed] [Google Scholar]
- Oshiro, W. M. , McDaniel, K. L. , Beasley, T. E. , Moser, V. , & Herr, D. W. (2022). Impacts of a perinatal exposure to manganese coupled with maternal stress in rats: Learning, memory and attentional function in exposed offspring. Neurotoxicology and Teratology, 91, 107077. 10.1016/j.ntt.2022.107077 [DOI] [PMC free article] [PubMed] [Google Scholar]
- Oulhote, Y. , Mergler, D. , Barbeau, B. , Bellinger, D. C. , Bouffard, T. , Brodeur, M. , Saint‐Amour, D. , Legrand, M. , Sauvé, S. , & Bouchard, M. F. (2014). Neurobehavioral function in school‐age children exposed to manganese in drinking water. Environmental Health Perspectives, 122, 1343–1350. 10.1289/ehp.1307918 [DOI] [PMC free article] [PubMed] [Google Scholar]
- Pajarillo, E. , Johnson, J., Jr. , Rizor, A. , Nyarko‐Danquah, I. , Adinew, G. , Bornhorst, J. , Stiboller, M. , Schwerdtle, T. , Son, D. S. , Aschner, M. , & Lee, E. (2020). Astrocyte‐specific deletion of the transcription factor Yin Yang 1 in murine substantia nigra mitigates manganese‐induced dopaminergic neurotoxicity. The Journal of Biological Chemistry, 295, 15662–15676. 10.1074/jbc.RA120.015552 [DOI] [PMC free article] [PubMed] [Google Scholar]
- Pajarillo, E. , Nyarko‐Danquah, I. , Digman, A. , Multani, H. K. , Kim, S. , Gaspard, P. , Aschner, M. , & Lee, E. (2022). Mechanisms of manganese‐induced neurotoxicity and the pursuit of neurotherapeutic strategies. Frontiers in Pharmacology, 13, 1011947. 10.3389/fphar.2022.1011947 [DOI] [PMC free article] [PubMed] [Google Scholar]
- Papavasiliou, P. , Miller, S. , & Cotzias, G. (1966). Role of liver in regulating distribution and excretion of manganese. American Journal of Physiology‐Legacy Content, 211, 211–216. 10.1152/ajplegacy.1966.211.1.211 [DOI] [PubMed] [Google Scholar]
- Pappas, B. A. , Zhang, D. , Davidson, C. M. , Crowder, T. , Park, G. A. , & Fortin, T. (1997). Perinatal manganese exposure: Behavioral, neurochemical, and histopathological effects in the rat. Neurotoxicology and Teratology, 19, 17–25. 10.1016/s0892-0362(96)00185-7 [DOI] [PubMed] [Google Scholar]
- Parvez, F. , Wasserman, G. A. , Factor‐Litvak, P. , Liu, X. , Slavkovich, V. , Siddique, A. B. , Sultana, R. , Sultana, R. , Islam, T. , Levy, D. , Mey, J. L. , van Geen, A. , Khan, K. , Kline, J. , Ahsan, H. , & Graziano, J. H. (2011). Arsenic exposure and motor function among children in Bangladesh. Environmental Health Perspectives, 119, 1665–1670. 10.1289/ehp.1103548 [DOI] [PMC free article] [PubMed] [Google Scholar]
- Peneder, T. M. , Scholze, P. , Berger, M. L. , Reither, H. , Heinze, G. , Bertl, J. , Bauer, J. , Richfield, E. K. , Hornykiewicz, O. , & Pifl, C. (2011). Chronic exposure to manganese decreases striatal dopamine turnover in human alpha‐synuclein transgenic mice. Neuroscience, 180, 280–292. 10.1016/j.neuroscience.2011.02.017 [DOI] [PubMed] [Google Scholar]
- Penland, J. G. , & Johnson, P. E. (1993). Dietary calcium and manganese effects on menstrual cycle symptoms. American Journal of Obstetrics and Gynecology, 168, 1417–1423. 10.1016/s0002-9378(11)90775-3 [DOI] [PubMed] [Google Scholar]
- Qian, J. , Chen, T. , Lu, W. , Wu, S. , & Zhu, J. (2010). Breast milk macro‐ and micronutrient composition in lactating mothers from suburban and urban Shanghai. Journal of Paediatrics and Child Health, 46, 115–120. 10.1111/j.1440-1754.2009.01648.x [DOI] [PubMed] [Google Scholar]
- Quadri, M. , Federico, A. , Zhao, T. , Breedveld, G. J. , Battisti, C. , Delnooz, C. , Severijnen, L. A. , Di Toro, M. L. , Mignarri, A. , Monti, L. , Sanna, A. , Lu, P. , Punzo, F. , Cossu, G. , Willemsen, R. , Rasi, F. , Oostra, B. A. , van de Warrenburg, B. P. , & Bonifati, V. (2012). Mutations in SLC30A10 cause parkinsonism and dystonia with hypermanganesemia, polycythemia, and chronic liver disease. American Journal of Human Genetics, 90, 467–477. 10.1016/j.ajhg.2012.01.017 [DOI] [PMC free article] [PubMed] [Google Scholar]
- Rahman, S. M. , Akesson, A. , Kippler, M. , Grandér, M. , Hamadani, J. D. , Streatfield, P. K. , Persson, L. , El Arifeen, S. , & Vahter, M. (2013). Elevated manganese concentrations in drinking water may be beneficial for fetal survival. PLoS One, 8, e74119. 10.1371/journal.pone.0074119 [DOI] [PMC free article] [PubMed] [Google Scholar]
- Rahman, S. M. , Kippler, M. , Tofail, F. , Bölte, S. , Hamadani, J. D. , & Vahter, M. (2017). Manganese in drinking water and cognitive abilities and behavior at 10 years of age: A prospective cohort study. Environmental Health Perspectives, 125, 057003. 10.1289/ehp631 [DOI] [PMC free article] [PubMed] [Google Scholar]
- Rama Rao, K. V. , Reddy, P. V. , Hazell, A. S. , & Norenberg, M. D. (2007). Manganese induces cell swelling in cultured astrocytes. Neurotoxicology, 28, 807–812. 10.1016/j.neuro.2007.03.001 [DOI] [PubMed] [Google Scholar]
- Rehnberg, G. L. , Hein, J. F. , Carter, S. D. , & Laskey, J. W. (1980). Chronic manganese oxide administration to preweanling rats: Manganese accumulation and distribution. Journal of Toxicology and Environmental Health, 6, 217–226. 10.1080/15287398009529844 [DOI] [PubMed] [Google Scholar]
- Rehnberg, G. L. , Hein, J. F. , Carter, S. D. , & Laskey, J. W. (1985). Age‐dependent changes in gastrointestinal transport and retention of particulate manganese oxide in the rat. Journal of Toxicology and Environmental Health, 16, 887–899. 10.1080/15287398509530795 [DOI] [PubMed] [Google Scholar]
- Rehnberg, G. L. , Hein, J. F. , Carter, S. D. , Linko, R. S. , & Laskey, J. W. (1982). Chronic ingestion of Mn3O4 by rats: Tissue accumulation and distribution of manganese in two generations. Journal of Toxicology and Environmental Health, 9, 175–188. 10.1080/15287398209530153 [DOI] [PubMed] [Google Scholar]
- Reichel, C. M. , Wacan, J. J. , Farley, C. M. , Stanley, B. J. , Crawford, C. A. , & McDougall, S. A. (2006). Postnatal manganese exposure attenuates cocaine‐induced locomotor activity and reduces dopamine transporters in adult male rats. Neurotoxicology and Teratology, 28, 323–332. 10.1016/j.ntt.2006.02.002 [DOI] [PubMed] [Google Scholar]
- Rodrigues, E. G. , Bellinger, D. C. , Valeri, L. , Hasan, M. O. , Quamruzzaman, Q. , Golam, M. , Kile, M. L. , Christiani, D. C. , Wright, R. O. , & Mazumdar, M. (2016). Neurodevelopmental outcomes among 2‐ to 3‐year‐old children in Bangladesh with elevated blood lead and exposure to arsenic and manganese in drinking water. Environmental Health, 15, 44. 10.1186/s12940-016-0127-y [DOI] [PMC free article] [PubMed] [Google Scholar]
- Rodríguez‐Matas, M. C. , Campos, M. S. , López‐Aliaga, I. , Gómez‐Ayala, A. E. , & Lisbona, F. (1998). Iron‐manganese interactions in the evolution of iron deficiency. Annals of Nutrition & Metabolism, 42, 96–109. 10.1159/000012723 [DOI] [PubMed] [Google Scholar]
- Roe, M. A. , Bell, S. , Oseredczuk, M. , Christensen, T. , Westenbrink, S. , Pakkala, H. , Presser, K. , & Finglas, P. M. (2013). Updated food composition database for nutrient intake. EFSA Supporting Publication, 10(6), 21. 10.2903/sp.efsa.2013.EN-355 [DOI] [Google Scholar]
- Roels, H. , Meiers, G. , Delos, M. , Ortega, I. , Lauwerys, R. , Buchet, J. P. , & Lison, D. (1997). Influence of the route of administration and the chemical form (MnCl2, MnO2) on the absorption and cerebral distribution of manganese in rats. Archives of Toxicology, 71, 223–230. 10.1007/s002040050380 [DOI] [PubMed] [Google Scholar]
- Rossander‐Hultén, L. , Brune, M. , Sandström, B. , Lönnerdal, B. , & Hallberg, L. (1991). Competitive inhibition of iron absorption by manganese and zinc in humans. The American Journal of Clinical Nutrition, 54, 152–156. 10.1093/ajcn/54.1.152 [DOI] [PubMed] [Google Scholar]
- Roth, J. A. (2006). Homeostatic and toxic mechanisms regulating manganese uptake, retention, and elimination. Biological Research, 39, 45–57. 10.4067/s0716-97602006000100006 [DOI] [PubMed] [Google Scholar]
- Roth, J. A. , & Garrick, M. D. (2003). Iron interactions and other biological reactions mediating the physiological and toxic actions of manganese. Biochemical Pharmacology, 66, 1–13. 10.1016/S0006-2952(03)00145-X [DOI] [PubMed] [Google Scholar]
- Rubio‐López, N. , Morales‐Suárez‐Varela, M. , Pico, Y. , Livianos‐Aldana, L. , & Llopis‐González, A. (2016). Nutrient intake and depression symptoms in Spanish children: The ANIVA study. International Journal of Environmental Research and Public Health, 13. 10.3390/ijerph13030352 [DOI] [PMC free article] [PubMed] [Google Scholar]
- Rükgauer, M. , Klein, J. , & Kruse‐Jarres, J. D. (1997). Reference values for the trace elements copper, manganese, selenium, and zinc in the serum/plasma of children, adolescents, and adults. Journal of Trace Elements in Medicine and Biology, 11, 92–98. 10.1016/s0946-672x(97)80032-6 [DOI] [PubMed] [Google Scholar]
- Sachse, B. , Kolbaum, A. E. , Ziegenhagen, R. , Andres, S. , Berg, K. , Dusemund, B. , Hirsch‐Ernst, K. I. , Kappenstein, O. , Muller, F. , Rohl, C. , Lindtner, O. , Lampen, A. , & Schafer, B. (2019). Dietary manganese exposure in the adult population in Germany‐what does it mean in relation to health risks? Molecular Nutrition & Food Research, 63, e1900065. 10.1002/mnfr.201900065 [DOI] [PubMed] [Google Scholar]
- Sadek, A. H. , Rauch, R. , & Schulz, P. E. (2003). Parkinsonism due to manganism in a welder. International Journal of Toxicology, 22, 393–401. 10.1177/109158180302200511 [DOI] [PubMed] [Google Scholar]
- Sahni, V. , Léger, Y. , Panaro, L. , Allen, M. , Giffin, S. , Fury, D. , & Hamm, N. (2007). Case report: A metabolic disorder presenting as pediatric manganism. Environmental Health Perspectives, 115, 1776–1779. 10.1289/ehp.10421 [DOI] [PMC free article] [PubMed] [Google Scholar]
- Samolińska, W. , Kiczorowska, B. , Kwiecień, M. , & Rusinek‐Prystupa, E. (2017). Determination of minerals in herbal infusions promoting weight loss. Biological Trace Element Research, 175, 495–502. 10.1007/s12011-016-0790-4 [DOI] [PMC free article] [PubMed] [Google Scholar]
- Sánchez, B. , Casalots‐Casado, J. , Quintana, S. , Arroyo, A. , Martín‐Fumadó, C. , & Galtés, I. (2012). Fatal manganese intoxication due to an error in the elaboration of Epsom salts for a liver cleansing diet. Forensic science international, 223(1‐3), e1–e4. 10.1016/j.forsciint.2012.07.010 [DOI] [PubMed] [Google Scholar]
- Sanders, A. P. , Desrosiers, T. A. , Warren, J. L. , Herring, A. H. , Enright, D. , Olshan, A. F. , Meyer, R. E. , & Fry, R. C. (2014). Association between arsenic, cadmium, manganese, and lead levels in private wells and birth defects prevalence in North Carolina: A semi‐ecologic study. BMC Public Health, 14, 955. 10.1186/1471-2458-14-955 [DOI] [PMC free article] [PubMed] [Google Scholar]
- Sandström, B. , Davidsson, L. , Cederblad, A. , Eriksson, R. , & Lönnerdal, B. (1986). Manganese absorption and metabolism in man. Acta Pharmacol Toxicol (Copenh), 59(Suppl 7), 60–62. 10.1111/j.1600-0773.1986.tb02708.x [DOI] [PubMed] [Google Scholar]
- Sandström, B. , Davidsson, L. , Eriksson, R. , & Alpsten, M. (1990). Effect of long‐term trace element supplementation on blood trace element levels and absorption of (75Se), (54Mn) and (65Zn). Journal of Trace Elements and Electrolytes in Health and Disease, 4, 65–72. [PubMed] [Google Scholar]
- Santos, D. , Batoreu, C. , Mateus, L. , Marreilha dos Santos, A. P. , & Aschner, M. (2014). Manganese in human parenteral nutrition: Considerations for toxicity and biomonitoring. Neurotoxicology, 43, 36–45. 10.1016/j.neuro.2013.10.003 [DOI] [PMC free article] [PubMed] [Google Scholar]
- Sarkar, S. , Malovic, E. , Harischandra, D. S. , Ngwa, H. A. , Ghosh, A. , Hogan, C. , Rokad, D. , Zenitsky, G. , Jin, H. , Anantharam, V. , Kanthasamy, A. G. , & Kanthasamy, A. (2018). Manganese exposure induces neuroinflammation by impairing mitochondrial dynamics in astrocytes. Neurotoxicology, 64, 204–218. 10.1016/j.neuro.2017.05.009 [DOI] [PMC free article] [PubMed] [Google Scholar]
- SCF (Scientific Committee on Food) . (2000). Opinion of the Scientific Committee on Food on the Tolerable Upper Intake Level of manganese .
- Schäfer, U. , Anke, M. , Seifert, M. , & Fischer, A. B. (2004). Influences on the manganese intake, excretion and balance of adults, and on the manganese concentration of the consumed food determined by means of the duplicate portion technique. Trace Elements and Electrolytes, 21, 68–77. 10.5414/TEP21068 [DOI] [Google Scholar]
- Scheiber, I. F. , Wu, Y. , Morgan, S. E. , & Zhao, N. (2019). The intestinal metal transporter ZIP14 maintains systemic manganese homeostasis. The Journal of Biological Chemistry, 294, 9147–9160. 10.1074/jbc.RA119.008762 [DOI] [PMC free article] [PubMed] [Google Scholar]
- Schmitt, C. , Strazielle, N. , Richaud, P. , Bouron, A. , & Ghersi‐Egea, J. F. (2011). Active transport at the blood‐CSF barrier contributes to manganese influx into the brain. Journal of Neurochemistry, 117, 747–756. 10.1111/j.1471-4159.2011.07246.x [DOI] [PubMed] [Google Scholar]
- Schuh, M. J. (2016). Possible Parkinson's disease induced by chronic manganese supplement ingestion. The Consultant Pharmacist, 31, 698–703. 10.4140/TCP.n.2016.698 [DOI] [PubMed] [Google Scholar]
- Schullehner, J. , Thygesen, M. , Kristiansen, S. M. , Hansen, B. , Pedersen, C. B. , & Dalsgaard, S. (2020). Exposure to manganese in drinking water during childhood and association with attention‐deficit hyperactivity disorder: A Nationwide cohort study. Environmental Health Perspectives, 128, 97004. 10.1289/EHP6391 [DOI] [PMC free article] [PubMed] [Google Scholar]
- Sentürk, U. K. , & Oner, G. (1996). The effect of manganese‐induced hypercholesterolemia on learning in rats. Biological Trace Element Research, 51, 249–257. 10.1007/bf02784079 [DOI] [PubMed] [Google Scholar]
- Sewberath Misser, V. H. , Hindori‐Mohangoo, A. D. , Shankar, A. , Wickliffe, J. K. , Lichtveld, M. Y. , & Mans, D. R. A. (2022). Prenatal exposure to mercury, manganese, and Lead and adverse birth outcomes in Suriname: A population‐based birth cohort study. Toxics, 10. 10.3390/toxics10080464 [DOI] [PMC free article] [PubMed] [Google Scholar]
- Sista, S. R. , & Dronacharya, L. (2021). Manganese supplementation as a cause of parkinsonism and T1‐Hyperintensities on basal ganglia. Neurol Clin Pract, 11, e361–e362. 10.1212/cpj.0000000000000804 [DOI] [PMC free article] [PubMed] [Google Scholar]
- Soares, A. T. G. , Silva, A. C. , Tinkov, A. A. , Khan, H. , Santamaría, A. , Skalnaya, M. G. , Skalny, A. V. , Tsatsakis, A. , Bowman, A. B. , Aschner, M. , & Ávila, D. S. (2020). The impact of manganese on neurotransmitter systems. J Trace Elem Med Biol, 20(61), 126554. 10.1016/j.jtemb.2020.126554 [DOI] [PMC free article] [PubMed] [Google Scholar]
- Soetrisno, F. N. , & Delgado‐Saborit, J. M. (2020). Chronic exposure to heavy metals from informal e‐waste recycling plants and children's attention, executive function and academic performance. The Science of the total environment, 717, 137099. 10.1016/j.scitotenv.2020.137099 [DOI] [PubMed] [Google Scholar]
- Spahr, L. , Butterworth, R. F. , Fontaine, S. , Bui, L. , Therrien, G. , Milette, P. C. , Lebrun, L. H. , Zayed, J. , Leblanc, A. , & Pomier‐Layrargues, G. (1996). Increased blood manganese in cirrhotic patients: Relationship to pallidal magnetic resonance signal hyperintensity and neurological symptoms. Hepatology, 24, 1116–1120. 10.1002/hep.510240523 [DOI] [PubMed] [Google Scholar]
- Spangler, A. H. , & Spangler, J. G. (2009). Groundwater manganese and infant mortality rate by county in North Carolina: An ecological analysis. EcoHealth, 6, 596–600. 10.1007/s10393-010-0291-4 [DOI] [PubMed] [Google Scholar]
- Spencer, A. (1999). Whole blood manganese levels in pregnancy and the neonate. Nutrition, 15, 731–734. 10.1016/s0899-9007(99)00144-6 [DOI] [PubMed] [Google Scholar]
- Sprowles, J. L. N. , Amos‐Kroohs, R. M. , Braun, A. A. , Sugimoto, C. , Vorhees, C. V. , & Williams, M. T. (2018). Developmental manganese, lead, and barren cage exposure have adverse long‐term neurocognitive, behavioral and monoamine effects in Sprague‐Dawley rats. Neurotoxicol Teratol, 67, 50–64. 10.1016/j.ntt.2018.04.001 [DOI] [PMC free article] [PubMed] [Google Scholar]
- Státní zdravotní ústav . (2021). Systém monitorování zdravotního stavu obyvatelstva ČR ve vztahu k životnímu prostředí, Subsystém IV, Zdravotní důsledky zátěže lidského organismu cizorodými látkami z potravinových řetězců, dietární expozice. Czech Republic. [Google Scholar]
- Stewart, C. A. , Reivich, M. , Lucey, M. R. , & Gores, G. J. (2005). Neuroimaging in hepatic encephalopathy. Clinical Gastroenterology and Hepatology, 3, 197–207. 10.1016/s1542-3565(04)00531-2 [DOI] [PubMed] [Google Scholar]
- Stos, K. , Wozniak, A. , Rychlik, E. , Ziolkowska, I. , Glowala, A. , & Oltarzewski, M. (2021). Assessment of food supplement consumption in polish population of adults. Frontiers in Nutrition, 8. 10.3389/fnut.2021.733951 [DOI] [PMC free article] [PubMed] [Google Scholar]
- Streifel, K. M. , Moreno, J. A. , Hanneman, W. H. , Legare, M. E. , & Tjalkens, R. B. (2012). Gene deletion of nos2 protects against manganese‐induced neurological dysfunction in juvenile mice. Toxicological Sciences, 126, 183–192. 10.1093/toxsci/kfr335 [DOI] [PMC free article] [PubMed] [Google Scholar]
- Su, H. , Li, Z. , Fiati Kenston, S. S. , Shi, H. , Wang, Y. , Song, X. , Gu, Y. , Barber, T. , Aldinger, J. , Zou, B. , Ding, M. , Zhao, J. , & Lin, X. (2017). Joint toxicity of different heavy metal mixtures after a short‐term Oral repeated‐Administration in Rats. Int J Environ Res Public Health, 14, 1164. 10.3390/ijerph14101164 [DOI] [PMC free article] [PubMed] [Google Scholar]
- Sun, Y. , He, Y. , Yang, L. , Liang, D. , Shi, W. , Zhu, X. , Jiang, Y. , & Ou, C. (2020). Manganese induced nervous injury by α‐synuclein accumulation via ATP‐sensitive K(+) channels and GABA receptors. Toxicol Lett, 132, 164–170. 10.1016/j.toxlet.2020.07.008 [DOI] [PubMed] [Google Scholar]
- Takács, S. , Szabó, A. , Oszlánczi, G. , Paulik, E. , & Papp, A. (2012). A pilot study with simultaneous recording of changes in motility and cortical electrical activity of rats during four weeks of oral manganese exposure. International Journal of Environmental Health Research, 22(4), 331–339. 10.1080/09603123.2011.643228 [DOI] [PubMed] [Google Scholar]
- Takeda, A. , Ishiwatari, S. , & Okada, S. (1999). Manganese uptake into rat brain during development and aging. Journal of Neuroscience Research, 56, 93–98. [DOI] [PubMed] [Google Scholar]
- Takeda, A. , Sawashita, J. , & Okada, S. (1994). Localization in rat brain of the trace metals, zinc and manganese, after intracerebroventricular injection. Brain Research, 658, 252–254. 10.1016/s0006-8993(09)90032-4 [DOI] [PubMed] [Google Scholar]
- Thi Thu Nguyen, T. , Miyagi, S. , Tsujiguchi, H. , Kambayashi, Y. , Hara, A. , Nakamura, H. , Suzuki, K. , Yamada, Y. , Shimizu, Y. , & Nakamura, H. (2019). Association between lower intake of minerals and depressive symptoms among elderly Japanese women but not men: Findings from Shika study. Nutrients, 11. 10.3390/nu11020389 [DOI] [PMC free article] [PubMed] [Google Scholar]
- Tholin, K. , Sandström, B. , Palm, R. , & Hallmans, G. (1995). Changes in blood manganese levels during pregnancy in iron supplemented and non supplemented women. Journal of Trace Elements in Medicine and Biology, 9, 13–17. 10.1016/s0946-672x(11)80003-9 [DOI] [PubMed] [Google Scholar]
- Thomson, A. B. , Olatunbosun, D. , & Valverg, L. S. (1971). Interrelation of intestinal transport system for manganese and iron. The Journal of Laboratory and Clinical Medicine, 78, 642–655. [PubMed] [Google Scholar]
- Torrente, M. , Colomina, M. T. , & Domingo, J. L. (2005). Behavioral effects of adult rats concurrently exposed to high doses of oral manganese and restraint stress. Toxicology, 211, 59–69. 10.1016/j.tox.2005.02.010 [DOI] [PubMed] [Google Scholar]
- Tran, T. T. , Chowanadisai, W. , Crinella, F. M. , Chicz‐DeMet, A. , & Lönnerdal, B. (2002). Effect of high dietary manganese intake of neonatal rats on tissue mineral accumulation, striatal dopamine levels, and neurodevelopmental status. Neurotoxicology, 23, 635–643. 10.1016/s0161-813x(02)00091-8 [DOI] [PubMed] [Google Scholar]
- Tran, T. T. , Chowanadisai, W. , Lönnerdal, B. , Le, L. , Parker, M. , Chicz‐Demet, A. , & Crinella, F. M. (2002). Effects of neonatal dietary manganese exposure on brain dopamine levels and neurocognitive functions. Neurotoxicology, 23, 645–651. 10.1016/s0161-813x(02)00068-2 [DOI] [PubMed] [Google Scholar]
- Tsuji, M. , Shibata, E. , Morokuma, S. , Tanaka, R. , Senju, A. , Araki, S. , Sanefuji, M. , Koriyama, C. , Yamamoto, M. , Ishihara, Y. , Kusuhara, K. , & Kawamoto, T. (2018). The association between whole blood concentrations of heavy metals in pregnant women and premature births: The Japan environment and Children's study (JECS). Environmental Research, 166, 562–569. 10.1016/j.envres.2018.06.025 [DOI] [PubMed] [Google Scholar]
- Tuschl, K. , Clayton Peter, T. , Gospe Sidney, M. , Gulab, S. , Ibrahim, S. , Singhi, P. , Aulakh, R. , Ribeiro Reinaldo, T. , Barsottini Orlando, G. , Zaki Maha, S. , Del Rosario, M. L. , Dyack, S. , Price, V. , Rideout, A. , Gordon, K. , Wevers Ron, A. , Chong, W. K. K. , & Mills Philippa, B. (2016). Syndrome of hepatic cirrhosis, dystonia, polycythemia, and Hypermanganesemia caused by mutations in SLC30A10, a manganese transporter in man. The American Journal of Human Genetics, 99, 521. 10.1016/j.ajhg.2016.07.015 [DOI] [PMC free article] [PubMed] [Google Scholar]
- US EPA (US Environmental Protection Agency) , 2004. Drinking water health advisory for manganese. https://www.epa.gov/sites/default/files/2014‐09/documents/support_cc1_magnese_dwreport_0.pdf [Google Scholar]
- Venasse, M. , Gauthier, A. , Giroux, I. , & Pilutti, L. A. (2021). Dietary intake and characteristics in persons with multiple sclerosis. Multiple Sclerosis and Related Disorders, 56, 103237. 10.1016/j.msard.2021.103237 [DOI] [PubMed] [Google Scholar]
- Verina, T. , Kiihl, S. F. , Schneider, J. S. , & Guilarte, T. R. (2011). Manganese exposure induces microglia activation and dystrophy in the substantia nigra of non‐human primates. Neurotoxicology, 32, 215–226. 10.1016/j.neuro.2010.11.003 [DOI] [PMC free article] [PubMed] [Google Scholar]
- Vezér, T. , Kurunczi, A. , Náray, M. , Papp, A. , & Nagymajtényi, L. (2007). Behavioral effects of subchronic inorganic manganese exposure in rats. American Journal of Industrial Medicine, 50, 841–852. 10.1002/ajim.20485 [DOI] [PubMed] [Google Scholar]
- Vezér, T. , Papp, A. , Hoyk, Z. , Varga, C. , Náray, M. , & Nagymajtényi, L. (2005). Behavioral and neurotoxicological effects of subchronic manganese exposure in rats. Environmental Toxicology and Pharmacology, 19, 797–810. 10.1016/j.etap.2004.12.046 [DOI] [PubMed] [Google Scholar]
- Vieregge, P. , Heinzow, B. , Korf, G. , Teichert, H. M. , Schleifenbaum, P. , & Mosinger, H. U. (1995). Long‐term exposure to manganese in rural well water has no neurological effects. Canadian Journal of Neurological Sciences, 22, 286–289. 10.1017/s0317167100039482 [DOI] [PubMed] [Google Scholar]
- Wang, H. , Yang, F. , Xin, R. , Cui, D. , He, J. , Zhang, S. , & Sun, Y. (2020). The gut microbiota attenuate neuroinflammation in manganese exposure by inhibiting cerebral NLRP3 inflammasome. Biomed Pharmacother, 129, 110449. 10.1016/j.biopha.2020.110449 [DOI] [PubMed] [Google Scholar]
- Wang, M. , Tian, Y. , Yu, P. , Li, N. , Deng, Y. , Li, L. , Kang, H. , Chen, D. , Wang, H. , Liu, Z. , & Liang, J. (2022). Association between congenital heart defects and maternal manganese and iron concentrations: A case‐control study in China. Environmental Science and Pollution Research International, 29, 26950–26959. 10.1007/s11356-021-17054-9 [DOI] [PMC free article] [PubMed] [Google Scholar]
- Wasserman, G. A. , Liu, X. , Parvez, F. , Ahsan, H. , Factor‐Litvak, P. , van Geen, A. , Slavkovich, V. , LoIacono, N. J. , Cheng, Z. , Hussain, I. , Momotaj, H. , & Graziano, J. H. (2004). Water arsenic exposure and children's intellectual function in Araihazar, Bangladesh. Environmental Health Perspectives, 112, 1329–1333. 10.1289/ehp.6964 [DOI] [PMC free article] [PubMed] [Google Scholar]
- Wasserman, G. A. , Liu, X. , Parvez, F. , Ahsan, H. , Levy, D. , Factor‐Litvak, P. , Kline, J. , van Geen, A. , Slavkovich, V. , LoIacono, N. J. , Cheng, Z. , Zheng, Y. , & Graziano, J. H. (2006). Water manganese exposure and children's intellectual function in Araihazar, Bangladesh. Environmental Health Perspectives, 114, 124–129. 10.1289/ehp.8030 [DOI] [PMC free article] [PubMed] [Google Scholar]
- Wasserman, G. A. , Liu, X. , Parvez, F. , Factor‐Litvak, P. , Ahsan, H. , Levy, D. , Kline, J. , van Geen, A. , Mey, J. , Slavkovich, V. , Siddique, A. B. , Islam, T. , & Graziano, J. H. (2011). Arsenic and manganese exposure and children's intellectual function. Neurotoxicology, 32, 450–457. 10.1016/j.neuro.2011.03.009 [DOI] [PMC free article] [PubMed] [Google Scholar]
- WHO (World Health Organization) , 2021. Manganese in drinking water: Background document for development of WHO guidelines for drinking‐water quality. https://apps.who.int/iris/handle/10665/350933 [Google Scholar]
- Wilcox, J. M. , Consoli, D. C. , Paffenroth, K. C. , Spitznagel, B. D. , Calipari, E. S. , Bowman, A. B. , & Harrison, F. E. (2022). Manganese‐induced hyperactivity and dopaminergic dysfunction depend on age, sex and YAC128 genotype. Pharmacol Biochem Behav, 213, 173337. 10.1016/j.pbb.2022.173337 [DOI] [PMC free article] [PubMed] [Google Scholar]
- Wilson, D. C. , Tubman, T. R. , Halliday, H. L. , & McMaster, D. (1992). Plasma manganese levels in the very low birth weight infant are high in early life. Biology of the Neonate, 61, 42–46. 10.1159/000243529 [DOI] [PubMed] [Google Scholar]
- Wong, M. M. H. , Chan, K. Y. , & Lo, K. (2022). Manganese exposure and metabolic syndrome: A systematic review and meta‐analysis. Nutrients, 14. 10.3390/nu14040825 [DOI] [PMC free article] [PubMed] [Google Scholar]
- Woolf, A. , Wright, R. , Amarasiriwardena, C. , & Bellinger, D. (2002). A child with chronic manganese exposure from drinking water. Environmental Health Perspectives, 110, 613–616. 10.1289/ehp.02110613 [DOI] [PMC free article] [PubMed] [Google Scholar]
- Wünschmann, S. , Kühn, I. , Heidenreich, H. , Fränzle, S. , Wappelhorst, O. , & Markert, B. (2003). Transfer von Elementen in die Muttermilch. Forschungsbericht StSch 4258 im Auftrag des Bundesamtes für Strahlenschutz, Bundesministerium für Umwelt (p. 122). Naturschutz und Reaktorsicherheit. [Google Scholar]
- Yamamoto, M. , Eguchi, A. , Sakurai, K. , Nakayama, S. F. , Sekiyama, M. , Mori, C. , & Kamijima, M. (2022). Longitudinal analyses of maternal and cord blood manganese levels and neurodevelopment in children up to 3 years of age: The Japan environment and Children's study (JECS). Environment International, 161, 107126. 10.1016/j.envint.2022.107126 [DOI] [PubMed] [Google Scholar]
- Yamamoto, M. , Sakurai, K. , Eguchi, A. , Yamazaki, S. , Nakayama, S. F. , Isobe, T. , Takeuchi, A. , Sato, T. , Hata, A. , Mori, C. , & Nitta, H. (2019). Association between blood manganese level during pregnancy and birth size: The Japan environment and children's study (JECS). Environmental Research, 172, 117–126. 10.1016/j.envres.2019.02.007 [DOI] [PubMed] [Google Scholar]
- Yang, Y. , Zhang, J. , Yang, X. , Li, Z. , Wang, J. , Lu, C. , Nan, A. , & Zou, Y. (2021). Dysregulated APP expression and α‐secretase processing of APP is involved in manganese‐induced cognitive impairment. Ecotoxicology and Environmental Safety, 220, 112365. 10.1016/j.ecoenv.2021.112365 [DOI] [PubMed] [Google Scholar]
- Yoon, M. , Schroeter, J. D. , Nong, A. , Taylor, M. D. , Dorman, D. C. , Andersen, M. E. , & Clewell, H. J., III . (2011). Physiologically based pharmacokinetic modeling of fetal and neonatal manganese exposure in humans: Describing manganese homeostasis during development. Toxicological Sciences, 122, 297–316. 10.1093/toxsci/kfr141 [DOI] [PubMed] [Google Scholar]
- Zhang, K. , He, K. , Xu, J. , Nie, L. , Li, S. , Liu, J. , Long, D. , Dai, Z. , & Yang, X. (2021). Manganese exposure causes movement deficit and changes in the protein profile of the external globus pallidus in Sprague Dawley rats. Toxicology and Industrial Health, 37(12), 715–726. 10.1177/07482337211022223 [DOI] [PubMed] [Google Scholar]
- Zhao, F. , Cai, T. , Liu, M. , Zheng, G. , Luo, W. , & Chen, J. (2009). Manganese induces dopaminergic neurodegeneration via microglial activation in a rat model of manganism. Toxicological Sciences, 107, 156–164. 10.1093/toxsci/kfn213 [DOI] [PubMed] [Google Scholar]
- Zheng, W. , Fu, S. X. , Dydak, U. , & Cowan, D. M. (2011). Biomarkers of manganese intoxication. Neurotoxicology, 32, 1–8. 10.1016/j.neuro.2010.10.002 [DOI] [PMC free article] [PubMed] [Google Scholar]
- Zheng, W. , Ren, S. , & Graziano, J. H. (1998). Manganese inhibits mitochondrial aconitase: A mechanism of manganese neurotoxicity. Brain Research, 799, 334–342. 10.1016/s0006-8993(98)00481-8 [DOI] [PMC free article] [PubMed] [Google Scholar]
- Zota, A. R. , Ettinger, A. S. , Bouchard, M. , Amarasiriwardena, C. J. , Schwartz, J. , Hu, H. , & Wright, R. O. (2009). Maternal blood manganese levels and infant birth weight. Epidemiology, 20, 367–373. 10.1097/EDE.0b013e31819b93c0 [DOI] [PMC free article] [PubMed] [Google Scholar]
Associated Data
This section collects any data citations, data availability statements, or supplementary materials included in this article.
Supplementary Materials
Protocol for the Scientific Opinion on the revision of the EFSA's Tolerable Upper Intake Level of manganese
Methodological considerations in the calculation of intake estimates for manganese in European countries
EFSA's intake assessment of manganese
Manganese intake data from Competent Authorities in European countries
Public consultation on the draft scientific opinion on the tolerable upper intake level for manganese