

Abstract

Chromatographic separations at subzero temperature significantly improve the precision of back-exchange-corrected hydrogen–deuterium exchange mass spectrometry (HDX-MS) determinations. Our previously reported dual-enzyme HDX-MS analysis instrument used reversed phase liquid chromatography (RPLC) at −30 °C, but high backpressures limited flow rates and required materials and equipment rated for very high pressures. Here, we report the design and performance of a dual-enzyme HDX-MS analysis instrument comprising a RPLC trap column and a hydrophilic interaction liquid chromatography (HILIC) analytical column in a two-dimensional RPLC-HILIC configuration at subzero temperature. During operation at −30 °C, the HILIC column manifests greatly reduced backpressure, which enables faster analytical flow rates and the use of materials rated for lower maximum pressures. The average peptide eluted from a HILIC column during a 40 min gradient at −30 °C contained ≈13% more deuterium than peptides eluted from a tandem RPLC-RPLC apparatus using a conventional 8 min gradient at 0 °C. A subset of peptides eluted from the HILIC apparatus contained ≈24% more deuterium.
Introduction
Hydrogen–deuterium exchange mass spectrometry (HDX-MS) is a widely used tool for investigating the dynamics of proteins and their interactions in vitro(1−5) and promises to become a valuable tool for studies in vivo.6 For the biopharmaceutical discovery and development sector, HDX-MS data have become important for understanding interactions of proteins with covalently bound small-molecule drugs and also with large hydrogen-bonded protein and glycoprotein ligands, resulting in better understandings of their mechanism of action.7−11 HDX-MS data are used to substantiate and protect intellectual property, to support biologics license applications, and to evaluate the physicochemical similarity between a biosimilar candidate and the originator product.12−14 Most similarity comparisons are qualitative; however, scientists have made significant progress toward quantitative evaluations of HDX-MS data, including free energy determinations of biophysical processes.15−19 As HDX-MS measurement precision improves, quantitative evaluations may become ubiquitous.
Most HDX studies are conducted using bottom-up HDX-MS. The method involves the immersion of a protein in D2O for a specific labeling time tHDX, proteolysis of the protein into peptides, peptide separation with reversed-phase liquid chromatography (RPLC), mass spectrometric measurements, and computation of the peptide deuterium content from the observed mass envelope. In such studies, HDX-MS characterizes deuterium uptake rates to a resolution defined by peptide length.
During the analysis process HDX-MS measurements of deuterium content are degraded by back-exchange of H for D at the amide sites, decreasing the apparent peptide deuterium content. For most studies, back-exchange is minimized by performing analyses under cold, acidic conditions (pH ≈2.7, ≈0 °C) and using short (6–9.5 min) chromatographic gradients.4,20,21 Back-exchange rates vary with residue and sequence, and back-exchange in peptides typically ranges from 15% to 60%.22−33
To facilitate comparisons between samples, it is useful to compute DPeptideCorrected values that are corrected for H/D back-exchange and scaled to immersions in 100% D2O.21,28,34−39 Since the uncertainty of DPeptideCorrected increases as a function of the magnitude of back-exchange,40 it is important to minimize back-exchange during the acquisition of HDX-MS data, especially for applications relying on quantitative HDX-MS data.
Experimental procedures that suppress back-exchange during bottom-up HDX-MS analyses have employed chromatography in aprotic solvents,27,30 in supercritical fluid,25 and in subzero temperature environments.41−45 Subzero temperature chromatography allows the expansion of the elution window to ≥40 min, which can increase the number of peptides available for measurements of the deuterium content.41,42,44,45
Recently, we reported the design and performance of a dual-enzyme HDX-MS analysis instrument that operates at temperature as low as −30 °C.45,46 The instrument analyzes peptides using a tandem RPLC C18 column configuration. Measurements determined that the average peptide eluted during a 40 min gradient contained ≈16% more deuterium than peptides eluted with a conventional 8 min gradient at 0 °C, and a subset of peptides exhibited ≈26% more deuterium.
HDX-MS has used RPLC exclusively because peptides reside natively in aqueous media. As the organic fraction of the aqueous mobile phase increases, RPLC alkyl-based hydrophobic chemistries of the stationary phase (e.g., C8, C18) release peptides. For separations at subzero temperature, RPLC requires the aqueous phase to contain up to 45% ethylene glycol (EG). Consequently, the mobile phase has high viscosity, and peptide separations on RPLC columns require fluidic pressure beyond the capacity of many commercial chromatography pumps.
Hydrophilic interaction liquid chromatography (HILIC) reduces the total column pressure because the mobile phase contains mostly low-viscosity acetonitrile (ACN). In the subzero temperature environment, a HILIC column can operate at lower pressure and facilely separate peptides.47−54 For analyses of peptide mixtures, two-dimensional (2D) separation schemes using tandem RPLC and HILIC columns are reported.55−57
Here, we report the design and performance of a dual-enzyme HDX-MS analysis instrument comprising a RPLC trap column and a subzero-temperature HILIC analytical column in a 2D configuration. Protein samples undergo proteolysis and peptides in the aqueous effluent are trapped on an RPLC C18 column at ≈0 °C. Subsequently, a high-acetonitrile solvent washes peptides from the RPLC column into a subzero-temperature HILIC column. In the HILIC column, peptides are separated and eluted into an electrospray ionization mass spectrometer (ESI-MS) as the mobile phase becomes increasingly aqueous.
In subzero temperature environments, the HILIC column operates at low to moderate pressure due to the large ACN fraction in the mobile phase. This column configuration facilitates long duration chromatography gradients with a minimum of H/D back-exchange.
HDX-MS Apparatus Description
System Design
The HDX apparatus comprises a fluidic circuit box conjoined with a commercial robotic rail (Trajan Scientific and Medical, Morrisville, NC) that transports samples and schedules HDX experiments.46 The instrument interior comprises distinct, insulated compartments that house the valves and columns maintained at selected temperatures within ±0.058 °C. Construction details and performance specifications of this instrument in its RPLC implementation are documented elsewhere.45,46
Figure 1 and Table S1 in the Supporting Information present abridged representations of the HILIC HDX-MS instrument. Table S1 describes the valve states and their actions during the HDX-MS analysis of a protein. Figure S1 in the Supporting Information presents the unabridged diagram of this instrument, which was reconfigured from the RPLC apparatus reported previously.45,46 In all apparatus figures, state “A” for an N-port (N = 6, 8, 10) valve indicates that the rotor connects port 1 to port N, port 2 to port 3, port 4 to 5, and so on. State “B” indicates that the rotor connects port 1 to port 2, port 3 to port 4, ..., and port N – 1 to port N.
Figure 1.
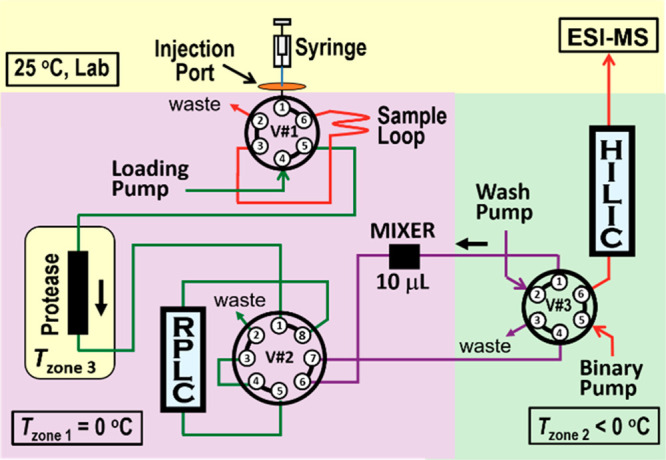
Fluidic circuits of the simplified subzero-temperature HILIC HDX-MS instrument, which contains a reversed-phase trap (RPLC) and a hydrophilic interaction liquid chromatography column (HILIC). Valve states (1, 2, and 3) correspond to AAB. See text.
Peptide separations on a HILIC column are mediated by a silica phase coated by a nonfreezable water layer bound by interactions with functionalized chemical groups on the silica surface; an ill-defined, bound, liquid water layer that freezes at temperature somewhat below the bulk solution freezing point;58 and a (freezable) bulk mobile phase composed predominately of ACN and water. To inhibit ice formation on the HILIC stationary phase and the phase separation of the H2O/ACN mixtures, the HILIC mobile phase contains a small fraction of ethylene glycol (EG).59,60 For water-free separations using ACN/MeOH, no EG is used.
For HILIC, it is important to reduce the percentage of water from the RPLC trap column effluent to the initial gradient conditions before entering the HILIC column to avoid distorted LC peaks.61 The aqueous content is reduced by flushing the RPLC trap column with an ACN-rich transfer solution that quickly releases nearly all peptides from the RPLC trap column. This effluent is mixed in a 10 μL mixer that is prefilled with ACN. The ACN in the mixer, which is ≈7× the volume of the RPLC trap, and the ACN-rich transfer solution combine and flow into the analytical column. The resulting mixture has nearly the same nonpolar to polar solvent ratio as the start of the LC gradient. Thus, LC peak splitting and broadening are minimized.
Experimental Section
Reagents and Materials
D2O (99.96 mol % D) was acquired from Cambridge Isotopes (Andover, MA). Formic acid (FA) was purchased from Sigma-Aldrich (St. Louis, MO). Ethylene glycol ReagentPlus (>99%) was purchased from Alfa Aesar (Ward Hill, MA). The analytical sample used for these experiments was a tryptic digest of fully reduced and iodoacetamide alkylated BSA (Thermo Scientific Pierce BSA Protein Digest Standard, LC-MS grade, catalog no. 88341).
Samples
Undeuterated and fully deuterated peptides were prepared by reconstituting lyophilized BSA peptides in H2O and D2O (99.96 mol % D), respectively, with 1% ACN to aid solubility. Peptides with D2O were kept at 4 °C for 1 h to fully exchange. Aliquots of each stock were stored at −80 °C. Prior to analysis, samples were diluted in either H2O or D2O to 0.1 μmol/L and equilibrated at 1 °C.
Chromatography
Each LC-MS analysis was initiated by the injection of a 2 pmol sample with the loading pump flowing water with 0.1% FA (volume fraction) at 150 μL/min. For the 2D-RPLC-HILIC system, the peptides were trapped on a C18 column (Phenomenex; Torrance, CA; Micro Trap Positive C18, 10 nm pore, 5 μm particle size, 10 mm long × 0.5 mm ID, part no. 05N-4753-AF) and separated on a HILIC analytical column (Waters Corp.; Milford, MA; ACQUITY Premier BEH Amide Column, 13 nm pore, 1.7 μm particle size, 50 mm long × 2.1 mm ID, catalogue no. 186009504).
For gradients using a HILIC analytical column, solvent A was ACN with a 0.1% FA volume fraction. Solvent B comprised mixtures of H2O/EG/MeOH and 0.1% FA in volume fractions determined by the working conditions (Table 1). PLP and PBP are the backpressures of the loading pump (LP) and binary pump (BP) supplying the gradient, respectively. Solvent B was prepared daily to minimize the pH drift reported for mixtures containing MeOH and FA.62 Solvents A and B combined for a 50 μL/min flow rate. Different LC gradients were used. When solvent B was 62.9% H2O, 27% EG, 10% MeOH, and 0.1% FA, the short gradient was 8% to 40% for 10 min, 40% to 55% for 0.5 min, 55% for 5 min, and 55% to 8% for 0.5 min and the long gradient was 8% to 15% for 0.5 min, 15% to 55% for 29.5 min, 55% for 3 min, and 55% to 8% for 0.5 min. When solvent B was 99.9% MeOH and 0.1% FA, the gradient was 10% to 40% B for 40 min, 40% to 55% B for 0.5 min, 55% B for 5 min, and 55% to 10% B for 0.5 min.
Table 1. Maximum LC pump pressures during operation of the HDX-MS analysis system.
| TZone2 (°C) | mode | aqueous/polar solvent volume fractions | PLP (MPa) | PBP (MPa) |
|---|---|---|---|---|
| 0 | RPLC | 100% H2O | 7 | 24 |
| –20 | RPLC | 63% H2O, 37% EG | 20 | 55 |
| –20 | HILIC | 63% H2O, 27% EG, 10% MeOH | 5 | 13 |
| –30 | RPLC | 55% H2O, 45% EG | 24 | 95 |
| –30 | HILIC | 63% H2O, 27% EG, 10% MeOH | 5 | 32 |
| –30 | HILIC | 100% MeOH | 5 | 6 |
For the tandem RPLC-RPLC system, a C18 trap column (Phenomenex, Inc.; Torrance, CA; Model Kinetex EVO C18, 10 nm pore, 2.6 μm particle size, 20 mm long × 2.1 mm ID) and C18 analytical column (Thermo Fisher Scientific; Waltham, MA; Accucore C18, 8 nm pore, 2.6 μm particle size, 30 mm long × 2.1 mm ID, catalogue no. 17126–032130) were used. For gradients using RPLC analytical columns, solvent A comprised mixtures of H2O/EG and 0.1% FA in volume fractions determined by the working conditions (Table 1). Solvent B comprised volume fractions of 99.9% ACN and 0.1% FA. Solvents A and B combined for a 50 μL/min flow rate. The short 8 min gradient for RPLC separations was 3% to 10% B for 0.5 min, 10% to 50% B for 7.5 min, 50% to 95% B for 1 min, 95% B for 4 min, and 95% to 3% B for 0.5 min. The long 40 min gradient for RPLC separations was 3% to 40% B for 40 min, 40% to 95% B for 1 min, 95% B for 4 min, and 95% to 3 % B for 1 min. The trap column was housed in Zone 2 for RPLC analytical separations with system setup as previously described.45,46
The EG, ACN, and MeOH molar fractions used in the chromatography solvent mixtures may bias pH meter readings differently;63 however, for consistency, all LC solutions and the 100% H2O solutions used during sample preparation were adjusted to pHMeter 2.7. pH was measured by a Mettler Toledo InLab Micro Pro-ISM pH probe on a Mettler Toledo SevenExcellence pH meter.
Mass Spectrometry
Mass spectra were recorded by a Thermo Orbitrap Elite (Thermo Fisher Scientific; Waltham, MA). The instrument settings were as follows: spray voltage, 3.7 kV; sheath gas flow rate, 25 (arbitrary units); and capillary temperature, 275 °C. MS spectra were acquired with 60000 resolution, which has been shown to yield accurate measurements of hydrogen and deuterium composition.64 From mass spectra obtained during HDX-MS experiments, the centroid of each deuterated peptide envelope and the relative deuterium uptake by each peptide were calculated by HDX Workbench.65
Temperature Calibrations
Each RTD and thermistor temperature sensor was calibrated against a colocated, type K thermocouple (Marlin Manufacturing Corp., Cleveland, Ohio) with reference junctions immersed in a water/ice bath. The vendor calibrated the thermocouples for service between 0 and −40 °C per procedures recommend by the National Voluntary Laboratory Accreditation Program (https://www.nist.gov/nvlap/about-nvlap).
Estimation of Amide Back-Exchange Rates
Deuterium contents of unstructured peptides in H2O were estimated by a LabVIEW 7.1 (NI, Austin TX) script. The script reproduces the main chain, intrinsic hydrogen exchange rates computed by Excel spreadsheets containing the 2018 reference parameters (http://hx2.med.upenn.edu/download.html) for oligo peptides in an aqueous solution.22,66,67 Simulations of the analytical process explicitly account for aqueous content by computing the molar water concentration every 0.1 s.
Results and Discussion
Retained Deuterium in Peptides
The sample in these experiments was a perdeuterated tryptic digest of fully reduced and carbamidomethylated BSA. Except for passage through a protease column, the peptides experienced the solution conditions found in standard bottom-up HDX-MS measurements with timing conditions consistent with use of a protease column volume. This measurement procedure simplifies data interpretation by avoiding possible conflation of chromatographic and proteolytic performance.
Short LC gradients (8–10 min) are typical of current HDX-MS studies. Long gradients are typically used in peptide mapping for improved peptide detection, but separations of deuterated peptides at 0 °C using long gradients suffer from high back-exchange. Therefore, we have included longer LC gradients (30–40 min) to demonstrate the improved capabilities enabled by operation at subzero temperature. For each instrument and gradient length, Table S2 lists the observed peptide retention times.
Table 2 lists the average percent deuterium retained in peptide amide groups, %DObsT, determined from tandem RPLC-RPLC and 2D-RPLC-HILIC measurements. Table S3 lists the percent deuterium content of the peptide amide groups, %DObsT,k, computed using eq 1:
| 1 |
where mt,HDX is the centroid mass for the immersion time of the sample in D2O, m0% is the undeuterated centroid mass, m100% is the centroid mass with full deuteration of all exchangeable backbone amides, and k references the peptide sequence. Uncertainties of %DObsT,k are reported as averages ± SD of triplicate measurements.
Table 2. Operational Parameters and Retained Deuterium Content of Peptides Separated with Tandem RPLC-RPLC and 2D-RPLC-HILIC Chromatographic Methods on the HDX Analysis Systema.
| LC gradient duration | 8 min | 8 min | 10 min | 40 min | 30 min | 40 min |
|---|---|---|---|---|---|---|
| method | RPLC | RPLC | HILIC | RPLC | HILIC | HILIC |
| TZone2 (°C) | 0 | –20 | –20 | –30 | –30 | –30 |
| polar solvent volume fraction of EG (%) | 37 | 27 | 45 | 27 | ||
| polar solvent volume fraction MeOH, % | 10 | 10 | 100 | |||
| ΔtProteolysis (s) @ TProteolysis (°C) | 120 @ 0 | 120 @ 0 | 60 @ 0 | 120 @ 0 | 60 @ 0 | 60 @ 0 |
| ΔtDesalt (s) @ TDesalt (°C) | 80 @ 0 | 80 @ −20 | 80 @ −30 | |||
| ΔtTransfer (s) @ TTransfer (°C) | 10 @ 0 | 10 @ 0 | 10 @ 0 | |||
| %DObsT | 71 ± 7 | 89 ± 7 | 84 ± 7 | 89 ± 7 | 81 ± 8 | 84 ± 9 |
| %DObsT improvement (%DObsT – [ %DObs0°C]8 min) | 18 ± 10 | 13 ± 10 | 18 ± 10 | 10 ± 11 | 13 ± 11 | |
| [%DObsT]High3 improvement (see text)b | 27 ± 2 | 20 ± 2 | 26 ± 1 | 19 ± 1 | 24 ± 2 | |
| elution window (s) | 190 | 155 | 80 | 1010 | 70 | 1090 |
| LC peak width (fwhm) (s) | 21 | 15 | 14 | 24 | 30 | 36 |
| %DEstT | 78 ± 7 | 91 ± 4 | 93 ± 4 | 92 ± 4 | 94 ± 4 | 94 ± 4 |
| MAD (%)c | 11 ± 6 | 6 ± 5 | 11 ± 6 | 6 ± 5 | 15 ± 8 | 12 ± 8 |
| average estimated deuterium occupancy of peptides at start of gradient (tRT= 0 s), %DEstT(0), (% D) | 89 ± 5 | 92 ± 4 | 95 ± 3 | 93 ± 4 | 95 ± 3 | 95 ± 3 |
Averages ± SD are calculated using 21 peptides measured in triplicate. LC peak widths reported are for peptide YLYEIAR2+.
 .
.
 .
.
The %DObsT show that peptides retain more deuterium as the operating temperature of the analytical columns decreases below 0 °C. For the 2D-RPLC-HILIC determinations %DObsT improvement ranges between 10 ± 11% and 13 ± 11%. For the tandem RPLC-RPLC determinations %DObsT improvement is 18 ± 10%. The reference for all calculations is [%DObs0°C]8min, which is the %DObsT computed for the 21 peptides measured during the 8 min gradient at 0 °C in the tandem RPLC-RPLC configuration. While tandem RPLC-RPLC data exhibited greater improvement in %DObsT than 2D-RPLC-HILIC data, both chromatography configurations demonstrate that long gradients at −30 °C elute peptides containing nearly the same back-exchange as peptides eluted during short gradients at −20 °C.
Since back-exchange rates in amide sites are distinct, a few peptides can contain several amide sites that sharply change chemical exchange rates with temperature. These sites can produce outliers in the peptide set used to compute %DObsT improvement. The three peptides showing the greatest increase in %DObsT,k (i.e., greatest deuteration) relative to the reference condition (RPLC, 8 min gradient, and 0 °C) are found by selecting the peptides exhibiting the three largest values of (%DObsT,k – [%DObs0 °C,k]8 min) from each set of 21 peptides. The selected peptides are k1 = CCAMCCAMTESLVNR,, k2 = YICCAMDNQDTISSK, and k3 = GACCAMLLPK. The average of the differences for these peptides yield [%DObsT ]High3 improvement for each T < 0 °C measurement condition (Table 2).
We note that [%DObsT]High3 improvement is 24 ± 2% for a 40 min 100% MeOH HILIC gradient at −30 °C and [%DObsT]High3 improvement is (19 ± 1) % for a 30 min HILIC gradient at −30 °C using 63% water, 27% EG, and 10% MeOH with 0.1% FA for solvent B. This result suggests that addition of MeOH reduces back-exchange.
For both subzero chromatography configurations, peptides CCAMCCAMTESLVNR, YICCAMDNQDTISSK, and GACCAMLLPK showed greatest improvement in %DObsT,k between 0 and −30 °C. Peptides CCAMCCAMTESLVNR and YICCAMDNQDTISSK appear last in tandem RPLC-RPLC chromatograms. In contrast, CCAMCCAMTESLVNR and YICCAMDNQDTISSK elute first in the 2D-RPLC-HILIC chromatograms. The elution order of GACCAMLLPK varies across the elution windows. Elution orders of peptide LC peaks are commonly reversed between RPLC and HILIC chromatography methods. In spite of the opposite peptide elution orders between the tandem RPLC-RPLC and 2D-RPLC-HILIC chromatograms, both configurations measure %DObs–30°C,k that differ by only ≈3% for the peptides
CCAMCCAMTESLVNR and YICCAMDNQDTISSK. For GACCAMLLPK %DObs–30°C,k values differ by ≈6%. These results indicate that both chromatographic apparatuses produce like results.
Estimation of Deuterium Retained in Peptides
For each peptide the deuteron occupancy (in Da) of each exchange site is estimated by simulation of the analysis process using the durations of the proteolysis step, ΔtProteolysis; the desalting step, ΔtDesalt; the sample transfer step, ΔtTransfer; the peptide LC peak retention time, tRT, observed during a chromatography run; solution properties of T, pH, and the molar fraction of H2O; and the elementary rate coefficients for acid-, base-, and water-catalyzed proton transfer. The sum of the occupancies divided by n·mD yields %DEstT. Bai et al.,22 have reported parameters for computing the acid-, base-, and water-catalyzed elementary exchange rates at amide sites as functions of pH and temperature.
Table S4 lists estimated percent retained deuterium content in peptides, %DEstT, which were computed using the updated elementary rate coefficient parameters of Zhang et al.28 For these calculations, the water-catalyzed rate coefficients, kw(T), are scaled by the aqueous molar fraction of water in solution. Since the molar fraction of water in solution varies during the HDX-MS analysis process, simulations used a temperature- and time-dependent rate coefficient, k′w(T, t) = kw(T)·FH2O(t), where FH2O(t) = ([H2O]/([H2O] + [ACN] + [EG] + [MeOH]))t. During simulations k′w(T, t) was computed every 0.1 s in accord with solution compositions of each processing step in the HDX-MS apparatus.
All calculations employed activation energies of 58.58, 71.13, and 79.50 kJ/mol for base-, acid-, and water-catalyzed exchange reactions.22 In the absence of known exchange elementary rate coefficients for carbamidomethylated (CAM) cysteine, rates computed for cysteine were used during calculations.
Simulations that accounted explicitly for water fraction (which used k′w(T, t)) yielded slightly larger %DEstT than simulations in 100% aqueous solution (which used kw(T)). Across the six measurement conditions values of %DEstT differ by 0.1% to 0.8%. This small effect was expected because water catalysis accounts for only a small fraction of the total hydrogen transfer reaction rate.
Simulations of the 63 tandem RPLC-RPLC and 63 2D-RPLC-HILIC peptide measurements found a frequency of 81% for overestimating the observed deuterium content, %DObsT,k. The relative precision of the kinetics simulations for predicting retained deuterium in peptides is assessed by calculations of relative mean absolute deviation (MAD) %, which is the mean of the absolute value differences between %DObsT,k and %DEstT,k, divided by %DEstT,k, across all peptides. The computed MAD % for each condition ranges from 6 ± 5% to 15 ± 8%, which is within the expected accuracy of kinetics calculations for complex systems. The MAD % results strongly support that pH, T, and elementary proton transfer rate coefficients retain their utility for simulations in nonaqueous solutions, as used during subzero HDX-MS analyses.
Solvent Mixtures and Temperature Affect LC Peak Widths
For each of the solvent and temperature conditions used, LC peak shapes and widths are shown in Figure 2. LC peak shapes were comparable across all conditions used. Peak widths (fwhm) for peptide YLYEIAR2+ ranged from 14 to 36 s (Table 2, Figure 2). For the shorter gradients and at lower temperatures, peaks were narrower and decreased in width. At −20 °C, both analytical RPLC and HILIC columns eluted similar LC widths of 15 and 14 s, respectively. At −30 °C, longer gradients produced wider peaks, with the RPLC column eluting a 24 s width and the HILIC column having a width of 30 s using low MeOH and 36 s using ≈100% MeOH in solvent B.
Figure 2.

LC peak profiles observed for peptide YLYEIAR2+ for each LC condition tested.
Operational Differences between Tandem RPLC-RPLC and 2D-RPLC-HILIC Subzero HDX-MS Instruments
Our previous publication described an HDX instrument with an RPLC trap and RPLC analytical column collocated in the subzero temperature compartment (Zone 2). The proteolytic peptides are captured on the RPLC trap column. After desalting, valve actuations connect the trap RPLC column in tandem with the RPLC analytical column and an ACN/H2O/EG gradient elutes peptides through both columns. Since the sample resides in both columns during the elution window, H/D exchange is minimized by maintaining both columns at subzero temperature. During the loading process, the EG added to prevent solvent freezing increases the viscosity and the resulting backpressure. The viscosity and backpressure limit the loading pump flow rate to ≈50 μL/min. Thus, the net exposure of peptides to the 0 °C environment is ΔtProteolysis ≈ 120 s (Table 2). When operated at TZone2 = −30 °C, simulations predict that the peptide set enters the analytical column containing %DEstT(0) = (92 ± 4) % D.
In the 2D-RPLC-HILIC HDX instrument the RPLC trap is in Zone 1 (0 °C). In a discrete step, peptides trapped at 0 °C are washed with low-viscosity ACN-rich solvent into the analytical column in Zone 2. This configuration employs LC low-pressure pumps and flow rates of 200 μL/min (Table 1). The net exposure of peptides to the 0 °C environment is ΔtProteolysis + ΔtTransfer = 77 s. At all operational Zone 2 temperatures the simulations predict that the peptide set enters the analytical column containing %DEstT(0) ≈ (94 ± 3) % D.
Modeling of the sample preparation process predicts that the 2D-RPLC-HILIC HDX instrument conserves the same or ≈2% more deuterium than the tandem RPLC-RPLC configuration. Finally, during the analytical step peptides were separated on a 50 mm column of 1.7 μm particles in the 2D-RPLC-HILIC instrument vs 50 mm column of 2.6 μm particles in the tandem RPLC-RPLC instrument. Thus, the 2D-RPLC-HILIC instrument can offer greater theoretical separation power.
The tandem RPLC-RPLC instrument showed no difference in average deuterium recovery between −30 and −20 °C for 8 min gradients.45 Viscosity of the chromatography solvents may account for the deuterium recovery performance of the tandem RPLC-RPLC instrument, as longitudinal temperature increases occur along columns due to frictional heating between the solvent and column packing.59,60 Increasing flow rates would increase pressure and would provide additional heating. The reduced pressures in the 2D-RPLC-HILIC instrument should minimize heating when increasing flow rates. MeOH is a slightly weaker elution solvent than water for HILIC, but it has a lower freezing point and viscosity, making it appropriate for subzero-temperature HILIC.
MeOH was shown to greatly reduce the maximum pressure during operation at −30 °C from 95 MPa for tandem RPLC-RPLC to 6 MPa for 2D-RPLC-HILIC eluting with 99.9% MeOH. The extremes in MeOH concentration were used to show the full range in pressures and contributions to retained deuterium to guide users in selecting the appropriate solvent system for their analysis conditions.
The 2D-RPLC-HILIC instrument operates at lower pressures, with the maximum pressure for the binary pump during operation ranging from 6 to 32 MPa at −30 °C depending on solvent, which is significantly lower than 95 MPa for the 2D-RPLC-RPLC instrument at −30 °C (Table 1). These lower pressures using HILIC are more broadly applicable to cheaper and current LC pumps in many laboratories. Additionally, HILIC accommodates flow rates of 150 μL/min or greater depending on the solvent system without surpassing the pressures experienced with RPLC at 50 μL/min. Nanoflow separations would also benefit from the reduced viscosity and pressures in HILIC.
Alternate Implementations of 2D-RPLC-HILIC Apparatus
The present apparatus (Figure S1) uses four valves and four pumps, facilitating studies that employ two proteases and allow for complex cleaning operations. Tables S1 and S5–S7 in the Supporting Information present alternate feasible implementations of the 2D-RPLC-HILIC HDX-MS instrument. Each implementation incorporates 2–4 valves and 2–5 pumps. Each implementation offers distinct operational capabilities.
Conclusion
The present dual-enzyme subzero-temperature HDX-MS analysis instrument is a versatile metrology platform that enables greater dynamic range for determinations of %DObsT,k with reduced back-exchange. The instrument can be arranged into two configurations that operate at −30 °C: a tandem RPLC-RPLC configuration requiring a very high pressure LC pump or a 2D-RPLC-HILIC configuration that operates at a much lower LC pump pressure.
Subzero-temperature 2D-RPLC-HILIC achieves a reduction in back-exchange that is about two-thirds the reduction achieved by the RPLC system. However, the HILIC system can also extend gradients to 40 min with minimal back-exchange penalty and has the added advantage of greatly reducing pump pressures to enable a wider range of flow rates from nanoflow to analytical flow. Additionally, features of the instrument minimize bias, variance, and drift during the determination of each DPeptideCorrected(tHDX). The advancements and alternative design functions reported herein will provide users of future commercialized versions of our system with a comprehensive toolbox for biopharmaceutical QC programs and protein similarity studies based on HDX-MS.
Supporting Information Available
The Supporting Information is available free of charge at https://pubs.acs.org/doi/10.1021/jasms.3c00243.
Fluidic circuits and operational valve states of the HDX-MS instrument, %DObsT,k and %DEstT,k values for selected BSA peptides, and retention times for selected BSA peptides (PDF)
Author Contributions
The manuscript was written by the coauthors. Both coauthors have approved the final version of the manuscript.
Certain commercial materials and equipment are identified to adequately specify experimental procedures. Such identifications neither imply recommendation or endorsement by the National Institute of Standards and Technology nor does it imply that the material or equipment identified is the best available for the purpose.
The authors declare no competing financial interest.
Supplementary Material
References
- Hydrogen Exchange Mass Spectrometry of Proteins: Fundamentals, Methods, and Applications; Weis D. D., Ed.; John Wiley & Sons, Ltd.: Chichester, England, 2016. [Google Scholar]
- Pirrone G. F.; Iacob R. E.; Engen J. R. Applications of Hydrogen/Deuterium Exchange MS from 2012 to 2014. Anal. Chem. 2015, 87 (1), 99–118. 10.1021/ac5040242. [DOI] [PMC free article] [PubMed] [Google Scholar]
- Engen J. R.; Botzanowski T.; Peterle D.; Georgescauld F.; Wales T. E. Developments in Hydrogen/Deuterium Exchange Mass Spectrometry. Anal. Chem. 2021, 93 (1), 567–582. 10.1021/acs.analchem.0c04281. [DOI] [PubMed] [Google Scholar]
- Gallagher E. S.; Hudgens J. W. Mapping Protein–Ligand Interactions with Proteolytic Fragmentation, Hydrogen/Deuterium Exchange-Mass Spectrometry. Methods Enzymol. 2016, 566, 357–404. 10.1016/bs.mie.2015.08.010. [DOI] [PubMed] [Google Scholar]
- James E. I.; Murphree T. A.; Vorauer C.; Engen J. R.; Guttman M. Advances in Hydrogen/Deuterium Exchange Mass Spectrometry and the Pursuit of Challenging Biological Systems. Chem. Rev. 2022, 122 (8), 7562–7623. 10.1021/acs.chemrev.1c00279. [DOI] [PMC free article] [PubMed] [Google Scholar]
- Zmyslowski A. M.; Baxa M. C.; Gagnon I. A.; Sosnick T. R. HDX-MS performed on BtuB in E. coli outer membranes delineates the luminal domain’s allostery and unfolding upon B12 and TonB binding. Proc. Natl. Acad. Sci. U. S. A. 2022, 119 (20), e2119436119. 10.1073/pnas.2119436119. [DOI] [PMC free article] [PubMed] [Google Scholar]
- Zhang J.; Chalmers M. J.; Stayrook K. R.; Burris L. L.; Garcia-Ordonez R. D.; Pascal B. D.; Burris T. P.; Dodge J. A.; Griffin P. R. Hydrogen/Deuterium Exchange Reveals Distinct Agonist/Partial Agonist Receptor Dynamics within Vitamin D Receptor/Retinoid X Receptor Heterodimer. Structure 2010, 18 (10), 1332–1341. 10.1016/j.str.2010.07.007. [DOI] [PMC free article] [PubMed] [Google Scholar]
- West G. M.; Chien E. Y.; Katritch V.; Gatchalian J.; Chalmers M. J.; Stevens R. C.; Griffin P. R. Ligand-dependent perturbation of the conformational ensemble for the GPCR β2 adrenergic receptor revealed by HDX. Structure 2011, 19 (10), 1424–1432. 10.1016/j.str.2011.08.001. [DOI] [PMC free article] [PubMed] [Google Scholar]
- Wagner N. D.; Huang Y.; Liu T.; Gross M. L. Post-HDX Deglycosylation of Fc Gamma Receptor IIIa Glycoprotein Enables HDX Characterization of Its Binding Interface with IgG. J. Am. Soc. Mass Spectrom. 2021, 32 (7), 1638–1643. 10.1021/jasms.1c00003. [DOI] [PMC free article] [PubMed] [Google Scholar]
- Anderson K. W.; Bergonzo C.; Scott K.; Karageorgos I. L.; Gallagher E. S.; Tayi V. S.; Butler M.; Hudgens J. W. HDX-MS and MD Simulations Provide Evidence for Stabilization of the IgG1—FcγRIa (CD64a) Immune Complex Through Intermolecular Glycoprotein Bonds. J. Mol. Biol. 2022, 434 (2), 167391. 10.1016/j.jmb.2021.167391. [DOI] [PubMed] [Google Scholar]
- Jethva P. N.; Gross M. L. Hydrogen deuterium exchange and other mass spectrometry- based approaches for epitope mapping. Front. Anal. Sci. 2023, 3, 1118749. 10.3389/frans.2023.1118749. [DOI] [PMC free article] [PubMed] [Google Scholar]
- Visser J.; Feuerstein I.; Stangler T.; Schmiederer T.; Fritsch C.; Schiestl M. Physicochemical and Functional Comparability Between the Proposed Biosimilar Rituximab GP2013 and Originator Rituximab. BioDrugs 2013, 27 (5), 495–507. 10.1007/s40259-013-0036-3. [DOI] [PMC free article] [PubMed] [Google Scholar]
- Wei H.; Mo J.; Tao L.; Russell R. J.; Tymiak A. A.; Chen G.; Iacob R. E.; Engen J. R. Hydrogen/deuterium exchange mass spectrometry for probing higher order structure of protein therapeutics: methodology and applications. Drug Discovery Today 2014, 19 (1), 95–102. 10.1016/j.drudis.2013.07.019. [DOI] [PMC free article] [PubMed] [Google Scholar]
- Rogstad S.; Faustino A.; Ruth A.; Keire D.; Boyne M.; Park J. A Retrospective Evaluation of the Use of Mass Spectrometry in FDA Biologics License Applications. J. Am. Soc. Mass Spectrom. 2017, 28 (5), 786–794. 10.1007/s13361-016-1531-9. [DOI] [PubMed] [Google Scholar]
- Konermann L.; Simmons D. A. Protein-folding kinetics and mechanisms studied by pulse-labeling and mass spectrometry. Mass Spectrom. Rev. 2003, 22 (1), 1–26. 10.1002/mas.10044. [DOI] [PubMed] [Google Scholar]
- Simmons D. A.; Dunn S. D.; Konermann L. Conformational dynamics of partially denatured myoglobin studied by time-resolved electrospray mass spectrometry with online hydrogen-deuterium exchange. Biochem. 2003, 42 (19), 5896–5905. 10.1021/bi034285e. [DOI] [PubMed] [Google Scholar]
- Pan Y.; Brown L.; Konermann L. Hydrogen Exchange Mass Spectrometry of Bacteriorhodopsin Reveals Light-Induced Changes in the Structural Dynamics of a Biomolecular Machine. J. Am. Chem. Soc. 2011, 133 (50), 20237–20244. 10.1021/ja206197h. [DOI] [PubMed] [Google Scholar]
- Smit J. H.; Krishnamurthy S.; Srinivasu B. Y.; Parakra R.; Karamanou S.; Economou A. Probing Universal Protein Dynamics Using Hydrogen-Deuterium Exchange Mass Spectrometry-Derived Residue-Level Gibbs Free Energy. Anal. Chem. 2021, 93 (38), 12840–12847. 10.1021/acs.analchem.1c02155. [DOI] [PubMed] [Google Scholar]
- Hamuro Y. Quantitative Hydrogen/Deuterium Exchange Mass Spectrometry. J. Am. Soc. Mass Spectrom. 2021, 32 (12), 2711–2727. 10.1021/jasms.1c00216. [DOI] [PubMed] [Google Scholar]
- Engen J. R.; Wales T. E. Analytical Aspects of Hydrogen Exchange Mass Spectrometry. Annu. Rev. anal. Chem. 2015, 8, 127–148. 10.1146/annurev-anchem-062011-143113. [DOI] [PMC free article] [PubMed] [Google Scholar]
- Hudgens J. W.; Gallagher E. S.; Karageorgos I.; Anderson K. W.; Filliben J. J.; Huang R. Y. C.; Chen G.; Bou-Assaf G. M.; Espada A.; Chalmers M. J.; Harguindey E.; Zhang H.-M.; Walters B. T.; Zhang J.; Venable J.; Steckler C.; Park I.; Brock A.; Lu X.; Pandey R.; Chandramohan A.; Anand G. S.; Nirudodhi S. N.; Sperry J. B.; Rouse J. C.; Carroll J. A.; Rand K. D.; Leurs U.; Weis D. D.; Al-Naqshabandi M. A.; Hageman T. S.; Deredge D.; Wintrode P. L.; Papanastasiou M.; Lambris J. D.; Li S.; Urata S. Interlaboratory Comparison of Hydrogen–Deuterium Exchange Mass Spectrometry Measurements of the Fab Fragment of NISTmAb. Anal. Chem. 2019, 91 (11), 7336–7345. 10.1021/acs.analchem.9b01100. [DOI] [PMC free article] [PubMed] [Google Scholar]
- Bai Y. W.; Milne J. S.; Mayne L.; Englander S. W. Primary Structure Effects on Peptide Group Hydrogen-Exchange. Proteins: Struct. Funct. Genet. 1993, 17 (1), 75–86. 10.1002/prot.340170110. [DOI] [PMC free article] [PubMed] [Google Scholar]
- Ehring H. Hydrogen exchange electrospray ionization mass spectrometry studies of structural features of proteins and protein/protein interactions. Anal. Biochem. 1999, 267 (2), 252–259. 10.1006/abio.1998.3000. [DOI] [PubMed] [Google Scholar]
- Lam T. T.; Lanman J. K.; Emmett M. R.; Hendrickson C. L.; Marshall A. G.; Prevelige P. E. Mapping of protein:protein contact surfaces by hydrogen/deuterium exchange, followed by on-line high-performance liquid chromatography-electrospray ionization Fourier-transform ion-cyclotron-resonance mass analysis. J. Chromatogr. A 2002, 982 (1), 85–95. 10.1016/S0021-9673(02)01357-2. [DOI] [PubMed] [Google Scholar]
- Emmett M. R.; Kazazic S.; Marshall A. G.; Chen W.; Shi S. D. H.; Bolaños B.; Greig M. J. Supercritical Fluid Chromatography Reduction of Hydrogen/Deuterium Back Exchange in Solution-Phase Hydrogen/Deuterium Exchange with Mass Spectrometric Analysis. Anal. Chem. 2006, 78 (19), 7058–7060. 10.1021/ac060693n. [DOI] [PubMed] [Google Scholar]
- Kaltashov I. A.; Bobst C. E.; Abzalimov R. R. H/D exchange and mass spectrometry in the studies of protein conformation and dynamics: is there a need for a top-down approach?. Anal. Chem. 2009, 81 (19), 7892–7899. 10.1021/ac901366n. [DOI] [PMC free article] [PubMed] [Google Scholar]
- Zhang H. M.; Bou-Assaf G. M.; Emmett M. R.; Marshall A. G. Fast Reversed-Phase Liquid Chromatography to Reduce Back Exchange and Increase Throughput in H/D Exchange Monitored by FT-ICR Mass Spectrometry. J. Am. Soc. Mass Spectrom. 2009, 20 (3), 520–524. 10.1016/j.jasms.2008.11.010. [DOI] [PMC free article] [PubMed] [Google Scholar]
- Zhang Z. Q.; Zhang A.; Xiao G. Improved Protein Hydrogen/Deuterium Exchange Mass Spectrometry Platform with Fully Automated Data Processing. Anal. Chem. 2012, 84 (11), 4942–4949. 10.1021/ac300535r. [DOI] [PubMed] [Google Scholar]
- Bobst C. E.; Kaltashov I. A. Enhancing the Quality of H/D Exchange Measurements with Mass Spectrometry Detection in Disulfide-Rich Proteins Using Electron Capture Dissociation. Anal. Chem. 2014, 86 (11), 5225–5231. 10.1021/ac500904p. [DOI] [PMC free article] [PubMed] [Google Scholar]
- Valeja S. G.; Emmett M. R.; Marshall A. G. Polar Aprotic Modifiers for Chromatographic Separation and Back-Exchange Reduction for Protein Hydrogen/Deuterium Exchange Monitored by Fourier Transform Ion Cyclotron Resonance Mass Spectrometry. J. Am. Soc. Mass Spectrom. 2012, 23 (4), 699–707. 10.1007/s13361-011-0329-z. [DOI] [PMC free article] [PubMed] [Google Scholar]
- Ahn J.; Jung M. C.; Wyndham K.; Yu Y. Q.; Engen J. R. Pepsin Immobilized on High-Strength Hybrid Particles for Continuous Flow Online Digestion at 10 000 psi. Anal. Chem. 2012, 84 (16), 7256–7262. 10.1021/ac301749h. [DOI] [PMC free article] [PubMed] [Google Scholar]
- Walters B. T.; Ricciuti A.; Mayne L.; Englander S. W. Minimizing Back Exchange in the Hydrogen Exchange-Mass Spectrometry Experiment. J. Am. Soc. Mass Spectrom. 2012, 23 (12), 2132–2139. 10.1007/s13361-012-0476-x. [DOI] [PMC free article] [PubMed] [Google Scholar]
- Nazari Z. E.; van de Weert M.; Bou-Assaf G.; Houde D.; Weiskopf A.; Rand K. D. Rapid Conformational Analysis of Protein Drugs in Formulation by Hydrogen/Deuterium Exchange Mass Spectrometry. J. Pharm. Sci. 2016, 105 (11), 3269–3277. 10.1016/j.xphs.2016.07.006. [DOI] [PubMed] [Google Scholar]
- Zhang Z.; Smith D. L. Determination of amide hydrogen exchange by mass spectrometry: A new tool for protein structure elucidation. Protein Sci. 1993, 2, 522–531. 10.1002/pro.5560020404. [DOI] [PMC free article] [PubMed] [Google Scholar]
- Mayne L. Hydrogen Exchange Mass Spectrometry. Methods Enzymol. 2016, 566, 335–356. 10.1016/bs.mie.2015.06.035. [DOI] [PMC free article] [PubMed] [Google Scholar]
- Kan Z. Y.; Mayne L.; Chetty P. S.; Englander S. W. ExMS: Data Analysis for HX-MS Experiments. J. Am. Soc. Mass Spectrom. 2011, 22 (11), 1906–1915. 10.1007/s13361-011-0236-3. [DOI] [PMC free article] [PubMed] [Google Scholar]
- Kan Z. Y.; Walters B. T.; Mayne L.; Englander S. W. Protein hydrogen exchange at residue resolution by proteolytic fragmentation mass spectrometry analysis. Proc. Natl. Acad. Sci. U. S. A. 2013, 110 (41), 16438–16443. 10.1073/pnas.1315532110. [DOI] [PMC free article] [PubMed] [Google Scholar]
- Gessner C.; Steinchen W.; Bédard S.; Skinner J. J.; Woods V. L.; Walsh T. J.; Bange G.; Pantazatos D. P. Computational method allowing Hydrogen-Deuterium Exchange Mass Spectrometry at single amide Resolution. Sci. Rep. 2017, 7, 3789. 10.1038/s41598-017-03922-3. [DOI] [PMC free article] [PubMed] [Google Scholar]
- Kan Z. Y.; Ye X.; Skinner J. J.; Mayne L.; Englander S. W. ExMS2: An Integrated Solution for Hydrogen-Deuterium Exchange Mass Spectrometry Data Analysis. Anal. Chem. 2019, 91 (11), 7474–7481. 10.1021/acs.analchem.9b01682. [DOI] [PubMed] [Google Scholar]
- Weis D. D. Recommendations for the Propagation of Uncertainty in Hydrogen Exchange-Mass Spectrometric Measurements. J. Am. Soc. Mass Spectrom. 2021, 32 (7), 1610–1617. 10.1021/jasms.0c00475. [DOI] [PubMed] [Google Scholar]
- Venable J. D.; Okach L.; Agarwalla S.; Brock A. Subzero Temperature Chromatography for Reduced Back-Exchange and Improved Dynamic Range in Amide Hydrogen/Deuterium Exchange Mass Spectrometry. Anal. Chem. 2012, 84 (21), 9601–9608. 10.1021/ac302488h. [DOI] [PMC free article] [PubMed] [Google Scholar]
- Wales T. E.; Fadgen K. E.; Eggertson M. J.; Engen J. R. Subzero Celsius separations in three-zone temperature controlled hydrogen deuterium exchange mass spectrometry. J. Chromatogr. A 2017, 1523, 275–282. 10.1016/j.chroma.2017.05.067. [DOI] [PMC free article] [PubMed] [Google Scholar]
- Zhang Q.; Yang J.; Bautista J.; Badithe A.; Olson W.; Liu Y. Epitope Mapping by HDX-MS Elucidates the Surface Coverage of Antigens Associated with High Blocking Efficiency of Antibodies to Birch Pollen Allergen. Anal. Chem. 2018, 90 (19), 11315–11323. 10.1021/acs.analchem.8b01864. [DOI] [PubMed] [Google Scholar]
- Fang M.; Wang Z.; Cupp-Sutton K. A.; Welborn T.; Smith K.; Wu S. High-throughput hydrogen deuterium exchange mass spectrometry (HDX-MS) coupled with subzero-temperature ultrahigh pressure liquid chromatography (UPLC) separation for complex sample analysis. Anal. Chim. Acta 2021, 1143, 65–72. 10.1016/j.aca.2020.11.022. [DOI] [PMC free article] [PubMed] [Google Scholar]
- Anderson K. W.; Hudgens J. W. Chromatography at – 30 °C for Reduced Back-Exchange, Reduced Carryover, and Improved Dynamic Range for Hydrogen–Deuterium Exchange Mass Spectrometry. J. Am. Soc. Mass Spectrom. 2022, 33, 1282–1292. 10.1021/jasms.2c00096. [DOI] [PMC free article] [PubMed] [Google Scholar]
- Hudgens J. W. Construction of a Dual Protease Column, Subzero (−30 °C) Chromatography System and Multi-channel Precision Temperature Controller for Hydrogen-Deuterium Exchange Mass Spectrometry. J. Res. Natl. Bur. Stand. (U. S.) 2020, 125, 125025. 10.6028/jres.125.025. [DOI] [PMC free article] [PubMed] [Google Scholar]
- Alpert A. J. Hydrophilic-interaction chromatography for the separation of peptides, nucleic acids and other polar compounds. J. Chromatogr. A 1990, 499, 177–196. 10.1016/S0021-9673(00)96972-3. [DOI] [PubMed] [Google Scholar]
- Zhu B. Y.; Mant C. T.; Hodges R. S. Hydrophilic-Interaction Chromatography of Peptides on Hydrophilic ond Strong Cation-Exchange Columns. J. Chromatogr. 1991, 548 (1–2), 13–24. 10.1016/S0021-9673(01)88590-3. [DOI] [PubMed] [Google Scholar]
- Yoshida T. Peptide separation by Hydrophilic-Interaction Chromatography: a review. Journal of Biochemical and Biophysical Methods 2004, 60 (3), 265–280. 10.1016/j.jbbm.2004.01.006. [DOI] [PubMed] [Google Scholar]
- Yang Y. Z.; Boysen R. I.; Hearn M. T. W. Hydrophilic interaction chromatography coupled to electrospray mass spectrometry for the separation of peptides and protein digests. J. Chromatogr. A 2009, 1216 (29), 5518–5524. 10.1016/j.chroma.2009.05.085. [DOI] [PubMed] [Google Scholar]
- Van Dorpe S.; Vergote V.; Pezeshki A.; Burvenich C.; Peremans K.; De Spiegeleer B. Hydrophilic interaction LC of peptides: Columns comparison and clustering. J. Sep. Sci. 2010, 33 (6–7), 728–739. 10.1002/jssc.200900476. [DOI] [PubMed] [Google Scholar]
- Gilar M.; Jaworski A. Retention behavior of peptides in hydrophilic-interaction chromatography. J. Chromatogr. A 2011, 1218 (49), 8890–8896. 10.1016/j.chroma.2011.04.005. [DOI] [PubMed] [Google Scholar]
- Simon R.; Enjalbert Q.; Biarc J.; Lemoine J.; Salvador A. Evaluation of hydrophilic interaction chromatography (HILIC) versus C-18 reversed-phase chromatography for targeted quantification of peptides by mass spectrometry. J. Chromatogr. A 2012, 1264, 31–39. 10.1016/j.chroma.2012.09.059. [DOI] [PubMed] [Google Scholar]
- Lobas A. A.; Levitsky L. I.; Fichtenbaum A.; Surin A. K.; Pridatchenko M. L.; Mitulovic G.; Gorshkov A. V.; Gorshkov M. V. Predictive Liquid Chromatography of Peptides Based on Hydrophilic Interactions for Mass Spectrometry-Based Proteomics. J. Anal. Chem. 2017, 72 (14), 1375–1382. 10.1134/S1061934817140076. [DOI] [Google Scholar]
- Louw S.; Pereira A. S.; Lynen F.; Hanna-Brown M.; Sandra P. Serial coupling of reversed-phase and hydrophilic interaction liquid chromatography to broaden the elution window for the analysis of pharmaceutical compounds. J. Chromatogr A 2008, 1208 (1–2), 90–94. 10.1016/j.chroma.2008.08.058. [DOI] [PubMed] [Google Scholar]
- Liu A.; Tweed J.; Wujcik C. E. Investigation of an on-line two-dimensional chromatographic approach for peptide analysis in plasma by LC–MS–MS. Journal of Chromatography B 2009, 877 (20), 1873–1881. 10.1016/j.jchromb.2009.05.012. [DOI] [PubMed] [Google Scholar]
- Lam M. P. Y.; Siu S. O.; Lau E.; Mao X. L.; Sun H. Z.; Chiu P. C. N.; Yeung W. S. B.; Cox D. M.; Chu I. K. Online coupling of reverse-phase and hydrophilic interaction liquid chromatography for protein and glycoprotein characterization. Anal. Bioanal. Chem. 2010, 398 (2), 791–804. 10.1007/s00216-010-3991-2. [DOI] [PMC free article] [PubMed] [Google Scholar]
- Wikberg E.; Sparrman T.; Viklund C.; Jonsson T.; Irgum K. A 2H nuclear magnetic resonance study of the state of water in neat silica and zwitterionic stationary phases and its influence on the chromatographic retention characteristics in hydrophilic interaction high-performance liquid chromatography. J. Chromatogr A 2011, 1218 (38), 6630–6638. 10.1016/j.chroma.2011.04.056. [DOI] [PubMed] [Google Scholar]
- Gu T.; Gu Y.; Zheng Y.; Wiehl P. E.; Kopchick J. J. Phase-Separation of Acetonitrile-Water Mixture in Protein-Purification. Sep. Technol. 1994, 4 (4), 258–260. 10.1016/0956-9618(94)80031-6. [DOI] [Google Scholar]
- Zhang L.; Shen D.; Zhang Z.; Wu X. Experimental Measurement and Modeling of Vapor–Liquid Equilibrium for the Ternary System Water + Acetonitrile + Ethylene Glycol. J. Chem. Eng. Data 2017, 62 (5), 1725–1731. 10.1021/acs.jced.7b00178. [DOI] [Google Scholar]
- D’Attoma A.; Heinisch S. On-line comprehensive two dimensional separations of charged compounds using reversed-phase high performance liquid chromatography and hydrophilic interaction chromatography. Part II: Application to the separation of peptides. J. Chromatogr. A 2013, 1306, 27–36. 10.1016/j.chroma.2013.07.048. [DOI] [PubMed] [Google Scholar]
- Fox N. M.; Kemperman A. R.; Lorenz S. M.; Snoble K. A. J.; Przybytek J. T. Stability of Formic Acid in Methanol Solutions and the Implications for Use in LC–MS Gradient Elution Analysis. LCGC N. Am. 2008, 29 (9), 946–950. [Google Scholar]
- Deleebeeck L.; Snedden A.; Nagy D.; Nagyné Z. S.; Roziková M.; Vicarová M.; Heering A.; Bastkowski F.; Leito I.; Quendera R.; Cabral V.; Stoica D. Unified pH Measurements of Ethanol, Methanol, and Acetonitrile, and Their Mixtures with Water. Sensors 2021, 21, 3935. 10.3390/s21113935. [DOI] [PMC free article] [PubMed] [Google Scholar]
- Burns K. M.; Rey M.; Baker C. A. H.; Schriemer D. C. Platform Dependencies in Bottom-up Hydrogen/Deuterium Exchange Mass Spectrometry. Mol. Cell. Biochem. 2013, 12 (2), 539–548. 10.1074/mcp.M112.023770. [DOI] [PMC free article] [PubMed] [Google Scholar]
- Pascal B. D.; Willis S.; Lauer J. L.; Landgraf R. R.; West G. M.; Marciano D.; Novick S.; Goswami D.; Chalmers M. J.; Griffin P. R. HDX Workbench: Software for the Analysis of H/D Exchange MS Data. J. Am. Soc. Mass Spectrom. 2012, 23 (9), 1512–1521. 10.1007/s13361-012-0419-6. [DOI] [PMC free article] [PubMed] [Google Scholar]
- Connelly G. P.; Bai Y.; Jeng M.-F.; Englander S. W. Isotope effects in peptide group hydrogen exchange.. Proteins: Struct., Funct., Bioinf. 1993, 17 (1), 87–92. 10.1002/prot.340170111. [DOI] [PubMed] [Google Scholar]
- Nguyen D.; Mayne L.; Phillips M. C.; Walter Englander S. Reference Parameters for Protein Hydrogen Exchange Rates. J. Am. Soc. Mass Spectrom. 2018, 29 (9), 1936–1939. 10.1007/s13361-018-2021-z. [DOI] [PMC free article] [PubMed] [Google Scholar]
Associated Data
This section collects any data citations, data availability statements, or supplementary materials included in this article.