Int J Oncol 53: 2397-2408, 2018; DOI: 10.3892/ijo.2018.4579
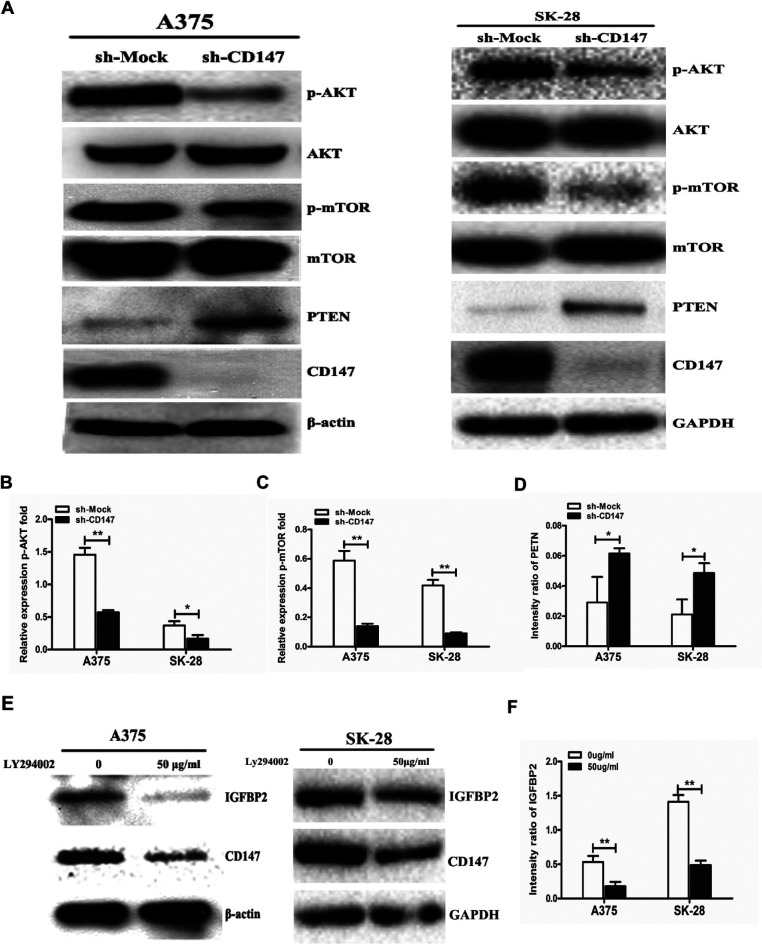
Subsequently to the publication of the above article, an interested reader drew to the authors' attention that the β-actin bands shown for the western blots portrayed in Fig. 4A and E on p. 2403 appeared to be strikingly similar, albeit that the bands were inverted with respect to their orientation and the dimensions of the bands differed slightly.
Figure 4.
CD147 regulates IGFBP2 expression via the PTEN/PI3K/AKT signaling pathway. (A) Cell lysates of sh-CD147 and sh-Mock A375 and SK-MEL-28 cells were subjected to western blotting to detect p-AKT, p-mTOR and PTEN expression. Quantitation of (B) p-AKT, (C) p-mTOR and (D) PTEN expression was performed using ImageJ software. (E) Sh-Mock A375 and SK-MEL-28 cells were cultured with 50 μg/ml LY294002, a PI3K signaling pathway inhibitor, for 24 h. IGFBP2 and CD147 expression was detected by western blotting and (F) quantitative analysis of IGFBP2 expression was performed using ImageJ software. n=3 for each experiment. *P<0.05, **P<0.01 vs. sh-Mock or 0 μg/ml LY294002. AKT, protein kinase B; CD147, cluster of differentiation 147; m-TOR; p, phosphorylated; PI3K, phosphoinositide 3-kinase; PTEN, phosphatase and tensin homolog; sh, short hairpin RNA.
After re-examining their original data, the authors have realized that these data in Fig. 4 had inadvertently been assembled incorrectly. The revised version of Fig. 4, showing the correct data for all the experiments in Fig. 4E, is shown on on the next page. The authors are grateful to the Editor of International Journal of Oncology for allowing them this opportunity to publish a Corrigendum, and all the authors agree to its publication. Furthermore, the authors apologize to the readership for any inconvenience caused.


