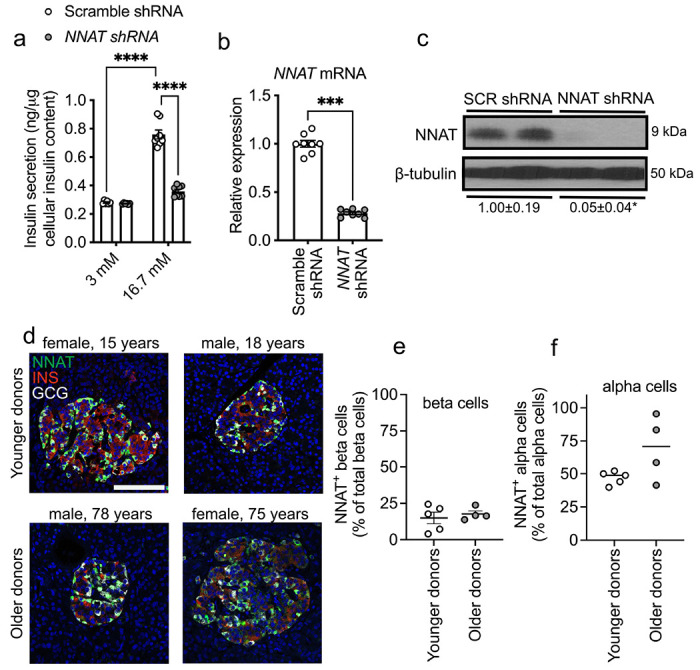
Fig. 4. NNAT is expressed in a subset of human beta cells and NNAT deficiency in human beta cells reduces insulin secretion.

(a) GSIS analysis at low (3 mM) and high (16.7 mM) glucose in human EndoC-βH1 beta cells following 72h lentiviral-mediated shRNA knockdown of neuronatin with data expressed as of insulin secreted into culture media as a percentage of total cellular insulin content (n = 8 independent cultures per group, two-way ANOVA with Sidak’s multiple corrections test). (b, c) RT-PCR (n = 8, unpaired Student’s t test) and Western blot (n = 4, Mann-Whitney U test) analysis of neuronatin expression in EndoC-βH1 beta cells after transient NNAT silencing as in a. Western blotting analysis of NNAT protein levels shown via a representative blot of two independent experiments. β-tubulin was used as a loading control. Mean values for band intensities in multiple experiments quantified by densitometry are shown below the panel, expressed relative to scramble (SCR) shRNA controls. (d) Representative confocal microscopy of human pancreatic cryosections from younger (15.6 ± 0.9 years, n = 5) and older (71.0 ± 3.9 years, n = 4) donors. Sections were immunostained with antibodies against endogenous neuronatin (NNAT, green), insulin (INS, red) and glucagon (GCG, grey). Donor sex and age are indicated in the text. Nuclei are visualised with DAPI. Scale bar = 100μm. (e, f) Quantification of NNAT beta (e) and alpha (f) cells from images shown in d, expressed as NNAT/INS or NNAT/GCG co-positive cells as a percentage of total INS-positive or GCG-positive cells. * P < 0.05, *** P < 0.001, **** P < 0.0001).
