
Fig. 4.
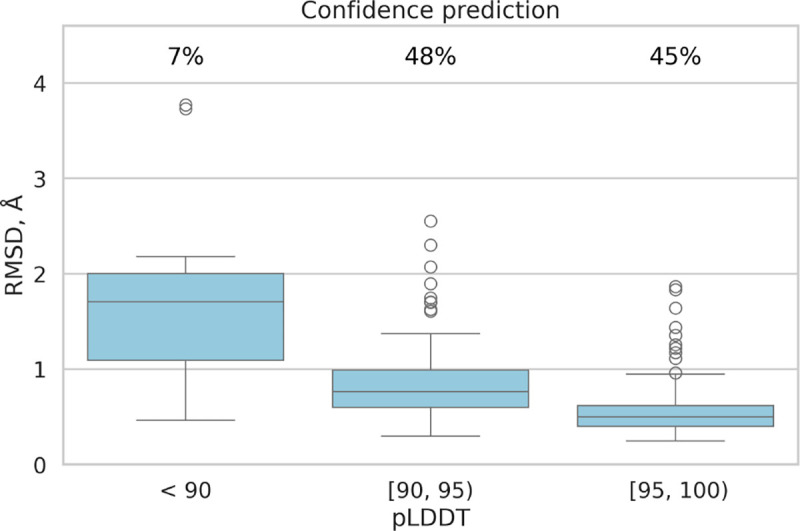
Confidence Prediction: All samples are grouped by their predicted Local Distance Difference Test (pLDDT) interval. The chart displays the percentage of samples falling within each specific pLDDT range.
Official websites use .gov
A
.gov website belongs to an official
government organization in the United States.
Secure .gov websites use HTTPS
A lock (
) or https:// means you've safely
connected to the .gov website. Share sensitive
information only on official, secure websites.
Confidence Prediction: All samples are grouped by their predicted Local Distance Difference Test (pLDDT) interval. The chart displays the percentage of samples falling within each specific pLDDT range.