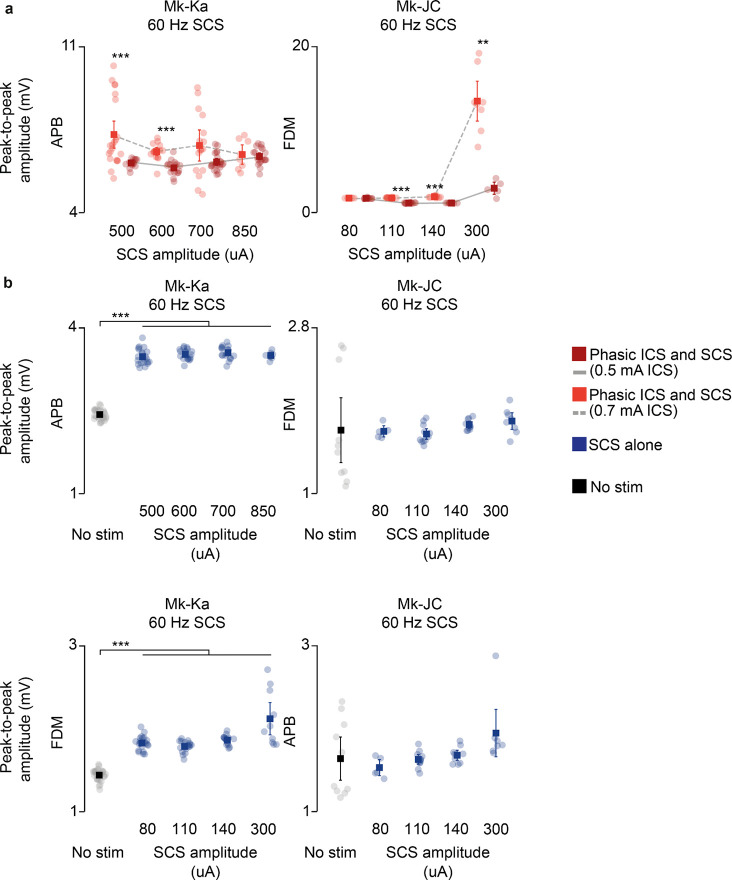
Extended Data Fig. 10 |. EMG responses during concurrent stimulation in monkeys.
a, Root-mean square (RMS) of the EMG responses during phasic ICS and continuous SCS at increasing SCS amplitudes in addition to Fig. 7e (APB in Mk-Ka, FDM in Mk-JC). Statistical quantification of the RMS EMG responses (***p<0.001; **p<0.01; *p<0.05; Kruskal-Wallis test with 21, 14 points for 500 uA SCS at 0.7 mA ICS and at 0.5 mA ICS, respectively, in APB in Mk-Ka; 15, 18 points for 600 uA in Mk-Ka; 16, 21 points for 700 uA in Mk-Ka; 8, 19 points for 850 uA in Mk-Ka; 4, 8 points for 80 uA, 60 Hz SCS in Mk-JC; 11, 11 points for 110 uA, 60 Hz SCS in Mk-JC; 9, 8 points for 140 uA, 60 Hz SCS in Mk-JC; 8, 5 points for 300 uA, 60 Hz SCS in Mk-JC; 9, 10, 10 points for 80 uA, 30 Hz SCS in APB in Mk-JC; 8, 10, 8 points for 80 uA, 30 Hz SCS in FDM Mk-JC). b, RMS of the EMG responses during continuous SCS alone at increasing SCS amplitudes of the muscles shown in a (above) and Fig. 7e (below). Statistical quantification of the RMS EMG responses (***p<0.001; **p<0.01; *p<0.05; Kruskal-Wallis test with 27, 21, 19, 17 and 9 points for no stim, 500, 600, 700, 850 uA SCS, respectively, in APB in Mk-Ka; 10, 5, 11, 9, 8 points in FDM in Mk-JC; 27, 21, 18, 15, 10 points in FDM in Mk-Ka; 10, 5, 11, 9, 7 points in APB in Mk-JC). RMS EMG responses appeared to be significant in Mk-Ka, however, these responses were still below the lowest RMS value measured during concurrent phasic ICS.

