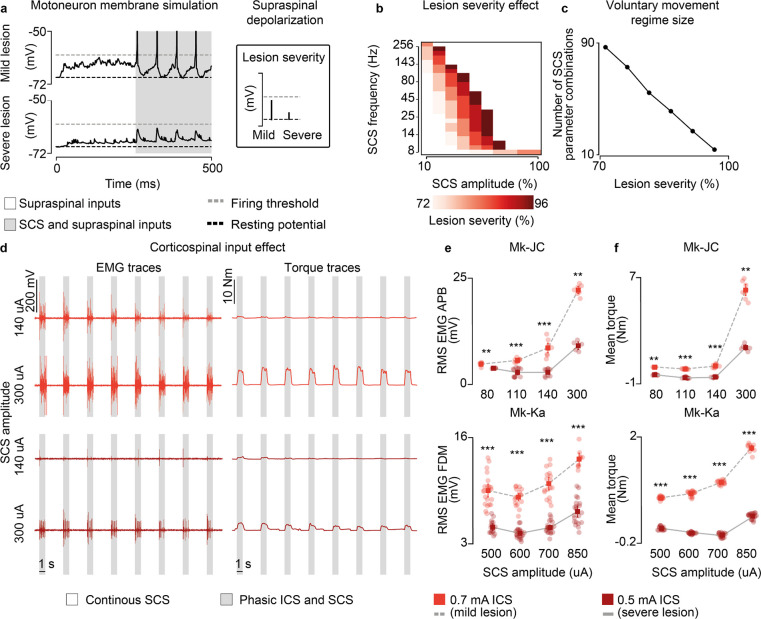
Fig. 7 |. Lesion severity reduces voluntary movement regime.
a, Simulation of the membrane potential of a single motoneuron driven by residual supraspinal fibers and SCS (16 Hz, 30%) in a mild (30 supraspinal fibers, top) and severe lesion (11 supraspinal fibers, bottom). b, Simulated heatmap indicating the combinations of SCS parameters within the voluntary movement regime for different degrees of lesion severity (mildest lesion in light red, the most severe lesion in dark red; 5 seconds simulation). c, Number of SCS parameter combinations within the voluntary movement regime for different degrees of lesion severity. d, Raw EMG and torque traces to illustrate the stimulation protocol employing phasic ICS (47 Hz) during continuous subthreshold SCS (60 Hz) at increasing SCS amplitudes (in Mk-JC, APB muscle). e, Root-mean square (RMS) of the EMG responses during phasic ICS and continuous SCS at increasing SCS amplitudes. Statistical quantification of the RMS EMG responses (***p<0.001; **p<0.01; Kruskal-Wallis test with 5, 5 points for 80 uA for 0.7 mA ICS and 0.5 mA ICS in Mk-JC; 10, 11 points for 110 uA; 9, 9 points for 140 uA; 7, 7 points for 300 uA; 21, 16 points for 500 uA for 0.7 mA ICS and 0.5 mA ICS in Mk-Ka; 18, 11 points for 600 uA; 17, 21 points for 700 uA; 9, 21 points for 850 uA). f, Mean torque during phasic ICS and continuous SCS at increasing SCS amplitudes. Statistical quantification of the mean torque (***p<0.001; **p<0.01; *p<0.05; Kruskal-Wallis test with 5, 9 points for 80 uA for 0.7 mA ICS and 0.5 mA ICS in Mk-JC; 10, 11 points for 110 uA; 9, 9 points for 140 uA; 8, 5 points for 300 uA; 18, 15 points for 500 uA for 0.7 mA ICS and 0.5 mA ICS in Mk-Ka; 18, 20 points for 600 uA; 16, 20 points for 700 uA; 9, 20 points for 850 uA). Square and error bars indicate the mean distribution of the data with 95% confidence interval.

