Abstract
The starvation-survival response of Staphylococcus aureus as a result of glucose, amino acid, phosphate, or multiple-nutrient limitation was investigated. Glucose and multiple-nutrient limitation resulted in the loss of viability of about 99 to 99.9% of the population within 2 days. The remaining surviving cells developed increased survival potential, remaining viable for months. Amino acid or phosphate limitation did not lead to the development of a stable starvation-survival state, and cells became nonculturable within 7 days. For multiple-nutrient limitation, the development of the starvation-survival state was cell density dependent. Starvation survival was associated with a decrease in cell size and increase in resistance to acid shock and oxidative stress. There was no evidence for the formation of a viable but nonculturable state during starvation as demonstrated by flow cytometry. Long-term survival of cells was dependent on cell wall and protein biosynthesis. Analysis of [35S]methionine incorporation and labelled proteins demonstrated that differential protein synthesis occurred deep into starvation.
Bacteria in the natural environment are often found under nutrient-limiting conditions. To survive prolonged periods of starvation, many bacteria have developed starvation-survival strategies enabling them to persist in the environment until conditions become favorable for growth. The starvation-survival response of non-spore-forming gram-negative bacteria such as Escherichia coli, Salmonella typhimurium, and Vibrio spp. has been well characterized (10, 19, 21), but the responses of non-spore-forming gram-positive bacteria are less well understood.
A number of gram-negative bacteria, including E. coli and Vibrio cholerae, have been proposed to enter a viable but nonculturable (VBNC) state upon starvation (48). The VBNC state has been defined as a cell which can be demonstrated to be metabolically active while being incapable of undergoing the sustained cellular division required to form a colony on a plate (34). The existence of the VBNC state is controversial, since the biochemical parameters which define a cell as viable or dead have not been universally agreed.
Micrococcus luteus is the only gram-positive bacterium for which the starvation survival response has been characterized. It was shown that upon prolonged starvation, M. luteus persists in a dormant state; cells in this state were unable to form colonies on agar plates (17). The recovery of dormant cells on agar plates was found to be increased 1,000 to 100,000-fold by incubation in spent growth medium from exponential-phase cells. This led to the proposal that a recovery pheromone was required to break dormancy and allow the growth and division of dormant cells (18). To date, this is the only non-spore-forming bacterium for which the formation of such a dormant state has been well demonstrated.
In the gram-negative bacteria so far studied, nutrient starvation results in reductive division, giving rise to cells with an altered morphology and an increased long-term survival potential (10, 19, 21). Cells in the starved state also develop generalized resistance to stresses over and above that of the adaptive response of growing cells. These stresses include oxidizing agents, heat, near-UV radiation, and acid (10, 19, 21).
Cryptic growth is thought to play an important role in starvation survival. This is defined as the recycling of nutrients derived from dead cells for the maintenance of a few surviving cells (38). There is also considerable evidence to suggest that starved cultures are not static populations. Culture dynamism is indicated from studies with E. coli, where long-term-starved cells have a competitive advantage in a mixed culture with newly starved cells (49).
The starvation survival of E. coli, Vibrio spp., and S. typhimurium is dependent on differential protein synthesis (25, 39, 44). Bulk protein synthesis is sharply reduced during starvation and is associated with the lower expression of proteins necessary for exponential growth (30, 39). During the early hours of starvation, novel proteins whose continued activity and production is required for long-term survival are synthesized (25, 39). There is also evidence that the degradation of existing proteins may be a major source of amino acids utilized for protein synthesis during starvation (40).
Staphylococcus aureus is an important, worldwide pathogen, particularly in nosocomial infections (20). Infection of patients in hospital wards occurs via a number of routes including direct contact (e.g., hand to wound), airborne carriage, and via surfaces such as indwelling devices (e.g., catheters). These environments are frequently nutrient limiting and stressful. Therefore, an understanding of the mechanisms of S. aureus starvation survival and stress resistance is of great interest and may lead to better clinical practices to prevent the transmission of S. aureus infection within hospitals. In this paper, we describe experiments which elucidate the conditions required for the formation of a stable starvation-survival state in S. aureus. The characterization of this state is described, and changes in cell morphology, physiological status, and stress resistance properties are assessed.
MATERIALS AND METHODS
Growth and starvation of bacterial cells.
S. aureus 8325-4 (29) was grown in a chemically defined medium (CDM) (13). The CDM preparation was amino acid limiting. Glucose- and phosphate-limiting CDM was prepared by lowering the glucose concentration from 1% (wt/vol) to 0.1% and the phosphate concentration from 0.18 M to 36 mM. Starvation cultures were prepared by the inoculation of CDM to an absorbance at 600 nm (A600) of 0.01; the medium was then incubated at 37°C with shaking (250 rpm). Stationary phase was reached after about 8 to 10 h of incubation. After 18 h of growth, the cultures were transferred to the long-term starvation temperature and incubated statically. Multiple-nutrient-limited cells were prepared by harvesting of CDM cultures, after 18 h of growth, by centrifugation (4,000 × g for 10 min at room temperature), and the cells washed twice with an equal volume of phosphate-buffered saline (PBS) by repeated centrifugation and resuspension. The cells were finally resuspended in water to the original culture volume. All the cultures reached an A600 between 3.0 and 5.0, corresponding to 1 × 10⁸ to 5 × 10⁸ CFU ml−1. Viable counts were determined by serial dilution of cultures in PBS, plating on CDM agar (1% [wt/vol] agar), and incubation overnight (37°C). The minimum detection level was 100 CFU ml−1. Results are representative of at least two independent cultures, which showed no more than 10-fold variability between equivalent time points.
Penicillin G inhibition.
Penicillin G was added to starved cultures at 1 μg ml−1 (20 times the MIC). The biological activity of penicillin G in CDM over a 15-day incubation at 37°C decreased only twofold and hence was still 10 times the MIC.
Electron microscopy.
Samples for examination were pelleted (10,000 × g for 5 min at 4°C), and the supernatant was removed. Standard fixing and staining techniques were used to prepare cell sections, which were examined with a Philips CM-10 electron microscope. Mean cell diameters were calculated from measurements of 50 cells.
Preparation of cells for flow cytometry.
The cells were enumerated by flow cytometry after being stained with fluorescein isothiocyanate (FITC)-conjugated human immunoglobulin G (IgG), which binds to surface-associated protein A (6). Samples (1 ml) were washed with PBS and resuspended in 1 ml of PBS containing 3% (wt/vol) bovine serum albumin and 15 μg of FITC-conjugated IgG ml−1. The cell suspension was incubated for 30 min at 37°C and washed three times in PBS before being subjected to analysis by flow cytometry.
Viable-cell numbers were measured by flow cytometry after staining with rhodamine 123 (Rh123) by a modification of the method of Diaper et al. (7). Rh123 is accumulated in an energy-dependent fashion, requiring active metabolism. Cell suspensions (1 ml) were washed with PBS and resuspended in 1 ml of PBS containing 15 μM Rh123. The suspension was incubated for 30 min at room temperature and washed three times in PBS. As a negative-staining control, S. aureus cells (1 ml) were incubated with 15 μM carbonyl cyanide m-chlorophenolhydrazone (CCCP) for 10 min and then stained with Rh123; 15 μM CCCP was included in all solutions.
Flow cytometry.
A Skatron instrument was used for flow cytometry. Sheaf fluid was prepared by filtering distilled water three times through a 0.22-μm-pore-size nitrocellulose membrane. The sheaf fluid pressure was set at 1 kPa cm−1, and the flow sample rate was set between 1 and 10 ml min−1. Changes in light-scattering properties of the cells were monitored with light at a wavelength of between 395 and 440 nm. Narrow-angle light scattering (NALS) used a gain of 32 and a photomultiplier tube setting of 640 V. FITC-conjugated IgG and Rh123 fluorescence was assessed with an excitation wavelength of 475 to 495 nm, a stopband of 510 nm, and an emission wavelength of 520 to 560 nm. A peak at zero fluorescence is due to background noise.
Resistance to stress conditions.
Cells during various phases of growth were harvested, washed in PBS, and resuspended at a cell density of about 5 × 10⁶ CFU ml−1. For oxidative stress challenge, 7.5 mM hydrogen peroxide was added and the cells were incubated at 37°C. Hydrogen peroxide challenge was also performed on cells resuspended in their culture supernatants to which 7.5 mM hydrogen peroxide had been added. For heat challenge, the cells were incubated at 55°C. Acid resistance was determined at 37°C by resuspension of the cells in CDM which had been acidified to pH 2 with HCl. In all cases, changes in cell viability were monitored for a 60-min period by serial dilution in PBS followed by plating onto CDM agar, except for hydrogen peroxide resistance, where the cells were diluted in PBS containing 10 mg of catalase ml−1 to inactivate the hydrogen peroxide before plating. UV resistance was measured by spreading 5 ml of cells on a 15-cm-diameter glass petri dish, which was then exposed to a Hanovia 30-W mercury lamp at a distance of 60 cm. The decrease in cell viability was measured for 1 min.
Methionine incorporation rate determination.
The cells were grown in glucose-limiting, methionine-free CDM. Samples (1 ml) were removed at various time points and pipetted into a microcentrifuge tube, which had been prewarmed to 37°C and which containing 20 μCi of [35S]methionine (SJ235 [Amersham]; 1,200 Ci mmol−1) in 40 μl. The pulse length was adjusted so that the total incorporation was roughly comparable in all samples. Unlabelled methionine (80 μl, 10 mg ml−1) was added to the samples, which were placed on ice. The cells were pelleted (10,000 × g at 4°C for 3 min), resuspended in 25 μl of lysis buffer (10 mM Tris HCl [pH 7.4], 10 mM EDTA, 0.5 mg of lysostaphin per ml, 1 mM phenylmethylsulfonyl fluoride), and repeatedly freeze-thawed (5 to 10 times) until lysis was visible. For determination of the level of incorporation, proteins were precipitated with 5% (wt/vol) trichloroacetic acid at 4°C for 15 min and the precipitates were recovered by filtration (Millipore; pore size, 0.45 μm). The filters were washed with 4 ml of 5% (wt/vol) trichloroacetic acid prior to scintillation counting (Beckman LS1801 scintillation counter).
For samples to be analyzed by sodium dodecyl sulfate-polyacrylamide gel electrophoresis (SDS-PAGE), the appropriate volume of lysate containing 5 × 10⁴ dpm was added to 6.25 μl of 5× SDS-PAGE loading buffer (10% [wt/vol] SDS, 25% [vol/vol] 2-mercaptoethanol, 50% [wt/vol] sucrose, 0.01% [wt/vol] bromophenol blue) and the volume was made up to 30 μl. These samples were boiled for 3 min and cooled before being subjected to centrifugation (14,000 × g for 5 min at room temperature) to remove insoluble material and SDS-PAGE (Mini Protean; Bio-Rad) with a 15% (wt/vol) polyacrylamide gel (22). After electrophoresis, the gel was fixed (35% [vol/vol] methanol, 10% [vol/vol] acetic acid) for 60 min. The gel was then incubated in Amplify (Amersham) for 30 min before being dried and visualized by fluorography at −70°C with Hyperfilm-MP (Amersham).
RESULTS
Effect of nutrient limitation on starvation survival.
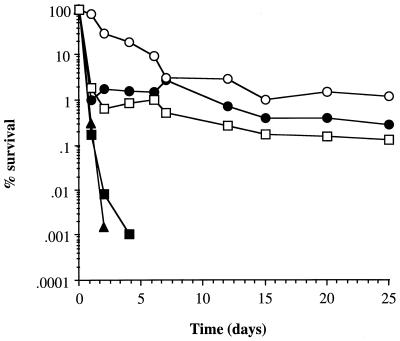
The kinetics of starvation survival in glucose-, phosphate-, or amino acid-limiting CDM and in water at 37°C were examined (Fig. 1). Cultures limited for glucose or multiple nutrients (water incubation) showed a very different response from those limited for amino acids or phosphate. Glucose- and multiple-nutrient-limited cultures demonstrated biphasic kinetics: within the first 2 days, about 99 to 99.9% of the cells lost viability; after 2 days, the surviving population remained relatively constant with only a slight decrease in viability after 25 days. Cultures limited for phosphate or amino acids demonstrated a rapid decrease in viability, becoming nonculturable after 4 and 7 days, respectively (>105-fold drop in viability). The accelerated loss of viability induced by amino acid and phosphate limitation may be due to the acidification of the culture supernatant upon starvation, since the pH of these cultures was found to decrease to 5.5 whereas glucose-limited cultures remained at pH 7. All cultures lost viability in a temperature-dependent manner, with higher temperatures resulting in a faster rate of death (Fig. 1 and data not shown). For glucose-limited cultures incubated at 25°C, a 99% drop in viability was observed after 7 days, at which point stable population numbers were realized. Cultures limited for multiple nutrients followed the same starvation kinetics as glucose-limited cultures, even if the initial growth was in phosphate- or amino acid-limiting CDM before the transfer to water. Hence, glucose limitation and multiple-nutrient limitation appear to be the most important stimuli involved in the long-term survival response of the cells to starvation.
FIG. 1.
Starvation-survival kinetics. Changes in viable counts of S. aureus 8325-4 grown in CDM limiting for glucose at 37°C (•), glucose at 25°C (○), phosphate at 37°C (▴), amino acids at 37°C (▪), and multiple nutrients by incubation in water at 37°C (□) are shown.
Role of cell density in starvation survival.
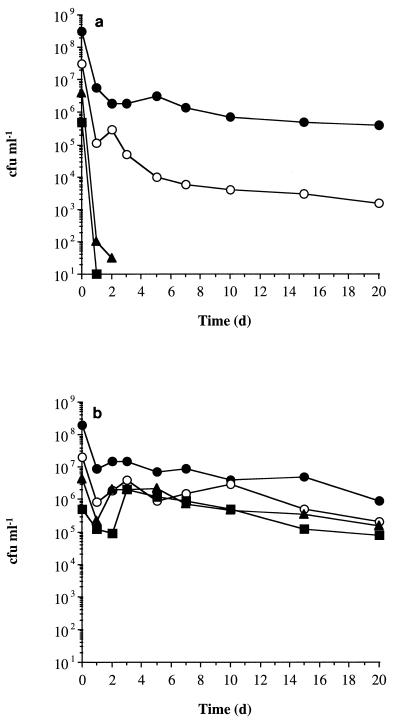
The effect of cell density on the survival of 6-h-post-exponential-phase cells resuspended in either water (Fig. 2a) or spent culture supernatant (Fig. 2b) was examined. Cells resuspended in water at densities of 5 × 10⁶ CFU ml−1 or below lost viability rapidly, becoming nonculturable after 2 days, whereas at higher cell densities, between 0.1 and 0.005% of cells survived prolonged incubation. When cells were resuspended in spent culture supernatant, they retained culturability over the 20-day period irrespective of the initial cell density. Stationary-phase culture supernatants therefore contain sufficient nutrients to maintain a population of about 106 CFU ml−1.
FIG. 2.
Effect of cell density on the survival of glucose-limited S. aureus cells. Glucose-limited cells (6 h post-exponential phase) were washed and resuspended in either distilled water (a) or filter-sterilized culture supernatant (b) at cell densities of about 5 × 10⁸ (•), 5 × 10⁷ (○), 5 × 10⁶ (▴), and 5 × 10⁵ (▪) CFU ml−1. Changes in cell viability were determined over a 20-day period.
Cells already subjected to long-term glucose starvation (7 days) also showed a density-dependent survival phenotype. When these cells were washed and resuspended in water at cell densities of >106 CFU ml−1, 99 to 99.9% of them died until stable numbers were reached after 3 days of incubation at 37°C (data not shown). At lower densities, the cells lost culturability with 2 days. When the cells were resuspended in long-term-glucose-limited culture supernatants, they survived at all cell densities (data not shown). It therefore appears that even though cells enter a starvation-survival state, their survival is still dependent on nutrients or factors present in their culture supernatants or associated with the dead cell debris.
Effect of penicillin G on starvation survival.
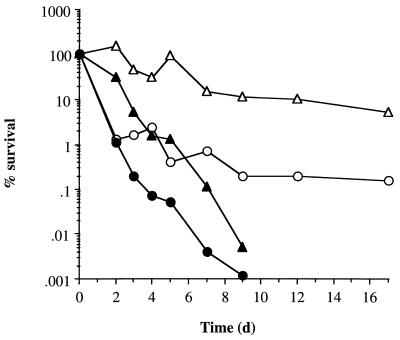
To elucidate if starved cells are growing and dividing during prolonged incubation, inhibitory concentrations of the cell wall biosynthesis inhibitor penicillin G were incubated with cells at various stages during starvation (Fig. 3). The addition of penicillin G to cultures 8 h after the exponential phase accelerated the loss of viability, with the cells becoming nonculturable after 11 days, while 0.1% of untreated cells were still viable. Similar results were observed for 7-day-glucose-limited cultures, where the addition of penicillin G resulted in the cells becoming nonculturable after 10 days, while 10% of cells were still viable in the cultures to which no penicillin had been added. Hence, the addition of penicillin G accelerated the rate of death of both postexponential and starved cells. This suggests that although population numbers are relatively stable, starved cells are still active, exhibiting wall growth and probably division, although at a much lower rate than exponential-phase cells, which lose viability within a few hours of penicillin G treatment (data not shown).
FIG. 3.
Effect of penicillin G on survival in glucose-limiting CDM. Penicillin G (1 μg ml−1) was added to cultures either 8 h post-exponential phase (•) or after 7 days of incubation (▴). Open symbols represent cultures to which no penicillin G was added (○, 8 h post-exponential; ▵, 7 days of incubation).
Starvation-survival-associated morphological changes.
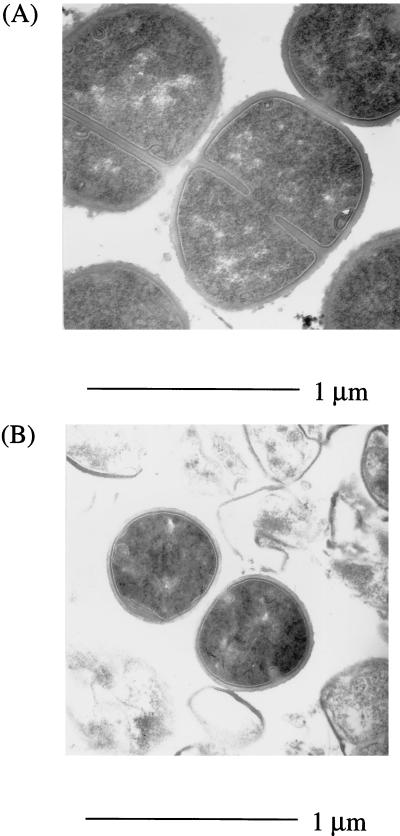
Electron microscopic examination of glucose-limited cells (incubated at 21°C for 25 days) revealed an altered cell morphology compared to exponential-phase cells (Fig. 4). At 25°C, long-term-glucose-limited cells were quite heterogeneous, with a wide variation in cell size, but they had a reduced average diameter of 0.41 ± 0.08 μm compared to exponential-phase cells, which had an average cell diameter of 0.69 ± 0.08 μm. Fewer division septa were observed, with only 20% of glucose-starved cells showing division septa compared with 66% of exponential-phase cells. At 25°C, glucose-limited cultures contained a large proportion of “ghost” cells, indicating cell lysis; these can be seen as debris surrounding the intact cells in Fig. 4B. Interestingly, cultures incubated at 37°C had no ghost cells (data not shown), but the cytoplasm of most cells was patchy, possibly indicating cell death. The cell lysis observed at 25°C could be due to the induction of an autolysin which is repressed when the cells are incubated at 37°C.
FIG. 4.
Electron micrographs of exponential-phase S. aureus cells grown in CDM at 37°C (a), and 25-day-glucose-limited cells incubated at 25°C (b). The cells were stained with uranyl acetate and Reynolds lead citrate before being subjected to microscopy.
Rapid assessment of viable, VBNC, and total cell numbers by flow cytometry.
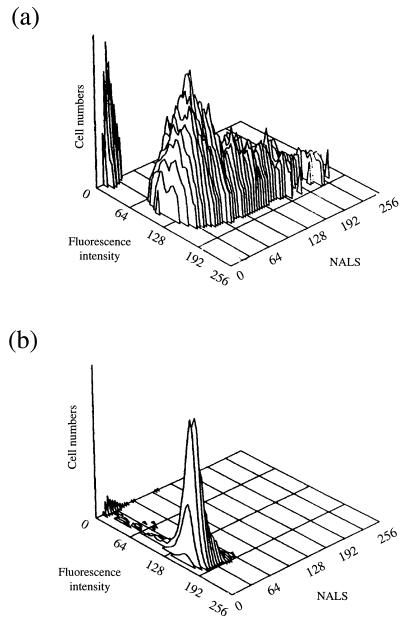
Flow cytometry allows the analysis of single cells within a population and hence can measure the heterogeneity of a population with respect to a number of parameters. Staining of cells with FITC-conjugated IgG is an accurate method of directly enumerating the total number of intact cells of S. aureus in a culture (6). FITC-conjugated IgG binds to protein A of S. aureus, with intact cells fluorescing more strongly than lysed cells. When exponential-phase S. aureus cells were stained with FITC-conjugated IgG and the fluorescence distribution was determined by flow cytometry, 94% of the particles detected had a fluorescence peak channel number greater than 50 (Fig. 5a). As a negative control, E. coli, which does not bind FITC-conjugated IgG, was shown to have a fluorescence distribution below channel 50 (data not shown). Channel 50 therefore defined the threshold level to distinguish between stained and non stained cells. The extent of NALS can be used to indicate the distribution of cell sizes within a population since it is dependent on the mass or volume of the cell, although this relationship is not always linear (5).
FIG. 5.
Flow cytometric examination of S. aureus. (a) FITC-conjugated IgG-stained exponential-phase S. aureus cell grown at 37°C; (b) FITC-conjugated IgG-stained 3-week-glucose-limited cells incubated at 25°C.
The FITC-IgG staining and NALS distribution for exponential-phase cells (Fig. 5a) and glucose-limited cells incubated for 3 weeks at 25°C (Fig. 5b) were compared. Glucose-limited cells gave slightly higher fluorescence when stained with FITC-IgG (peak channel fluorescence of 162, with 93% of the detected particles above channel 50) than did exponential-phase cells (peak channel fluorescence of 137, with 94% of the detected particles above channel 50). The most dramatic difference was observed with the distribution of NALS. Exponential-phase cells gave a broad distribution of NALS (peak channel 65), indicating a large variation in cell size, whereas the glucose-limited cells had a narrow defined distribution with a lower peak channel number (peak channel 30), supporting the electron microscopic conclusion that starved cells become smaller. The broad cell size distribution of exponential-phase cells was presumably due to the presence of large cells in the process of dividing and also of cells which had divided but not separated. Clumping was minimized by treatment in a sonic bath (Kerry Ultrasonics), which breaks up aggregates but does not kill cells.
The lipophilic dye Rh123 was used to enumerate viable cells, since it accumulates within bacterial cells in an energy-dependent fashion, with this accumulation being reversible by treatment of cells with compounds which uncouple the membrane potential (16). Diaper and Edwards (6) demonstrated that Rh123 is a useful indicator of cell viability for S. aureus, since cell counts of CFU on nutrient agar were not significantly different from those obtained by flow cytometry counting Rh123-stained cells.
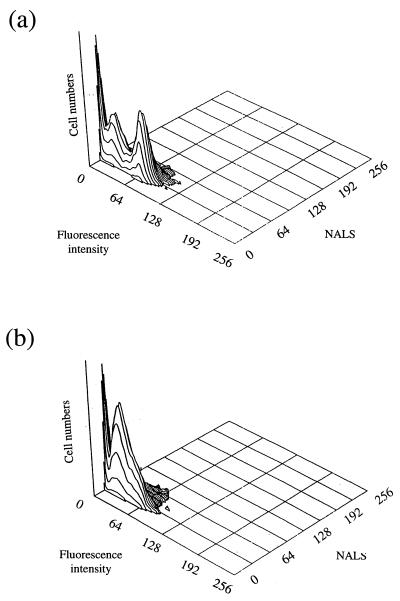
Rh123 staining was used to discriminate between viable and dead cells in glucose-limited cultures incubated at 25°C for 3 weeks (Fig. 6a). The flow cytometric analysis revealed a heterogeneous population, with a subpopulation of cells with low fluorescence (below channel 30) and another with higher fluorescence (above channel 55). When the same cells were treated with the membrane uncoupler CCCP (Fig. 6b), the population of cells with fluorescence greater than channel 55 disappeared while the population with fluorescence below channel 30 increased. This confirmed that the accumulation of Rh123 was energy dependent and enabled the identification of cells with an active membrane potential. By fluorescence-activated cell sorting, the population of cells with fluorescence greater than channel 50 was separated from the rest of the sample and the fraction was plated onto CDM agar. The number of cells capable of forming colonies on agar was comparable to the number of fluorescent particles separated by fluorescence-activated cell sorting (1.3 × 10⁶ and 1.9 × 10⁶ ml−1, respectively). This is in agreement with the observation that Rh123 is an accurate indicator of cell viability (6). It also indicates that all “viable” starved cells are capable of recovery on CDM plates.
FIG. 6.
Flow cytometric examination of S. aureus following Rh123 staining. (a) 3-week-glucose-limited cells incubated at 25°C; (b) 3-week-glucose-limited cells incubated at 25°C and treated with CCCP before Rh123 staining.
Viable-cell numbers enumerated by Rh123 staining were compared with those determined by measurement of CFU on CDM agar at various periods during starvation for cultures incubated at either 25 and 37°C. There was no significant difference between viable-cell numbers enumerated by either method, proving that there is no viable but nonculturable state during the starvation of S. aureus (data not shown).
Changes in resistance properties upon entry into starvation.
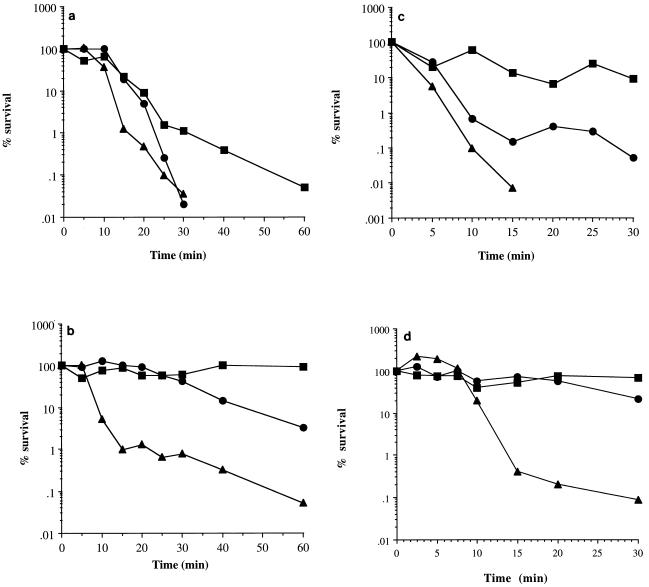
Exponentially growing, 6-h-post-exponential-phase and 7-day-glucose-limited cells (incubated at 37°C) were exposed to oxidative stress, high temperature, UV light, and acidic conditions to determine changes in the resistance levels of cells as they entered starvation. Under all stress conditions, 6-h-post-exponential-phase cells were less resistant than exponential-phase or 7-day-glucose-starved cells (Fig. 7 and results not shown). Compared to exponential-phase cells, 7-day-glucose-limited cells exhibited approximately a 100-fold increase in resistance to both oxidative stress (Fig. 7a) and acid stress (Fig. 7c) after a 30-min treatment. However, there was no increased resistance to heat (Fig. 7d) or to UV exposure (data not shown). Interestingly, resistance to oxidative stress could be increased if the cells were left in their culture supernatant when exposed to hydrogen peroxide (Fig. 7b). Under these conditions, starved cells were almost completely resistant to 7.5 mM hydrogen peroxide whereas exponential-phase cells exhibited only a 1-log-unit decrease in viability after 1 h. This increased resistance is probably due to a catalase/peroxidase secreted into the supernatant, breaking down hydrogen peroxide before it can enter and damage the cell.
FIG. 7.
Changes in the stress resistance of cells at different growth phases. Cells were harvested from glucose-limiting cultures during the exponential phase (A600 = 0.6) (•), at 6 h-post-exponential phase (▴), and after 7 days of incubation at 37°C (▪). The cells were washed in PBS and then resuspended in either PBS containing 7.5 mM H2O2 (a), their own supernatant containing H2O2 (7.5 mM) (b), CDM acidified to pH 2 with HCl (c), or PBS preheated to 55°C (d). Viability was measured at various times by performing appropriate dilutions onto CDM agar.
Intriguingly, 6-h-post-exponential-phase cells exhibited biphasic death kinetics under oxidative stress conditions (Fig. 7b) and when heat treated (Fig. 7d). Within the first 15 min, about 99% of cells die, and then the rate of death decreased to become comparable to that of exponential-phase cells. This biphasic death profile is similar to that observed during glucose limitation, where about 99% of cells die and 1% survive prolonged starvation.
Role of protein synthesis during starvation survival.
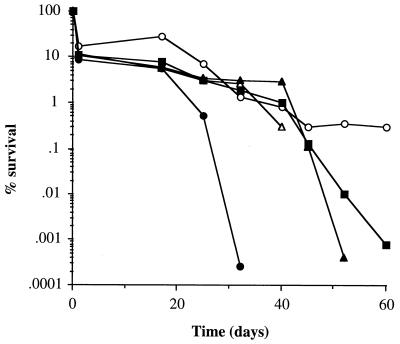
To determine whether continued protein synthesis is required for starvation survival, cells were treated with the protein synthesis inhibitor chloramphenicol during starvation (Fig. 8). Starvation was induced synchronously by transferring the cells to glucose-free CDM. When chloramphenicol was added immediately upon transfer to starvation conditions, all the cells lost viability within 30 days, whereas the untreated culture retained 0.4% viability after 60 days under these conditions. The chloramphenicol-induced accelerated loss of viability was greatest when chloramphenicol was added within the first hour of starvation and decreased when the chloramphenicol was added later in starvation. However, it is interesting that even when chloramphenicol was added 24 h after the induction of starvation, the culture exhibited an approximately 300-fold-greater drop in viability than did the control after 55 days. These results show that proteins synthesized within the first hour are crucial to survival whereas continued protein synthesis is required for the long-term survival of cells.
FIG. 8.
Effect of chloramphenicol on the survival of glucose limited cells. Exponential-phase cells (A600 = 1.0) were transferred to glucose-free CDM to induce synchronous starvation (0 h). Chloramphenicol (100 μg ml−1) was added after 0 h (•), 1 h (▵), 2 h (▴), and 24 h (▪) of incubation at 37°C. A control culture with no chloramphenicol added (○) was also monitored. Changes in viability were determined at various times by measuring colony formation on CDM agar.
Analysis of protein synthesis during glucose starvation.
Changes in the rate of protein synthesis during starvation induced by glucose limitation in methionine-free CDM were examined by pulse-labelling the cells with [35S]methionine. When the [35S]methionine incorporation rate was calculated per cell, long-term-starved cells (5 days at 37°C) showed comparable incorporation rates to exponentially grown cells (1 to 4 dpm min−1 CFU−1), although incorporation by the nonviable cells cannot be ruled out.
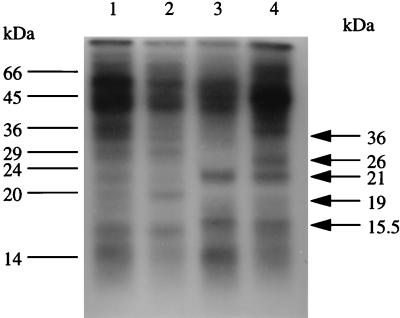
Proteins synthesized during starvation were examined by [35S]methionine pulse-labelling of cells grown in methionine-free glucose-limiting CDM, SDS-PAGE, and fluorography (Fig. 9). For the post-exponential-phase culture (Fig. 9, lane 1), the cells were pulse-labelled for 5 min, whereas long-term-starved cells were labelled for 1 h, due to the lower methionine incorporation rates (lanes 2 to 4). Even after 5 days of starvation, a large number of proteins were still being synthesized and the pattern was changing. Between 8 h and 3 days of starvation, a 19-kDa protein was transiently expressed (lane 2). Two new proteins (21 and 15.5 kDa) appeared by 3 days into starvation and were still abundant after 5 days (lanes 3 and 4). Even after 5 days of starvation, two new proteins increased in intensity (26 and 36 kDa [lane 4]). Changes in protein expression demonstrate that specific proteins are produced during development of the starvation survival state, and there is also a temporal order in the expression of these proteins. Since many proteins are still synthesized 5 days into starvation, it confirms our previous observations that starved cells are not metabolically dormant. Due to the extensive labelling times required to obtain enough material for analysis and the presence of large amounts of unlabelled material, two-dimensional gels of proteins synthesized by long-term-starved cells were impractical.
FIG. 9.
SDS-PAGE analysis of proteins synthesized during glucose limitation. The cells were pulse-labelled with [35S]methionine, and 2 × 10⁴ dpm of the cell lysate was loaded into each lane. Lanes: 1, 8-h culture; 2, 1 day after onset of the stationary phase; 3, 3 days after onset; 4, 5 days after onset.
DISCUSSION
S. aureus is an important pathogen, and starvation associated-processes may well be important not only outside the host but also as part of its pathogenicity. Elucidation of the survival mechanism is also of intrinsic interest, since it is an important part of bacterial ecology. Given the medical importance of S. aureus and its obvious long-term survival potential, such knowledge may lead to new procedures for the eradication of surviving cells in the clinical environment.
The development of a long-term starvation-survival state of S. aureus was shown to be induced under glucose- or multiple-nutrient-limiting conditions, whereas phosphate- or amino acid limitation led to a rapid loss of cell viability. This parallels the situation with Vibrio spp., where carbon starvation and multiple-nutrient starvation were the only limiting conditions that resulted in cells with increased survival potential (31). In contrast, S. typhimurium and E. coli develop long-term survival potential irrespective of the limiting nutrient (24, 37).
Upon entry into the long-term starvation-survival state, 99 to 99.9% of S. aureus cells lost viability within the first 2 days at 37°C. The viability of the culture then remained relatively constant for a period of months. This is similar to the survival profile of S. typhimurium (44) and of E. coli grown under certain limiting conditions (41), where 90% of cells in the culture lose viability in the first few days. Why such a large proportion of cells die while a small number of cells survive is unclear. It is possible that this phenomenon is due to cryptic growth, where most of the cells die, providing nutrients for the maintenance of the remaining surviving cells. The fact that the survival of cells resuspended in water was observed only at high cell densities supports this theory. At low cell densities, the entire population lost viability, presumably because the dying cells did not provide enough nutrients for the survival of a small subpopulation. This supports the observations of Diaper and Edwards (6) that S. aureus was able to survive prolonged starvation only at high cell densities in a lake water microcosm. In contrast, Vibrio spp. (31) and E. coli under certain defined conditions (41) can survive starvation without any loss of viability. The stationary-phase medium of these cultures must therefore retain sufficient nutrients for the long-term survival of the total population without requiring the sacrifice of cells to supply additional nutrients.
There is considerable evidence that starved cultures are not a static population of cells. Addition of penicillin G to starved cultures resulted in an accelerated loss of cell viability, suggesting that peptidoglycan synthesis is occurring, although very slowly. A similar effect has been observed in V. vulnificus, where the addition of ampicillin to starved cells resulted in a slow loss of viability (36). Electron microscopy of S. aureus cells also revealed that starved cells were capable of cell division, since a small proportion of cells had evidence of division septum formation. Culture dynamism has also been shown in E. coli, where long-term-starved cells have a competitive advantage in a mixed culture with newly starved cells (49). These changes take place due to the presence of mutants with a growth advantage over the rest of the population.
It has been demonstrated that some bacteria may enter a VBNC state upon starvation (48). The existence of pathogenic bacteria in a VBNC state has wide implications for sterility testing, which still relies on the ability to form colonies in order to detect the presence of bacteria. If VBNC cells can persist and regain growth capacity and pathogenicity once inside the host, conventional sterility testing will fail to protect against infections. It has been reported that some VBNC cells can be resuscitated, including a fraction of VBNC cells in membrane chambers in situ in the environment (36) and in vivo in mice (35).
We have found no evidence of the formation of a VBNC state in S. aureus upon starvation under defined conditions. The number of cells determined by measurement of CFU on CDM agar was not significantly different from viable-cell counts determined by Rh123 labelling and flow cytometry during starvation. Fluorescence-activated cell sorting also demonstrated that Rh123-labelled particles were due to living cells with colony-forming ability.
The acquisition of heightened resistance to environmental stresses is characteristic of the starvation-survival response of many gram-negative bacteria. For E. coli (15) and Vibrio spp. (31), starvation induces cross-resistance to heat, hydrogen peroxide, and UV irradiation, whereas S. typhimurium develops increased acid, UV, and hydrogen peroxide resistance (42). Surprisingly, starvation of S. aureus did not confer a broad range of cross-resistance properties upon the cell. Resistance to acidic conditions and to oxidative stress increased, but no significant change in UV and heat resistance was observed. Interestingly, the increased protection against hydrogen peroxide was conferred by culture supernatants and an increase in individual cellular resistance. Presumably, cells can synthesize an extracellular catalase that accumulates in the external milieu, protecting the cells from the damaging effects of external hydrogen peroxide. This catalase appears to be synthesized throughout growth, since both exponential-phase and long-term-starved culture supernatants conferred resistance to hydrogen peroxide. Such an extracellular catalase has been identified in Bacillus subtilis and was found to protect cells from a hydrogen peroxide challenge (28).
E. coli has two catalases, one of which is synthesized only upon entry to stationary phase under the control of ςS (27), demonstrating the importance of oxidative stress resistance in starvation survival. Oxidative stress resistance is also important in pathogenesis, since superoxide plays a significant role in the killing process of S. aureus by neutrophils (12). Recently, it has also been shown that a periplasmic superoxide dismutase in S. typhimurium contributes to the pathogenesis of salmonellosis by protecting the cells from oxygen radical-mediated host defenses (9). Superoxide free radicals are neutralized by the action of superoxide dismutase, generating hydrogen peroxide, which in turn is broken down by catalase.
Surprisingly, post-exponential-phase S. aureus cells had an increased sensitivity to hydrogen peroxide and heat stresses compared to that of exponential-phase cells. The death kinetics were biphasic, with about 99% of cells appearing to be more sensitive to these stresses than the remainder of the population. It may be that the cells which show reduced resistance properties are the same cells which will die upon long-term starvation. This suggests the possibility that the cells become committed to survival or death early after entry into the stationary phase unless they are rescued by the provision of nutrients.
During long-term starvation, the cells undergo morphological changes. Glucose-starved S. aureus cells exhibited a reduced diameter, a reduced number of division septa, and a more electron-dense appearance. The reduction in cell size upon starvation has been observed in a number of bacteria, including E. coli, Vibrio spp., and M. luteus (19, 23, 26) and is thought to be the result of reductive division upon entry into stationary phase. For E. coli, changes in cell morphology upon entry to stationary phase are regulated by BolA (1). The bolA gene is induced during entry to stationary phase under the control of stationary-phase sigma factor, ςS (23) and results in the increased expression of penicillin-binding protein PBP6, which is involved in septum formation.
We have shown that protein synthesis is necessary for starvation survival in S. aureus and that even long-term-starved cells are actively synthesizing proteins. Protein synthesis was also demonstrated to be necessary for starvation survival in E. coli, Vibrio spp., and S. typhimurium (25, 39, 45). In S. aureus, the acceleration of loss of viability was greater the earlier chloramphenicol was added to glucose-starved cells. The proteins synthesized during the first few hours of glucose starvation are therefore probably critical for the survival of starvation. However, even though the majority of proteins required for starvation survival are synthesized early, continued protein synthesis is still required. The requirement for continued protein synthesis during starvation would not contradict a cryptic growth hypothesis. In E. coli and Vibrio spp., most of the survival related proteins are similarly synthesized during the early hours of starvation and continued protein synthesis is still essential (25, 39). We found that for S. aureus new proteins were being synthesized even 5 days into glucose starvation, which suggests the dynamic nature of the population. A similar analysis of protein synthesis by glucose-starved E. coli cells also revealed marked changes in the identities of proteins synthesized up to 5 days into starvation (2).
Similar changes have been observed, and well characterized by one- and two-dimensional gel electrophoresis, in E. coli, S. typhimurium, and Vibrio spp. (11, 31, 45). Many proteins involved in starvation have been identified. It has been shown that a characteristic set of 40 to 80 proteins are induced specifically in response to starvation. In E. coli, the synthesis of starvation proteins involves the expression of several temporal classes of starvation genes, which are coordinately expressed under the control of three alternative sigma factors (23, 32, 43). Some of the proteins synthesized in response to starvation have been identified and shown to play diverse roles, including nutrient scavenging (46), heat shock response (14), and recovery from starvation (33). One-dimensional gel analysis of proteins synthesized by 5-day-starved E. coli cells led to the identification of several prominently labelled proteins, one of which was designated DPS (for DNA binding protein from starved cells; 2). This protein is abundant in 3-day-starved cells and was shown to form extremely stable complexes with DNA, leading to dramatic changes in protein expression, while also playing a role in protecting the DNA from oxidative damage. It is interesting to speculate that the proteins identified during long-term starvation in S. aureus may play similar roles.
In this study, we have characterized the starvation-survival response of S. aureus. We are currently using transposon mutagenesis to identify mutants defective in starvation survival. This will enable the identification of specific components involved in the response and also of the global regulators of starvation-survival gene expression. Recently, a homolog of B. subtilis ςB has been identified in S. aureus (47). ςB is involved in the regulation of stationary-phase and stress resistance genes in B. subtilis (3, 4, 8). S. aureus ςB is therefore a good candidate for a starvation-survival gene regulator. We are currently analyzing the role of sigB in starvation survival and stress resistance in S. aureus.
ACKNOWLEDGMENTS
This work was supported by the Royal Society (S.J.F.), BBSRC (S.P.W.), and the BBSRC/Celsis Connect (M.O.C.).
We thank Ian Morton for his assistance with the flow cytometry.
REFERENCES
- 1.Aldea M, Hernandezchico C, Delacampa A G, Kushner S R, Vicente M. Identification, cloning, and expression of bolA, an ftsZ-dependent morphogene of Escherichia coli. J Bacteriol. 1988;170:5169–5176. doi: 10.1128/jb.170.11.5169-5176.1988. [DOI] [PMC free article] [PubMed] [Google Scholar]
- 2.Almiron M, Link A J, Furlong D, Kolter R. A novel DNA-binding protein with regulatory and protective roles in starved Escherichia coli. Genes Dev. 1992;12B:2646–2654. doi: 10.1101/gad.6.12b.2646. [DOI] [PubMed] [Google Scholar]
- 3.Binnie C, Lampe M, Losick R. Gene encoding the sigma-37 species of RNA polymerase sigma factor from Bacillus subtilis. Proc Natl Acad Sci USA. 1986;83:5943–5947. doi: 10.1073/pnas.83.16.5943. [DOI] [PMC free article] [PubMed] [Google Scholar]
- 4.Boylan S A, Rutherford A, Thomas S M, Price C W. Activation of Bacillus subtilis transcription factor ςB by a regulatory pathway responsive to stationary-phase signals. J Bacteriol. 1992;174:3695–3706. doi: 10.1128/jb.174.11.3695-3706.1992. [DOI] [PMC free article] [PubMed] [Google Scholar]
- 5.Burkill P H. Analytical flow cytometry and its application to marine microbial ecology. In: Sleigh M A, editor. Microbes in the sea. Chichester, United Kingdom: Ellis Horwood; 1987. pp. 139–166. [Google Scholar]
- 6.Diaper J P, Edwards C. Survival of Staphylococcus aureus in lakewater monitored by flow-cytometry. Microbiology. 1994;140:35–42. doi: 10.1099/13500872-140-1-35. [DOI] [PubMed] [Google Scholar]
- 7.Diaper J P, Tither K, Edwards C. Rapid assessment of bacterial viability by flow cytometry. Appl Microbiol Biotechnol. 1992;38:268–272. doi: 10.1007/BF00174481. [DOI] [PubMed] [Google Scholar]
- 8.Duncan M L, Kalman S S, Thomas S M, Price C W. Gene encoding the 37,000-dalton minor sigma factor of Bacillus subtilis RNA polymerase: isolation, nucleotide sequence, chromosomal locus, and cryptic function. J Bacteriol. 1987;169:771–778. doi: 10.1128/jb.169.2.771-778.1987. [DOI] [PMC free article] [PubMed] [Google Scholar]
- 9.Farrant J L, Sansone A, Canvin J R, Pallen M J, Langford P R, Wallis T S, Dougan G, Kroll J S. Bacterial copper- and zinc-cofactored superoxide dismutase contributes to the pathogenicity of systemic salmonellosis. Mol Microbiol. 1997;25:785–796. doi: 10.1046/j.1365-2958.1997.5151877.x. [DOI] [PubMed] [Google Scholar]
- 10.Foster J W, Spector M P. How Salmonella survive against the odds. Annu Rev Microbiol. 1995;49:145–174. doi: 10.1146/annurev.mi.49.100195.001045. [DOI] [PubMed] [Google Scholar]
- 11.Groat R G, Schultz J E, Zychlinsky E, Bockman A, Matin A. Starvation proteins in Escherichia coli—kinetics of synthesis and role in starvation-survival. J Bacteriol. 1986;168:486–493. doi: 10.1128/jb.168.2.486-493.1986. [DOI] [PMC free article] [PubMed] [Google Scholar]
- 12.Hampton M B, Kettle A J, Winterbourn C C. Involvement of superoxide and myeloperoxidase in oxygen-dependent killing of Staphylococcus aureus by neutrophils. Infect Immun. 1996;64:3512–3517. doi: 10.1128/iai.64.9.3512-3517.1996. [DOI] [PMC free article] [PubMed] [Google Scholar]
- 13.Hussain M, Hastings J G M, White P J. A chemically defined medium for slime production by coagulase-negative staphylococci. J Med Microbiol. 1991;34:143–147. doi: 10.1099/00222615-34-3-143. [DOI] [PubMed] [Google Scholar]
- 14.Jenkins D E, Auger E A, Matin A. Role of rpoH, a heat-shock regulator protein, in Escherichia coli carbon starvation protein synthesis and survival. J Bacteriol. 1991;173:1992–1996. doi: 10.1128/jb.173.6.1992-1996.1991. [DOI] [PMC free article] [PubMed] [Google Scholar]
- 15.Jenkins D E, Schultz J E, Matin A. Starvation-induced cross protection against heat or H2O2 challenge in Escherichia coli. J Bacteriol. 1988;170:3910–3914. doi: 10.1128/jb.170.9.3910-3914.1988. [DOI] [PMC free article] [PubMed] [Google Scholar]
- 16.Kaprelyants A S, Kell D B. Rapid assessment of bacterial viability and vitality by rhodamine 123. J Appl Bacteriol. 1992;72:410–422. [Google Scholar]
- 17.Kaprelyants A S, Kell D B. Dormancy in stationary-phase cultures of Micrococcus luteus: flow cytometric analysis of starvation and resuscitation. Appl Environ Microbiology. 1993;59:3187–3196. doi: 10.1128/aem.59.10.3187-3196.1993. [DOI] [PMC free article] [PubMed] [Google Scholar]
- 18.Kaprelyants A S, Mukamolova G V, Kell D B. Estimation of dormant Micrococcus luteus cells by penicillin lysis and by resuscitation in cell-free spent culture medium at high dilution. FEMS Microbiol Lett. 1994;115:347–352. [Google Scholar]
- 19.Kjelleberg S, Albertson N, Flardh K, Holmquist L, Jouperjaan A, Marouga R, Ostling J, Svenblad B, Weichart D. How do non-differentiating bacteria adapt to starvation? Antonie Leeuwenhoek. 1993;63:331–341. doi: 10.1007/BF00871228. [DOI] [PubMed] [Google Scholar]
- 20.Kloos W E, Bannerman T L. Update on the clinical significance of coagulase-negative staphylococci. Clin Microbiol Rev. 1994;7:117–140. doi: 10.1128/cmr.7.1.117. [DOI] [PMC free article] [PubMed] [Google Scholar]
- 21.Kolter R, Siegele D A, Tormo A. The stationary phase of the bacterial life-cycle. Annu Rev Microbiol. 1993;47:855–874. doi: 10.1146/annurev.mi.47.100193.004231. [DOI] [PubMed] [Google Scholar]
- 22.Laemmli U K. Cleavage of structural proteins during the assembly of the head of bacteriophage T4. Nature. 1970;227:680–685. doi: 10.1038/227680a0. [DOI] [PubMed] [Google Scholar]
- 23.Lange R, Hengge-Aronis R. Growth phase-regulated expression of bolA and morphology of stationary-phase Escherichia coli cells are controlled by the novel sigma factor ςS. J Bacteriol. 1991;173:4474–4481. doi: 10.1128/jb.173.14.4474-4481.1991. [DOI] [PMC free article] [PubMed] [Google Scholar]
- 24.Matin A, Auger E A, Blum P H, Schultz J E. Genetic basis of starvation survival in non-differentiating bacteria. Annu Rev Microbiol. 1989;43:293–316. doi: 10.1146/annurev.mi.43.100189.001453. [DOI] [PubMed] [Google Scholar]
- 25.Morton D S, Oliver J D. Induction of carbon starvation-induced proteins in Vibrio vulnificus. Appl Environ Microbiol. 1994;60:3653–3659. doi: 10.1128/aem.60.10.3653-3659.1994. [DOI] [PMC free article] [PubMed] [Google Scholar]
- 26.Mukamolova G V, Yanopolskaya N D, Votyakova T V, Popov V I, Kaprelyants A S, Kell D B. Biochemical changes accompanying the long-term starvation of Micrococcus luteus cells in spent growth medium. Arch Microbiol. 1995;163:373–379. [Google Scholar]
- 27.Mulvey M R, Switala J, Borys A, Loewen P C. Regulation of transcription of katE and katF in Escherichia coli. J Bacteriol. 1990;172:6713–6720. doi: 10.1128/jb.172.12.6713-6720.1990. [DOI] [PMC free article] [PubMed] [Google Scholar]
- 28.Naclerio G, Baccigalupi L, Caruso C, De Felice M, Ricca E. Bacillus subtilis vegetative catalase is an extracellular enzyme. Appl Environ Microbiol. 1995;61:4471–4473. doi: 10.1128/aem.61.12.4471-4473.1995. [DOI] [PMC free article] [PubMed] [Google Scholar]
- 29.Novick R P. Properties of a high-frequency transducing phage in Staphylococcus aureus. Virology. 1967;33:155–156. doi: 10.1016/0042-6822(67)90105-5. [DOI] [PubMed] [Google Scholar]
- 30.Nyström T, Flardh K, Kjelleberg S. Responses to multiple-nutrient starvation in marine Vibrio sp. strain CCUG-15956. J Bacteriol. 1990;172:7085–7097. doi: 10.1128/jb.172.12.7085-7097.1990. [DOI] [PMC free article] [PubMed] [Google Scholar]
- 31.Nyström T, Olsson R M, Kjelleberg S. Survival, stress resistance, and alterations in protein expression in the marine Vibrio sp. strain S14 during starvation for different individual nutrients. Appl Environ Microbiol. 1992;58:56–65. doi: 10.1128/aem.58.1.55-65.1992. [DOI] [PMC free article] [PubMed] [Google Scholar]
- 32.Nyström T. The glucose-starvation stimulon of Escherichia coli—induced and repressed synthesis of enzymes of central metabolic pathways and role of acetyl phosphate in gene-expression and starvation-survival. Mol Microbiol. 1994;12:833–843. doi: 10.1111/j.1365-2958.1994.tb01069.x. [DOI] [PubMed] [Google Scholar]
- 33.Nyström T. The trials and tribulations of growth arrest. Trends Microbiol. 1995;3:131–136. doi: 10.1016/s0966-842x(00)88901-5. [DOI] [PubMed] [Google Scholar]
- 34.Oliver J D. Formation of viable but non-culturable cells. In: Kjelleberg S, editor. Starvation in bacteria. New York, N.Y: Plenum Press; 1993. pp. 239–268. [Google Scholar]
- 35.Oliver J D, Bockian R. In vivo resuscitation, and virulence towards mice, of viable but nonculturable cells of Vibrio vulnificus. Appl Environ Microbiol. 1995;61:2620–2623. doi: 10.1128/aem.61.7.2620-2623.1995. [DOI] [PMC free article] [PubMed] [Google Scholar]
- 36.Oliver J D, Nilsson L, Kjelleberg S. Formation of nonculturable Vibrio vulnificus cells and its relationship to the starvation state. Appl Environ Microbiol. 1991;57:2640–2644. doi: 10.1128/aem.57.9.2640-2644.1991. [DOI] [PMC free article] [PubMed] [Google Scholar]
- 37.O’Neal C R, Gabriel W M, Turk A K, Libby S J, Fang F C, Spector M P. RpoS is necessary for both the positive and negative regulation of starvation survival genes during phosphate, carbon, and nitrogen starvation in Salmonella typhimurium. J Bacteriol. 1994;176:4610–4616. doi: 10.1128/jb.176.15.4610-4616.1994. [DOI] [PMC free article] [PubMed] [Google Scholar]
- 38.Ryan F J. Bacterial mutation in a stationary phase and the question of cell turnover. J Gen Microbiol. 1951;21:530–549. doi: 10.1099/00221287-21-3-530. [DOI] [PubMed] [Google Scholar]
- 39.Reeve C A, Amy P S, Matin A. Role of protein synthesis in the survival of carbon-starved Escherichia coli K-12. J Bacteriol. 1984;160:1041–1046. doi: 10.1128/jb.160.3.1041-1046.1984. [DOI] [PMC free article] [PubMed] [Google Scholar]
- 40.Reeve C A, Bockman A T, Matin A. Role of protein-degradation in the survival of carbon-starved Escherichia coli and Salmonella typhimurium. J Bacteriol. 1984;157:758–763. doi: 10.1128/jb.157.3.758-763.1984. [DOI] [PMC free article] [PubMed] [Google Scholar]
- 41.Seigele D A, Almiron M, Kolter R. Approaches to the study of survival and death in stationary-phase Escherichia coli. In: Kjelleberg S, editor. Starvation in bacteria. New York, N.Y: Plenum Press; 1993. pp. 151–167. [Google Scholar]
- 42.Seymour R L, Mishra P V, Khan M A, Spector M P. Essential roles of core starvation-stress response loci in carbon-starvation-inducible adaptive resistance to oxidative challenge in Salmonella typhimurium. Mol Microbiol. 1996;20:497–505. doi: 10.1046/j.1365-2958.1996.5451068.x. [DOI] [PubMed] [Google Scholar]
- 43.Shingler V. Signal sensing by sigma(54)-dependent regulators—derepression as a control mechanism. Mol Microbiol. 1996;19:409–416. doi: 10.1046/j.1365-2958.1996.388920.x. [DOI] [PubMed] [Google Scholar]
- 44.Spector M P, Cubitt C L. Starvation-inducible loci of Salmonella typhimurium—regulation and roles in starvation-survival. Mol Microbiol. 1992;6:1467–1476. doi: 10.1111/j.1365-2958.1992.tb00867.x. [DOI] [PubMed] [Google Scholar]
- 45.Spector M P, Aliabadi Z, Gonzalez T, Foster J W. Global control in Salmonella typhimurium: two-dimensional electrophoretic analysis of starvation-inducible, anaerobiosis-inducible, and heat shock-inducible proteins. J Bacteriol. 1986;168:420–424. doi: 10.1128/jb.168.1.420-424.1986. [DOI] [PMC free article] [PubMed] [Google Scholar]
- 46.Ullmann A, Danchin A. Role of cyclic-AMP in bacteria. Adv Cyclic Nucleotide Res. 1983;15:1–53. [Google Scholar]
- 47.Wu S, De Lencastre H, Tomasz A. Sigma-B, putative operon encoding alternative sigma factor of Staphylococcus aureus RNA polymerase: molecular cloning and DNA sequencing. J Bacteriol. 1996;178:6036–6042. doi: 10.1128/jb.178.20.6036-6042.1996. [DOI] [PMC free article] [PubMed] [Google Scholar]
- 48.Xu H S, Roberts N, Singleton F L, Attwell R W, Grimes D J, Colwell R R. Survival and viability of non-culturable Escherichia coli and Vibrio cholerae in the estuarine and marine environment. Microb Ecol. 1982;8:313–323. doi: 10.1007/BF02010671. [DOI] [PubMed] [Google Scholar]
- 49.Zambrano M M, Siegele D A, Almiron M, Tormo A, Kolter R. Microbial competition—Escherichia coli mutants that take over stationary phase cultures. Science. 1993;259:1757–1760. doi: 10.1126/science.7681219. [DOI] [PubMed] [Google Scholar]


