

Abstract
Background
Medulloblastoma is the most common pediatric brain malignancy. Patients with the Group 3 subtype of medulloblastoma (MB) often exhibit MYC amplification and/or overexpression and have the poorest prognosis. While Group 3 MB is known to be highly dependent on MYC, direct targeting of MYC remains elusive.
Methods
Patient gene expression data were used to identify highly expressed EYA2 in Group 3 MB samples, assess the correlation between EYA2 and MYC, and examine patient survival. Genetic and pharmacological studies were performed on EYA2 in Group 3 derived MB cell models to assess MYC regulation and viability in vitro and in vivo.
Results
EYA2 is more highly expressed in Group 3 MB than other MB subgroups and is essential for Group 3 MB growth in vitro and in vivo. EYA2 regulates MYC expression and protein stability in Group 3 MB, resulting in global alterations of MYC transcription. Inhibition of EYA2 tyrosine phosphatase activity, using a novel small molecule inhibitor (NCGC00249987, or 9987), significantly decreases Group 3 MB MYC expression in both flank and intracranial growth in vivo. Human MB RNA-seq data show that EYA2 and MYC are significantly positively correlated, high EYA2 expression is significantly associated with a MYC transcriptional signature, and patients with high EYA2 and MYC expression have worse prognoses than those that do not express both genes at high levels.
Conclusions
Our data demonstrate that EYA2 is a critical regulator of MYC in Group 3 MB and suggest a novel therapeutic avenue to target this highly lethal disease.
Keywords: EYA2, Group 3 medulloblastoma, MYC
Key Points.
EYA2 regulates MYC levels transcriptionally and post-translationally in Group 3 medulloblastoma (MB).
Inhibition of the EYA2 Tyr Phosphatase, using a novel allosteric small molecule inhibitor NCGC00249987 (9987), which crosses the blood-brain barrier and inhibits MYC, leads to decreased MB growth both in the flank and in the orthotopic site.
Identified new means to inhibit MYC in Group 3 MB.
Importance of the Study.
In this study, we identify EYA2 as a critical regulator of Group 3 medulloblastoma (MB) growth, likely in large part through regulation of MYC gene expression and protein stability. We demonstrate that EYA2 is essential for Group 3 MB growth in vitro and in vivo. Importantly, we show that our novel EYA2 inhibitor, which allosterically targets EYA2 tyrosine phosphatase activity, increases survival and reduces MYC protein levels in vivo, both in the flank and orthotopic sites, suggesting a novel means to inhibit Group 3 MB. Given that MYC targeting remains elusive and that Group 3 MB is highly dependent on MYC, our studies suggest an alternative means by which this key oncogene can be targeted to control disease progression.
Medulloblastoma (MB) is the most common malignant brain tumor in children and adolescents. Transcriptional profiling of human tumor samples has enabled the identification of 4 distinct molecular groups in the disease: WNT, Sonic Hedgehog (SHH), Group 3, and Group 4.1,2 Despite this classification, molecular heterogeneity and differences in clinical outcome are observed within groups.3,4 Taylor and colleagues used a multifactorial approach to categorize MB into 12 different subtypes across the 4 main groups: 2 WNT, 4 SHH, 3 Group 3, and 3 Group 4.3 Group 3 tumors make up 19%–25% of MB diagnoses, commonly exhibit c-MYC (MYC) amplification and/or overexpression, and have the poorest clinical outcomes compared to other groups.3,4 Recent re-analysis of Group 3 and Group 4 tumors has classified them into a continuum of 8 subtypes based on molecular and clinicopathological features.5 Consistent with previous studies, the high MYC-expressing subtypes (II, III) in this re-analysis demonstrated the highest risk features.5 In comparison, WNT-driven tumors, which also express MYC at relatively high levels, have an overall 5-year survival of 97%–100%, suggesting that in Group 3 tumors, high MYC expression may be accompanied by other factors that make this Group particularly aggressive. Furthermore, those patients who do survive the disease experience long-term morbidity and secondary tumors that are associated with current treatment modalities (surgery, radiation and chemotherapy).1 As such, there is a critical need to identify novel therapeutic targets for MB, with a specific emphasis on MYC-amplified Group 3/subtype II.5
The eyes absent family of transcriptional coactivators and phosphatases (EYA) are essential for the development of numerous organs in mammals, including the eyes, kidneys, lungs, and brain, amongst others.6,7 As transcriptional coactivators, EYAs are recruited to the nucleus by binding to the SIX family of homeodomain-containing transcription factors, and modulate the expression of SIX target genes.6,8 EYA proteins have a conserved C-terminal EYA domain, which harbors intrinsic tyrosine phosphatase (Tyr Ptase) activity. The Tyr Ptase activity of EYA proteins has been shown to act together with SIX proteins to transactivate genes and is also implicated in tumor maintenance and progression in part by promoting stem-like characteristics and cellular migration.6,8–10 While few direct EYA Ptase targets are known, those that are known have important implications in cancer. For example, in response to DNA damage, EYA proteins dephosphorylate tyrosine-142 on histone variant H2A.X (pY142-H2AX), promoting DNA repair instead of apoptosis.11,12 In breast cancer cells, EYA2 has been shown to dephosphorylate tyrosine-36 on estrogen receptor beta (pY36-ERβ) to inhibit the transcription of genes that suppress tumor progression.13 In addition, the Tyr Ptase activity of EYA1 is required to activate GLI1-mediated transcription in SHH-driven MB, although the direct target(s) of EYA1 in this context is unknown. Nonetheless, these and other data demonstrate that EYAs, both through transcriptional and Ptase activities, can be critical regulators of tumor growth and progression in multiple contexts.7,9,10,14–18
Intriguingly, MYC is a known target of EYA proteins, though the relevance of this regulation has never been explored in MB. In the context of development and other tumor types, multiple groups have demonstrated EYA’s Tyr Ptase activity is required for transcriptional regulation of MYC.6,18 However, the regulatory mechanism between EYAs Tyr Ptase activity and transcriptional activity remains unclear. Recent breast cancer studies from our laboratory demonstrated that EYA3, through an interaction with the serine/threonine phosphatase, PP2A, can stabilize MYC by dephosphorylating threonine 58 (pT58), preventing its degradation.16 Intriguingly, in vitro dephosphorylation assays using purified regions of EYA1 have shown the EYA domain, which harbors the Tyr Ptase active site, has moderate threonine Ptase activity on its own, but also cooperates with the N-terminal threonine/serine Ptase activity to dephosphorylate MYC peptides on pT58.19 Since EYA proteins regulate MYC at the transcriptional and post-translational level,6,16,19 we hypothesized that one or more members of the EYA family may play a previously unappreciated role in Group 3 MB by enhancing MYC levels, thereby increasing MYC-dependent transcriptional programs. Indeed, this function of EYA could contribute to the increased aggressiveness and MYC-dependency observed in Group 3 MB, making EYA proteins particularly attractive potential therapeutic targets for this disease, as drugging MYC has remained elusive.
Here we provide evidence that the EYA family member, EYA2, is significantly upregulated in Group 3 MB, compared to other subgroups. We further show that EYA2 is essential for Group 3 MB growth in vitro and in vivo, and that its loss dramatically decreases MYC-associated gene expression. We find that EYA2 positively regulates both the expression of MYC, as well as the stability of the MYC protein, and is thus an important component of MYC regulation even when MYC is amplified. Using a novel inhibitor to EYA2 developed by our laboratory, NCGC00249987 (9987),20–23 we demonstrate that inhibition of the EYA2 Tyr Ptase significantly inhibits in vitro MB growth. In xenograft models, mice implanted in either the flank, or in the brain, with Group 3 MB cells exhibited reduced expression of MYC, reduced tumor growth, and prolonged survival when treated with 9987, suggesting that this inhibitor, if developed for the clinic, may be efficacious for Group 3 MB patients. Given the diminished expression of EYA2 after embryonic development is complete,24 and the limited toxicity of 9987 in animal models,18 our data identify the EYA2 Tyr Ptase as a viable target for group 3 MB, likely in large part due to its ability to regulate the key driver of the disease, MYC.
Materials and Methods
Ethical Statement
Medulloblastoma tumors were obtained from Children’s Hospital Colorado (Aurora, CO) in compliance with the Colorado Multiple Institutional Review Board (COMIRB 95-500) regulations. All animal studies were performed at the University of Colorado Anschutz Medical Campus. All surgery was performed with approval from the University of Colorado Anschutz Medical Campus IACUC committee. The statistics used are provided in the figure legends and Supplementary Methods.
Cell Lines and Culture Conditions
Medulloblastoma cells D425, D458. D283, DAOY, and ONS-76 cells were cultured according to ATCC culture conditions at 37°C and 5% CO2.
Patient Data
Medulloblastoma tumors were obtained from Children’s Hospital Colorado (Aurora, CO) in compliance with the Colorado Multiple Institutional Review Board (COMIRB 95-500) regulations. Clinical data from Weishaupt et al. (GSE124814) or from Cavalli et al. (GSE85217) was analyzed in R (version 4.2) using Tidyverse and ggplot2 packages.
Biochemical Analysis
Total RNA was extracted from D425, D458, D283, ONS-76, and DAOY cells or from EYA2 KD D425 and D458 cells using the RNAeasy RNA isolation kit (Qiagen). cDNA synthesis was performed using iScript. qRT–PCR assays were performed using ssoFast Evagreen supermix (BioRad). RNA sequencing was performed by the University of Colorado Genomics Shared Resource. Primer sequences used for RT-qPCR, RNA-seq library preparation, and cell sorting are listed in Supplementary Methods.
For immunoblot analysis, whole cell lysates were prepared using standard methods. Antibodies used are listed in Supplementary Methods. For in vitro drug studies, 1 × 10⁶ D458 or 1.5 × 10⁶ DAOY-MYC cells were cultured with DMSO (Sigma) or 24 µM 9987 for 72 hours. MYC RNA and protein were assessed by qRT–PCR and western blot as described in Supplementary Methods.
Generation of shEYA2 Knockdown and CRISPR Knock-out Cell Lines
shRNA vectors, non-targeting controls (Transomic, shERWOOD Ultra), and packaging (pSPAX2 and pMD2.G) plasmids were transfected into HEK293T cells using Lipofectamine 2000 according to manufacturer’s protocols. The top 10% of zsGreen-positive cells were sorted by fluorescence-activated cell sorting. EYA2 knockdown was validated by qRT–PCR and immunoblot. D425 cells constitutively expressing firefly luciferase (D425-LUC) were used to generate EYA2 knock-out (KO) clones. D425-LUC cells were transfected with 1 of the 2 all-in-one sgRNA/Cas9 construct (GeneCopoeia) targeting EYA2 using Lipofectamine 2000 (ThermoFisher) according to manufacturer’s protocols. Cells were sorted into 96-well plates as single cells in growth media and expanded into clonal populations. EYA2 KO was assessed by Sanger sequencing. sgRNAs and sequencing primers are listed in Supplementary Methods.
Cell Growth Assays
CellTiterGlo (Promega) was used to assess growth of EYA2 KD and control D425 and D458 cells according to the manufacturer’s protocol. CellTiterGlo was also used to assess the growth of DAOY-Ctrl and DAOY-MYC cells cultured with and without 24 µM 9987 for 120 hours, according to the manufacturer’s protocol. In vitro growth analysis of D341, D425, and D458 cells cultured with 9987 was performed using Incucyte. Methylcellulose assays were performed using 2.6% methylcellulose mixed at a 1:1 ratio with D458/D425 growth medium.
Immunohistochemistry
Tumor tissues were harvested and fixed in 4% paraformaldehyde for 24 hours followed by 24 hours in 70% ethanol. FFPE blocks were made from tumors and processed by established protocols.
Animal Studies
For EYA2 KD, KO, and D458 orthotopic studies in which animals were treated with 9987, 2 × 10⁵ cells were intracranially transplanted and monitored by MRI or luciferin. For flank studies, 2.5 × 10⁶ cells were subcutaneously injected, and tumor growth was measured by calipers.
See Supplementary Methods for additional details on all methods.
Results
EYA2 is Highly Expressed in Group 3 Medulloblastoma
To determine whether EYA family members (EYA1-4), which are known to control MYC transcription and stability,6,16 play a role in Group 3 MB we first interrogated our previously generated differential gene expression microarray dataset, containing SHH and Group 3 MB as well as control, non-cancerous brain tissue obtained from epileptic patients (GSE94349).25 This analysis identified EYA2 (Figure 1A) and EYA3 (Supplementary Figure 1A), as significantly increased in Group 3 MB, which, as expected and previously observed, showed increased MYC expression compared to SHH-driven tumors and brain tissue controls (Supplementary Figure 1B3,4). To confirm whether EYA2 and EYA3 overexpression, specifically in Group 3 MB, could be observed in a larger human dataset we assessed the expression of all 4 EYAs and MYC in a publicly available MB batch-normalized gene expression dataset (GSE124814)26 from 1350 MB patient tumors and 291 control brain tissue samples from epileptic patients. In corroboration with our own data shown in Figure 1A, we found that in this larger dataset, EYA2 was significantly overexpressed in Group 3 MB samples compared to control brain tissue and other MB subtypes (Figure 1B). As previously reported,3,4,7,27MYC is most highly expressed in Group 3 and WNT tumors and EYA1 is most highly expressed in the SHH MB subtype (Supplementary Figure 1C, 1D). In contrast to our microarray data, in this larger dataset, EYA3 did not display robust differential expression between subtypes (Supplementary Figure 1E). EYA4 showed no differential expression between subtypes, in line with our microarray data (Supplementary Figure 1F).
Figure 1.
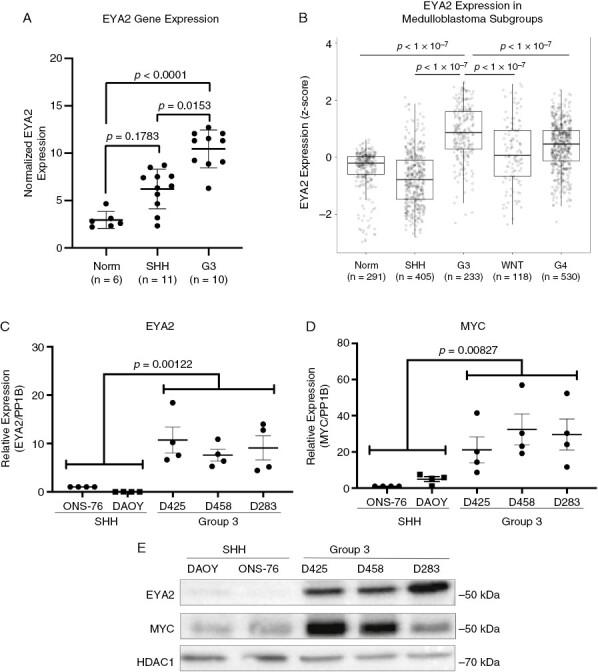
EYA2 is highly expressed in Group 3 medulloblastoma. (A) Normalized EYA2 expression by microarray in Group 3 MB, SHH-driven MB, or brain tissue from epileptic patients. Statistical analysis: One-way ANOVA with Tukey’s post hoc analysis for multiple comparisons. (GSE94349)25 (B) EYA2 expression in Group 3 MB (GSE124814)26 compared to other subgroup tumors or brain tissue from epileptic patients. Statistical analysis: One-way ANOVA with Tukey’s post hoc analysis for multiple comparisons. (C) EYA2 and (D) MYC expression in SHH-driven (DAOY, ONS-76) and Group 3 (D425, D458, and D283) MB models. Statistical analysis: ANOVA with sum contrasts in R for 4 independent experiments, each performed in technical triplicate. (E) Western blot of EYA2 and MYC protein expression in SHH-driven and Group 3 medulloblastoma cell models, representative of four independent experiments.
Having observed increased EYA2 expression in human Group 3 MB samples, we assessed EYA2 and MYC expression in multiple MB human cell lines derived from Group 3 (D425, D458, D283) and SHH tumors (DAOY, ONS-76) to determine whether commonly used cell line models would mimic what was observed in human MB. We chose Group 3 cell lines known to exhibit MYC amplification (D425, D458), as well as a non-MYC amplified, Group 3/4 cell line (D283).28 Indeed, EYA2 and MYC were both elevated (at the mRNA and protein levels) in the Group 3 and Group 3/4 MB cell lines compared to the SHH lines (Figure 1C–E). Due to the relatively lower levels of MYC protein observed in D283 cells and their characterization as Group 3/4 medulloblastoma, we chose to move forward using the MYC-amplified Group 3 D425 and D458 cell lines. Taken together, these data demonstrate that EYA2 is more highly expressed in high MYC-expressing Group 3 MB cells.
EYA2 Transcriptionally and Post-translationally Regulates MYC in Group 3 MB
To determine whether EYA2 regulates MYC levels in Group 3 MB, we generated control (shNC) and EYA2 knockdown cell lines (KD1, KD2) in both D425 and D458 cell lines (Figure 2A–C). To enrich for cell populations with robust EYA2 KD, we used shRNA vectors containing a ZsGreen gene upstream of the shRNA. We then used fluorescence-activated cell sorting to select the top 10% zsGreen-positive cells for use in subsequent experiments. EYA2 knockdown in D425 and D458 cells consistently led to decreased MYC mRNA expression, suggesting the transcriptional regulation of MYC by EYA2 in Group 3 MB (Figure 2A, B). To determine if EYA2 post-translationally regulates MYC in Group 3 MB via its ability to dephosphorylate phospho-threonine 58 (pT58), likely through its association with PP2A,16 we assessed EYA2, MYC, and MYC-pT58 levels by Western blot analysis. Our results demonstrate that EYA2 KD leads to a decrease in MYC protein levels, and that a greater proportion of the remaining MYC protein is phosphorylated on T58 in EYA2 KD cells when compared to shNC cells (Figure 2C, D). Because pT58-MYC marks the protein for degradation,29,30 this alteration of MYC phosphorylation is likely to be partially responsible for the decreased levels of total MYC protein. These data support the hypothesis that in addition to regulating MYC mRNA, EYA2 regulates MYC stability in group 3 MB by promoting dephosphorylation of pT58.
Figure 2.
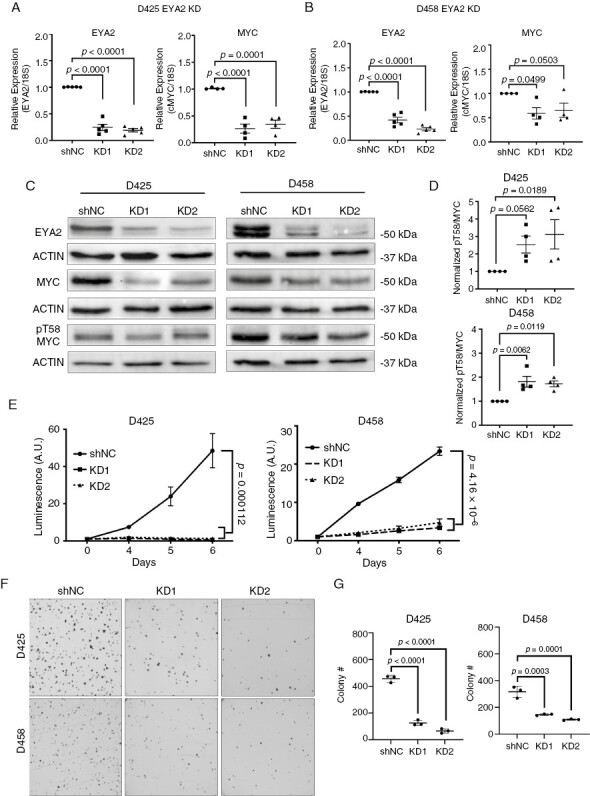
EYA2 is required for Group 3 MB growth and regulates MYC transcription and protein stability. (A) EYA2 and MYC mRNA expression in D425 shNC and EYA2 KD cells. (B) EYA2 and MYC mRNA expression in D458 shNC and EYA2 KD cells. Data in Figures 2A and B are normalized from either 5 (EYA2) or 4 (MYC) independent experiments. (C) Western blot showing EYA2, MYC, and phospho-threonine 58 (pT58) MYC levels in shNC and EYA2 KD in D425 and D458 cells (n = 4 independent experiments). (D) pT58-MYC:MYC ratio in EYA2 KD in D425 and D458 cells. Statistical analysis for Figures 2A–D: Kruskal–Wallis or one-way ANOVA with a Dunnett’s post hoc test. (E) Loss of EYA2 in D425 and D458 cells elicits severe growth defects as measured by CellTiterGlo, one growth curve is shown with technical triplicates (representative of three independent experiments). Statistical analysis: Longitudinal mixed-effects model in R. (F) Loss of EYA2 in D425 and D458 cells impairs colony growth in methylcellulose growth assays. Representative images of three independent experiments. (G) Quantitation of methylcellulose growth from panel (F) Statistical analysis: One-way ANOVA with Dunnett’s post hoc analysis for multiple comparisons.
As MYC KD or targeting of MYC via BET bromodomain inhibitors, such as JQ1, dramatically diminishes the growth and progression of MYC-amplified MB,31,32 we asked whether EYA2, like MYC, is required for group 3 MB growth. As expected, given the profound regulation of MYC by EYA2, KD of EYA2 in D425 and D458 cells dramatically reduced growth, as determined by a CellTiterGlo assay (Figure 2E). In addition, when growth was assessed with methylcellulose assays, thought to better mimic the conditions in the brain,33 we also observed dramatic decreases in growth with EYA2 KD (Figure 2F, G). The growth defects of EYA2 KD were so profound in vitro that we were unable to maintain stable KD lines, and thus KD lines were continually reestablished for assays described throughout this manuscript.
Given the demonstration that EYA2 regulates MYC mRNA and protein levels in Group 3 MB, we investigated whether MYC-associated gene expression is altered globally by EYA2 KD in this context. To this end, we performed RNA-sequencing on shNC and EYA2 KD (KD1 and KD2) D425 and D458 cells in biological triplicate and performed differential gene expression analysis and pathway enrichment using GSEA (gene set enrichment analysis) to identify gene sets enriched in EYA2 KD cells. The top up- and down-regulated gene sets upon EYA2 reduction in D425 and D458 cell lines are shown in Figure 3A and C. In both cell lines, MYC target gene sets were among the most significantly enriched gene sets in shNC versus EYA2 KD lines (Figure 3A–D), supporting our hypothesis that EYA2 is a key regulator of MYC activity in group 3 MB. Additional pathways significantly altered with EYA2 KD include E2F target and G2/M checkpoint pathways, both associated with MYC-driven proliferation.34–36 Heat maps depicting the average z-scores from three biological replicates of EYA2 KD and shNC show clear global alterations of MYC-regulated genes with EYA2 loss in both D425 and D458 cells (Figure 3E, F, individual replicates are shown in Supplementary Figure 2A). Additionally, we performed transcription factor analysis of our DEGs. We found that many of the differentially expressed genes with EYA2 KD contained binding motifs for SIX proteins (EYAs cognate transcription factor binding partner8,37). In addition, a large number of MYC target genes were identified, a subset of which can be bound by both SIX proteins and MYC (Supplementary Figure 2B). These data demonstrate that gene expression changes observed with EYA2 KD encompass both direct targets of MYC, as well as additional targets of the EYA proteins. Taken together, our data demonstrate for the first time that EYA2 regulates MYC levels and transcriptional output specifically in Group 3 MB cells, suggesting that it may be critical for regulating survival and/or growth for this subtype of MB, given its high dependence on MYC.
Figure 3.
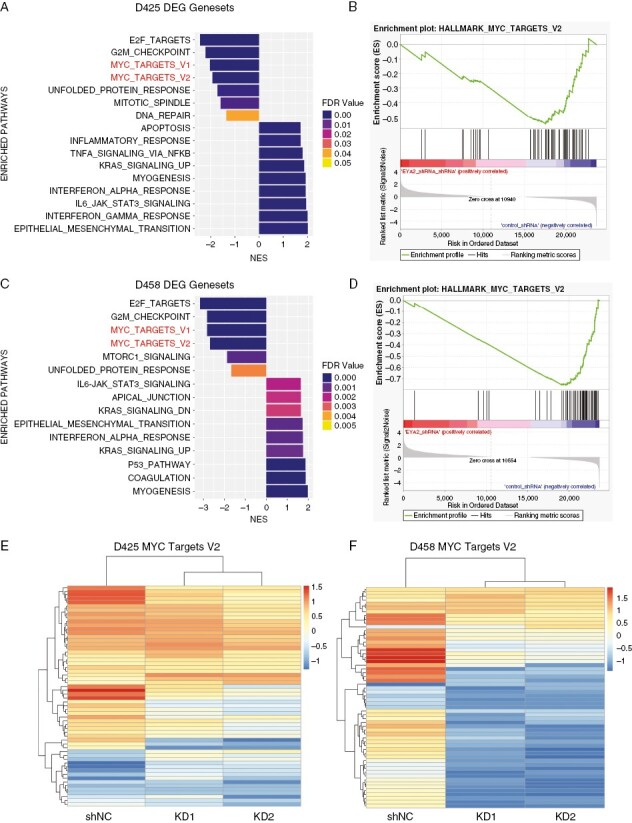
EYA2 regulates MYC gene targets. (A) Pathway analysis of differentially expressed genes between shNC and EYA2 KD D425 cells. (B) GSEA plot of MYC target genes between shNC and EYA2 KD D425 cells. (C) Pathway analysis of differentially expressed genes between shNC and EYA2 KD D458 cells. (D) GSEA plot of MYC target genes between shNC and EYA2 KD D458 cells. (E) Heatmap of differentially expressed MYC target genes in D425 shNC and EYA2 KD cells. (F) Heatmap of differentially expressed MYC target genes in D458 shNC and EYA2 KD cells. RNA-seq between shNC and EYA2 KD cells was performed in 3 biological replicates. Heatmaps are representative of average gene expression from 3 independent knockdowns for each cell line.
EYA2 Loss Decreases Group 3 MB Growth In Vivo
Given the profound effects of EYA2 KD on growth in vitro, we further examined the effects of decreased EYA2 levels on Group 3 MB growth in vivo. To this end, we orthotopically transplanted control (shNC) or EYA2 KD D458 or D425 cells into brains of NSG mice. Mice that received D458 EYA2 KD cells exhibited reduced tumor growth and had a survival advantage compared to mice that received D458 shNC tumors (Figure 4A–C). However, all tumors eventually grew, and the mice receiving D458 EYA2 KD cells ultimately succumbed to the disease (Supplementary Figure 3A). In the context of D425 EYA2 KD cells, we did not observe a statistical difference in tumor growth or survival, although a modest trend towards decreased growth and survival was observed (Supplementary Figure 3B-D). IHC analysis of both D425 and D458 end-point tumors for EYA2 and MYC protein revealed no difference in EYA2 or MYC protein levels between shNC and EYA2 KD tumors, suggesting that the cells capable of growing out had escaped EYA2 KD and the associated decrease in MYC levels (Supplementary Figure 3E-H).
Figure 4.
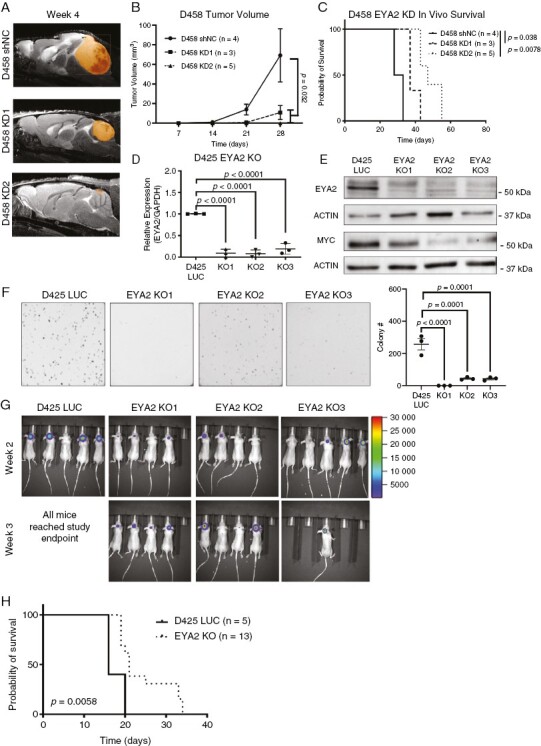
EYA2 is required for MB growth in vivo. (A) Representative MRIs at week 4 after mice were orthotopically transplanted with shNC or EYA2 KD D458 cells. (B) Tumor volume as measured by MRI of shNC and EYA2 KD D458 tumors. Statistical analysis: Longitudinal mixed-effects model in R. (C) Survival curves for mice transplanted with shNC or EYA2 KD D458 tumors. Statistical analysis: Mantel-Cox log-rank test with Bonferroni correction for multiple comparisons. (D) EYA2 mRNA in D425 parental and CRISPR knock-out (KO) clones. Statistical analysis: One-way ANOVA with Dunnett’s post hoc test. Data represents 3 independent experiments each performed in technical triplicate. (E) EYA2 and MYC protein levels in D425-LUC parental and EYA2 KO clones. Representative of 3 western blots. (F) Representative images of a methylcellulose colony formation assay performed with D425-LUC parental and EYA2 KO clones. Statistical analysis: One-way ANOVA with Dunnett’s post hoc test. Representative of three independent experiments, each performed in technical triplicate. (G) IVIS imaging of luciferase-expressing D425-LUC and EYA2 KO clones intracranially injected into mice. (H) Kaplan–Meier survival curves of mice transplanted with D425-LUC parental or EYA2 KO clones, composite of all three KO groups. Statistical Analysis: Log-rank Mantel-Cox test.
To overcome this technical barrier observed in EYA2 KD cells, we used CRISPR-Cas9 to develop clonal EYA2 KO lines in D425 cells stably expressing firefly luciferase (D425-LUC) (Figure 4D, Supplementary Figure 4A). EYA2 KO cells exhibited decreased EYA2 and MYC protein (Figure 4E) compared to D425-LUC cells. In line with the EYA2 KD lines, D425 EYA2 KO cells exhibited growth defects in the methylcellulose growth assays (Figure 4F). To test if KO of EYA2 affects tumor growth in vivo, we orthotopically transplanted D425-LUC -or D425 EYA2 KO cells into the brains of NSG mice and monitored tumor growth and survival, finding that EYA2 loss led to a significant survival advantage in NSG mice (Figure 4G, H). Intriguingly, IHC analysis of end-point EYA2 KO tumors revealed a significant reduction in EYA2 protein levels, but not MYC protein levels (Supplementary Figure 4B–D). These data underscore the dependence of Group 3 MB on MYC for in vivo growth, and suggest that even in the absence of EYA2, there are mechanisms by which the EYA2 KO cells compensate and upregulate MYC. Taken together, our data strongly suggest that EYA2 regulates MYC and is important for tumor growth in vivo.
Targeting EYA2 as a Therapy for Group 3 MB
Tyrosine phosphatase (Tyr Ptase) activity of EYA is known to promote tumor growth and maintenance through multiple different mechanisms.6,9–13 Importantly, the EYA Tyr Ptase has been linked to both MYC transcription6 and protein stability,19 though the precise mechanism by which it influences these activities is not known. Having shown that EYA2 regulates MYC both on the mRNA and protein levels in Group 3 MB, we asked whether inhibiting the EYA2 Tyr phosphatase activity may elicit similar growth phenotypes as EYA2 KD. We have previously identified a class of small molecule allosteric inhibitors of EYA2’s Tyr Ptase activity,20–23 which are highly specific to EYA2 within the family of EYAs, and are not known to target other phosphatases.20–23 Thus, we tested the lead compound, NCGC00249987 (9987),20–23 in Group 3 MB cells.
Treatment of D458 cells with 9987 led to reduced MYC mRNA (Figure 5A) and protein (Figure 5B) and increased pT58-MYC relative to total MYC (Figure 5B). In addition, D458 cell growth in vitro was inhibited after treatment with 9987 (Figure 5C). We further tested 9987 on two other MYC-amplified Group 3 MB lines, D425 and D431. Similar to what was observed in D458 cells, 9987 reduced the in vitro growth of D341 cells (Supplementary Figure 5A). Surprisingly, D425 cells did not exhibit growth inhibition when cultured with 9987 at the same dose as D341 or D458 cells (Supplementary Figure 5B). As EYA2 KD in D425 cells reduced MYC RNA, protein, and in vitro growth (Figure 2A-D), and EYA2 KO in D425 cells reduced MYC RNA, protein, and tumor growth (Figure 4D-H), these data suggest that either multiple activities of EYA2 are required in D425 cells to regulate MYC and D425 growth (in addition to the Tyr Phosphatase activity), or that much higher levels of the 9987 compound may be required to inhibit EYA2 in this context.
Figure 5.
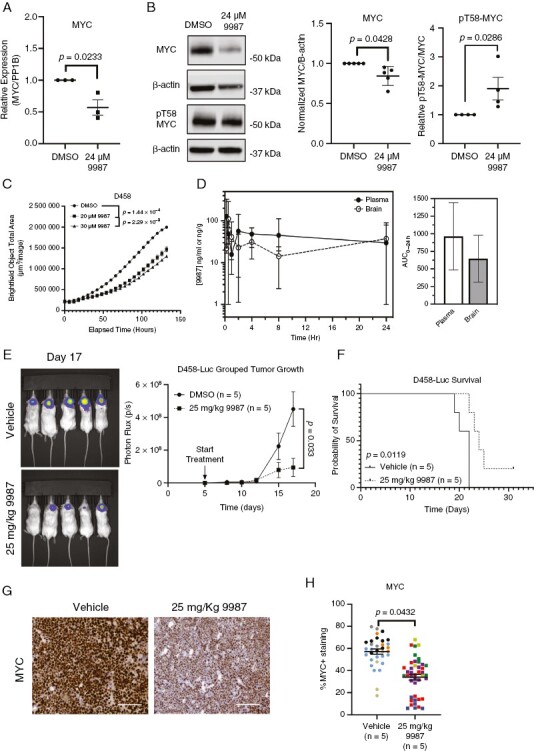
EYA2 Tyr Ptase inhibition decreases MYC levels and MB growth in vitro and in vivo. (A) Normalized MYC mRNA expression in D458 cells cultured with 24 μM 9987, representative of 3 independent experiments. Statistical analysis: Welch’s T-test. (B) Representative Western blot of D458 cells cultured with 24 μM 9987, representative of 5 (MYC) or 4 (pT58-MYC) independent experiments. Statistical analysis: Welch’s T-test. (C) Representative growth analysis of D458 cells cultured with indicated doses of 9987. Statistical analysis: Longitudinal mixed-effects model with a Bonferroni correction for multiple comparisons. (D) Pharmacokinetic analysis of 9987 in plasma and brain tissue through 24 hours. 9987 was assessed via mass spectrometry in 3–4 mice per time point. (E) Representative bioluminescence images (left) of end-point tumors in mice treated with vehicle or 25 mg/kg 9987, and intracranial tumor growth over time of vehicle or 9987 treated mice, measured as photon flux. Statistical analysis: Longitudinal mixed-effects model. (F) Kaplan–Meier curve of mice treated with vehicle or 25 mg/kg 9987. Statistical analysis: Log-rank Mantel-Cox test. (G) Representative IHC images of MYC from tumor bearing mice treated with vehicle or 25 mg/kg 9987. Scale bars represent 100 µm. (H) Quantification of MYC in end-point tumors of mice treated with vehicle or 25 mg/kg 9987. Statistical analysis: Nested T-test. Individual mice labeled in different colors. Data show 4–13 sections/tumor.
To determine whether 9987 has any off-target effects, we cultured DAOY cells, which are an SHH MB cell line that express relatively lower levels of EYA2 and MYC (Figure 1C, E), with 9987, and found that EYA2 inhibition had no effect on DAOY growth (Supplementary Figure 5C). Furthermore, to test whether 9987 directly affects MYC-mediated growth, we ectopically expressed MYC from an artificial promoter in DAOY cells (DAOY-MYC) and cultured them with 9987 to assess growth. We found 9987 had no effect on growth of DAOY-MYC cells, but we did observe a decrease in MYC protein in the DAOY-MYC cells cultured with 9987 (Supplementary Figure 5D-E). These data confirm our above findings that EYA2 Tyr Ptase inhibition can regulate MYC stability at the post-translational level, even in SHH-driven DAOY cells, which are not highly dependent on MYC for growth.
To determine the biological relevance of inhibiting the EYA2 Tyr Phosphatase on Group 3 MB growth in vivo, we first implanted D458 cells into the flank of NSG mice, as proof of concept, to avoid complications associated with the BBB. After transplanting the D458 cells, mice were treated with vehicle or 25 mg/kg 9987, delivered via oral gavage. Importantly, mice that received 9987 exhibited a significant reduction in tumor growth which resulted in a survival advantage (Supplementary Figure 6A, B), and did not exhibit weight loss compared to vehicle-treated mice (Supplementary Figure 6C). Furthermore, tumors from mice treated with 9987 exhibited reduced MYC protein levels by IHC (Supplementary Figure 6D, E), suggesting that our compound is able to reduce MYC expression and stability in vivo.
As our allosteric inhibitor was able to decrease Group 3 MB when grown in the flank, we further investigated whether this compound may have utility in a more clinically relevant setting (the brain). To this end, we performed pharmacokinetic (PK) analysis to determine if 9987 can cross the BBB. To assess whether 9987 crosses the blood-brain barrier (BBB), mass spectrometry analysis was performed on plasma and brain tissue of mice treated orally with 25 mg/Kg 9987. We found that for up to 24 hours, brain tissue contained 9987 at levels comparable to that seen in plasma, demonstrating that 9987 is able to cross the BBB (Figure 5D). Thus, we tested whether EYA2 Tyr Ptase inhibition would reduce Group 3 MB growth when cells were implanted intracranially. Our data show that, similar to what was observed with the tumors grown in the flank, 9987 attenuated Group 3 MB growth when present in the orthotopic site, prolonging survival (Figure 5E, F). Furthermore, end-point tumors demonstrated a significant reduction in MYC protein, as measured by IHC, when mice were treated orally with 9987 (Figure 5G, H). This study is the first to demonstrate that our novel, allosteric EYA2 Tyr Ptase inhibitor can cross the BBB and inhibit the growth of Group 3 MB. Taken together, these data demonstrate that targeting the EYA2 Tyr Ptase activity is highly efficacious in inhibiting MYC expression in MYC-amplified Group 3 MB, resulting in diminished tumor growth.
EYA2 Strongly Correlates With MYC in Patient Tumor Samples
To determine whether our findings in MB cell lines are relevant to the human disease, we examined the relationship between EYA2 and MYC in human MB. To this end, we performed a Pearson correlation between EYA2 expression and all other genes in 763 patient samples (GSE85217)3 and used the ranked gene list as an input for Gene Set Enrichment Analysis (Figure 6A). This analysis demonstrates that MYC target gene sets are highly positively correlated with EYA2 expression in MB (Figure 6B). To determine how EYA2 and MYC expression correlate at the individual tumor level, we plotted MYC and EYA2 gene expression as z-scores and stratified group 3 tumors compared to other MB subgroups. This analysis demonstrates that EYA2 and MYC expression are highly positively correlated in group 3 MB (Figure 6C). Furthermore, we used the available patient survival data and stratified survival according to EYA2 and MYC expression among all MB subtypes. We found that patients with higher-than-average EYA2 expression have a trend towards worsened survival outcomes than patients with lower EYA2 expression (Figure 6D, p = .063). As expected, patients with higher-than-average MYC had a statistically significant worsened overall survival than patients with lower MYC (Figure 6E). When stratifying patient survival by combining high EYA2 and MYC, we found that patients with high expression of both MYC and EYA2 had significantly worsened survival than patients with lower EYA2 and MYC, with a greater statistical significance than the group stratified only for high MYC (Figure 6F compared to 6G). We performed the same analysis specifically in Group 3 MB, though patient numbers were low and thus statistical significance (as defined by P < .05) was not achieved in any of the circumstances, though a clear trend towards worsened survival with high EYA2 is observed (Figure 6G, P = .059). When stratified by MYC expression alone in Group 3, there is no significant difference in patient outcome, presumably due to the high dependence and overall expression of MYC in these tumors (Figure 6H). Patients with both low EYA2/low MYC had a modestly improved survival outcome, though not statistically significant (P = .16) likely due to an underpowered patient number (Figure 6I). Overall, these patient data corroborate our cell-based findings, demonstrating that EYA2 strongly correlates with MYC in Group 3 MB, that it is associated with MYC gene expression signatures, and that the presence of EYA2 and MYC together correlate with worsened survival in MB. Thus, targeting EYA2 in Group 3 MBs may be a novel therapeutic strategy to decrease MYC levels and activity, thereby inhibiting the progression of these devastating tumors.
Figure 6.
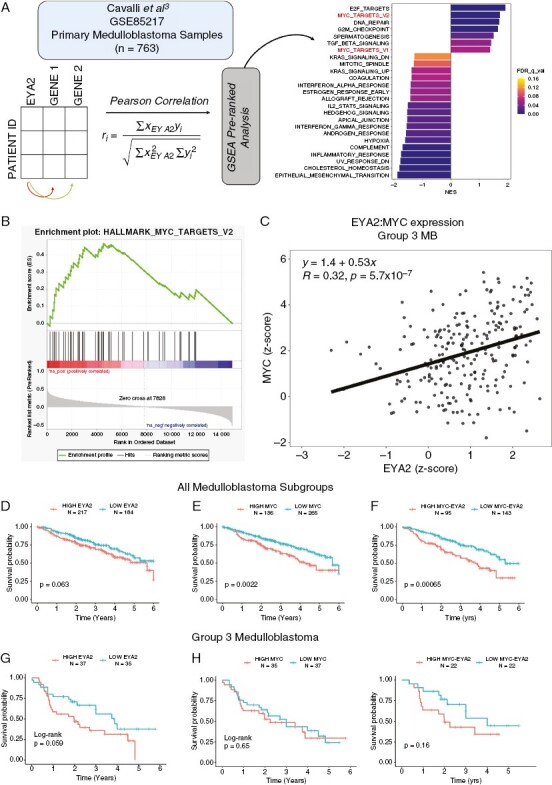
EYA2 correlates with MYC and MYC transcriptional signatures in MB samples. (A) GSEA pre-ranked analysis on genes correlated with EYA2 expression in primary MB tumors (GSE85217)3 (B) GSEA plot for MYC_targets_V2 genes. (C) MYC and EYA2 gene expression in Group 3 tumors. Patient survival across all MB subtypes stratified by differential (D) EYA2, (E) MYC, or F) EYA2 and MYC expression. Patient survival within group 3 MB stratified by high versus low (above or below the mean) (G) EYA2, (H) MYC, or (I) EYA2 and MYC expression. Statistical analysis for Figure 6D-I: Log-Rank analysis in R.
Discussion
Although significant efforts have been made to characterize the molecular drivers of WNT and SHH MB, much less is known about Group 3 and Group 4 MB, which present with molecular and genetic heterogeneity and are associated with relatively poor prognoses. Given the critical role of EYA1 in SHH-driven MB,7,14 and the fact that EYAs can regulate MYC gene expression and protein stability,6,16,19 we hypothesized that one or more EYA family members may be critical regulators of MYC in MYC-amplified Group 3 MB. Here, we report that EYA2 is highly expressed in Group 3 MB compared to other subgroups, where it correlates with MYC expression. Using Group 3 derived cell lines, D458 and D425, our data demonstrate that EYA2 is a critical regulator of MYC expression, protein stability, and cell growth in vitro and in vivo. Loss of EYA2 results in severe growth phenotypes in vitro and correlates with reduced MYC expression at the RNA and protein levels, and an increase in pT58-MYC, in agreement with previously published reports.6,16 A similar growth defect was also observed in vivo upon intracranial transplantation of shNC or EYA2 KD D458 cells; however, D425 EYA2 KD cells, while showing a slight defect in growth, did not reach significance. Yet, tumors that grew out in both contexts showed no difference in EYA2 or MYC protein levels by IHC analysis, suggesting that EYA2 and MYC are required for tumor outgrowth in vivo, and that only the cells with sufficient EYA2, and thus MYC levels, were able to successfully colonize in the brain. To determine if this was the case, we used CRISPR-Cas9 to generate 3 independent EYA2 KO clonal cell lines. The D425 EYA2 KO lines exhibited similar reductions in MYC protein and impaired growth in methylcellulose assays as the D425 EYA2 KD cells. When implanted orthotopically, the D425 EYA2 KO line conferred a significant survival advantage. Again, IHC analysis of the end-point tumors showed no difference in MYC protein between D425-LUC and the EYA2 KO clones, likely due to a compensatory mechanism established to maintain growth in the setting of EYA2 loss. Consistent with the reported heterogeneity in MB,3,38 our clonal EYA2 KO lines showed karyotypic variability, which could have affected the phenotypes of the cells (Supplementary Figure 7). We did observe an increase in double minutes, or extra-chromosomal fragments that have been shown to contain MYC in MB and other cancers,39–41 in our EYA2 KO clones. This increase in double minutes could contribute to re-expression of MYC in our in vivo study (Supplementary Figure 4B). Because of these karyotypic differences between clonal lines, we did not use these lines beyond the experiments outlined in Figure 4.
In developmental and cancer contexts, the Tyr Ptase activity of EYAs has been shown to modulate at least a subset of EYA transcriptional targets, including MYC.6,10 Additionally, EYA proteins are known to regulate MYC protein stability.6,16 Yet, how the EYA Tyr Ptase activity affects the transactivation activity of EYA proteins, or the associated Thr/Ser Ptase activity via PP2A, remains a broader, and as yet, still unanswered question in EYA biology. While we have previously shown that EYA3 regulates MYC protein stability in breast cancer via an interaction with PP2A16, it will be important in the future to determine whether EYA2 is similarly dependent on PP2A to stabilize MYC in the context of Group 3 MB. It should also be noted that the Tyr Ptase activity of EYA2 has numerous pro-tumorigenic roles, beyond modulating MYC levels, in the context of brain and other cancers.10–13 Nonetheless, because Group 3 MB is known to be exquisitely dependent on MYC, and because inhibition of the EYA2 Tyr Ptase with 9987 reduced MYC mRNA and protein expression in vitro, and had marked effects in vivo (reducing MYC, inhibiting tumor growth, and prolonging survival) our data suggest that MYC is likely at least one of the key targets of the EYA2 Tyr Ptase in this context. The finding that our novel EYA2 allosteric inhibitor reduces MYC levels and orthotopic tumor growth in vivo is especially exciting, as strategies for targeting MYC in Group 3 MB, or any other tumor, have remained elusive.
Currently, the standard of care for patients with MB is tumor resection, followed by craniospinal radiation and subsequent adjuvant chemotherapy.42 Recently, the use of carboplatin in combination with radiation therapy was shown to improve the survival of high-risk Group 3 MB patients from 54% to 73%,43 yet the use of targeted therapies remains an attractive alternative to broadly cytotoxic chemotherapy. Recent preclinical models demonstrate that targeting of CDKs can elicit cytostatic phenotypes in high-risk MB,44,45 and use of such agents in combination with cytotoxic chemotherapies or radiotherapy could offer more efficacious treatment for Group 3 MB tumors. Finally, while BET inhibitors have been assessed for their ability to decrease MYC transcription,31 these inhibitors are associated with thrombocytopenias amongst other toxicities.46 As EYA2 expression is typically low in developed tissue,24,37 and as mice treated with 9987 did not exhibit significant weight loss (Supplementary Figure 6C), therapeutically targeting EYA2, and thus MYC, could reduce the frequency of adverse effects observed in patients treated with current therapies for Group 3 MB. Of interest, several in vivo studies, one flank study in glioblastoma18 and the other an orthotopic experiment in breast cancer,47 have recently shown that EYA2 Tyr Ptase inhibition can reduce tumor growth and progression in these contexts, also with limited side effects. These data underscore the relevance of EYA2 as a potentially druggable target in multiple cancer types.
While the allosteric mechanism of action of the EYA2 Tyr Ptase inhibitor has been elucidated,20,21,23 understanding precisely how the Tyr Ptase impinges on MYC transcription and stability may enable the development of improved inhibitors. For example, while the EYA Tyr Ptase activity is known to influence its transcriptional activity in some contexts, the direct target(s) of the EYA2 Tyr Ptase that impacts transcription is unknown. EYAs are able to autodephosphorylate,48,49 and the phosphorylation state of EYAs regulates their subcellular localization.50 The ability of EYAs to autodephosphorylate may thus be a means to regulate their cytoplasmic and nuclear pools, and therefore, inhibiting the Tyr Ptase activity could sequester EYAs to a specific cellular compartment, impairing transcriptional activity. In addition, the means by which EYA Tyr Ptase activity impinges on its associated Thr Ptase activity, which is responsible for stabilizing MYC,16 is also not understood.
In conclusion, gaining an understanding of how EYA2 Tyr Ptase contributes to tumor growth and progression may identify it as a key target for Group 3 MB, as well as for other tumors in which EYA2 plays a critical role.17,18,51 Because of the low levels of expression of EYA2 in most adult tissues, its inhibition may provide a potent means to decrease tumor progression while conferring less toxicity compared to more traditional therapies.
Supplementary Material
Acknowledgments
We thank the Animal Imaging (RRID:SCR_021980), Bioinformatics and Biostatistics (RRID: SCR_021983), Genomics (RRID: SCR_021984), Flow Cytometry (RRID:SCR_022035), and Pathology (RRID:SCR_021994) Shared Resources of the University of Colorado Comprehensive Cancer Center for support in this work (P30CA046934).
Contributor Information
Arthur R Wolin, Department of Pharmacology, University of Colorado Anschutz Medical Campus (AMC), Aurora, Colorado, USA; Molecular Biology Graduate Program, University of Colorado AMC, Aurora, Colorado, USA.
Melanie Y Vincent, Department of Pharmacology, University of Colorado Anschutz Medical Campus (AMC), Aurora, Colorado, USA.
Taylor Hotz, Department of Pharmacology, University of Colorado Anschutz Medical Campus (AMC), Aurora, Colorado, USA.
Stephen C Purdy, Department of Pharmacology, University of Colorado Anschutz Medical Campus (AMC), Aurora, Colorado, USA; Cancer Biology Graduate Program, University of Colorado AMC, Aurora, Colorado, USA.
Sheera R Rosenbaum, Department of Pharmacology, University of Colorado Anschutz Medical Campus (AMC), Aurora, Colorado, USA.
Connor J Hughes, Department of Pharmacology, University of Colorado Anschutz Medical Campus (AMC), Aurora, Colorado, USA; Pharmacology Graduate Program, University of Colorado AMC, Aurora, Colorado, USA; Medical Scientist Training Program, University of Colorado AMC, Aurora, Colorado, USA.
Jessica Y Hsu, Department of Pharmacology, University of Colorado Anschutz Medical Campus (AMC), Aurora, Colorado, USA; Pharmacology Graduate Program, University of Colorado AMC, Aurora, Colorado, USA.
Michael U J Oliphant, Department of Pharmacology, University of Colorado Anschutz Medical Campus (AMC), Aurora, Colorado, USA; Integrated Physiology Graduate Program, University of Colorado AMC, Aurora, Colorado, USA.
Brock Armstrong, Department of Pharmacology, University of Colorado Anschutz Medical Campus (AMC), Aurora, Colorado, USA.
Veronica Wessells, Department of Medicine, Division of Medical Oncology, University of Colorado AMC, Aurora, Colorado, USA.
Marileila Varella-Garcia, Department of Medicine, Division of Medical Oncology, University of Colorado AMC, Aurora, Colorado, USA.
Matthew D Galbraith, Department of Pharmacology, University of Colorado Anschutz Medical Campus (AMC), Aurora, Colorado, USA; Linda Crnic Institute for Down Syndrome, University of Colorado AMC, Aurora, Colorado, USA.
Angela Pierce, Department of Pediatrics, Division of Hematology and Oncology, University of Colorado AMC, Aurora, Colorado, USA.
Dong Wang, Department of Pediatrics, Division of Hematology and Oncology, University of Colorado AMC, Aurora, Colorado, USA.
Sujatha Venkataraman, Department of Pediatrics, Division of Hematology and Oncology, University of Colorado AMC, Aurora, Colorado, USA.
Etienne Danis, Department of Pharmacology, University of Colorado Anschutz Medical Campus (AMC), Aurora, Colorado, USA.
Bethany Veo, Department of Pediatrics, Division of Hematology and Oncology, University of Colorado AMC, Aurora, Colorado, USA.
Natalie Serkova, Department of Radiology, University of Colorado AMC, Aurora, Colorado, USA.
Joaquin M Espinosa, Department of Pharmacology, University of Colorado Anschutz Medical Campus (AMC), Aurora, Colorado, USA; Linda Crnic Institute for Down Syndrome, University of Colorado AMC, Aurora, Colorado, USA.
Daniel L Gustafson, Clinical Sciences Department, Colorado State University, Fort Collins, Colorado, USA.
Rajeev Vibhakar, Department of Pediatrics, Division of Hematology and Oncology, University of Colorado AMC, Aurora, Colorado, USA.
Heide L Ford, Department of Pharmacology, University of Colorado Anschutz Medical Campus (AMC), Aurora, Colorado, USA; Molecular Biology Graduate Program, University of Colorado AMC, Aurora, Colorado, USA; Cancer Biology Graduate Program, University of Colorado AMC, Aurora, Colorado, USA; Pharmacology Graduate Program, University of Colorado AMC, Aurora, Colorado, USA; Medical Scientist Training Program, University of Colorado AMC, Aurora, Colorado, USA; Integrated Physiology Graduate Program, University of Colorado AMC, Aurora, Colorado, USA.
Funding
The work in this manuscript was supported by NIH grants to HLF: R01 NS108396, CA224867, and CA221282 as well as by an Alex’s Lemonade Stand Foundation Innovation Award and an Alex’s Lemonade Foundation Million Mile Match Funding (HLF), a Golfers Against Cancer Pilot (to HLF and RV), as well as a grant to RV from The Morgan Adams Foundation. MYV was supported by an Alex’s Lemonade Stand Foundation Postdoctoral fellowship.
Authorship statement
ARW, MYV, HLF, SV, and RV designed the study and experimental design. ARW, MYV, TH, SCP, SRR, CJH, MUJO, BA, BV, DW, and DG performed experiments and collected data. ARW, JYH, MG, JME, and ED performed bioinformatics analyses. AP performed orthotopic transplants. VW performed tumor sectioning and immunohistochemistry. MVG performed karyotyping. NS performed MRIs and data collection. ARW and HLF wrote the manuscript with input from all authors.
Conflict of interest statement
JME has provided consulting services to Eli Lilly and Co. and Gilead Sciences Inc. and serves on the advisory board of Perha Pharmaceuticals. All other authors declare no conflicts of interest.
References
- 1. Ostrom QT, Patil N, Cioffi G, et al. CBTRUS statistical report: Primary brain and other central nervous system tumors diagnosed in the United States in 2013-2017. Neuro Oncol. 2020;22(12 suppl 2):iv1–iv96. [DOI] [PMC free article] [PubMed] [Google Scholar]
- 2. Ceccarelli M, Barthel FP, Malta TM, et al. ; TCGA Research Network. Molecular profiling reveals biologically discrete subsets and pathways of progression in diffuse glioma. Cell. 2016;164(3):550–563. [DOI] [PMC free article] [PubMed] [Google Scholar]
- 3. Cavalli FMG, Remke M, Rampasek L, et al. Intertumoral heterogeneity within medulloblastoma subgroups. Cancer Cell. 2017;31(6):737–754.e6. [DOI] [PMC free article] [PubMed] [Google Scholar]
- 4. Northcott PA, Buchhalter I, Morrissy AS, et al. The whole-genome landscape of medulloblastoma subtypes. Nature. 2017;547(7663):311–317. [DOI] [PMC free article] [PubMed] [Google Scholar]
- 5. Sharma T, Schwalbe EC, Williamson D, et al. Second-generation molecular subgrouping of medulloblastoma: An international meta-analysis of Group 3 and Group 4 subtypes. Acta Neuropathol (Berl). 2019;138(2):309–326. [DOI] [PMC free article] [PubMed] [Google Scholar]
- 6. Li X, Oghi KA, Zhang J, et al. Eya protein phosphatase activity regulates Six1-Dach-Eya transcriptional effects in mammalian organogenesis. Nature. 2003;426(6964):247–254. [DOI] [PubMed] [Google Scholar]
- 7. Eisner A, Pazyra-Murphy MF, Durresi E, et al. The Eya1 phosphatase promotes Shh signaling during hindbrain development and oncogenesis. Dev Cell. 2015;33(1):22–35. [DOI] [PMC free article] [PubMed] [Google Scholar]
- 8. Ohto H, Kamada S, Tago K, et al. Cooperation of six and eya in activation of their target genes through nuclear translocation of Eya. Mol Cell Biol. 1999;19(10):6815–6824. [DOI] [PMC free article] [PubMed] [Google Scholar]
- 9. Li Z, Qiu R, Qiu X, Tian T.. EYA2 promotes lung cancer cell proliferation by downregulating the expression of PTEN. Oncotarget 2017;8(67):110837–110848. [DOI] [PMC free article] [PubMed] [Google Scholar]
- 10. Pandey RN, Rani R, Yeo E-J, et al. The eyes absent phosphatase-transactivator proteins promote proliferation, transformation, migration, and invasion of tumor cells. Oncogene. 2010;29(25):3715–3722. [DOI] [PMC free article] [PubMed] [Google Scholar]
- 11. Cook PJ, Ju BG, Telese F, et al. Tyrosine dephosphorylation of H2AX modulates apoptosis and survival decisions. Nature. 2009;458(7238):591–596. [DOI] [PMC free article] [PubMed] [Google Scholar]
- 12. Krishnan N, Jeong DG, Jung S-K, et al. Dephosphorylation of the C-terminal Tyrosyl Residue of the DNA Damage-related Histone H2A.X is mediated by the protein phosphatase eyes absent. J Biol Chem. 2009;284(24):16066–16070. [DOI] [PMC free article] [PubMed] [Google Scholar]
- 13. Yuan B, Cheng L, Chiang H-C, et al. A phosphotyrosine switch determines the antitumor activity of ERβ. J Clin Invest. 2014;124(8):3378–3390. [DOI] [PMC free article] [PubMed] [Google Scholar]
- 14. Merk DJ, Zhou P, Cohen SM, et al. The eya1 phosphatase mediates shh-driven symmetric cell division of cerebellar granule cell precursors. Dev Neurosci. 2020;42(5-6):170–186. [DOI] [PMC free article] [PubMed] [Google Scholar]
- 15. Wu K, Li Z, Cai S, et al. EYA1 phosphatase function is essential to drive breast cancer cell proliferation through cyclin D1. Cancer Res. 2013;73(14):4488–4499. [DOI] [PMC free article] [PubMed] [Google Scholar]
- 16. Zhang L, et al. Eya3 partners with PP2A to induce c-Myc stabilization and tumor progression. Nat Commun. 2018;9(1047). [DOI] [PMC free article] [PubMed] [Google Scholar]
- 17. Farabaugh SM, Micalizzi DS, Jedlicka P, Zhao R, Ford HL.. Eya2 is required to mediate the pro-metastatic functions of Six1 via the induction of TGF-β signaling, epithelial-mesenchymal transition, and cancer stem cell properties. Oncogene. 2012;31(5):552–562. [DOI] [PMC free article] [PubMed] [Google Scholar]
- 18. Zhang G, Dong Z, Gimple RC, et al. Targeting EYA2 tyrosine phosphatase activity in glioblastoma stem cells induces mitotic catastrophe. J Exp Med. 2021;218(11):e20202669. [DOI] [PMC free article] [PubMed] [Google Scholar]
- 19. Li J, Rodriguez Y, Cheng C, et al. EYA1’s conformation specificity in dephosphorylating phosphothreonine in myc and its activity on myc stabilization in breast cancer. Mol Cell Biol. 2016;37(1):e00499–e00416. [DOI] [PMC free article] [PubMed] [Google Scholar]
- 20. Krueger AB, Drasin DJ, Lea WA, et al. Allosteric inhibitors of the Eya2 phosphatase are selective and inhibit Eya2-mediated cell migration. J Biol Chem. 2014;289(23):16349–16361. [DOI] [PMC free article] [PubMed] [Google Scholar]
- 21. Anantharajan J, Zhou H, Zhang L, et al. Structural and functional analyses of an allosteric eya2 phosphatase inhibitor that has on-target effects in human lung cancer cells. Mol Cancer Ther. 2019;18(9):1484–1496. [DOI] [PMC free article] [PubMed] [Google Scholar]
- 22. Anantharajan J, Baburajendran N, Lin G, et al. Structure-activity relationship studies of allosteric inhibitors of EYA2 tyrosine phosphatase. Protein Sci Publ Protein Soc. 2022;31(2):422–431. [DOI] [PMC free article] [PubMed] [Google Scholar]
- 23. Krueger AB, Dehdashti SJ, Southall N, et al. Identification of a selective small-molecule inhibitor series targeting the eyes absent 2 (Eya2) phosphatase activity. J Biomol Screen. 2013;18(1):85–96. [DOI] [PMC free article] [PubMed] [Google Scholar]
- 24. Zimmerman JE, Bui QT, Steingrímsson E, et al. Cloning and characterization of two vertebrate homologs of the Drosophila eyes absent gene. Genome Res. 1997;7(2):128–141. [DOI] [PubMed] [Google Scholar]
- 25. Donson AM, Apps J, Griesinger AM, et al. Molecular analyses reveal inflammatory mediators in the solid component and cyst fluid of human adamantinomatous craniopharyngioma. J Neuropathol Exp Neurol. 2017;76(9):779–788. [DOI] [PMC free article] [PubMed] [Google Scholar]
- 26. Weishaupt H, Johansson P, Sundström A, et al. Batch-normalization of cerebellar and medulloblastoma gene expression datasets utilizing empirically defined negative control genes. Bioinforma Oxf Engl. 2019;35(18):3357–3364. [DOI] [PMC free article] [PubMed] [Google Scholar]
- 27. Northcott PA, Shih DJH, Peacock J, et al. Subgroup-specific structural variation across 1,000 medulloblastoma genomes. Nature. 2012;488(7409):49–56. [DOI] [PMC free article] [PubMed] [Google Scholar]
- 28. Ivanov DP, Coyle B, Walker DA, Grabowska AM.. In vitro models of medulloblastoma: Choosing the right tool for the job. J Biotechnol. 2016;236:10–25. [DOI] [PubMed] [Google Scholar]
- 29. Arnold HK, Sears RC.. Protein phosphatase 2a regulatory subunit b56α associates with c-myc and negatively regulates c-Myc accumulation. Mol Cell Biol. 2006;26(7):2832–2844. [DOI] [PMC free article] [PubMed] [Google Scholar]
- 30. Yeh E, Cunningham M, Arnold H, et al. A signalling pathway controlling c-Myc degradation that impacts oncogenic transformation of human cells. Nat Cell Biol. 2004;6(4):308–318. [DOI] [PubMed] [Google Scholar]
- 31. Bandopadhayay P, Bergthold G, Nguyen B, et al. BET bromodomain inhibition of MYC-amplified medulloblastoma. Clin Cancer Res. 2014;20(4):912–925. [DOI] [PMC free article] [PubMed] [Google Scholar]
- 32. Venataraman S, et al. Inhibition of BRD4 attenuates tumor cell self-renewal and suppresses stem cell signaling in MYC driven medulloblastoma. Oncotarget 2014;5(9):2355–2371. [DOI] [PMC free article] [PubMed] [Google Scholar]
- 33. Tate MC, Shear DA, Hoffman SW, Stein DG, LaPlaca MC.. Biocompatibility of methylcellulose-based constructs designed for intracerebral gelation following experimental traumatic brain injury. Biomaterials. 2001;22(10):1113–1123. [DOI] [PubMed] [Google Scholar]
- 34. Leone G, Sears R, Huang E, et al. Myc requires distinct E2F activities to induce S phase and apoptosis. Mol Cell. 2001;8(1):105–113. [DOI] [PubMed] [Google Scholar]
- 35. Sheen J-H, Woo J-K, Dickson RB.. c-Myc alters the DNA damage-induced G2/M arrest in human mammary epithelial cells. Br J Cancer. 2003;89(8):1479–1485. [DOI] [PMC free article] [PubMed] [Google Scholar]
- 36. Yang Y, Xue K, Li Z, et al. c-Myc regulates the CDK1/cyclin B1 dependent‑G2/M cell cycle progression by histone H4 acetylation in Raji cells. Int J Mol Med. 2018;41(6):3366–3378. [DOI] [PMC free article] [PubMed] [Google Scholar]
- 37. Blevins MA, Towers CG, Patrick AN, Zhao R, Ford HL.. The SIX1-EYA transcriptional complex as a therapeutic target in cancer. Expert Opin Ther Targets. 2015;19(2):213–225. [DOI] [PMC free article] [PubMed] [Google Scholar]
- 38. Aldosari, N., et al. Comprehensive molecular cytogenetic investigation of chromosomal abnormalities in human medulloblastoma cell lines and xenograft. Neuro Oncol. 2002;4, 75–85. [DOI] [PMC free article] [PubMed] [Google Scholar]
- 39. Bigner SH, Friedman HS, Vogelstein B, Oakes WJ, Bigner DD.. Amplification of the c-myc gene in human medulloblastoma cell lines and xenografts. Cancer Res. 1990;50(8):2347–2350. [PubMed] [Google Scholar]
- 40. Wong KF, Siu LLP, Wong WS.. Double minutes and MYC amplification: A combined may-grünwald giemsa and fluorescence in situ hybridization study. Am J Clin Pathol. 2014;141(2):280–284. [DOI] [PubMed] [Google Scholar]
- 41. Alseraye F, Padmore R, Wozniak M, McGowan-Jordan J.. MYC gene amplification in double minute chromosomes in an aggressive large B-cell lymphoma with leukemic presentation: a case report. Cancer Genet Cytogenet. 2009;192(2):76–78. [DOI] [PubMed] [Google Scholar]
- 42. De Braganca KC, Packer RJ.. Treatment options for medulloblastoma and CNS primitive neuroectodermal tumor (PNET). Curr Treat Options Neurol. 2013;15(5):593–606. [DOI] [PMC free article] [PubMed] [Google Scholar]
- 43. Leary SES, Packer RJ, Li Y, et al. Efficacy of carboplatin and isotretinoin in children with high-risk medulloblastoma: A randomized clinical trial from the children’s oncology group. JAMA Oncol. 2021;7(9):1313–1321. [DOI] [PMC free article] [PubMed] [Google Scholar]
- 44. Veo B, Danis E, Pierce A, et al. Transcriptional control of DNA repair networks by CDK7 regulates sensitivity to radiation in MYC-driven medulloblastoma. Cell Rep. 2021;35(4):109013. [DOI] [PMC free article] [PubMed] [Google Scholar]
- 45. Hanaford AR, Archer TC, Price A, et al. DiSCoVERing innovative therapies for rare tumors: combining genetically accurate disease models with in silico analysis to identify novel therapeutic targets. Clin Cancer Res. 2016;22(15):3903–3914. [DOI] [PMC free article] [PubMed] [Google Scholar]
- 46. Sun Y, Han J, Wang Z, et al. Safety and efficacy of bromodomain and extra-terminal inhibitors for the treatment of hematological malignancies and solid tumors: A systematic study of clinical trials. Front Pharmacol. 2021;11. [DOI] [PMC free article] [PubMed] [Google Scholar]
- 47. Shen JZ, Qiu Z, Wu Q, et al. A FBXO7/EYA2-SCFFBXW7 axis promotes AXL-mediated maintenance of mesenchymal and immune evasion phenotypes of cancer cells. Mol Cell. 2022;82(6):1123–1139.e8. [DOI] [PMC free article] [PubMed] [Google Scholar] [Retracted]
- 48. Ionescu AE, Mentel M, Munteanu CVA, et al. Analysis of EYA3 phosphorylation by src kinase identifies residues involved in cell proliferation. Int J Mol Sci . 2019;20(24):6307. [DOI] [PMC free article] [PubMed] [Google Scholar]
- 49. Mentel M, Ionescu AE, Puscalau-Girtu I, et al. WDR1 is a novel EYA3 substrate and its dephosphorylation induces modifications of the cellular actin cytoskeleton. Sci Rep. 2018;8(1):2910. [DOI] [PMC free article] [PubMed] [Google Scholar]
- 50. Xiong W, Dabbouseh NM, Rebay I.. Interactions with the abelson tyrosine kinase reveal compartmentalization of eyes absent function between nucleus and cytoplasm. Dev Cell. 2009;16(2):271–279. [DOI] [PMC free article] [PubMed] [Google Scholar]
- 51. Patrick AN, Cabrera JH, Smith AL, et al. Structure-function analyses of the human SIX1-EYA2 complex reveal insights into metastasis and BOR syndrome. Nat Struct Mol Biol. 2013;20(4):447–453. [DOI] [PMC free article] [PubMed] [Google Scholar]
Associated Data
This section collects any data citations, data availability statements, or supplementary materials included in this article.