

Abstract
Background
High-grade adult-type diffuse gliomas (HGGs) constitute a heterogeneous group of aggressive tumors that are mostly incurable. Recent advances highlighting the contribution of ribosomes to cancer development have offered new clinical perspectives. Here, we uncovered that isocitrate dehydrogenase (IDH)wt and IDHmut HGGs display distinct alterations of ribosome biology, in terms of rRNA epitranscriptomics and ribosome biogenesis, which could constitute novel hallmarks that can be exploited for the management of these pathologies.
Methods
We analyzed (1) the ribosomal RNA 2’O-ribose methylation (rRNA 2’Ome) using RiboMethSeq and in-house developed bioinformatics tools (https://github.com/RibosomeCRCL/ribomethseq-nfandrRMSAnalyzer) on 3 independent cohorts compiling 71 HGGs (IDHwt n = 30, IDHmut n = 41) and 9 non-neoplastic samples, (2) the expression of ribosome biogenesis factors using medium throughput RT-qPCR as a readout of ribosome biogenesis, and (3) the sensitivity of 5 HGG cell lines to RNA Pol I inhibitors (CX5461, BMH-21).
Results
Unsupervised analysis demonstrated that HGGs could be distinguished based on their rRNA 2’Ome epitranscriptomic profile, with IDHwt glioblastomas displaying the most significant alterations of rRNA 2’Ome at specific sites. In contrast, IDHmut HGGs are largely characterized by an overexpression of ribosome biogenesis factors compared to non-neoplastic tissues or IDHwt glioblastomas. Finally, IDHmut HGG-derived spheroids display higher cytotoxicity to CX5461 than IDHwt glioblastoma, while all HGG spheroids display a similar cytotoxicity to BMH-21.
Conclusions
In HGGs, IDH mutational status is associated with specific alterations of the ribosome biology and with distinct sensitivities to RNA Pol I inhibitors.
Keywords: epitranscriptomics, glioma, IDH mutational status, ribosome, ribosome biogenesis factors
Key Points.
rRNA 2’Ome profiling distinguishes isocitrate dehydrogenase (IDH)wt and IDHmut adult-type diffuse gliomas.
Elevated expression of ribosome biogenesis factors is correlated with IDH mutational status.
• High-grade adult-type diffuse gliomas differentially respond to the RNA Pol I inhibitors BMH-21 and CX5461.
Importance of the Study.
Consistent multi-omics studies have shown that high-grade adult-type diffuse gliomas (HGGs) can be classified into 3 main groups, ie, isocitrate dehydrogenase (IDH)mut and 1p/19q codeleted oligodendrogliomas, IDHmut astrocytomas and IDHwt glioblastomas, based on their genetic, transcriptomic and DNA methylation profiles. Recent advances have highlighted the contribution of ribosomes to cancer development and have offered new clinical perspectives. Herein, we show that ribosomal RNA (rRNA) epitranscriptomic and ribosome biogenesis are different in distinct HGG types. We uncovered that IDHwt glioblastomas display the most prominent defects in rRNA epitranscriptomics, whereas IDHmut astrocytomas and oligodendrogliomas exhibit enhanced expression of ribosome biogenesis factors compared to IDHwt glioblastomas. Moreover, based on their IDH mutational status, HGG-derived cell lines displayed distinct responses to CX5461 and BMH-21, 2 clinically evaluated inhibitors of the RNA Pol I that transcribes rDNAs. This study identifies a connection between HGG oncogenesis and the ribosome biology, and highlights new therapeutic strategies.
High-grade adult-type diffuse gliomas (HGGs) are brain tumors resembling glial cells that display highly heterogeneous prognoses and treatment responses. HGGs comprise 3 main histomolecular types, astrocytomas, oligodendrogliomas, and glioblastomas, based notably on the mutational status of isocitrate dehydrogenase (IDH) 1 and 2.1,2 Indeed, glioblastomas are IDHwt, whereas astrocytomas and oligodendrogliomas are IDHmut, and can be further discriminated by the heterozygous 1p19q co-deletion occurring in oligodendrogliomas. IDHwt and IDHmut HGGs are associated with distinct epigenetic and transcriptomic dysregulations, leading to cancer-specific features. Thus, despite important advances in their histomolecular classification and understanding of their oncogenesis, HGGs remain mostly incurable. For instance, grade 4 IDHwt glioblastoma patients treated with the conventional combination of surgery, radiotherapy, and temozolomide (TMZ) chemotherapy, display a median survival of only 15 months. Grade 3 IDHmut astrocytoma and oligodendroglioma patients treated with radiotherapy and chemotherapy exhibit a much better outcome with a median survival of 10 and 15 years, respectively, nevertheless 20% to 30% of the patients die within the first 5 years after diagnosis.3,4 Therefore, the identification of novel molecular mechanisms dysregulated in distinct HGG histomolecular types may significantly improve current therapeutic options.
Several studies highlighted that ribosome biogenesis (RiBi) and functions are altered in cancer cells and that ribosomes can support oncogenic functions.5 For instance, the c-MYC oncogenic activity is in part supported by a dysregulation of genes implicated in RiBi and global protein synthesis.6 In addition, levels of RiBi are generally increased in cancer cells to support the high protein synthesis demand caused by their exacerbated proliferation rate7,8 and therefore, the inhibition of rRNA synthesis specifically kills cancer cells without affecting normal cells.9,10 Such observations led to the development of molecules specifically inhibiting RiBi that showed objective responses in clinical trials, such as CX5461.11–13
In addition to alteration of RiBi, recent observations suggest that variations of ribosome composition could also occur in cancer and be involved in disease etiology.14–16 The ribosome is composed of 80 ribosomal proteins and 4 ribosomal RNAs (rRNAs), the latter supporting the enzymatic activity of the peptidyl-bond formation during the translation of mRNAs into proteins. For many decades, the ribosome was considered as a monolithic entity displaying a similar composition in all cells constituting an organism. However, it appears now that the ribosome composition can display some degree of variations, both at the level of ribosomal proteins and rRNA chemical modifications, which contributes to modulate intrinsic translational activities that could shape particular phenotypes.17,18 Variations of the ribosome composition at ribosomal protein levels have been reported in HGGs.19–22 In IDHwt glioblastomas, the overexpression of the ribosomal protein RPS6 was shown to promote acquisition of glioma stem cell properties, a hallmark of the most aggressive IDHwt glioblastomas.20–22 In addition, RPL22L1 isoforms are expressed in distinct regions of IDHwt glioblastomas through alternative splicing and induce the production of ribosomes with specific compositions, which promote translational bias towards specific mRNA subsets.15,19,23–30 In addition to ribosomal proteins, the chemical modifications of rRNA represent one of the major contributors to ribosome heterogeneity and led to the emergence of the notion of rRNA epitranscriptomics.15 One of the main modifications, the methylation of the rRNA 2’O-ribose (rRNA 2’Ome), occurs at 106 known rRNA sites in humans and the 2’Ome at specific positions are essential for rRNA activity. The catalysis of rRNA 2’Ome is performed by an rRNA methylation complex composed of the methyl-transferase fibrillarin (FBL) and a single non-coding C/D box small nucleolar RNA (snoRNA or snoRD), which guides FBL at specific sites by base-pairing.15 Hence, modulations of FBL or snoRD expression are sufficient to affect rRNA 2’Ome.23,24,26 Interestingly, alterations of 2’Ome have been observed in cancer and we recently demonstrated by profiling 195 primary mammary tumors using the RiboMethSeq approach, that only 40% of the known 2’O-methylated sites are altered, suggesting that only few rRNA sites can tolerate a lack of 2’Ome. Moreover, rRNA 2’Ome alterations are not random since rRNA 2’Ome profiles were associated with breast cancer subtypes and tumor grades.25 Similarly, alterations of rRNA 2’Ome were described in a cohort of 17 diffuse large B-cell lymphoma samples27 and of 94 acute myeloid leukemia samples.28 Importantly, alterations of rRNA 2’Ome at some specific sites can affect both the translation of particular mRNA subsets and cell proliferation15,23,24,26,29,30. To date, whether alterations of rRNA epitranscriptomics occur in gliomas and contribute to disease etiology remains unexplored. Here, we investigated whether IDHwt and IDHmut HGGs display alterations in ribosome biology, in terms of rRNA epitranscriptomics and ribosome biogenesis, to exploit these features as novel therapeutic targets of these diseases.
Materials and methods
Human Grade 3–4 Adult-Type Diffuse Glioma and Non-neoplastic Samples
Three cohorts were built: A technical cohort (8 grade 4 IDHwt glioblastomas, 3 non-tumoral samples); a test cohort detailed in Table 1 (13 IDHwt glioblastomas, 13 IDHmut astrocytomas, 14 IDHmut and 1p/19q codeleted oligodendrogliomas, 6 non-tumoral samples); a validation cohort (9 IDHwt glioblastomas, 6 IDHmut astrocytomas, 8 IDHmut and 1p/19q codeleted oligodendrogliomas). The percentage of tumoral cells was estimated by a neuropathologist as described in Supplementary Figure S1. Additional details are provided in Supplementary Information.
Table 1.
Clinical Characteristics of Patients With High-Grade Primary Diffuse Gliomas Constituting the Test Cohort
| Glioblastoma | Astrocytoma Grade 3/4 | Oligodendroglioma Grade 3 | |
|---|---|---|---|
| (n = 13) | (n = 13) | (n = 14) | |
| Age (years) mean [min–max] |
60 [52–73] | 36 [25–52] | 53 [35–66] |
| Gender | |||
| Female | 4 (31%) | 4 (31%) | 5 (36%) |
| Male | 9 (69%) | 9 (69%) | 9 (64%) |
| Tumor location | |||
| Temporal | 3 (23.1%) | 3 (23.1%) | 2 (14.3%) |
| Frontal | 7 (53.8 %) | 10 (76.9%) | 12 (85.7%) |
| Occipital | 1 (7.7%) | 0 (0%) | 0 (0%) |
| Parietal | 2 (15.4%) | 0 (0%) | 0 (0%) |
| Genetic alteration | |||
| mutation IDH1/2 | 0 (0%) | 13 (100%) | 14 (100%) |
| del 1p/19q | 0 (0%) | 0 (0%) | 14 (100%) |
| ATRX- | NA | 12 (92.3%) | 0 (0%) |
| Progression | |||
| Yes | 12 (92.3%) | 5 (38.5%) | 3 (21.4%) |
| No | 0 (0%) | 8 (61.5%) | 11 (78.6%) |
| NA | 1 (7.7%) | 0 (0%) | 0 (0%) |
| Tumor cells (%) mean [min–max] |
55 [30–85] | 38 [20–60] | 40 [20–70] |
Cell Culture
Human IDHwt glioblastoma (5706, N131520), IDHmut astrocytoma (LGG85), and IDHmut and 1p/19q codeleted oligodendroglioma (BT138, BT237) cells were cultured as spheres as described in Supplementary Information.
Reverse Transcription and Real-Time Quantitative PCR
cDNA synthesis was performed using the Prime Script RT Reagent kit (Takara). Medium throughput qPCR was performed using the Biomark HD system (Fluidigm) as previously described31 (Supplementary Table S1). The median Ct value of 5 housekeeping mRNAs was used for normalization.
RiboMethSeq
RiboMethseq was performed as previously described using the Illumina sequencing technology.25,32 To process the sequencing data, a novel nextflow pipeline RiboMethSeq-nf was developed and is currently available (https://github.com/RibosomeCRCL/ribomethseq-nf). This pipeline processes sequencing data as previously described.25,32,33 To calculate the C-score, which reflects the rRNA 2’Ome level, the novel R package rRMSAnalyzer was developed (https://github.com/RibosomeCRCL/rRMSAnalyzer). The identification of significant alterations in rRNA 2’Ome levels between groups was performed by applying 2 consecutive thresholds: The adjusted P-value < .05 (Kruskal–Wallis with FDR adjustment); and the mean ∆C-score (ie, difference between the highest and lowest mean C-score of the groups of interest) >.05.
IC50 assay
3.103 cell spheroids were treated with CX5461 (Sigma-Aldrich)34 or BMH-21 (Sigma-Aldrich).10 Cell cytotoxicity was assessed by CellTox Green Cytotoxicity Assay (Promega) and by CellTiter-Glo3D luminescent cell viability assay (Promega). Cell viability was expressed as a percentage of the signal intensity normalized against DMSO (1%).
Results
A Standardized Approach for Large-Scale Analyses of Human Samples Using RiboMethSeq
Before investigating alterations of rRNA 2’Ome in the 3 main histomolecular HGGs, we first optimized the recently described RiboMethSeq approach25,32,35 to determine reliable quantifications of 2’Ome levels at 106 rRNA sites from patient tumor samples. First, based on the technical cohort (n = 11) of IDHwt glioblastomas and non-neoplastic tissues, we observed that the C-score, which reflects rRNA 2’Ome levels at specific sites, was similar using either a manual or an automated RNA extraction protocol (Supplementary Figure S2). Second, we used the NovaSeq Illumina sequencing platform (up to 10 billion reads) to increase the total number of useful reads (Supplementary Figure S3A) and the number of samples sequenced in a single flowcell.
We then randomly separated RNA samples of the test cohort and prepared 2 independent libraries of 23 samples (40 HGGs and 6 non-neoplastic samples), each library also contained a commercially available “reference” total RNA. Unsupervised analysis of the entire test cohort using principal component analysis (PCA) based on C-scores of either all rRNA positions (7055 sites) or the 106 positions corresponding to known rRNA 2’Ome sites, clearly distinguished samples depending on the library of origin, as illustrated by the lack of clustering of reference RNA (Supplementary Figure S3B, left panels). We evaluated the adjustment of RiboMethSeq data using the ComBat-seq algorithm, one of the most routinely used tools to adjust RNA-seq data.36 Upon ComBat-seq adjustment, no distinction between samples based on their library of origin was observed in C-scores, including for the 2 reference RNA (Supplementary Figure S3B, right panels). These data demonstrate the efficacy of the ComBat-seq algorithm at removing the batch effect from RiboMethSeq data.
Based on these results, we developed bioinformatics tools to perform reproducible analyses of RiboMethSeq data arising from large-scale cohorts (https://github.com/RibosomeCRCL).
rRNA 2’Ome Profiles Discriminate IDHwt From IDHmut Adult-Type Diffuse Gliomas
Using the optimized approach selected above, we then investigated whether alterations of rRNA 2’Ome differentially occur in the 3 main histomolecular HGGs using the test cohort: IDHwt glioblastoma (G, n = 13), IDHmut astrocytoma (A, n = 13), IDHmut and 1p19q codeleted oligodendroglioma (O, n = 14) and non-neoplastic cerebral cortex (NT, n = 6) (Table 1). Using unsupervised hierarchical clustering analysis, we first evaluated rRNA 2’Ome levels at the 106 known sites in the 46 non-neoplastic and glioma samples (Figure 1). The C-score reflects the rRNA 2’Ome levels as it corresponds to the ratio of the 5’ read-end counts at a nucleotide position to the local 5’ read-end count coverage; and when close to 1, C-score indicates that all rRNA molecules of the sample are 2’O-methylated at this specific site; whereas a C-score below 0.9 reflects a mix of 2’O-unmethylated and 2’O-methylated rRNA molecules. Here, most rRNA 2’Ome sites had a score close to 1, albeit some sites were below 0.9, substantiating recent results in human samples from diffuse large B-cell lymphoma, acute myeloid leukemia, and breast cancer.25,27,28 These data further confirmed observations by us and others that some rRNA molecules exist without 2’Ome at some specific sites, including in non-neoplastic tissue.
Figure 1.
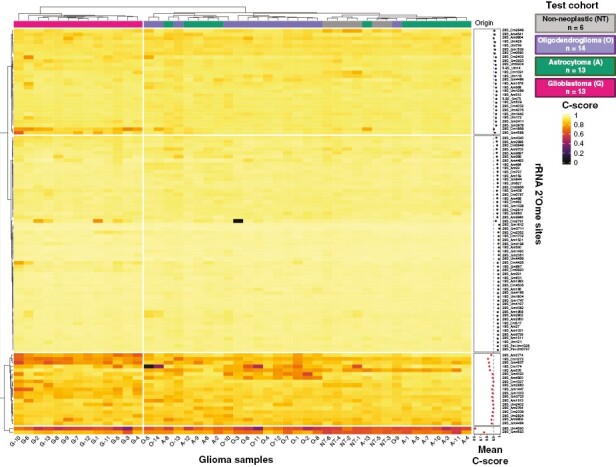
rRNA 2’Ome levels vary in high-grade adult-type diffuse gliomas. An unsupervised hierarchical clustering of C-scores at the 106 known rRNA 2’O-ribose methylated (2’Ome) sites was performed in a test cohort of 40 high-grade (3–4) adult-type diffuse glioma (HGG) samples and 6 non-tumoral, non-neoplastic cerebral cortex (NT) samples. C-scores are represented by a color scale from 0 (black) to 1 (yellow). IDHwt glioblastomas (G), high-grade astrocytomas (A), high-grade oligodendrogliomas (O) and non-neoplastic (NT) samples are depicted in pink, green, purple, and gray, respectively. The mean C-score for each site across the 46 samples is shown on the right-hand side of the graph. 86 sites have a mean C-score higher than 0.9 (black) and 20 sites lower than 0.9 (red).
Interestingly, all IDHwt glioblastoma samples formed a separate branch (left-hand side of the hierarchical clustering analysis dendrogram), suggesting that their rRNA 2’Ome profile was clearly different from IDHmut astrocytoma and oligodendroglioma, as well as from non-neoplastic tissue (Figure 1). PCAs based on the rRNA 2’Ome profile indicated that the PC2 axis (variance = 14.1%) strongly differentiated glioblastomas from other samples (Supplementary Figure S4A). To ensure consistency between the results of our classification and the expected outcome of the patients, we correlated PCA axes with survivals and mitotic index, as an internal control of tumor sample classification. Consistent with the known differences regarding glioblastomas and IDHmt HGGs characteristics, PC2 was significantly correlated with the IDH1/2 mutational status, the mitotic index, overall survival (OS), and progression-free survival (PFS) (Supplementary Figure S4B-D). To validate these observations, we analyzed rRNA 2’Ome levels using RiboMethSeq on the technical cohort, corresponding to an independent cohort composed of 8 IDHwt glioblastomas and 3 non-neoplastic tissues. Unsupervised PCA based on the rRNA 2’Ome profile showed that IDHwt glioblastomas could once again be clearly separated from non-neoplastic tissues (Supplementary Figure S4E). Altogether, our data revealed that rRNA 2’Ome levels vary in HGGs as well as in non-neoplastic cerebral cortex, and that rRNA 2’Ome profiles discriminate IDHwt glioblastomas not only from non-neoplastic tissues but also from IDHmut HGG types.
Most Variable rRNA 2’Ome Sites are Sufficient to Discriminate IDHwt Glioblastoma From IDHmut Adult-Type Diffuse Gliomas
To better characterize differences in rRNA 2’Ome profiles between histomolecular HGG types, we then focused on the most variable rRNA 2’Ome sites. To identify such sites, we compared the variability of C-scores at each single site among all HGG samples of the test cohort (n = 40) using the distribution of the inter-quartile range. A set of 19 sites showed an inter-quartile range higher than median + 2 × median absolute deviation (mad) and were considered as the most variable rRNA 2’Ome sites among HGGs (red, Figure 2A), in agreement with our recent findings that only a subset of rRNA sites displays variability in 2’Ome levels.25 Interestingly, PCAs indicated that rRNA 2’Ome profiles based on this set of 19 sites are sufficient to discriminate IDHwt glioblastomas, IDHmut astrocytoma, and oligodendrogliomas (Figure 2B).
Figure 2.

The most variable rRNA 2’Ome sites are sufficient to distinguish different HGG types. (A) Distribution of the inter-quartile range (IQR) of the C-score to determine the C-score variability across HGG samples of the test cohort (n = 40). rRNA 2’Ome sites are ranked by increasing IQR value. The IQR distribution curve is plotted at the right-hand side of the graph. The “most variable sites” correspond to those with an IQR higher than median + 2 × median absolute deviation (mad) and were colored in red (19 sites). (B–D) Unsupervised Principal Component Analysis (PCA) based on C-scores of the 19 most variable sites as identified in (A). Independent PCA was performed on IDHwt glioblastoma (G, pink circle), high-grade astrocytoma (A, green triangle), and high-grade oligodendroglioma (O, purple diamond) samples of both test (B, n = 40) and validation (n = 23) cohorts. Validation cohort samples were projected on PCA of the test cohort (D). Percentage of variance explained by PC1 and PC2 are indicated. 95 % confidence ellipsoids around the centroid of each group (larger pink circle, green triangle, and purple diamond) are indicated.
To validate these observations, we used a second, independent validation cohort of 23 HGG samples (9 IDHwt glioblastomas, 6 IDHmut astrocytomas, and 8 IDHmut, 1p/19q codeleted oligodendrogliomas) (Supplementary Figure S1B). We performed an unsupervised analysis using the 19 most variable rRNA 2’Ome sites identified using the test cohort (Figure 2A). As for the test cohort, unsupervised analyses of the validation cohort distinguished the 3 histomolecular subtypes of HGGs (Figure 2C). In addition, the projection of the validation cohort samples onto the PCA constructed from the test cohort enabled us to identify the histomolecular subtypes of each sample, suggesting that de novo profiling of rRNA 2’Ome could help in the classification of HGGs (Figure 2D). In addition, comparison of test and validation cohorts in term of percentage of tumor cells suggests that the tumor heterogeneity did not affect our conclusions (Supplementary Figure S1B). Indeed, in the validation cohort, the mean percentage of tumor cells is significantly lower in astrocytomas (38%) compared to oligodendrogliomas (69%), while no difference was observed with glioblastomas (9%) (Kruskal–Wallis: P = .045*; Mann–Whitney: A vs. O P = .024*). In contrast, in the test cohort, the mean percentage of tumor cells is significantly lower in astrocytomas (38%) and oligodendrogliomas (39%) compared to glioblastomas (55%) (Kruskal–Wallis: P = .034*; Mann–Whitney: A vs. G P = .0172*; O vs. G P = .0348*).
These data further emphasize the specificity of IDHwt glioblastoma rRNA 2’Ome profiles compared to IDHmut HGGs and suggest that IDHwt glioblastomas display strong alterations of rRNA 2’Ome levels at some specific sites.
Glioblastomas Display the Most Frequent Site-Specific rRNA 2’Ome Alterations
To identify rRNA sites whose 2’Ome levels significantly differed between HGG histomolecular types and non-neoplastic tissues, we performed a systematic analysis of each of the 106 rRNA 2’Ome sites using the test cohort and applied 2 consecutive thresholds, a Kruskal–Wallis test with adjusted P-values <.05 and a cutoff value for mean ΔC-scoresmax-min > 0.05. From this screen, only 16 rRNA 2’Ome sites displayed a significant variation in their level of methylation in at least one HGG or non-neoplastic tissue (Figure 3). Pairwise comparisons for these 16 sites revealed that 4 and 6 sites displayed significant alterations in 2’Ome levels in high-grade astrocytomas and high-grade oligodendrogliomas, respectively, compared to non-neoplastic tissues (Figure 3B). In addition, rRNA 2’Ome levels appeared to be significantly increased on 6 sites in high-grade astrocytomas compared to high-grade oligodendrogliomas. Similar alterations in rRNA 2’Ome levels between IDHwt and IDHmut tumors were observed using the validation cohort (Supplementary Figure S5A). Finally, the main differences could be attributed to glioblastomas that displayed 12 and 14 of the 16 rRNA sites significantly altered compared to non-neoplastic samples or high-grade astrocytoma and oligodendrogliomas, respectively. Strikingly, rRNA 2’Ome levels were mostly lower in glioblastomas compared to non-neoplastic tissues, high-grade astrocytoma, or high-grade oligodendrogliomas (Figure 3A). The same overall decrease in rRNA 2’Ome levels was confirmed in glioblastoma compared to non-neoplastic tissues using the technical cohort (Supplementary Figure S5B). Altogether, these results indicate that 2’Ome levels are altered at specific rRNA sites in HGGs, while glioblastomas display the highest frequency of alterations in rRNA 2’Ome levels compared to non-neoplastic cerebral cortex and other HGG histomolecular types.
Figure 3.
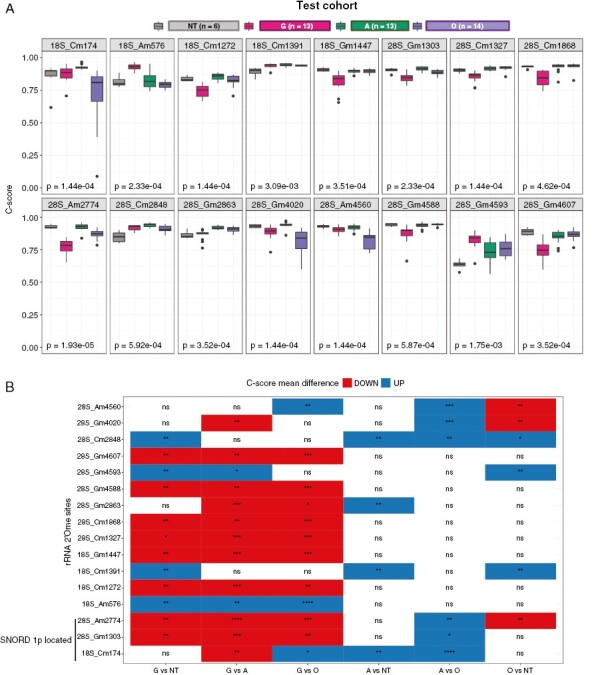
rRNA 2’Ome levels are differently altered in HGG types. (A) Box plots showing the distribution of C-score in HGG and non-neoplastic samples of the test cohort for 16 rRNA 2’O-ribose methylated (2’Ome) sites that exhibited both statistically and biologically significant alterations between groups. These sites were identified using both Kruskal–Wallis statistical tests (with an adjusted P-value threshold of <.05) and a mean ∆C-scoremax-min > .05 (absolute difference between the highest and lowest mean C-score). The adjusted P-values corresponding to the statistical tests are indicated on the bottom left-hand side of each panel and median C-scores are represented by a black line within the box plots. (B) Pairwise comparison of mean C-score groups for the 16 significantly deregulated rRNA 2’Ome sites in the test cohort. Positive (UP) and negative (DOWN) ∆C-scoregroup1-group2 are shown in blue and red, respectively. Adjusted P-values: *: P < .05; **: P < .01; ***: P < .001; ****: P < .0001; ns, not significant.
Changes in C/D Box snoRNA Expression Levels Only Partially Explain Alterations of rRNA 2’Ome Levels
To investigate the origin of alterations of rRNA 2’Ome in HGGs, we focused on the expression of C/D snoRNAs (snoRDs), which guide in a sequence-specific manner the methyl-transferase FBL toward the rRNA nucleotide to methylate. We thus examined the correlation between levels of rRNA 2’Ome and related snoRDs. It was reported that snoRNA expression levels can be inferred from RiboMethSeq data.37,38 Thus, we used RiboMethSeq raw data from the NovaSeq platform and applied an in-house pipeline to overcome limitations of snoRNA analysis by next-generation sequencing (see Supplementary methods).39,40 A strong and significant correlation (about 92%) between snoRNA levels either determined from RiboMethSeq or measured by RT-qPCR was observed in 9 glioma samples for 11 out of 12 selected snoRDs, thus validating our approach (Supplementary Figure S6A). Given that 2’Ome at a single rRNA site is catalyzed either by one or several snoRD,15,41 we restricted our analysis to the rRNA 2’Ome sites (n = 46) guided by a single snoRD. No significant correlation was observed between levels of rRNA 2’Ome and of corresponding snoRDs among 37 sites (Supplementary Figure S6B). In contrast, a significant albeit relatively low positive correlation was observed for 9 pairs of snoRD/rRNA sites, the best correlation being that of the 18S-Am576 site and its associated SNORD93 (padj = 9.10−6, r = 0.68) (Supplementary Figure S6B-C). Thus, alterations of rRNA 2’Ome levels cannot be exclusively attributed to changes in C/D box snoRNA expression levels.
The Expression Profile of Ribosome Biogenesis Factors Discriminates IDHmut and IDHwt HGGs
Since variations in snoRD expression levels cannot explain most of the changes observed in rRNA 2’Ome levels, we tested a novel hypothesis. Indeed, in cancer, variations of 2’Ome levels in rRNAs are believed to passively arise from the link between ribosome biogenesis (RiBi) and concomitant rRNA chemical modifications, whereby changes in ribosome synthesis impact the rate-limiting rRNA 2’Ome process and therefore influence 2’Ome profiles.15,25,27 Therefore, an overall decrease in rRNA 2’Ome levels observed in different cancer tissues may be caused by RiBi hyperactivation to sustain a high demand in protein synthesis necessary to support the highly proliferative cancer cells. As IDHwt glioblastomas possess a higher proliferative rate than IDHmut astrocytoma and oligodendrogliomas, including in our test cohort (based on the mitotic index) (Supplementary Figure S4C-D), we hypothesized that the decrease in rRNA 2’Ome levels at specific positions in IDHwt glioblastomas could be due to a rate-limiting 2’Ome process caused by an exacerbated RiBi.
To investigate RiBi dysregulations across HGGs, we initially applied a gold-standard approach by analyzing levels of the 47S rRNA precursor (pre-rRNA), using Northern blot (Supplementary Figure S7A). However, this approach using tumor samples was challenging, notably due to the need for a large quantity of biological materials. Nevertheless, in a panel of 9 analyzable samples, IDHmut astrocytoma, and oligodendrogliomas surprisingly seemed to express more pre-47S rRNAs than IDHwt glioblastomas. However, only 2 IDHwt glioblastoma samples were analyzed, therefore, preventing us to draw any conclusion. To bypass this technical issue, we then measured the expression of a set of 20 genes involved in the early RiBi stages (referred to as “RiBi-gene set”). To reflect as much as possible this multistep process involving more than 200 factors,7 we selected the RiBi-gene set implicated in the main RiBi process, including rRNA transcription (NCL, NPM, POLR1A, TAF1A, TAF1B, TAF1C, and UBTF), rRNA maturation (BOP1, PES1, and WDR12), snoRNA biogenesis (RUVBL1, PIDH1D1, and RUVBL2), and H/ACA (DKC1, GAR1, NHP2, and NOP10) and C/D box (NOP56, SNU13, and FBL) snoRNP complexes (Figure 4A). Of note, 3 genes (PIH1D1, RUVBL2, and FBL) are located on the long arm of chromosome 19 (19q), which undergoes a heterozygous deletion in high-grade oligodendrogliomas. A readout for RiBi at steady-state was determined by quantifying mRNA expression levels of these selected genes by medium-throughput RT-qPCR in our validation series. mRNA levels were normalized against the median mRNA expression of 5 housekeeping genes, which did not significantly vary among the 4 groups (Supplementary Figure S7B).
Figure 4.

Expression profiles of RiBi factors distinguish HGG types. (A) Panel of genes involved in ribosome biogenesis constituting the 20 RiBi-gene set analyzed in HGG and non-neoplastic samples. Genes located on the short arm of chromosome 1 (1p) or long arm of chromosome 19 (19q), which are heterozygously deleted in high-grade oligodendrogliomas, are indicated. (B) A principal component analysis (PCA) based on the mRNA expression profile of the RiBi-gene set. Each dot represents a non-neoplastic (NT, gray square), IDHwt glioblastoma (G, pink circle), high-grade astrocytoma (A, green triangle), or high-grade oligodendroglioma (O, purple diamond) sample. Ellipsoids show 90% confidence interval around the centroid (larger gray square, pink circle, green triangle, and purple diamond) of each group. Percentage of variance explained by PC1 and PC2 are indicated. (C) A heatmap showing Pearson’s correlation coefficients of PC1 to PC5 axes with the overall survival (OS), progression-free survival, and mitotic index. R-values are depicted by different colors from −0.6 (red, negative correlation) to 0.6 (blue, positive correlation). Significant correlations are indicated by an asterisk: **P < .01; ***P < .001.
To examine the association between expression levels of RiBi factors and HGGs, we first performed an unsupervised approach using a PCA based on the RiBi-gene set profile (Figure 4B). Interestingly, 3 main clusters were observed. A first large cluster, composed of both non-neoplastic tissues and IDHwt glioblastomas (NT/G cluster), was distinct from 2 other clusters corresponding to IDHmut oligodendrogliomas (O) and astrocytoma (A). PC1 (variance: 67.8%), in particular, separated the NT/G cluster from A/O clusters, while the PC2 (variance: 9%) distinguished the O cluster from others. These data suggest that the expression profile of only 20 RiBi factors discriminates HGGs.
To ensure consistency between the results of our classification and the expected outcome of the patients, we first calculated Pearson’s correlation coefficients between the first 5 PC dimensions and OS or PFS as an internal control (Figure 4C and Supplementary Figure S7C). Consistently, we observed a significant association exclusively for PC1 and PC2, indicating that the clustering based on RiBi-gene set profiles provided by these 2 axes is sufficient to recapitulate all clinical data of interest. OS and PFS were significantly correlated with both PC1 and PC2 in a negative manner, indicating that samples clustering at the right-hand side of the PC1 and top of PC2, for example, IDHwt glioblastomas, display lower OS and PFS. Indeed, IDHwt glioblastoma patients exhibit the poorest OS (less than 30 months) and PFS (under 30 months), followed by IDHmut astrocytoma and oligodendroglioma patients that tend to cluster at the left part of PC1 and the top or bottom part of PC2, respectively.
Strikingly, we also identified a strong correlation between PC1 and PC2 axes, and the IDH1/2 mutational and 1p/19q co-deletion status, respectively (Supplementary Figure S7D-E). Indeed, PC1 (G vs. A/O clusters) was significantly correlated with the IDH1/2 mutational status while PC2 (A/G vs. O clusters) segregated HGG tumors based on the 1p/19q co-deletion status. Thus, expression profiling of the RiBi-gene set was strongly correlated with both clinical features and distinct genomic alterations of the HGG test cohort. Altogether, these results suggest that the expression signature of only 20 genes involved in ribosome biogenesis is sufficient to discriminate IDHwt from IDHmut HGG histomolecular types and that RiBi displays IDH mutational status-dependent alterations.
Ribosome biogenesis factors are highly expressed in IDHmut adult-type diffuse gliomas
Next, we individually compared mRNA expression levels of the 20 RiBi factors among the different HGGs (Figure 5 and Supplementary Figure S8A). Significant differences were observed in the expression of all tested RiBi factors between different groups (Mann–Whitney test, Supplementary Figure S8A). Surprisingly, only a few RiBi genes were significantly differentially expressed in IDHwt glioblastomas compared to non-neoplastic samples (9 out of 20), with very moderate changes (≤2-fold change). In contrast, IDHmut astrocytoma and oligodendrogliomas significantly overexpressed most of these RiBi genes (19 and 16 out of 20 RiBi genes, respectively). For instance, expression of NCL, which encodes a key factor in rRNA synthesis, increased by 2- and 3-fold in IDHmut astrocytoma and oligodendrogliomas, respectively (P < .001), while NCL expression levels in IDHwt samples only slightly increased (Figure 5A and Supplementary Figure S8A). Likewise, the use of a second distinct set of primers to analyze NCL expression provided the exact same trend (Supplementary Figure S8B), therefore ruling out a potential technical caveat. These results suggest that ribosome biogenesis could be enhanced in IDHmut astrocytoma and oligodendrogliomas compared to IDHwt glioblastomas and non-neoplastic tissues.
Figure 5.

High-grade astrocytomas and oligodendrogliomas display the highest increased expression in ribosome biogenesis factors. Box plots showing relative mRNA expression levels determined by RT-qPCR analysis of the RiBi genes implicated in rRNA (A) transcription and (B) maturation, (C) snoRNA biogenesis or associated to (D) H/ACA box and (E) C/D box snoRNAs in IDHwt glioblastomas (G, pink), high-grade astrocytomas (A, green), high-grade oligodendrogliomas (O, purple) and non-neoplastic (NT, gray) samples. FBL, PIH1D1, and RUVBL2 are located on chromosomes 1p or 19q.
Interestingly, genes located on chromosome 19q (FBL, PIH1D1, and RUVBL2) displayed a particular expression pattern (Figure 5C, 5E and Supplementary Figure S7E). Like other genes involved in RiBi, FBL, PIH1D1, and RUVBL2 were significantly overexpressed in IDHmut astrocytomas compared to both IDHwt glioblastomas and non-neoplastic samples. However, mRNA expression levels in IDHmut oligodendrogliomas were lower than in IDHmut astrocytomas and displayed expression profiles resembling those of IDHwt glioblastomas. Thus, FBL was highly expressed exclusively in IDHmut astrocytomas, whereas its expression levels were equivalent in IDHmut oligodendrogliomas and IDHwt glioblastomas, as confirmed by a second set of primers (Supplementary Figure S8B). Considering that IDHmut oligodendroglioma samples exhibited a heterozygous deletion of FBL, PIH1D1, and RUVBL2 genes located on 1p/19q chromosomes, these data indicate that the specific expression profile observed for these genes in IDHmut oligodendrogliomas is likely due to a haploinsufficiency caused by genetic alterations. Interestingly, removal of these 3 genes in the RiBigenes set still allowed us to distinguish IDHwt from IDHmut HGGs (data not shown), suggesting that copy number variation affecting RiBi-gene expression does not impact the distinction between IDHwt and IDHmut, as expected. Therefore, the ribosome biogenesis pathway is strongly enhanced in IDHmut gliomas, that is, high-grade astrocytoma and oligodendroglioma, but remains moderately affected in IDHwt glioblastoma.
HGGs Display Distinct Cytotoxicity to RNA pol I Inhibitors CX5461 and BMH-21
Having identified an IDH mutational status-dependent alteration of RiBi in HGGs, we hypothesized that IDHmut and IDHwt HGGs display distinct cytotoxicity to RNA Pol I inhibitors, BMH-21 and CX5461, which inhibit the transcription of the 47S pre-rRNA and are promising new cancer treatments. We used a panel of 5 representative HGG cell lines, comprising IDHmut astrocytoma and IDHmut and 1p/19q codeleted oligodendroglioma cell lines (LGG85 and BT138/237, respectively) and IDHwt glioblastoma cell lines (5706 and N131520). Analyses of HGG spheroids in response to 72-hour treatments with RNA pol I inhibitors showed that all spheroids were similarly sensitive to BMH-21 with an IC50 ranging from 1.06 to 1.56 μM (Figure 6A-C), as recently observed.42 However, CX5461 strongly impacted the viability of IDHmut astrocytoma and oligodendroglioma spheroids (IC50 ranging from 5.92 to 7.55 μM), but not of IDHwt glioblastoma spheroids (Figure 6D-F). Hence, these results are consistent with our previous findings that IDHmut astrocytomas and oligodendrogliomas may be addicted to an enhanced RiBi pathway, therefore potentially sensitizing these AGD histomolecular types to clinically available RiBi inhibitors. Altogether, our results highlight the potency of RNA Pol I inhibitor usage as potential HGG therapy and further support an over-activation of the RiBi pathway in IDHmut astrocytomas and oligodendrogliomas compared to IDHwt glioblastomas and non-neoplastic tissues.
Figure 6.
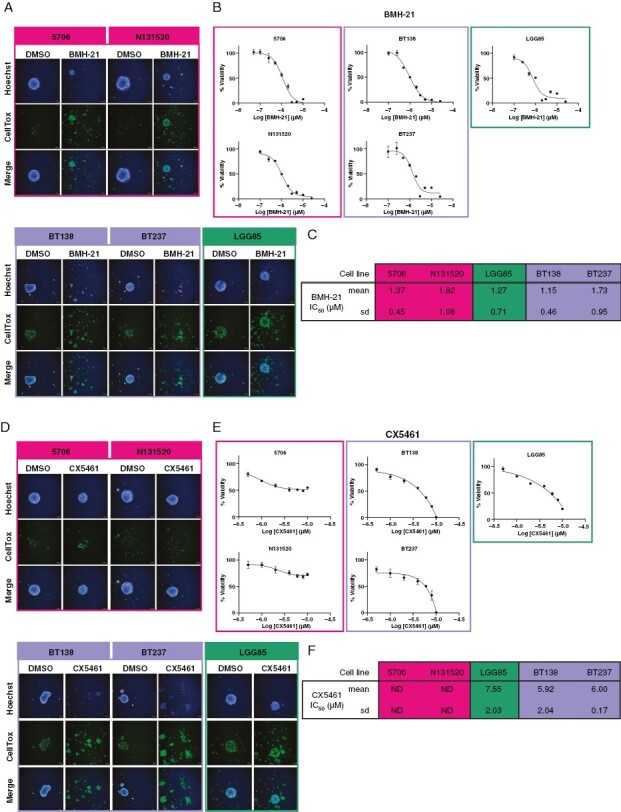
Glioma spheroids reveal distinct histomolecular type-dependent sensitivity to ribosome biogenesis inhibitors. (A) Representative high-content screening microscopy images of 5706, N131520, BT138, BT237, and LGG85 cell line spheroids treated or not (DMSO) with 10 μM of BMH-21 for 72 hours. Hoechst and CellTox labeling are depicted in blue and green, respectively. Cell lines representative of glioblastomas, high-grade oligodendrogliomas, and astrocytomas are shown in pink, purple, and green, respectively. (B) Representative graphs indicating the viability percentage in response to increasing BMH-21 concentrations in 5706, N131520, BT138, BT237, and LGG85 cell line spheroids. Cell lines representative of IDHwt glioblastomas, IDHmut oligodendrogliomas, and astrocytomas are framed in pink, purple, and green, respectively. (C) A table indicating means and standard deviations (SD) of BMH-21 IC50 calculated from graphs displayed in (B) (n = 7). (D), (E) and (F) as in (A) (B) and (C), respectively, for CX5461 (n = 3).
Discussion
High-grade adult-type diffuse gliomas (HGGs) are heterogeneous tumors associated with distinct, albeit poor, survival rates due to the lack of effective targeted therapies, in particular for the most aggressive histomolecular type, the IDHwt glioblastoma. Here, by performing the first concomitant analysis of rRNA 2’Ome and ribosome biogenesis in primary tumors, we report distinct, uncoupled alterations of rRNA epitranscriptomics and ribosome biogenesis in IDHmut and IDHwt HGGs, therefore revealing specific dysregulations of the ribosome biology that constitute new IDH mutational status-associated hallmarks of HGGs.
In the last 7 years, alterations of rRNA 2’Ome profiles have been reported using a newly developed approach RiboMethSeq in numerous cellular models and only in 3 types of cancers, namely breast cancer, acute myeloid leukemia, and diffuse large B-cell lymphoma (DLBCL).15,25,27,28 Such alterations have been shown to be restricted to only 40% of the known rRNA 2’Ome sites, suggesting that only one-third of the sites may possess regulatory functions on ribosome activity. We now show that rRNA 2’Ome profiles also vary in HGGs. As previously observed in other cancers, only a small subset of known rRNA 2’Ome sites display variability in their 2’Ome levels in HGGs, suggesting these positions can tolerate the absence of 2’Ome. The 19 most variable rRNA 2’Ome sites were randomly distributed on the ribosome structure, suggesting no coordinated effects on functional domains of the ribosome. Notably, similar increases in rRNA 2’Ome levels at 18S_Am576 and decreases at 18S_Gm1447 were observed in the most aggressive HGG type, glioblastoma, and breast cancer subtypes (triple negative or TNBC), suggesting a link between these sites and cancer aggressiveness.25 A recent study demonstrated that alterations of 2’Ome levels at a single rRNA site are sufficient to affect cell proliferation, a hallmark of cancer aggressiveness.26 Moreover, rRNA 2’Ome at 18S_Gm1447 was recently shown to support leukemic stem cell functions by modulating translation.28 Hence, whether these rRNA 2’Ome sites common to both HGGs and breast cancer contribute to the acquisition of cancer cell characteristics remains to be deciphered and could potentially represent new targetable vulnerabilities.
In IDHwt glioblastomas, alterations in rRNA 2’Ome levels mostly correspond to a decrease as observed in both the test and validation cohorts. In DLBCL, the global decrease in rRNA 2’Ome levels was correlated with the Ki67-estimated high proliferative rate of tumors. One hypothesis was that low rRNA 2’Ome levels indirectly resulted from an increase in rRNA synthesis associated with the hyperproliferative rate of cancer cells, which rendered components of the rRNA 2’Ome machinery limiting, although rRNA synthesis was not analyzed.27 Consistently, we observed specific alterations of rRNA 2’Ome in IDHwt glioblastomas, which are the most proliferative tumors and display the highest mitotic index in our test cohort. However, we surprisingly observed an elevated ribosome biogenesis in IDHmut astrocytomas and oligodendrogliomas compared to glioblastomas, suggesting that RiBi levels are not correlated with the proliferative rate, at least in HGGs, and cannot solely explain alterations of rRNA epitranscriptomics in HGGs. Even though the rate of ribosome biogenesis may contribute to regulating rRNA 2’Ome through a passive effect, additional molecular mechanisms should be further explored to identify the origin of rRNA 2’Ome alterations in cancer and understand the observed rRNA site- and cancer type-specificity. The mechanisms may include alterations of expressions and/or activities of RNA-binding proteins, such as DDX21 and FMRP, which contribute to the formation of bona fide functional snoRNP complexes.29,43 Here, we report that alterations of C/D box snoRNA expression could be sufficient to explain alterations of rRNA 2’Ome levels at some, but not all, rRNA sites. The evolution of annotation and/or knowledge in biology of C/D box snoRNAs may fill the gap to better understand the causes of rRNA 2’Ome alterations in cancer. Altogether, our findings that main HGG histomolecular types are associated with alterations in either ribosome quantity or quality, challenge the hypothesis that the decrease in rRNA 2’Ome levels mainly results from a passive effect caused by an exacerbated ribosome biogenesis.
Our data reveal that IDHmut HGGs, including both high-grade astrocytoma and oligodendroglioma, display the highest expression of ribosome biogenesis factors, suggesting an increase in ribosome biogenesis. Whether dysregulations of IDH1/2 functions, notably through the production of the oncometabolite D-2-hydroxyglutarate, could directly impact the regulation of ribosome biogenesis would need to be further explored. Nevertheless, the specificity of ribosome biogenesis alterations in HGGs offers novel perspectives for clinical applications. Building on our observations, we found that HGGs are sensitive to the newly developed RNA pol I inhibitors, CX5461 and BMH-21, the former being successfully evaluated in clinical trials in advanced solid and hematological cancers.7 Sensitivity of HGGs to RNA pol I inhibitors CX5461 and BMH-21 has already been reported,42,44,45 even though discrepancies regarding the sensitivity of glioblastomas to CX5461 exist between our data and previous ones, possibly due to differences in experimental settings and genetic backgrounds of tested cell lines. In particular, the 3D culture conditions could decrease drug sensitivity compared to 2D culture conditions, as already reported.46 In addition, the differential sensitivity of glioblastomas to CX5461 and BMH-21 could be attributed to off-target effects of these molecules as these RNA Pol I inhibitors act through distinct mechanisms and are known to affect several cellular pathways, including DNA repair.10,34,47 Thus, whether the activity of these compounds may also rely on the genetic background of tested models impacting the different sensitivities of HGG types to CX5461 and BMH-21, should be further investigated.
Altogether, our data indicate that alterations of the ribosome biology in HGGs are dependent on the IDH mutational status and could represent targetable features in clinic. Thus, recent discoveries in the field of ribosomes have opened new avenues not only for a better understanding of cellular processes that contribute to HGG development and aggressiveness but also for designing future HGG-type-specific therapeutic strategies.
Supplementary Material
Acknowledgments
We would like to thank all the people involved in this study, including the patients and their families. We thank Drs A Idbaih (ICM, Paris, France), JP Hugnot (IGF, Montpellier, France) and K Ligon (Brigham and Women’s Hospital, Boston, USA) for generously providing cell lines. We thank platform staffs that have not been referred as coauthors: NeuroBioTec (CRB HCL, Lyon, France, Biobank BB-0033-00046); 3D-ONCO platform (CRCL, Lyon, France); Gilles Thomas Bioinformatic platform (CRCL, Lyon, France); Cancer Genomic platform (CRCL, Lyon, France). The manuscript has been edited by Brigitte Manship (CRCL, Lyon, France).
Contributor Information
Hermes Paraqindes, LabEx Dev2CAN, Institut Convergence Plascan, Centre de Recherche en Cancérologie de Lyon, Inserm U1052, CNRS UMR5286, Université de Lyon, Université Claude Bernard Lyon, Centre Léon Bérard, CEDEX 08, Lyon, France; Synergie Lyon Cancer, Gilles Thomas Bioinformatics Platform, Centre Léon Bérard, CEDEX 08, Lyon, France.
Nour-El-Houda Mourksi, LabEx Dev2CAN, Institut Convergence Plascan, Centre de Recherche en Cancérologie de Lyon, Inserm U1052, CNRS UMR5286, Université de Lyon, Université Claude Bernard Lyon, Centre Léon Bérard, CEDEX 08, Lyon, France.
Samantha Ballesta, LabEx Dev2CAN, Institut Convergence Plascan, Centre de Recherche en Cancérologie de Lyon, Inserm U1052, CNRS UMR5286, Université de Lyon, Université Claude Bernard Lyon, Centre Léon Bérard, CEDEX 08, Lyon, France; Plateforme 3D-ONCO, Université de Lyon, Université Claude Bernard Lyon 1, Inserm U1052, CNRS UMR5286, Centre Léon Bérard, Centre de Recherche en Cancérologie de Lyon (CRCL), Lyon, France.
Jordan Hedjam, LabEx Dev2CAN, Institut Convergence Plascan, Centre de Recherche en Cancérologie de Lyon, Inserm U1052, CNRS UMR5286, Université de Lyon, Université Claude Bernard Lyon, Centre Léon Bérard, CEDEX 08, Lyon, France.
Fleur Bourdelais, LabEx Dev2CAN, Institut Convergence Plascan, Centre de Recherche en Cancérologie de Lyon, Inserm U1052, CNRS UMR5286, Université de Lyon, Université Claude Bernard Lyon, Centre Léon Bérard, CEDEX 08, Lyon, France.
Tanguy Fenouil, LabEx Dev2CAN, Institut Convergence Plascan, Centre de Recherche en Cancérologie de Lyon, Inserm U1052, CNRS UMR5286, Université de Lyon, Université Claude Bernard Lyon, Centre Léon Bérard, CEDEX 08, Lyon, France; Hospices Civils de Lyon, Laboratoire de biologie médicale et d’anatomie pathologique, Lyon, France.
Thiébaud Picart, LabEx Dev2CAN, Institut Convergence Plascan, Centre de Recherche en Cancérologie de Lyon, Inserm U1052, CNRS UMR5286, Université de Lyon, Université Claude Bernard Lyon, Centre Léon Bérard, CEDEX 08, Lyon, France; Hospices Civils de Lyon, Laboratoire de biologie médicale et d’anatomie pathologique, Lyon, France.
Frédéric Catez, LabEx Dev2CAN, Institut Convergence Plascan, Centre de Recherche en Cancérologie de Lyon, Inserm U1052, CNRS UMR5286, Université de Lyon, Université Claude Bernard Lyon, Centre Léon Bérard, CEDEX 08, Lyon, France.
Théo Combe, LabEx Dev2CAN, Institut Convergence Plascan, Centre de Recherche en Cancérologie de Lyon, Inserm U1052, CNRS UMR5286, Université de Lyon, Université Claude Bernard Lyon, Centre Léon Bérard, CEDEX 08, Lyon, France; Synergie Lyon Cancer, Gilles Thomas Bioinformatics Platform, Centre Léon Bérard, CEDEX 08, Lyon, France.
Anthony Ferrari, LabEx Dev2CAN, Institut Convergence Plascan, Centre de Recherche en Cancérologie de Lyon, Inserm U1052, CNRS UMR5286, Université de Lyon, Université Claude Bernard Lyon, Centre Léon Bérard, CEDEX 08, Lyon, France; Synergie Lyon Cancer, Gilles Thomas Bioinformatics Platform, Centre Léon Bérard, CEDEX 08, Lyon, France.
Janice Kielbassa, Synergie Lyon Cancer, Gilles Thomas Bioinformatics Platform, Centre Léon Bérard, CEDEX 08, Lyon, France.
Emilie Thomas, LabEx Dev2CAN, Institut Convergence Plascan, Centre de Recherche en Cancérologie de Lyon, Inserm U1052, CNRS UMR5286, Université de Lyon, Université Claude Bernard Lyon, Centre Léon Bérard, CEDEX 08, Lyon, France; Synergie Lyon Cancer, Gilles Thomas Bioinformatics Platform, Centre Léon Bérard, CEDEX 08, Lyon, France.
Laurie Tonon, LabEx Dev2CAN, Institut Convergence Plascan, Centre de Recherche en Cancérologie de Lyon, Inserm U1052, CNRS UMR5286, Université de Lyon, Université Claude Bernard Lyon, Centre Léon Bérard, CEDEX 08, Lyon, France; Synergie Lyon Cancer, Gilles Thomas Bioinformatics Platform, Centre Léon Bérard, CEDEX 08, Lyon, France.
Alain Viari, LabEx Dev2CAN, Institut Convergence Plascan, Centre de Recherche en Cancérologie de Lyon, Inserm U1052, CNRS UMR5286, Université de Lyon, Université Claude Bernard Lyon, Centre Léon Bérard, CEDEX 08, Lyon, France; Synergie Lyon Cancer, Gilles Thomas Bioinformatics Platform, Centre Léon Bérard, CEDEX 08, Lyon, France; INRIA Grenoble Rhône-Alpes, Montbonnot-Saint-Martin, France.
Valéry Attignon, LabEx Dev2CAN, Institut Convergence Plascan, Centre de Recherche en Cancérologie de Lyon, Inserm U1052, CNRS UMR5286, Université de Lyon, Université Claude Bernard Lyon, Centre Léon Bérard, CEDEX 08, Lyon, France; Cancer Genomics Platform, Centre de Recherche en Cancérologie de Lyon, CEDEX 08, Lyon, France.
Marjorie Carrere, Cancer Genomics Platform, Centre de Recherche en Cancérologie de Lyon, CEDEX 08, Lyon, France.
Jessie Perrossier, Cancer Genomics Platform, Centre de Recherche en Cancérologie de Lyon, CEDEX 08, Lyon, France.
Stéphane Giraud, Plateforme 3D-ONCO, Université de Lyon, Université Claude Bernard Lyon 1, Inserm U1052, CNRS UMR5286, Centre Léon Bérard, Centre de Recherche en Cancérologie de Lyon (CRCL), Lyon, France.
Christophe Vanbelle, Plateforme d’Imagerie Cellulaire, Université de Lyon, Université Claude Bernard Lyon 1, Inserm U1052, CNRS UMR5286, Centre Léon Bérard, Centre de Recherche en Cancérologie de Lyon (CRCL), Lyon, France.
Mathieu Gabut, LabEx Dev2CAN, Institut Convergence Plascan, Centre de Recherche en Cancérologie de Lyon, Inserm U1052, CNRS UMR5286, Université de Lyon, Université Claude Bernard Lyon, Centre Léon Bérard, CEDEX 08, Lyon, France.
Danny Bergeron, Département de biochimie et génomique fonctionnelle, Faculté de médecine et des sciences de la santé, Université de Sherbrooke, Sherbrooke, Québec, Canada.
Michelle S Scott, Département de biochimie et génomique fonctionnelle, Faculté de médecine et des sciences de la santé, Université de Sherbrooke, Sherbrooke, Québec, Canada.
Luis Castro Vega, Sorbonne Université, Inserm, CNRS, UMRS1127, Institut du Cerveau, ICM, AP-HP, Hôpitaux Universitaires La Pitié Salpêtrière – Charles Foix, Service de Neurologie 2-Mazarin, Paris, France.
Nathalie Magne, Sorbonne Université, Inserm, CNRS, UMRS1127, Institut du Cerveau, ICM, AP-HP, Hôpitaux Universitaires La Pitié Salpêtrière – Charles Foix, Service de Neurologie 2-Mazarin, Paris, France.
Emmanuelle Huillard, Sorbonne Université, Inserm, CNRS, UMRS1127, Institut du Cerveau, ICM, AP-HP, Hôpitaux Universitaires La Pitié Salpêtrière – Charles Foix, Service de Neurologie 2-Mazarin, Paris, France.
Marc Sanson, Sorbonne Université, Inserm, CNRS, UMRS1127, Institut du Cerveau, ICM, AP-HP, Hôpitaux Universitaires La Pitié Salpêtrière – Charles Foix, Service de Neurologie 2-Mazarin, Paris, France.
David Meyronet, LabEx Dev2CAN, Institut Convergence Plascan, Centre de Recherche en Cancérologie de Lyon, Inserm U1052, CNRS UMR5286, Université de Lyon, Université Claude Bernard Lyon, Centre Léon Bérard, CEDEX 08, Lyon, France; Hospices Civils de Lyon, Laboratoire de biologie médicale et d’anatomie pathologique, Lyon, France.
Jean-Jacques Diaz, LabEx Dev2CAN, Institut Convergence Plascan, Centre de Recherche en Cancérologie de Lyon, Inserm U1052, CNRS UMR5286, Université de Lyon, Université Claude Bernard Lyon, Centre Léon Bérard, CEDEX 08, Lyon, France.
François Ducray, LabEx Dev2CAN, Institut Convergence Plascan, Centre de Recherche en Cancérologie de Lyon, Inserm U1052, CNRS UMR5286, Université de Lyon, Université Claude Bernard Lyon, Centre Léon Bérard, CEDEX 08, Lyon, France; Hospices Civils de Lyon, Service de neuro-oncologie, Hôpital Pierre Wertheimer, Lyon, France.
Virginie Marcel, LabEx Dev2CAN, Institut Convergence Plascan, Centre de Recherche en Cancérologie de Lyon, Inserm U1052, CNRS UMR5286, Université de Lyon, Université Claude Bernard Lyon, Centre Léon Bérard, CEDEX 08, Lyon, France.
Sébastien Durand, LabEx Dev2CAN, Institut Convergence Plascan, Centre de Recherche en Cancérologie de Lyon, Inserm U1052, CNRS UMR5286, Université de Lyon, Université Claude Bernard Lyon, Centre Léon Bérard, CEDEX 08, Lyon, France.
Funding
This work was supported by INCa (PLBio 2019-138 MARACAS, INCa_18488 GlioRIB), the French Association pour la Recherche sur les Tumeurs Cérébrales (ARTC), the Cancéropôle Lyon Auvergne Rhône-Alpes (AAP international 2021 MARACAS.v3.0), the Ligue Contre le Cancer Auvergne-Rhône-Alpesand the SIRIC program (INCa-DGOS-Inserm_12563, LyRICAN). HP and NEHM were recipients of PhD fellowships from Ligue Nationale Contre le Cancer. JH was recipient of PhD fellowship from French Minister of Research.
Conflict of interest statement
The authors have no conflicts of interest to declare.
Ethical approval
All the experiment protocols involving humans was in accordance with the guidelines of French regulation. Written informed consent was obtained from all patients.
Authorship statement
HP, NEHM, SB, JH, FB, VA, MC, JP, DB, LCV, and SD performed and analyzed experiments. HP, NEHM, JK, ET, and DB performed statistical descriptions and bioinformatic analyses. HP, TC, AF, JK, ET, LT, and AV developed bioinformatic tools. LCV, EH, and MS provided cell lines. DM, FD provided human samples and clinical data. AF, JK, ET, VA, SG, MSS, EH, MS, DM, FD, VM, and SD supervised experimental process. HP, NEHM, SB, JK, SG, FD, VM, and SD interpreted the data. VM and SD shaped the clinical and research question and supervised the project coordination. AV, MSS, EH, MS, MG, JJD, FD, VM, and SD provided financial supports. HP, NEHM, VM, and SD wrote the first draft of the manuscript. All authors have read and approved the manuscript.
Data Availability
The generated RiboMethSeq data are available in the GEO profile (GSE224104, token for reviewer access: qhabqswmfzotlwh). The datasets include the fastq of each sample, a C-score matrix for each cohort after batch effect adjustment using ComBat-seq and a matrix summarizing the clinical data.
References
- 1. Wen PY, Weller M, Lee EQ, et al. Glioblastoma in adults: a Society for Neuro-Oncology (SNO) and European Society of Neuro-Oncology (EANO) consensus review on current management and future directions. Neuro Oncol. 2020;22(8):1073–1113. [DOI] [PMC free article] [PubMed] [Google Scholar]
- 2. Lapointe S, Perry A, Butowski NA.. Primary brain tumours in adults. Lancet. 2018;392(10145):432–446. [DOI] [PubMed] [Google Scholar]
- 3. Lassman AB, Hoang-Xuan K, Polley MYC, et al. Joint final report of EORTC 26951 and RTOG 9402: Phase III trials with procarbazine, lomustine, and vincristine chemotherapy for anaplastic oligodendroglial tumors. J Clin Oncol. 2022;40(23):2539–2545. [DOI] [PMC free article] [PubMed] [Google Scholar]
- 4. van den Bent MJ, Tesileanu CMS, Wick W, et al. Adjuvant and concurrent temozolomide for 1p/19q non-co-deleted anaplastic glioma (CATNON; EORTC study 26053-22054): Second interim analysis of a randomised, open-label, phase 3 study. Lancet Oncol. 2021;22(6):813–823. [DOI] [PMC free article] [PubMed] [Google Scholar]
- 5. Bastide A, David A.. The ribosome, (slow) beating heart of cancer (stem) cell. Oncogenesis 2018;7(4):1–13. [DOI] [PMC free article] [PubMed] [Google Scholar]
- 6. Barna M, Pusic A, Zollo O, et al. Suppression of Myc oncogenic activity by ribosomal protein haploinsufficiency. Nature. 2008;456(7224):971–975. [DOI] [PMC free article] [PubMed] [Google Scholar]
- 7. Catez F, Dalla Venezia N, Marcel V, et al. Ribosome biogenesis: An emerging druggable pathway for cancer therapeutics. Biochem Pharmacol. 2019;159:74–81. [DOI] [PubMed] [Google Scholar]
- 8. Penzo M, Montanaro L, Treré D, Derenzini M.. The ribosome biogenesis—Cancer connection. Cells. 2019;8(1):55. [DOI] [PMC free article] [PubMed] [Google Scholar]
- 9. Bywater MJ, Poortinga G, Sanij E, et al. Inhibition of RNA polymerase I as a therapeutic strategy to promote cancer-specific activation of p53. Cancer Cell. 2012;22(1):51–65. [DOI] [PMC free article] [PubMed] [Google Scholar]
- 10. Peltonen K, Colis L, Liu H, et al. A targeting modality for destruction of RNA polymerase I that possesses anticancer activity. Cancer Cell. 2014;25(1):77–90. [DOI] [PMC free article] [PubMed] [Google Scholar]
- 11. Hilton J, Gelmon K, Bedard PL, et al. Results of the phase I CCTG IND.231 trial of CX-5461 in patients with advanced solid tumors enriched for DNA-repair deficiencies. Nat Commun. 2022;13(1):1. [DOI] [PMC free article] [PubMed] [Google Scholar]
- 12. Khot A, Brajanovski N, Cameron DP, et al. First-in-human RNA polymerase I transcription inhibitor CX-5461 in patients with advanced hematologic cancers: Results of a phase I dose-escalation study. Cancer Discov. 2019;9(8):1036–1049. [DOI] [PubMed] [Google Scholar]
- 13. Xu H, Di Antonio M, McKinney S, et al. CX-5461 is a DNA G-quadruplex stabilizer with selective lethality in BRCA1/2 deficient tumours. Nat Commun. 2017;8(1):1. [DOI] [PMC free article] [PubMed] [Google Scholar]
- 14. Marcel V, Catez F, Diaz JJ.. Ribosome heterogeneity in tumorigenesis: The rRNA point of view. Mol Cell Oncol. 2015;2(3):e983755. [DOI] [PMC free article] [PubMed] [Google Scholar]
- 15. Jaafar M, Paraqindes H, Gabut M, et al. 2ʹO-Ribose methylation of ribosomal RNAs: Natural diversity in living organisms, biological processes, and diseases. Cells. 2021;10(8):1948. [DOI] [PMC free article] [PubMed] [Google Scholar]
- 16. Miller SC, MacDonald CC, Kellogg MK, Karamysheva ZN, Karamyshev AL.. Specialized ribosomes in health and disease. Int J Mol Sci. 2023;24(7):6334. [DOI] [PMC free article] [PubMed] [Google Scholar]
- 17. Xue S, Barna M.. Specialized ribosomes: A new frontier in gene regulation and organismal biology. Nat Rev Mol Cell Biol. 2012;13(6):355–369. [DOI] [PMC free article] [PubMed] [Google Scholar]
- 18. Genuth NR, Barna M.. Heterogeneity and specialized functions of translation machinery: From genes to organisms. Nat Rev Genet. 2018;19(7):431–452. [DOI] [PMC free article] [PubMed] [Google Scholar]
- 19. Larionova TD, Bastola S, Aksinina TE, et al. Alternative RNA splicing modulates ribosomal composition and determines the spatial phenotype of glioblastoma cells. Nat Cell Biol. 2022;24(10):1541–1557. [DOI] [PMC free article] [PubMed] [Google Scholar]
- 20. Gabut M, Bourdelais F, Durand S. Ribosome and translational control in stem cells. Cells. 2020;9(2):497. [DOI] [PMC free article] [PubMed] [Google Scholar]
- 21. Shirakawa Y, Hide T, Yamaoka M, et al. Ribosomal protein S6 promotes stem-like characters in glioma cells. Cancer Sci. 2020;111(6):2041–2051. [DOI] [PMC free article] [PubMed] [Google Scholar]
- 22. Hide T, Shibahara I, Inukai M, Shigeeda R, Kumabe T.. Ribosomes and ribosomal proteins promote plasticity and stemness induction in glioma cells via reprogramming. Cells. 2022;11(14):2142. [DOI] [PMC free article] [PubMed] [Google Scholar]
- 23. Erales J, Marchand V, Panthu B, et al. Evidence for rRNA 2ʹ-O-methylation plasticity: Control of intrinsic translational capabilities of human ribosomes. Proc Natl Acad Sci U S A. 2017;114(49):12934–12939. [DOI] [PMC free article] [PubMed] [Google Scholar]
- 24. Marcel V, Ghayad SE, Belin S, et al. P53 acts as a safeguard of translational control by regulating Fibrillarin and rRNA methylation in cancer. Cancer Cell. 2013;24(3):318–330. [DOI] [PMC free article] [PubMed] [Google Scholar]
- 25. Marcel V, Kielbassa J, Marchand V, et al. Ribosomal RNA 2’O-methylation as a novel layer of inter-tumour heterogeneity in breast cancer. NAR Cancer. 2020;2(4):zcaa036. [DOI] [PMC free article] [PubMed] [Google Scholar]
- 26. Jansson MD, Häfner SJ, Altinel K, et al. Regulation of translation by site-specific ribosomal RNA methylation. Nature Struct Mol Biol. 2021;28(11):889–899. [DOI] [PubMed] [Google Scholar]
- 27. Krogh N, Asmar F, Côme C, et al. Profiling of ribose methylations in ribosomal RNA from diffuse large B-cell lymphoma patients for evaluation of ribosomes as drug targets. NAR Cancer. 2020;2(4):zcaa035. [DOI] [PMC free article] [PubMed] [Google Scholar]
- 28. Zhou F, Aroua N, Liu Y, et al. A dynamic rRNA ribomethylome drives stemness in acute myeloid leukemia. Cancer Discov. 2022;13(2):332–347. [DOI] [PMC free article] [PubMed] [Google Scholar]
- 29. Zhou F, Liu Y, Rohde C, et al. AML1-ETO requires enhanced C/D box snoRNA/RNP formation to induce self-renewal and leukaemia. Nat Cell Biol. 2017;19(7):844–855. [DOI] [PubMed] [Google Scholar]
- 30. Nachmani D, Bothmer AH, Grisendi S, et al. Germline NPM1 mutations lead to altered rRNA 2’-O-methylation and cause dyskeratosis congenita. Nat Genet. 2019;51(10):1518–1529. [DOI] [PMC free article] [PubMed] [Google Scholar]
- 31. Nguyen Van Long F, Lardy-Cleaud A, Carène D, et al. Low level of Fibrillarin, a ribosome biogenesis factor, is a new independent marker of poor outcome in breast cancer. BMC Cancer. 2022;22(1):1–12. [DOI] [PMC free article] [PubMed] [Google Scholar]
- 32. Marchand V, Ayadi L, el Hajj A, et al. High-throughput mapping of 2’-O-Me residues in RNA using next-generation sequencing (Illumina RiboMethSeq Protocol). Methods Mol Biol. 2017;1562:171–187. [DOI] [PubMed] [Google Scholar]
- 33. Pichot F, Marchand V, Ayadi L, et al. Holistic optimization of bioinformatic analysis pipeline for detection and quantification of 2ʹ-O-Methylations in RNA by RiboMethSeq. Front Genet. 2020;11:38. [DOI] [PMC free article] [PubMed] [Google Scholar]
- 34. Drygin D, Lin A, Bliesath J, et al. Targeting RNA polymerase I with an oral small molecule CX-5461 inhibits ribosomal RNA synthesis and solid tumor growth. Cancer Res. 2011;71(4):1418–1430. [DOI] [PubMed] [Google Scholar]
- 35. Birkedal U, Christensen-Dalsgaard M, Krogh N, et al. Profiling of ribose methylations in RNA by high-throughput sequencing. Angew Chem Int Ed Engl. 2015;54(2):451–455. [DOI] [PubMed] [Google Scholar]
- 36. Zhang Y, Parmigiani G, Johnson WE.. ComBat-seq: Batch effect adjustment for RNA-seq count data. NAR Genom Bioinform. 2020;2(3):lqaa078. [DOI] [PMC free article] [PubMed] [Google Scholar]
- 37. Sharma S, Marchand V, Motorin Y, Lafontaine DLJ.. Identification of sites of 2ʹ-O-methylation vulnerability in human ribosomal RNAs by systematic mapping. Sci Rep. 2017;7(1):11490. [DOI] [PMC free article] [PubMed] [Google Scholar]
- 38. Delhermite J, Tafforeau L, Sharma S, et al. Systematic mapping of rRNA 2’-O methylation during frog development and involvement of the methyltransferase Fibrillarin in eye and craniofacial development in Xenopus laevis. PLoS Genet. 2022;18(1):e1010012. [DOI] [PMC free article] [PubMed] [Google Scholar]
- 39. Deschamps-Francoeur G, Boivin V, Abou Elela S, Scott MS.. CoCo: RNA-seq read assignment correction for nested genes and multimapped reads. Bioinformatics. 2019;35(23):5039–5047. [DOI] [PMC free article] [PubMed] [Google Scholar]
- 40. Bergeron D, Laforest C, Carpentier S, et al. SnoRNA copy regulation affects family size, genomic location and family abundance levels. BMC Genomics. 2021;22(1):414. [DOI] [PMC free article] [PubMed] [Google Scholar]
- 41. Bergeron D, Paraqindes H, Fafard-Couture E, et al. snoDB 2.0: an enhanced interactive database, specializing in human snoRNAs. Nucleic Acids Res. 2023;51(D1):D291–D296. [DOI] [PMC free article] [PubMed] [Google Scholar]
- 42. Zisi A, Kanellis DC, Moussaud S, et al. Small molecule-mediated disruption of ribosome biogenesis synergizes with FGFR inhibitors to suppress glioma cell growth. Neuro Oncol. 2022;25(6):1058–1072. [DOI] [PMC free article] [PubMed] [Google Scholar]
- 43. D’Souza MN, Gowda NKC, Tiwari V, et al. FMRP Interacts with C/D Box snoRNA in the Nucleus and Regulates Ribosomal RNA Methylation. iScience. 2018;9:399–411. [DOI] [PMC free article] [PubMed] [Google Scholar]
- 44. Li G, Shen J, Cao J, et al. Alternative splicing of human telomerase reverse transcriptase in gliomas and its modulation mediated by CX-5461. J Exp Clin Cancer Res. 2018;37(1):1–13. [DOI] [PMC free article] [PubMed] [Google Scholar]
- 45. Chiu YC, Chen HIH, Zhang T, et al. Predicting drug response of tumors from integrated genomic profiles by deep neural networks. BMC Med Genomics. 2019;12(S1):143–155. [DOI] [PMC free article] [PubMed] [Google Scholar]
- 46. El Hassouni B, Mantini G, Immordino B, Peters GJ, Giovannetti E.. CX-5461 Inhibits pancreatic ductal adenocarcinoma cell growth, migration and induces DNA damage. Molecules. 2019;24(24):4445. [DOI] [PMC free article] [PubMed] [Google Scholar]
- 47. Xu H, di Antonio M, McKinney S, et al. CX-5461 is a DNA G-quadruplex stabilizer with selective lethality in BRCA1/2 deficient tumours. Nat Commun. 2017;8(1):1. [DOI] [PMC free article] [PubMed] [Google Scholar]
Associated Data
This section collects any data citations, data availability statements, or supplementary materials included in this article.
Supplementary Materials
Data Availability Statement
The generated RiboMethSeq data are available in the GEO profile (GSE224104, token for reviewer access: qhabqswmfzotlwh). The datasets include the fastq of each sample, a C-score matrix for each cohort after batch effect adjustment using ComBat-seq and a matrix summarizing the clinical data.