

Abstract
Background
The European Working Group on Sarcopenia in Older People (EWGSOP) recommends SARC‐F as a tool for identifying sarcopenia among older adults. However, the role of SARC‐F among older adults with cancer remains unexplored. We aimed to evaluate the diagnostic utility of SARC‐F to identify those with sarcopenia, or low muscle mass (using skeletal muscle index [SMI]), and myosteatosis (using skeletal muscle density [SMD]) from computed tomography (CT) imaging and the association of SARC‐F with all‐cause mortality.
Methods
Older adults (≥60 years) presenting for initial consultation at UAB medical oncology clinic who underwent geriatric assessment were enrolled in a prospective cohort study. We identified study participants who completed SARC‐F screening and had available CT imaging within 60 days of study enrollment. Using single‐slice CT images at the L3 vertebral level, we computed SMI and SMD using published methods. Sarcopenia and myosteatosis were defined using published cutpoints. We calculated the sensitivity and specificity of SARC‐F for detecting low muscle mass and low muscle density using published thresholds. Finally, we computed the impact of SARC‐F and CT measures on overall survival using Kaplan–Meier curves and Cox regression models, after adjusting for age, sex, cancer type, and cancer stage.
Results
We identified 212 older adults with a median age of 68.8 years; with 60.8% males, 76.6% whites, and pancreatic cancer (21.2%) being the most common malignancy. In the overall cohort, 30.7% had abnormal SARC‐F using published cutpoints. SARC‐F ≥ 4 had a sensitivity of 35% and a specificity of 76% to identify low muscle mass. SARC‐F ≥ 4 had a sensitivity of 38% and a specificity of 74% to identify low muscle density. Those with SARC‐F ≥ 4 and low SMI/SMD had worse survival compared to those with low SMI/SMD alone. Incorporating SARC‐F improved survival prognostication beyond SMI and SMD (HR = 3.1; p < 0.001; Harrel's C from 0.73 to 0.76).
Conclusions
SARC‐F as a screening tool has limited diagnostic utility for identifying older adults with low muscle mass and/or density. However, SARC‐F retains prognostic value independent of CT‐based muscle measures in predicting mortality among older adults with cancer.
Keywords: cancer, computed tomography, myosteatosis, SARC‐F, sarcopenia
Patient‐reported measures such as SARC‐F have been used to identify sarcopenia in community‐dwelling adults, but the utility of SARC‐F to identify sarcopenia and myosteatosis among older adults with cancer remains unknown. Herein, we show that SARC‐F and computed tomography analysis identify distinct populations, and they can be used together to better predict overall survival among older adults with cancer.
1. INTRODUCTION
The majority of cancer and death from cancer occurs in older adults ≥65 years of age. 1 Among older adults with cancer, there is heterogeneity in treatment tolerability, treatment response, and overall survival. This heterogeneity in outcomes is likely driven by many factors, including differences in frailty status and body composition of older adults. Sarcopenia, or low muscle mass and strength, and myosteatosis, or skeletal muscle fat infiltration, increase longitudinally with aging and are highly prevalent in older adults with cancer. 2 , 3 , 4 , 5 Sarcopenia is associated with increased chemotherapy‐induced toxicities, increased hospital length of stay, worse treatment tolerability, and increased mortality across multiple cancer types. 6 , 7 , 8 , 9 , 10 , 11 , 12 Similarly, myosteatosis is associated with functional impairments and decreased overall survival across multiple cancer types. 4 , 13 , 14 Therefore, sarcopenia and myosteatosis are both negatively correlated with functional outcomes and survival in older adults with cancer.
Despite being recognized as key prognostic factors in cancer survival, sarcopenia and myosteatosis remain challenging to quantify and apply in routine cancer care. Whereas sarcopenia and myosteatosis can be quantified through various imaging modalities, computed tomography (CT) is most commonly used among patients with cancers, since most patients routinely get CT imaging as part of their cancer care. 15 , 16 , 17 Herein, we define sarcopenia as CT‐measured low muscle mass and define myosteatosis as CT‐measured low muscle density. Although reliable methods exist for quantifying muscle mass and muscle density using CT imaging, this requires specialized software, trained staff, and is not yet routinely available clinically as a part of radiology workflow. Recognizing the difficulty in identifying sarcopenia in routine clinical practice, SARC‐F, a 5‐item patient‐reported questionnaire, has been recently proposed as a screening tool for sarcopenia. 18 , 19 , 20 SARC‐F stands for Strength, Assistance in Walking, Rise from a chair, Climb Stairs, and Falls. Each of the five components is scored between 0 and 2, for a total score between 0 and 10 (Table S1). A score ≥4 has been shown to have low sensitivity but high specificity for identifying sarcopenia in community‐dwelling adults. 21 , 22
However, the utility of SARC‐F to identify sarcopenia in older adults with cancer remains unexplored. To that end, we have previously reported our initial experience in using SARC‐F in oncology patients and showed that SARC‐F ≥ 4 was associated with increased mortality in a population of older adults with cancer. 23 Here, we sought to assess the diagnostic utility of SARC‐F to identify sarcopenia (low muscle mass on CT imaging) and myosteatosis (low muscle density on CT imaging) specifically among older adults with cancer. Additionally, we sought to determine whether combining information on SARC‐F score and CT‐measured muscle mass or density could identify subpopulations with distinct survival outcomes.
2. METHODS
2.1. Study population
We used data collected from the University of Alabama at Birmingham (UAB) Cancer and Aging Resilience Evaluation (CARE) Study, an ongoing single institution prospective registry of adults ≥60 years old undergoing cancer care (solid tumors and hematologic malignancies) at UAB hospitals and clinics since September 2017. 24 All participants in the CARE study undergo a patient‐reported geriatric assessment (CARE GA) at the time of initial consultation with their medical oncologist. Between May 2019 and August 2020, the five‐item SARC‐F questionnaire was included as an amendment to our original CARE GA instrument. As such, all participants who participated in CARE during this time period also underwent SARC‐F assessment. For the purposes of this study, we included study participants with available SARC‐F scores who also had available CT scans obtained as a part of their cancer care, within 60 days of completion of baseline CARE GA. Therefore, only patients who participated in the CARE study and had a SARC‐F with available CT scans were included in this study (Figure S1). This study was approved by the Institutional Review Board of UAB (IRB‐300000092). Written informed consent was obtained from all patients included in this study.
2.2. SARC‐F questionnaire
All study participants completed the SARC‐F questionnaire at the time of initial consultation with a medical oncologist. SARC‐F is a patient‐reported questionnaire which consists of five components: Strength, Assistance in walking, Rise from a chair, Climb stairs, and Falls. 19 Each component is scored between 0 and 2 points to give a total score between 0 and 10 (Table S1). A score ≥4 has previously been shown to be highly specific for sarcopenia and to be predictive of poor outcomes. 19 , 20 , 21 , 25
2.3. Measurement of skeletal muscle mass and density
We obtained archived CT scans of the abdominal region within 60 days of baseline CARE GA from the UAB Picture Archiving and Communication System. These CT scans were obtained as a part of routine clinical care and the decision to obtain scans rested with the treating oncologist. A time span of 60 days was considered sufficiently accurate to represent body composition at the time of CARE GA. Using single‐slice CT images at the level of the third lumbar vertebra, we identified skeletal muscle area (SMA) using a combination of outlining and tissue‐specific Hounsfield Unit (HU) thresholds (−29 through +150 HU). Prior studies have shown that cross‐sectional measurements of skeletal muscle at the level of the mid‐L3 vertebra are well‐correlated to whole body muscle and adipose tissue mass. 26 , 27 Image annotation and segmentation was performed using Data Analysis Facilitation Suite previously validated image processing software. 28 All images were manually reviewed by a single, trained reviewer to confirm accuracy. Computed SMA was then normalized for height to generate skeletal muscle index (SMI) (SMI = SMA in cm2/height in m2). We then calculated skeletal muscle density (SMD), or radio‐attenuation, by averaging the HU of skeletal muscle of the cross‐sectional image. Since the density of skeletal muscle is inversely related to muscle fat content, myosteatosis is reflected in a lower SMD. 29 , 30 , 31 We used previously published thresholds by Martin et al. 17 of SMI and SMD to identify patients with and without sarcopenia and myosteatosis, respectively (Table S2).
2.4. Combining SARC‐F and CT‐measured muscle mass/density
To determine the utility of SARC‐F to combine with sarcopenia or myosteatosis to better predict overall survival, we created three mutually exclusive groups based on both SARC‐F score and sarcopenia/myosteatosis. Patients who had SARC‐F < 4 and did not have sarcopenia/myosteatosis were included in Group 1. Patients who had SARC‐F < 4 and had sarcopenia/myosteatosis AND patients who had SARC‐F ≥ 4 and did not have sarcopenia/myosteatosis were included in Group 2. Patients who had SARC‐F ≥ 4 and also had sarcopenia/myosteatosis were included in Group 3.
2.5. Overall survival
We obtained information regarding vital status using a combination of medical records and linkage with Accurint database. Overall survival was defined as time between baseline GA to death or last follow‐up. Vital status was updated through May 9, 2022.
2.6. Other covariates
Age and gender were self‐reported as part of the CARE tool. Cancer type and cancer stage were obtained from review of the electronic medical record.
2.7. Statistical analyses
We used descriptive statistics to define baseline demographics and clinical characteristics of patients. With regard to diagnostic validity, we computed sensitivity and specificity of SARC‐F ≥ 4 using CT‐based sarcopenia or CT‐based myosteatosis as the reference standard. Although we initially focused on SARC‐F score ≥4, we explored if alternative cutpoints of SARC‐F score could improve diagnostic validity using receiver operator characteristic (ROC) curves and Youden's J Statistic/Index (YI = sensitivity + specificity − 1). 32 For overall survival analysis, we used Kaplan–Meier curves and log‐rank tests to compare survival curves between groups. We evaluated the association between SARC‐F scores and the risk of all‐cause mortality using Cox proportional hazards regression models, adjusting for age, gender, cancer type, and cancer stage. All statistical tests were two‐sided, with α < 0.05 considered statistically significant. We performed statistical analyses using SAS statistical software version 9.4 (SAS Institute Inc) and STATA version 16.0 (StataCorp LLC).
3. RESULTS
3.1. Baseline demographics, SARC‐F score, and CT measurements
Between May 2019 and August 2020, 1322 patients enrolled in the CARE registry. 736 of these patients had CT imaging completed within 60 days of completion of CARE GA. 212 of these patients also completed the SARC‐F questionnaire and were thus included in the present study (Figure S1). The median age of the cohort was 68.8 years (interquartile range [IQR] 64–74). The majority of the patients were male (60.8%) and non‐Hispanic White (76.6%). The most common cancers included pancreatic (21.2%) and colorectal (13.2%). The majority of cancers were Stage IV (50.9%) (Table 1).
TABLE 1.
Baseline demographics of cohort, including age, sex, race, cancer type, and cancer stage.
| Variable | Value |
|---|---|
| N | 212 |
| Age, median (IQR) | 68.80 (63.66, 74.00) |
| Age, category | |
| Age, 60–65 | 67 (31.6%) |
| Age, 66–70 | 50 (23.6%) |
| Age, 71–96 | 95 (44.8%) |
| Sex | |
| Female | 83 (39.2%) |
| Male | 129 (60.8%) |
| Race | |
| Non‐Hispanic White | 160 (76.6%) |
| Non‐Hispanic Black | 46 (22.0%) |
| Hispanic | 3 (1.4%) |
| Cancer type | |
| Colorectal | 28 (13.2%) |
| Pancreatic | 45 (21.2%) |
| Hepatobiliary | 21 (9.9%) |
| Gastroesophageal | 18 (8.5%) |
| Other GI | 26 (12.3%) |
| Prostate | 18 (8.5%) |
| Lung | 24 (11.3%) |
| Head and neck | 18 (8.5%) |
| Other | 14 (6.6%) |
| Cancer stage | |
| Stage I | 7 (3.3%) |
| Stage II | 35 (16.5%) |
| Stage III | 59 (27.8%) |
| Stage IV | 108 (50.9%) |
| Unknown | 3 (1.4%) |
The median SARC‐F score was 2 (IQR 0–4). 30.7% of patients had a SARC‐F score ≥4. The median SMI was 41.5 (cm2/m2) (IQR 34–49), and the median SMD was 39.5 (HU) (IQR 32–48). 58.5% of patients met criteria for sarcopenia, and 38.1% of patients met criteria for myosteatosis (Table 2).
TABLE 2.
Distribution of SMI, SMD, and SARC‐F within the cohort.
| Variable | Value |
|---|---|
| N | 212 |
| Sarcopenia: No | 88 (41.5%) |
| Sarcopenia: Yes | 124 (58.5%) |
| Myosteatosis: No | 130 (61.9%) |
| Myosteatosis: Yes | 80 (38.1%) |
| SARC‐F score, median | 2 (0, 4) |
| SARC‐F < 4 | 147 (69.3%) |
| SARC‐F ≥ 4 | 65 (30.7%) |
3.2. Validity of SARC‐F tool for diagnosing sarcopenia and myosteatosis
Using the well‐established cutoff of ≥4, SARC‐F had 35% sensitivity, and 76% specificity for identifying sarcopenia (Table 3A). Meanwhile, SARC‐F ≥ 4 had 38% sensitivity and 74% specificity for identifying myosteatosis (Table 3B). We explored alternative cutpoints of SARC‐F score to detect sarcopenia and myosteatosis. Generally, decreasing cutoffs led to improved sensitivity but decreased specificity to detect sarcopenia (Figure S2A) and myosteatosis (Figure S2B). Conversely, increasing SARC‐F score led to decreased sensitivity but increased specificity to detect sarcopenia (Figure S2A) and myosteatosis (Figure S2B). We confirmed that SARC‐F ≥ 4 was the optimal cutoff using Youden's index. Therefore, we used SARC‐F score ≥4 for the remainder of the study.
TABLE 3.
Sensitivity and specificity of SARC‐F ≥ 4 to detect low SMI (A) and low SMD (B) measured by CT.
| CT: No | CT: Yes | Total | |
|---|---|---|---|
| A. Low SMI | |||
| SARC‐F: No | 67 | 80 | 147 |
| SARC‐F: Yes | 21 | 44 | 65 |
| Total | 88 | 124 | 212 |
| B. Low SMD | |||
| SARC‐F: No | 96 | 50 | 146 |
| SARC‐F: Yes | 34 | 30 | 64 |
| Total | 130 | 80 | 210 |
Note: Sensitivity for low SMI was 35% and specificity for low SMI was 76% (A). Sensitivity for low SMD was 38% and specificity for low SMD was 74% (B).
3.3. Association of SARC‐F, sarcopenia, and myosteatosis with overall survival
SARC‐F ≥ 4 was associated with decreased overall survival (p < 0.001) (Figure 1A), consistent with our prior report. 23 We then tested whether sarcopenia and myosteatosis had an impact on mortality in our cohort. Patients with sarcopenia trended toward reduced overall survival, when compared to patients without sarcopenia, but this did not reach statistical significance (p = 0.10) (Figure 1B). Patients with myosteatosis had significantly reduced overall survival when compared to patients without myosteatosis (p = 0.007; Figure 1C).
FIGURE 1.

Kaplan–Meier curves demonstrating overall survival of patients based on SARC‐F ≥ 4 (A), low SMI (B), or low SMD (C). (A) Kaplan–Meier curve for SARC‐F. Log‐ rank p value: <0.001. (B) Kaplan–Meier curve for sarcopenia. Log‐rank p value: 0.10. (C) Kaplan–Meier curve for myosteatosis. Log‐rank p value: 0.007.
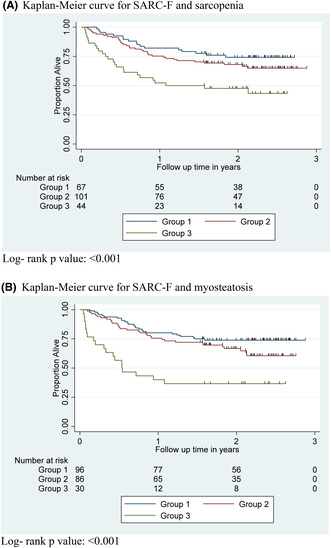
Recognizing that SARC‐F ≥ 4 was predictive of decreased overall survival, we hypothesized that the addition of SARC‐F to CT measures could provide a better stratification of survival. To test this hypothesis, we created three mutually exclusive groups based on both SARC‐F score and sarcopenia. Group 1 included patients with SARC‐F < 4 who did not have sarcopenia. Group 2 included patients with SARC‐F < 4 who had sarcopenia AND patients with SARC‐F ≥ 4 who did not have sarcopenia. Group 3 included patients with SARC‐F ≥ 4 who had sarcopenia. Patients in Group 3 had significantly decreased overall survival compared to patients in either Group 1 or Group 2 (p < 0.001; Figure 2A). Similarly, we created three mutually exclusive groups based on SARC‐F ≥ 4 and myosteatosis. Again, patients in Group 3 had significantly decreased overall survival compared to patients in either Group 1 or Group 2 (p < 0.001; Figure 2B).
FIGURE 2.

Kaplan–Meier curves demonstrating overall survival of patients based on SARC‐F score and sarcopenia (A) or SARC‐F score and myosteatosis (B). For (A), Group 1 included patients with SARC‐F < 4 who did not have sarcopenia. Group 2 included patients with SARC‐F < 4 who had sarcopenia and patients with SARC‐F ≥ 4 who did not have sarcopenia. Group 3 included patients with SARC‐F ≥ 4 who had sarcopenia. For (B), groups were organized in the same manner but were grouped based on myosteatosis, rather than sarcopenia. (A) Kaplan–Meier curve for SARC‐F and sarcopenia. Log‐ rank p value: <0.001. (B) Kaplan–Meier curve for SARC‐F and myosteatosis. Log‐rank p value: <0.001.
In order to study the independent impact of SARC‐F on overall survival, we utilized multivariable Cox proportional hazard regression models. SARC‐F remained independently predictive of overall survival (HR 3.03; 95% CI 1.83–5.02; p < 0.001) after adjusting for potential confounders including age, sex, race/ethnicity, cancer type, cancer stage, SMI, and SMD (Table 4). Inclusion of SARC‐F led to improved discrimination of our survival model (Harrel's C statistic improved from 0.73 to 0.76).
TABLE 4.
Impact of SARC‐F scores on overall survival using univariable and multivariable Cox regression models.
| SARC‐F ≥ 4 vs. SARC‐F < 4 | HR | 95% CI of HR | p value |
|---|---|---|---|
| Unadjusted | 2.24 | 1.42–3.54 | 0.001 |
| Model 1 a | 3.29 | 2.07–5.52 | <0.001 |
| Model 2 b | 3.03 | 1.83–5.02 | <0.001 |
Adjusted for age, sex, race/ethnicity, cancer type, and cancer stage.
Adjusted for age, sex, race/ethnicity, cancer type and cancer stage, as well as SMI and SMD as continuous variables.
Because cancer type can impact overall survival, we then limited analysis to high‐risk cancer types associated with decreased survival including pancreatic, hepatobiliary, and gastroesophageal cancers. 33 , 34 SARC‐F ≥ 4 was associated with worse overall survival among these cancer types (HR 4.99; CI 1.68–14.83; p = 0.004) (Table S3), after adjusting for age, sex, race/ethnicity, cancer stage, SMI, and SMD. Similarly, because cancer stage can impact overall survival, 33 we then limited analysis to Stage III and Stage IV cancers. SARC‐F ≥ 4 was associated with worse overall survival among Stage III and Stage IV cancers (HR 4.66; CI 1.92–11.33; p = 0.001) (Table S3) after adjusting for age, sex, race/ethnicity, cancer type, SMI, and SMD.
4. DISCUSSION
Our study suggests that among older adults with cancer, SARC‐F has limited diagnostic utility for identification of patients with low muscle mass and density. Interestingly, however, SARC‐F provided meaningful prognostic information above and beyond what was captured in CT‐based measurements. In particular, patients with sarcopenia and/or myosteatosis who also had an abnormal SARC‐F score had worse overall survival. To our knowledge, our study is the first to specifically evaluate the diagnostic validity of SARC‐F among older adults with cancer.
Previous studies have examined the diagnostic validity of SARC‐F among community‐dwelling older adults. For instance, Woo et al. evaluated the diagnostic validity of SARC‐F among Chinese men and women age 65 and older. Sarcopenia was measured using various working group consensus definitions, where patients were labeled sarcopenic if below thresholds for low muscle mass, strength, and/or physical performance. The authors showed that SARC‐F had sensitivity ranging from 4% to 10% and specificity ranging from 94% to 99%, depending on the definition of sarcopenia that was used. 21 Similarly, Ida et al. performed a meta‐analysis examining the validity of SARC‐F to detect sarcopenia among community‐dwelling older adults. Sarcopenia was measured using similar working group consensus definitions. They found that SARC‐F had sensitivity ranging from 14% to 21% and specificity ranging from 90% to 94%. 25 A subsequent meta‐analysis by Voelker et al. showed similar results. 35 Taken together, our findings are in overall agreement with existing literature which shows that SARC‐F has poor sensitivity but better specificity for detecting sarcopenia. One possible explanation for the low sensitivity of SARC‐F to detect sarcopenia in our study and prior studies is that SARC‐F may better capture measures of low muscle strength and/or physical performance, as opposed to elements of muscle quantity and/or quality.
The European Working Group on Sarcopenia in Older People (EWGSOP2) most recently defined sarcopenia as low muscle strength combined with low muscle quantity or quality. Low physical performance is used to label sarcopenia as severe. 36 Our study exclusively focused on low muscle mass (CT‐measured sarcopenia) and low muscle density (CT‐measured myosteatosis). Future studies are needed to investigate correlation of SARC‐F with muscle strength and/or physical performance. Our study shows that the SARC‐F questionnaire itself provides valuable prognostic information and is able to identify those older adults with low muscle mass and/or density at greatest risk of mortality. Although the mechanisms underlying this observation are unclear, we hypothesize that SARC‐F is at least partially capturing the functional components of low muscle strength and/or poor physical performance. In support of this hypothesis, SARC‐F is inversely associated with objective measures in strength and physical performance, including reductions in grip strength and gait speed as well as increases in the Timed Up and Go (TUG) Test and 5 chair stand test. 37 , 38 , 39 , 40 , 41
Of note, myosteatosis but not sarcopenia was significantly associated with decreased overall survival in our study. This is consistent with prior studies demonstrating that muscle quality, rather than muscle quantity, may better predict mortality, presumably because of its closer association with physical function. For instance, the Health ABC study demonstrated poor correlation of muscle size, but good correlation of muscle strength, with all‐cause mortality. 42 In a population of older adults with cancer, SMD has been shown to better correlate with physical function impairments, as compared to SMI. 13
Our study also has several limitations. Data were collected from a single institution in the southeastern United States with predominantly gastrointestinal malignancies and may not be readily generalizable to other populations. Our assessment of sarcopenia was based on CT measurement of muscle mass alone. There is an emerging consensus that the diagnosis of sarcopenia requires demonstration of impaired muscle function/physical performance as well, 36 which was not measured in our study. We used pre‐published SMI/SMD thresholds to define patients with low muscle mass or density. In reality, these values are on a continuum, and there is no universal consensus on what constitutes a low SMI/SMD. We had limited information about the type of treatment received which may have biased our results. Our study is also limited by small sample size, with a limiting factor being the number of patients who completed the SARC‐F portion of the CARE GA. In particular, we had fairly limited number of patients across multiple cancer types. While our time to event models included cancer type and cancer stage as potential confounders, inclusion of multiple cancer types with few patients may have led to residual confounding and limited statistical power by increasing the number of parameters in the model. As such, we believe future studies are needed to verify our findings in larger and more homogenous cohorts of patients.
In conclusion, our study adds to the body of literature suggesting that SARC‐F has limited diagnostic validity as a sarcopenia screening tool yet can be a useful tool providing valuable prognostic information among older adults with cancer. Future studies should investigate the association of SARC‐F with performance‐based measures of muscle function to better understand its utility in the evaluation of older adults with cancer.
AUTHOR CONTRIBUTIONS
Daniel L. Hess: Conceptualization (equal); data curation (equal); investigation (equal); methodology (equal); visualization (equal); writing – original draft (lead); writing – review and editing (equal). Christian Harmon: Data curation (lead); methodology (equal); resources (equal); software (equal); writing – review and editing (equal). Smita Bhatia: Conceptualization (equal); project administration (equal); supervision (equal); writing – review and editing (equal). Grant R. Williams: Conceptualization (equal); data curation (equal); funding acquisition (equal); investigation (equal); methodology (equal); project administration (equal); writing – original draft (equal); writing – review and editing (equal). Smith Giri: Conceptualization (equal); data curation (equal); formal analysis (lead); funding acquisition (equal); investigation (equal); methodology (equal); project administration (equal); writing – original draft (equal); writing – review and editing (equal).
FUNDING INFORMATION
Supported in part by the Walter B. Frommeyer Fellowship in Investigative Medicine at the University of Alabama at Birmingham and the National Cancer Institute of the National Institutes of Health (K08CA234225). The content is solely the responsibility of the authors and does not necessarily represent the official views of the National Institutes of Health.
CONFLICT OF INTEREST STATEMENT
The authors have no current or potential conflicts of interest to disclose.
ETHICS STATEMENT
All authors comply with the ethical guidelines for authorship and publication in cancer.
Supporting information
Data S1. Supporting Information
ACKNOWLEDGEMENTS
The authors would like to acknowledge and thank the patients who agreed to participate in the CARE study. This work is supported in part by the Walter B. Frommeyer Fellowship in Investigative Medicine at the University of Alabama at Birmingham and the National Cancer Institute of the National Institutes of Health (K08CA234225). The content is solely the responsibility of the authors and does not necessarily represent the official views of the National Institutes of Health.
Hess DL, Harmon C, Bhatia S, Williams GR, Giri S. SARC‐F as a screening tool to detect computed tomography‐based sarcopenia and myosteatosis among older adults with cancer. Cancer Med. 2023;12:20690‐20698. doi: 10.1002/cam4.6599
Presented in an abstract form at the International Society of Geriatric Oncology Annual Meeting, October 2022.
DATA AVAILABILITY STATEMENT
All data will be made available upon request after publication of the article.
REFERENCES
- 1. Surveillance Epidemiology and End Results (SEER) program. http://seer.cancer.gov/%0Dfaststats/index.php. Accessed 11 September 2022
- 2. Correa‐de‐Araujo R, Addison O, Miljkovic I, et al. Myosteatosis in the context of skeletal muscle function deficit: an interdisciplinary workshop at the National Institute on Aging. Front Physiol. 2020;11:1‐18. [DOI] [PMC free article] [PubMed] [Google Scholar]
- 3. Williams GR, Rier HN, McDonald A, Shachar SS. Sarcopenia & aging in cancer. J Geriatr Oncol. 2019;10:374‐377. [DOI] [PMC free article] [PubMed] [Google Scholar]
- 4. Aleixo GFP, Shachar SS, Nyrop KA, Muss HB, Malpica L, Williams GR. Myosteatosis and prognosis in cancer: systematic review and meta‐analysis. Crit Rev Oncol Hematol. 2020;145:102839. [DOI] [PubMed] [Google Scholar]
- 5. Williams GR, Chen Y, Kenzik KM, et al. Assessment of sarcopenia measures, survival, and disability in older adults before and after diagnosis with cancer. JAMA Netw Open. 2020;3:e204783. [DOI] [PMC free article] [PubMed] [Google Scholar]
- 6. Shachar SS, Williams GR, Muss HB, Nishijima TF. Prognostic value of sarcopenia in adults with solid tumours: a meta‐analysis and systematic review. Eur J Cancer. 2016;57:58‐67. [DOI] [PubMed] [Google Scholar]
- 7. Rier HN, Jager A, Sleijfer S, Maier AB, Levin M‐D. The prevalence and prognostic value of low muscle mass in cancer patients: a review of the literature. Oncologist. 2016;21:1396‐1409. [DOI] [PMC free article] [PubMed] [Google Scholar]
- 8. Kazemi‐Bajestani SMR, Mazurak VC, Baracos V. Computed tomography‐defined muscle and fat wasting are associated with cancer clinical outcomes. Semin Cell Dev Biol. 2016;54:2‐10. [DOI] [PubMed] [Google Scholar]
- 9. Xia L, Zhao R, Wan Q, et al. Sarcopenia and adverse health‐related outcomes: an umbrella review of meta‐analyses of observational studies. Cancer Med. 2020;9:7964‐7978. [DOI] [PMC free article] [PubMed] [Google Scholar]
- 10. Dunne RF, Roussel B, Culakova E, et al. Characterizing cancer cachexia in the geriatric oncology population. J Geriatr Oncol. 2019;10:415‐419. [DOI] [PMC free article] [PubMed] [Google Scholar]
- 11. Broughman JR, Williams GR, Deal AM, et al. Prevalence of sarcopenia in older patients with colorectal cancer. J Geriatr Oncol. 2015;6:442‐445. [DOI] [PMC free article] [PubMed] [Google Scholar]
- 12. Williams GR, Dunne RF, Giri S, Shachar SS, Caan BJ. Sarcopenia in the older adult with cancer. J Clin Oncol. 2021;39:2068‐2078. [DOI] [PMC free article] [PubMed] [Google Scholar]
- 13. Williams GR, Deal AM, Muss HB, et al. Skeletal muscle measures and physical function in older adults with cancer: sarcopenia or myopenia? Oncotarget. 2017;8:33658‐33665. [DOI] [PMC free article] [PubMed] [Google Scholar]
- 14. Sjøblom B, Grønberg BH, Wentzel‐Larsen T, et al. Skeletal muscle radiodensity is prognostic for survival in patients with advanced non‐small cell lung cancer. Clin Nutr. 2016;35:1386‐1393. [DOI] [PubMed] [Google Scholar]
- 15. Van der Werf A, Langius JAE, De Van Der Schueren MAE, et al. Percentiles for skeletal muscle index, area and radiation attenuation based on computed tomography imaging in a healthy Caucasian population. Eur J Clin Nutr. 2018;72:288‐296. [DOI] [PMC free article] [PubMed] [Google Scholar]
- 16. Derstine BA, Holcombe SA, Ross BE, Wang NC, Su GL, Wang SC. Skeletal muscle cutoff values for sarcopenia diagnosis using T10 to L5 measurements in a healthy US population. Sci Rep. 2018;8:1‐8. [DOI] [PMC free article] [PubMed] [Google Scholar]
- 17. Martin L, Birdsell L, MacDonald N, et al. Cancer cachexia in the age of obesity: skeletal muscle depletion is a powerful prognostic factor, independent of body mass index. J Clin Oncol. 2013;31:1539‐1547. [DOI] [PubMed] [Google Scholar]
- 18. Malmstrom TKMJ. Sarcopenia: the target population. J Frailty Aging. 2013;2:e56. [DOI] [PubMed] [Google Scholar]
- 19. Malmstrom TK, Morley JE. SARC‐F: A simple questionnaire to rapidly diagnose sarcopenia. J Am Med Dir Assoc. 2013;14:531‐532. [DOI] [PubMed] [Google Scholar]
- 20. Malmstrom TK, Miller DK, Simonsick EM, Ferrucci L, Morley JE. SARC‐F: a symptom score to predict persons with sarcopenia at risk for poor functional outcomes. J Cachexia Sarcopenia Muscle. 2016;7:28‐36. [DOI] [PMC free article] [PubMed] [Google Scholar]
- 21. Woo J, Leung J, Morley JE. Validating the SARC‐F: a suitable community screening tool for sarcopenia? J Am Med Dir Assoc. 2014;15:630‐634. [DOI] [PubMed] [Google Scholar]
- 22. Bahat G, Yilmaz O, Kiliç C, Oren MM, Karan MA. Performance of SARC‐F in regard to sarcopenia definitions, muscle mass and functional measures. J Nutr Heal Aging. 2018;22:898‐903. [DOI] [PubMed] [Google Scholar]
- 23. Williams GR, Al‐Obaidi M, Dai C, Bhatia S, Giri S. SARC‐F for screening of sarcopenia among older adults with cancer. Cancer. 2021;127:1469‐1475. [DOI] [PMC free article] [PubMed] [Google Scholar]
- 24. Williams GR, Kenzik KM, Parman M, et al. Integrating geriatric assessment into routine gastrointestinal (GI) consultation: The Cancer And Aging Resilience Evaluation (CARE). J Geriatr Oncol. 2020;11:270‐273. [DOI] [PMC free article] [PubMed] [Google Scholar]
- 25. Ida S, Kaneko R, Murata K. SARC‐F for screening of sarcopenia among older adults: a meta‐analysis of screening test accuracy. J Am Med Dir Assoc. 2018;19:685‐689. [DOI] [PubMed] [Google Scholar]
- 26. Shen W, Punyanitya M, Wang ZM, et al. Total body skeletal muscle and adipose tissue volumes: estimation from a single abdominal cross‐sectional image. J Appl Physiol. 2004;97:2333‐2338. [DOI] [PubMed] [Google Scholar]
- 27. Mourtzakis M, Prado CMM, Lieffers JR, Reiman T, McCargar LJ, Baracos VE. A practical and precise approach to quantification of body composition in cancer patients using computed tomography images acquired during routine care. Appl Physiol Nutr Metab. 2008;33:997‐1006. [DOI] [PubMed] [Google Scholar]
- 28. Anyene I, Caan B, Williams GR, et al. Body composition from single versus multi‐slice abdominal computed tomography: concordance and associations with colorectal cancer survival. J Cachexia Sarcopenia Muscle. 2022;13:2974‐2984. doi: 10.1002/jcsm.13080 [DOI] [PMC free article] [PubMed] [Google Scholar]
- 29. Aubrey J, Esfandiari N, Baracos VE, et al. Measurement of skeletal muscle radiation attenuation and basis of its biological variation. Acta Physiol. 2014;210:489‐497. [DOI] [PMC free article] [PubMed] [Google Scholar]
- 30. Machann J, Bachmann OP, Brechtel K, et al. Lipid content in the musculature of the lower leg assessed by fat selective MRI: intra‐ and interindividual differences and correlation with anthropometric and metabolic data. J Magn Reson Imaging. 2003;17:350‐357. [DOI] [PubMed] [Google Scholar]
- 31. Larson‐Meyer DE, Smith SR, Heilbronn LK, Kelley DE, Ravussin E, Newcomer BR. Muscle‐associated triglyceride measured by computed tomography and magnetic resonance spectroscopy. Obesity. 2006;14:73‐87. [DOI] [PMC free article] [PubMed] [Google Scholar]
- 32. Youden WJ. Index for rating diagnostic tests. Cancer. 1950;3:32‐35. [DOI] [PubMed] [Google Scholar]
- 33. Williams GR, Dai C, Giri S, et al. Geriatric assessment predictors of 1‐year mortality in older adults with GI malignancies: a survival tree analysis. JCO Clin Cancer Inform. 2022;6:e2200065. doi: 10.1200/cci.22.00065 [DOI] [PMC free article] [PubMed] [Google Scholar]
- 34. Siegel RL, Wagle NS, Cercek A, Smith RA, Jemal A. Colorectal cancer statistics. CA Cancer J Clin. 2023;2023:233‐254. [DOI] [PubMed] [Google Scholar]
- 35. Voelker SN, Michalopoulos N, Maier AB, Reijnierse EM. Reliability and concurrent validity of the SARC‐F and its modified versions: a systematic review and meta‐analysis. J Am Med Dir Assoc. 2021;22:1864‐1876.e16. [DOI] [PubMed] [Google Scholar]
- 36. Cruz‐Jentoft AJ, Bahat G, Bauer J, et al. Sarcopenia: revised European consensus on definition and diagnosis. Age Ageing. 2019;48:16‐31. [DOI] [PMC free article] [PubMed] [Google Scholar]
- 37. Wu TY, Liaw CK, Chen FC, Kuo KL, Chie WC, Sen YR. Sarcopenia screened with SARC‐F questionnaire is associated with quality of life and 4‐year mortality. J Am Med Dir Assoc. 2016;17:1129‐1135. [DOI] [PubMed] [Google Scholar]
- 38. Cao L, Chen S, Zou C, et al. A pilot study of the SARC‐F scale on screening sarcopenia and physical disability in the Chinese older people. J Nutr Health Aging. 2014;18:277‐283. [DOI] [PubMed] [Google Scholar]
- 39. Dodds RM, Murray JC, Granic A, et al. Prevalence and factors associated with poor performance in the 5‐chair stand test: findings from the Cognitive Function And Ageing Study II and proposed Newcastle protocol for use in the assessment of sarcopenia. J Cachexia Sarcopenia Muscle. 2021;12:308‐318. [DOI] [PMC free article] [PubMed] [Google Scholar]
- 40. Marini ACB, Perez DRS, Fleuri JA, Pimentel GD. SARC‐F is better correlated with muscle function indicators than muscle mass in older hemodialysis patients. J Nutr Heal Aging. 2020;24:999‐1002. [DOI] [PubMed] [Google Scholar]
- 41. Keogh JWL, Henwood T, Gardiner PA, et al. Sarc‐F and muscle function in community dwelling adults with aged care service needs: baseline and post‐training relationship. PeerJ. 2019;2019:1‐19. [DOI] [PMC free article] [PubMed] [Google Scholar]
- 42. Newman AB, Kupelian V, Visser M, et al. Strength, but not muscle mass, is associated with mortality in the health, aging and body composition study cohort. J Gerontol A Biol Sci Med Sci. 2006;61:72‐77. [DOI] [PubMed] [Google Scholar]
Associated Data
This section collects any data citations, data availability statements, or supplementary materials included in this article.
Supplementary Materials
Data S1. Supporting Information
Data Availability Statement
All data will be made available upon request after publication of the article.